1. Introduction
The vital activity of modern society and a man is inseparably linked with the use of plastic products, which are products of the petrochemical industry. One of the most important products in the plastics industry is styrene, for which ethylbenzene (EB) is used.
EB is also widely used in the production of rubbers, as a solvent and a component of high-octane gasolines. Therefore, the capacities for the production of EB are constantly growing. If the world produced 18,800,000 t. in 1976 [
1], then in 2014, 47,000,000 t. were produced [
2]. Increasing competition and stricter environmental standards in developed countries are forcing petrochemical companies to look for ways to reduce operating costs and improve energy and environmental efficiency.
Several technologies were developed to reduce the cost of EB production at the end of the twentieth century. It is the liquid-phase reactive distillation technology [
3], the rectification-based technology using new catalysts with high selectivity and low fouling [
4]. A little later, high-intensity two-reactor units for the production of EB [
2], and the process for the production of EB in the adjacent gas-liquid phase [
5] were developed. Ebrahimi et al. proposed a multi-reactor technological scheme for the production of EB with high selectivity [
6]. The work [
7] presents an intensified process in a two-column reactor with recycling.
Analysis of the literature data shows that most of the studies aimed at reducing cost in the production of EB are associated with a change and intensification of the process of production of EB itself. However, for working industries, it is interesting to solve another problem. This is a cost reduction in the production of EB without significant changes in the process itself.
Given directing is based on heat integration methods of processes, and, in particular, the Pinch methodology [
8], which has been successfully applied to reduce specific energy consumption and decrease emissions at operating enterprises of processing industries. The use of this methodology for optimizing the HEN of coal tar processing processes [
9] made it possible to reduce the specific energy consumption by 24%, at the light hydrocarbon separation unit by 52% [
10]. The development of Pinch analysis methods for performing the reconstruction of HEN in the presence of strict restrictions enabled to reduce specific energy consumption by 26% at the crude oil refining unit, taking into account the existing economic, technical and technological limitations [
11]. Wong et al. examined the reliability of heat exchangers in crude oil heating processes when developing new HEN [
12]. Nianqi Li et al. examined the potential for the application of the target-evaluation method for HEN retrofit with the consideration of the thermal efficiency [
13].
In the work [
14] it is shown that, in the process of EB production under study, it is possible to reduce the specific energy consumption by 5.6% using the classical methods of Pinch analysis. This value is stipulated by the structure of existing compound curves. The difficulty in reducing energy consumption in the EB production is that because of the special structure of the composite curves, a decrease in the driving force of heat transfer does not allow to achieve the significant energy savings.
The energy efficiency of chemical process systems can be significantly improved by integrating heat pumps. The use of a heat pump scheme to increase the heat energy recuperation capacity in dairy production made it possible to reduce energy consumption by ~1 MW with a payback period of the reconstruction project of about 10 months [
15]. The works [
16] show the energy-efficient integration of a
HP into the titanium tetrachloride purification process.
The work [
17] compares the efficiency of classical Pinch integration and deep integration with the use of
HP for an oil refinery. It is shown that the greatest economic efficiency is achieved when integrating the
HP into the Pinch-integrated process. In the work [
18] an algorithm for choosing the integration of
HP for multicomponent and binary mixtures, depending on the process parameters, is presented. Gai et al. [
19] emphasized the importance of choosing the correct HP type for the thermal requirement of each application and conducted a comparative evaluation of the performance of the Heat Integration scenarios of different HP types (vapor compression heat pump, transcritical heat pumps and Joule cycle heat pump) and processes, by applying the Petro-SIM process simulator and Pinch analysis. The criterion exergy loss per total capital investment representing the COP in exergy per total annual cost was proposed by Wang et al. [
20] to select HPs based on their thermodynamic and economic performance. Yang et al. [
21] combined Pinch analysis and simulation-based targeting for placement of
HPs in heat exchanger networks.
Jana shows that the integration of a
HP with a distillation column saves more than 50% of the energy consumed in a traditional scheme [
22]. Afterwards, Jana examined the vapor recompression mechanism between the side stream and the reboiler drum of a dividing wall column [
23].
Li et al. [
24] considered two options for
HP integration, both processes work well with operating cost savings, and they were economical for separating the ethanol/acetonitrile binary azeotrope.
The economic efficiency of
HP integration for various cases is investigated in the work of Schlosser et al. [
25].
Despite the significant spread of ethylbenzene production, the use of
HP integration in these units is practically not described in the literature. Only in the work [
26] is the analysis of four different grassroots projects with different
HP schemes given. There are no methods for reconstruction of EB production units using
HP circuits in the literature.
Therefore, in this work, heat integration of an ethylbenzene production unit using steam from a HP with a recompression circuit is carried out, and the features of installing a HP at a production site are described in detail. The article provides a description of the design solution and the implementation features on the production site. The economic indicators of the HP integration project have been determined.
2. Methods
The analysis of scientific studies has shown that the most suitable method for improving the energy efficiency of recuperative heat exchange systems at oil refining and petrochemical plants is the Pinch analysis method.
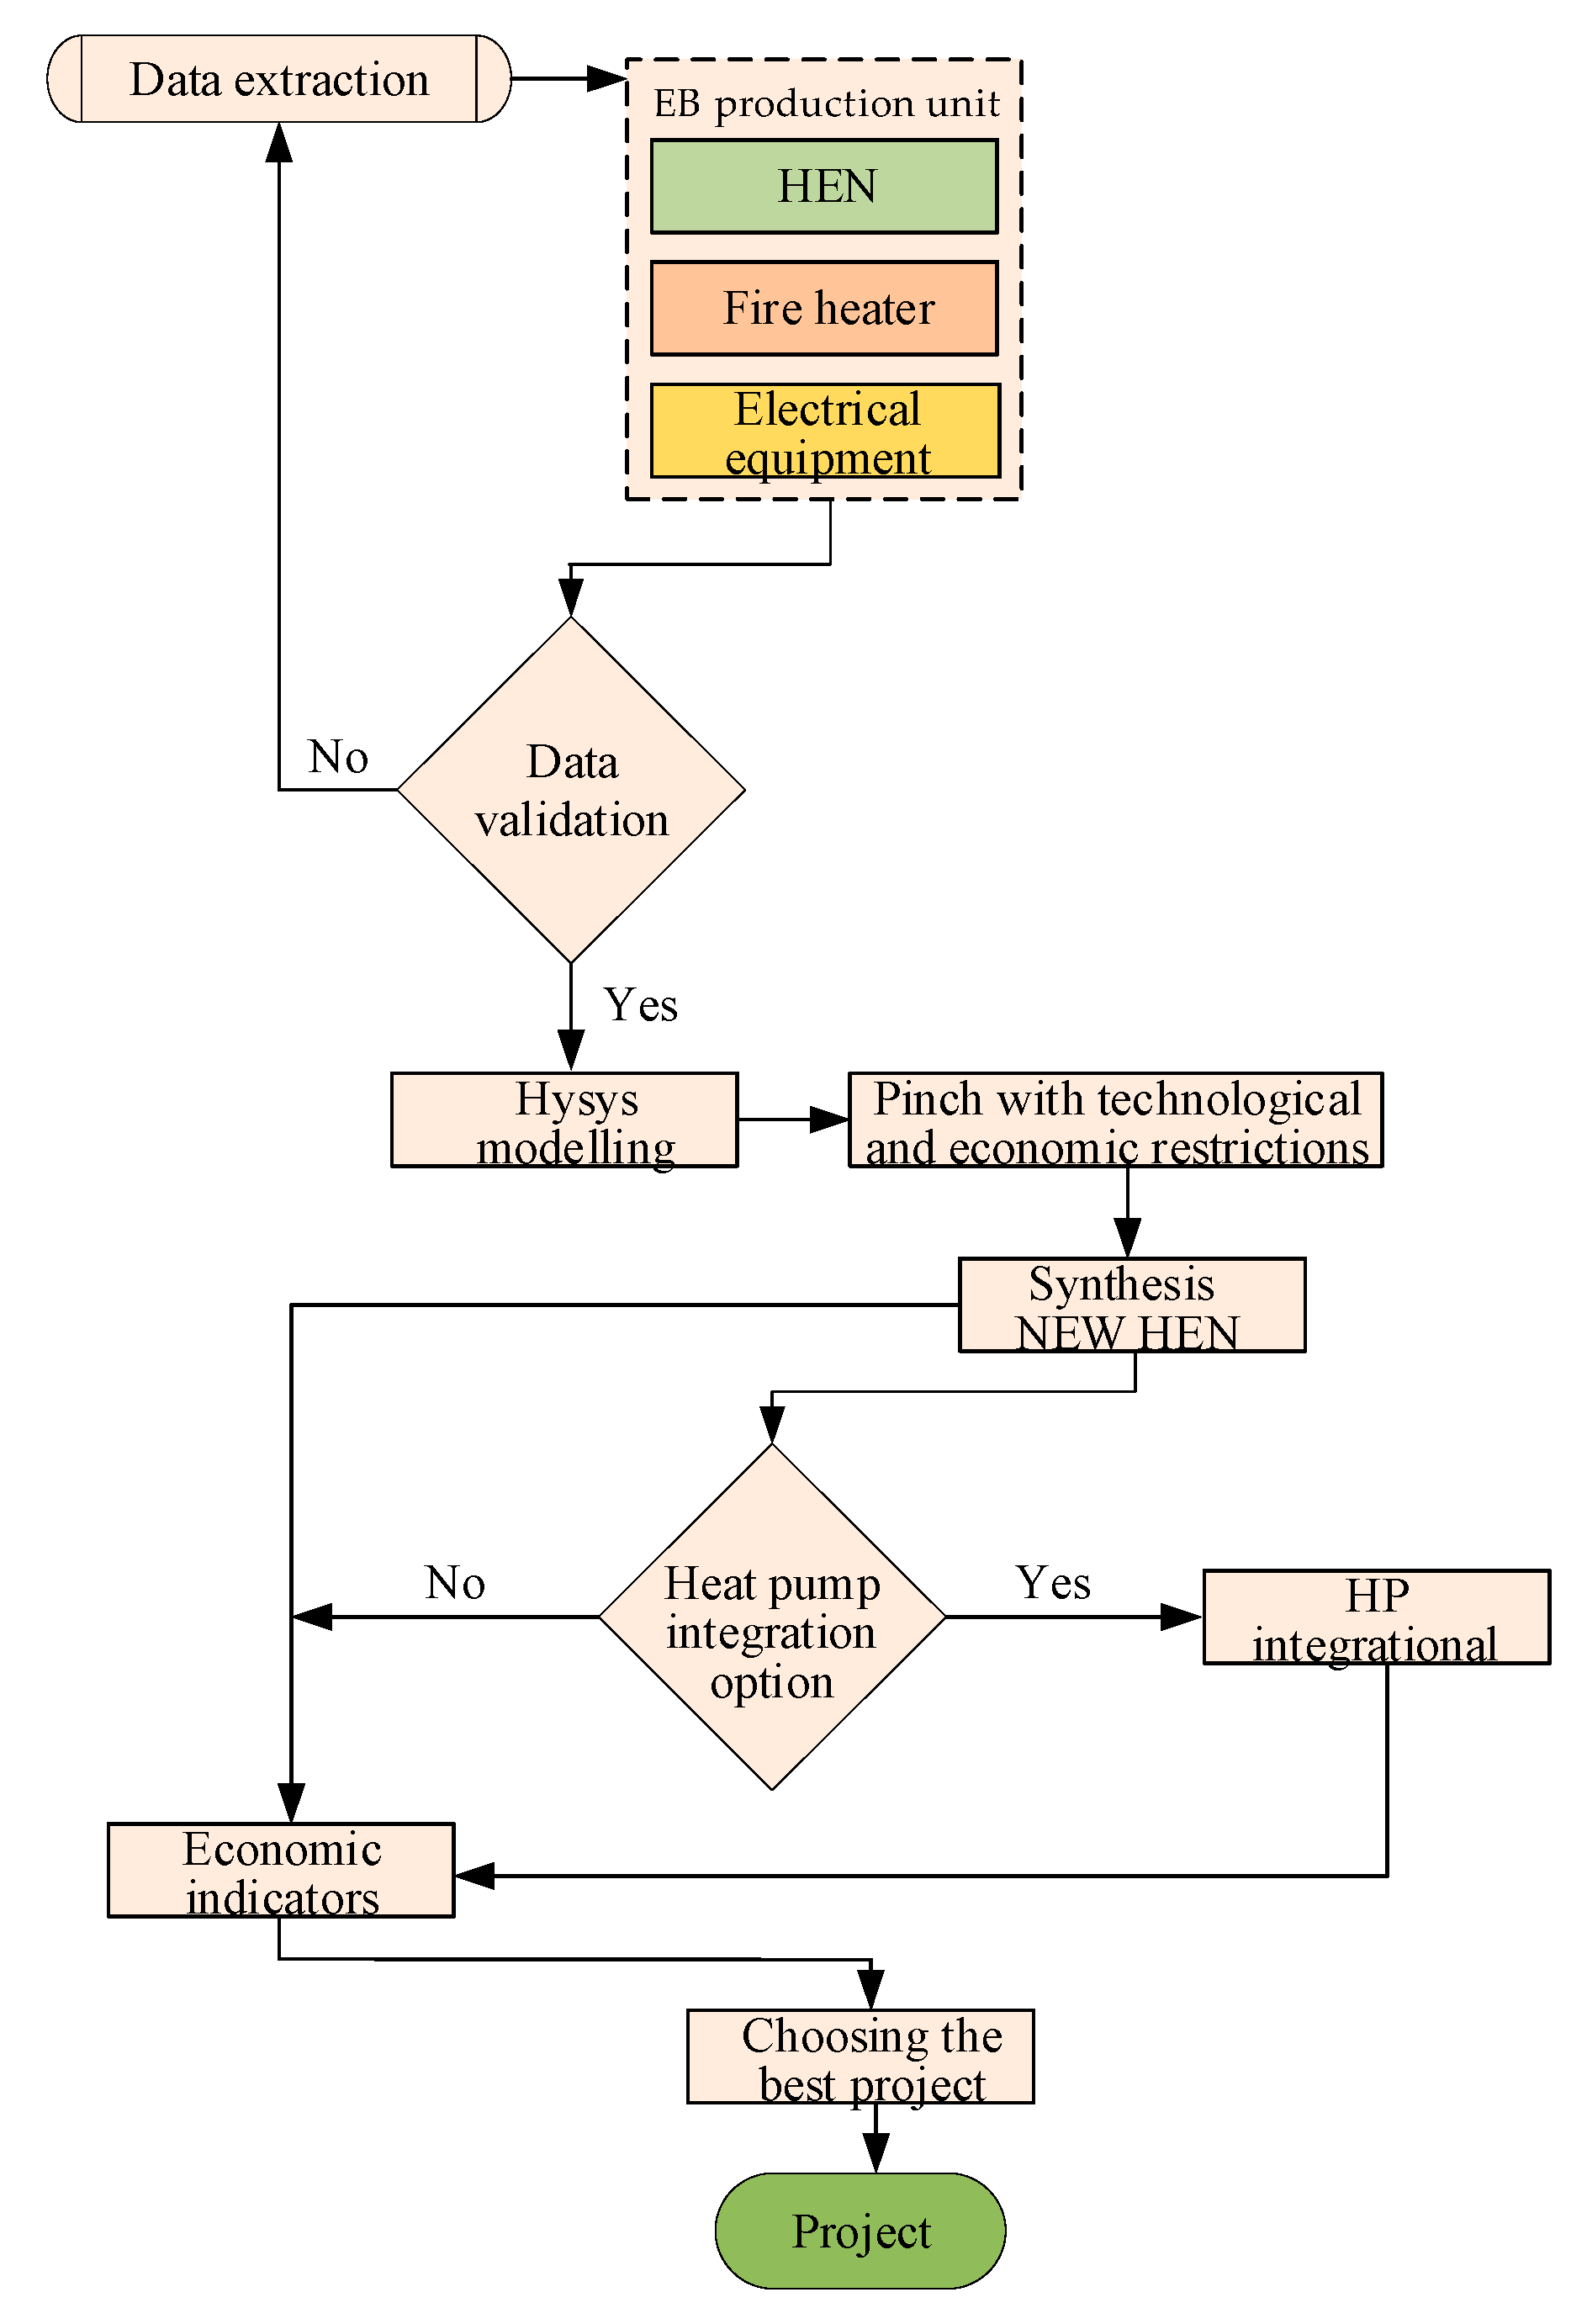
This paper presents an algorithm for making decisions about choosing the optimal project for the reconstruction of ethylbenzene production, taking into account various economic background (
Figure 1).
The first step was the collection and processing of the initial data, then the obtained data was verified on the basis of statistical processing and data from the production process. On the basis of the verified data, a computer model of the process under study was made. The computer model allowed us to clarify the missing data, in particular, the thermophysical properties of process flows. Hysys, UniSim design, or similar programs were used for computer modeling. Based on the data obtained from the simulation, the Pinch was analyzed and a new HEN was synthesized. The next step was to determine the potential of the heat pump integration with new HEN. To do this the GCC tool was used. The final stage of the algorithm is to calculate the economic efficiency of the project and select the optimal project based on the specified optimal criteria (the highest NPV, the lowest DPP, and other).
The method for improving the energy efficiency of ethylbenzene production based on the method of Pinch analysis and heat pump integration is developed. The method shows the ways of optimal placement of the heat pump in the flowsheet of ethylbenzene production, depending on the economic prerequisites of planning, this allows to choose the optimal project from the point of view of economic efficiency at the design stage of the new HEN.
3. Description of the EB Production Process
In this paper, we consider an enterprise where the synthesis of EB is carried out with the help of the method of alkylation of benzene with ethylene in the presence of a complex compound of aluminum chloride, alkylaromatic hydrocarbons and hydrogen chloride. The benzene alkylation process is carried out at the temperature of 110–135 °C and at the pressure of 0.5–2.0 kgf/cm2. In addition to the main reaction, a number of side reactions occur with the production of polyalkylbenzenes (di, tri, tetra-ethylbenzene). As a result of the reaction of alkylation and transalkylation, a thermodynamic equilibrium composition of the reaction products is established. The selectivity of the process and the quality of marketable products do not change with a change in temperature in the specified range.
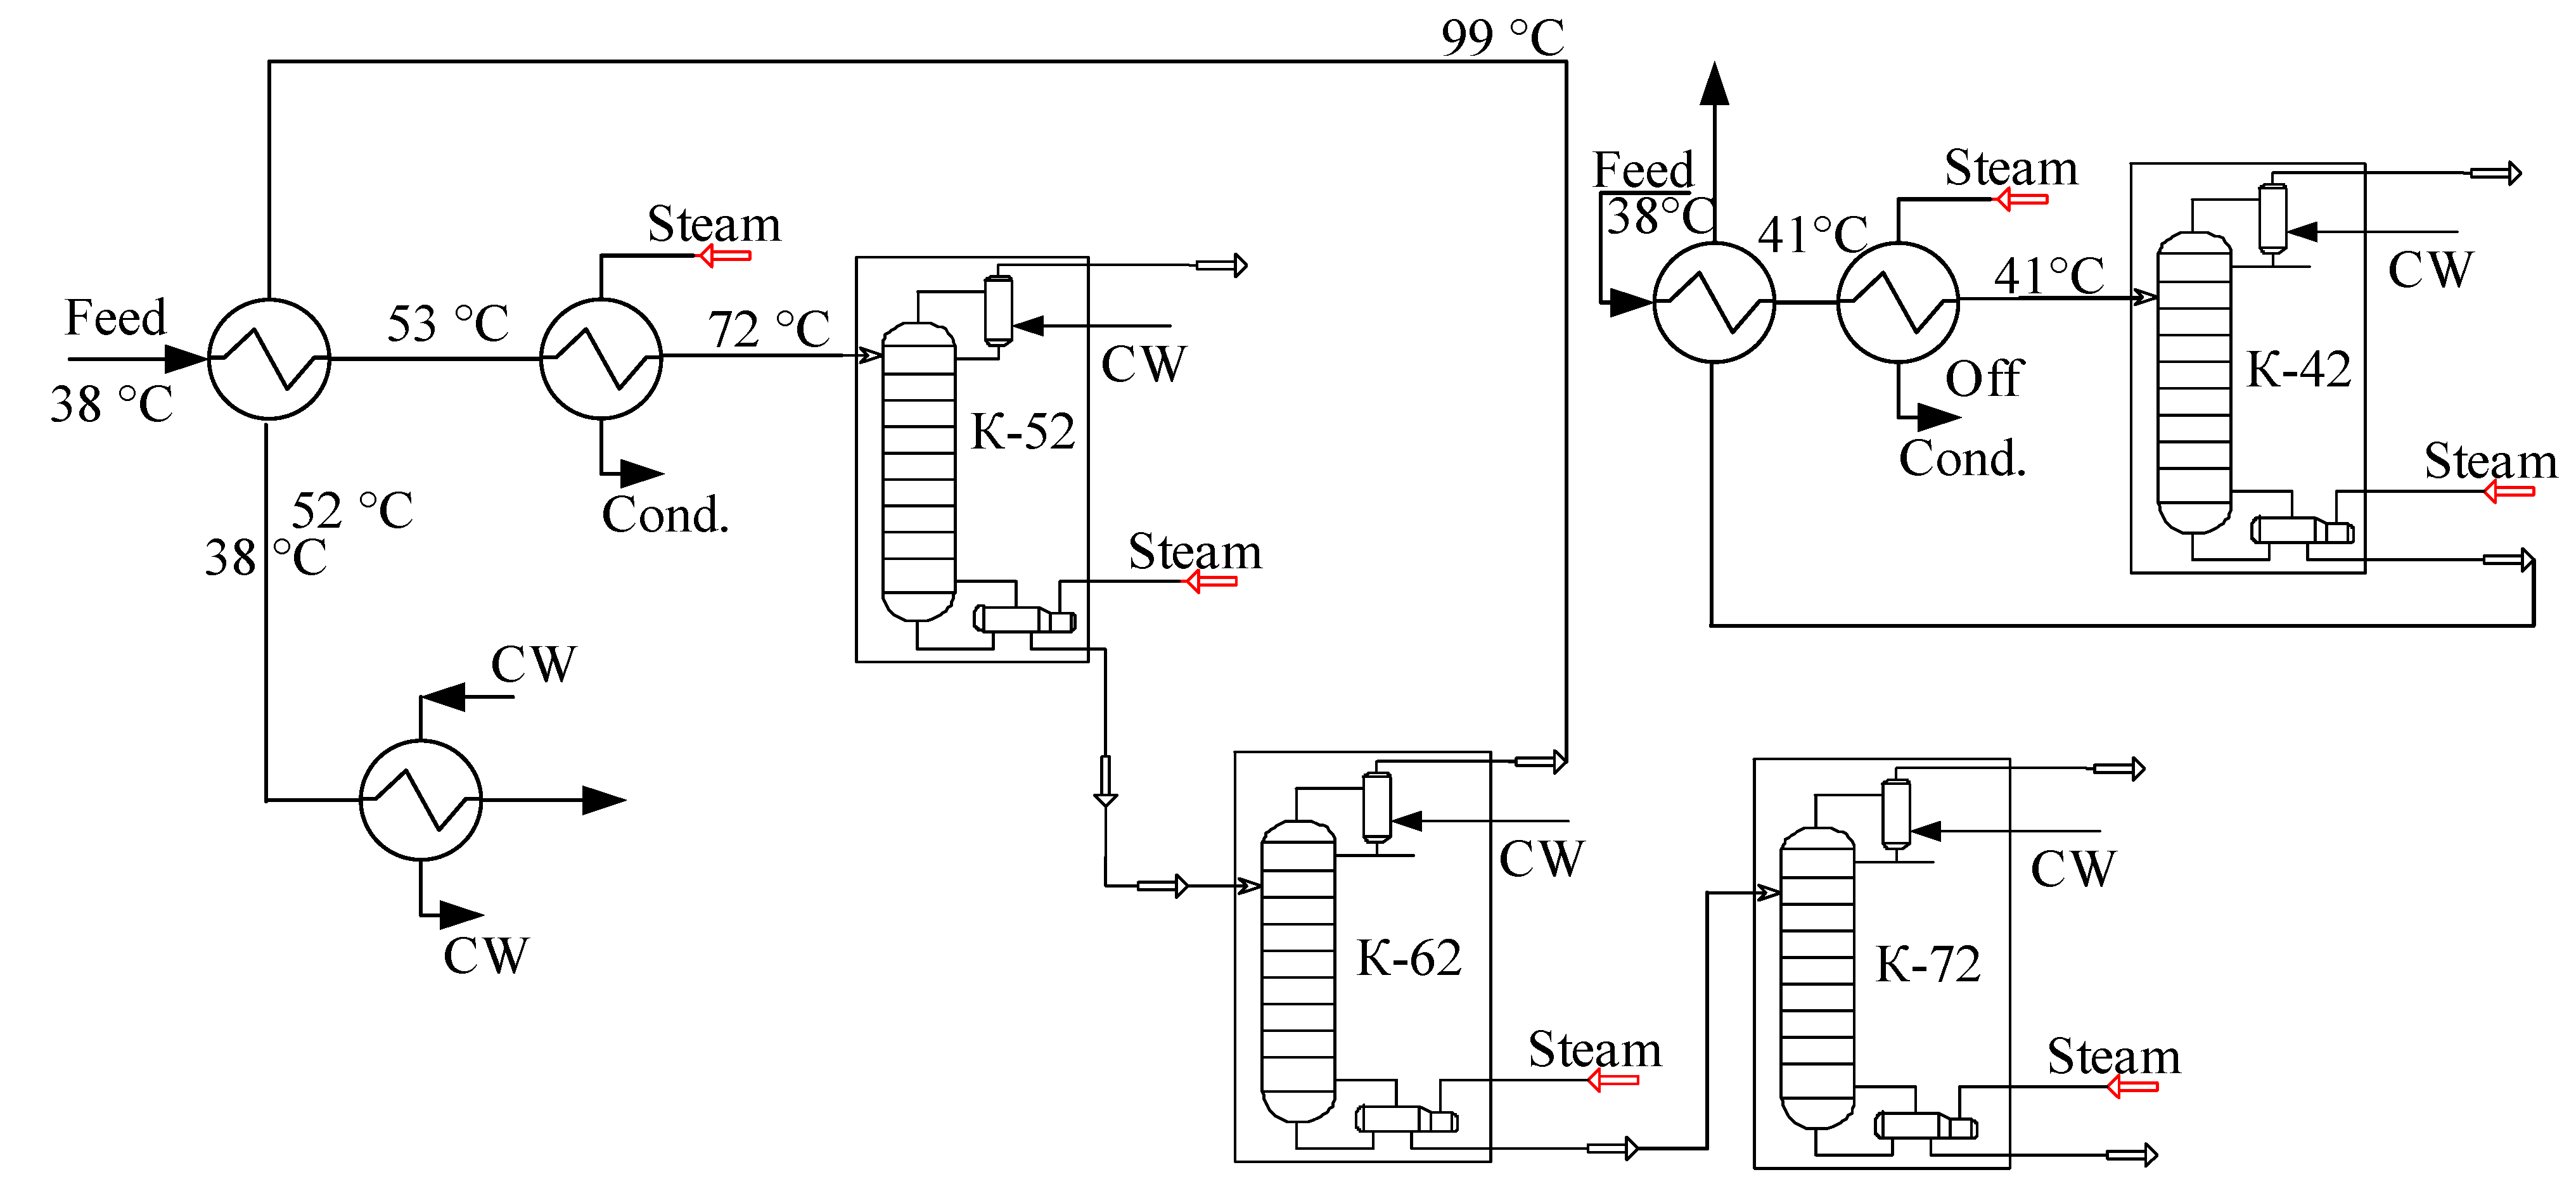
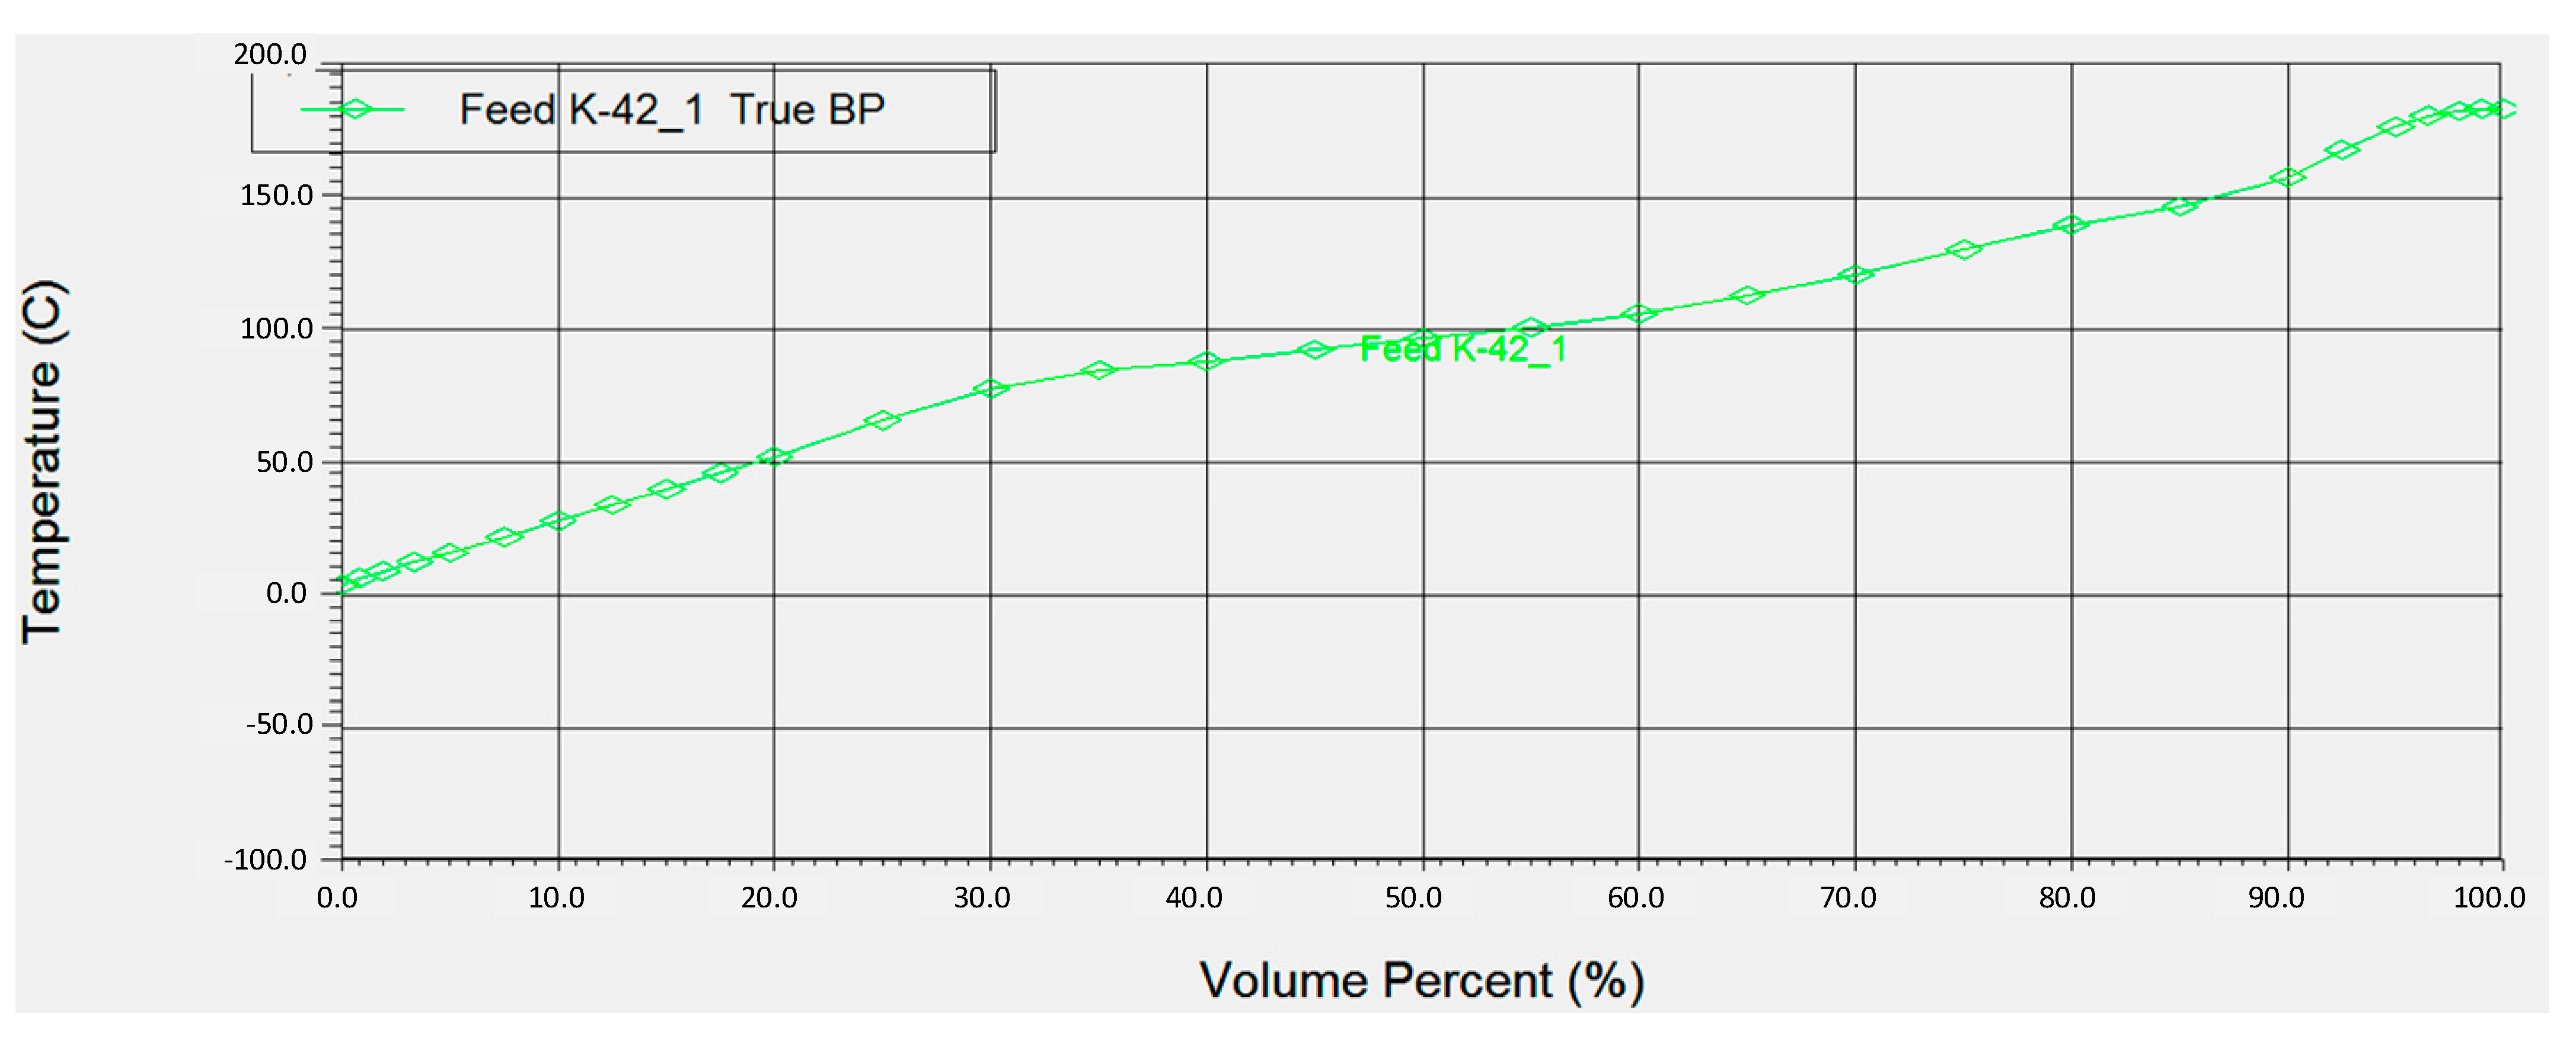
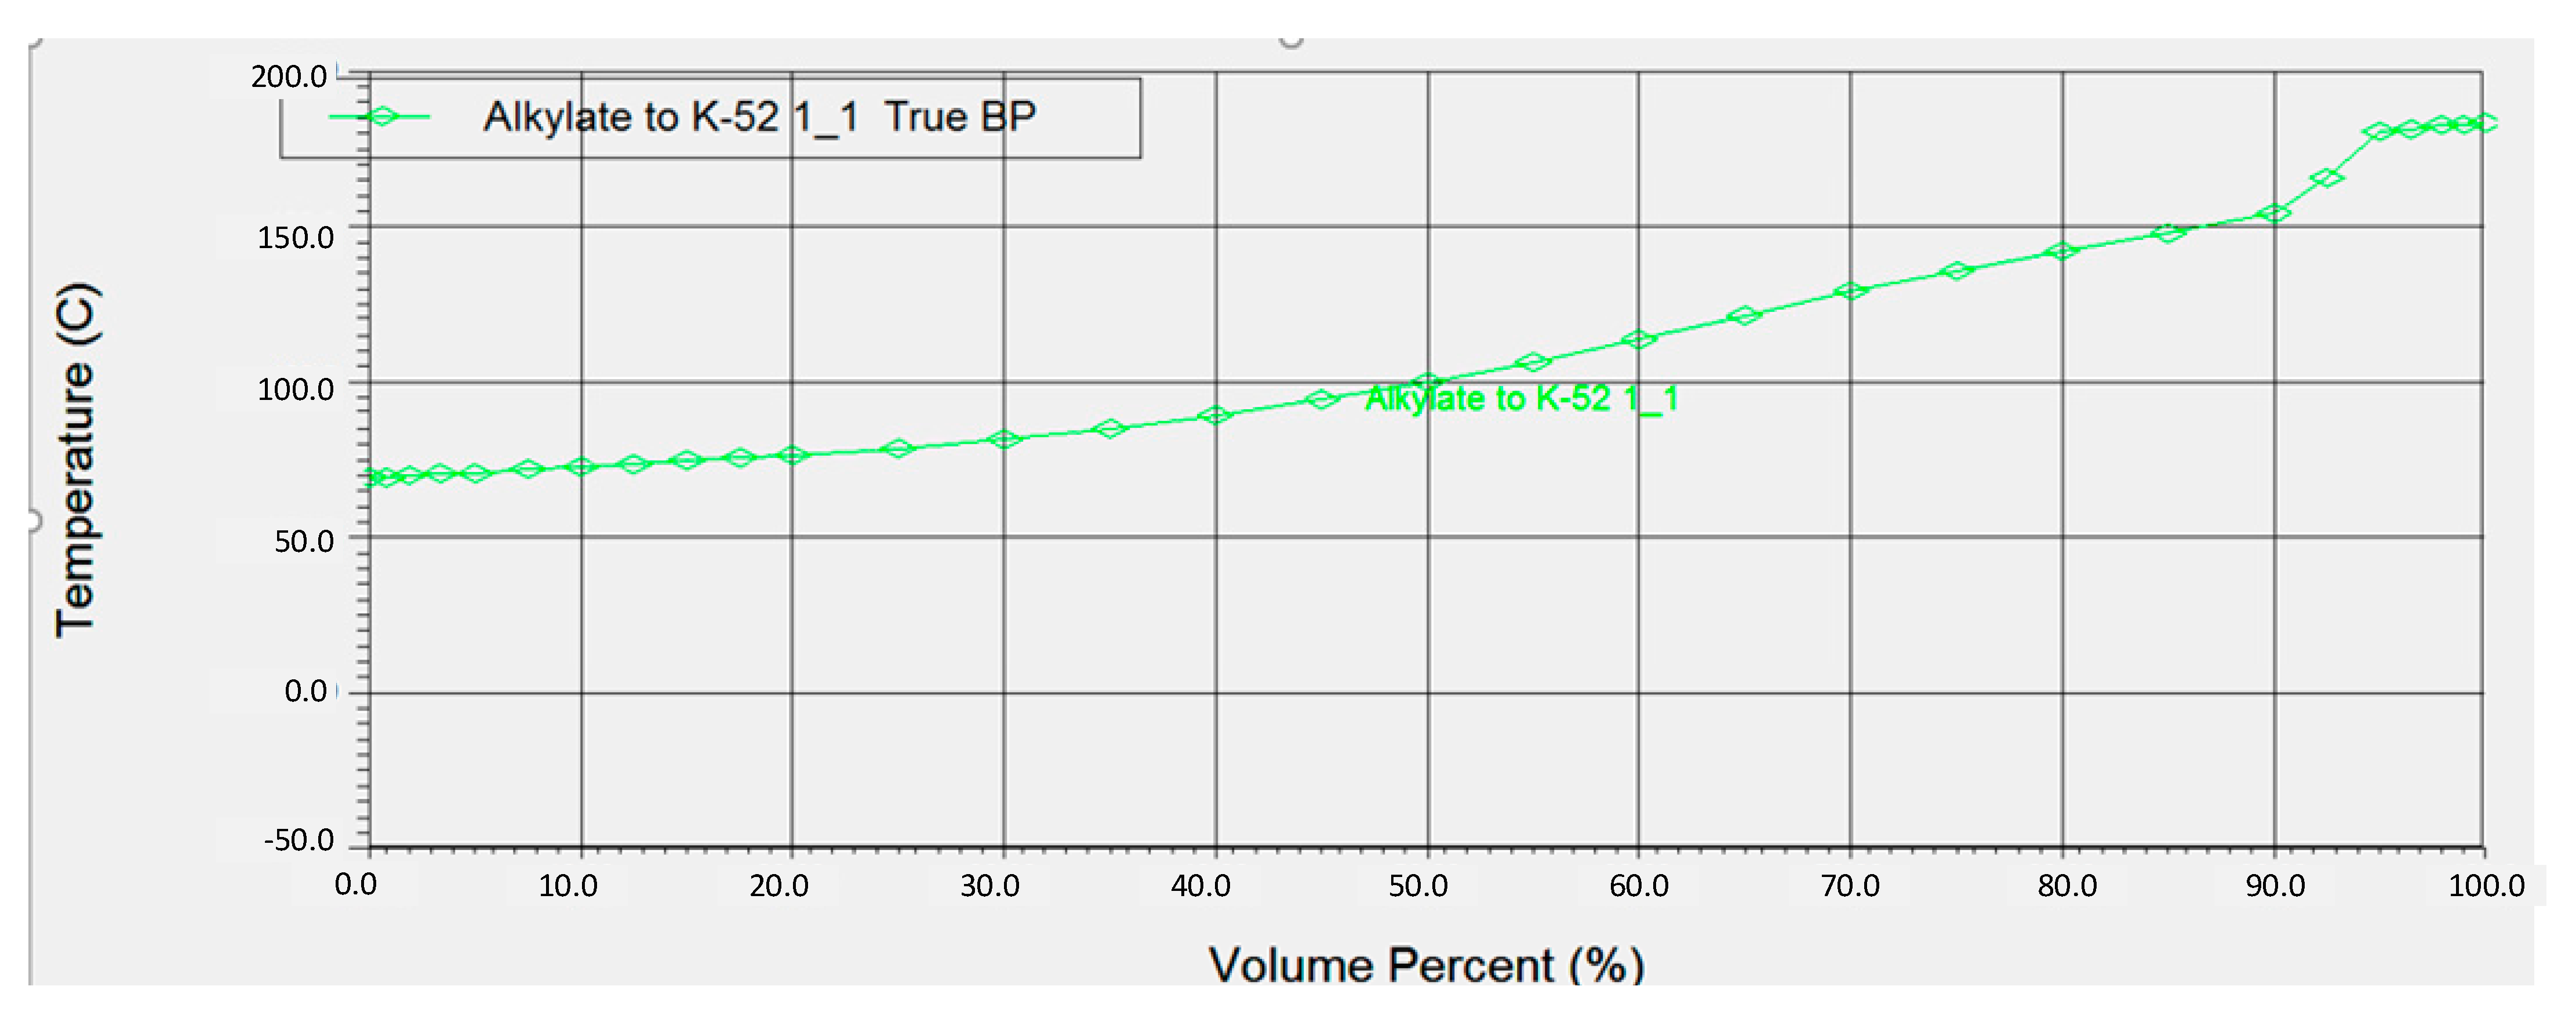
EB production capacity is 55,000 t/y. Dried benzene from the K-42 still (
Figure 2) is mixed with the streams of other units and fed as raw material to the K-52 column. The main product, which is made at the unit, is EB (K-62 distillate).
In the course of the EB production unit technological inspection, the operating parameters of the unit were obtained—costs, composition of raw materials and products—using thermal imaging and stationary devices, and the temperatures of technological streams were measured.
Based on the analysis of the operating schedule of the EB production unit and the data collected during the study, a computer model was built in the Aspen Hysys V11 program, Peng-Robinson thermodynamic fluid package. Basic information about the computer model is presented in
Appendix A.
The results obtained in the simulation of the EB production unit allowed to clarify the technological data of the streams that can be included in the integration of heat and energy. It was determined that 12 hot and seven cold streams are involved in the heat exchange process. Hot streams: vapors from the top of the K-3 alkylator to the T-4/1-3 condensers; the product of the alkylator K-3 in refrigerators T-10/1,2,3; EB rectified from E-66 to T-89, then to T-91; steam condensate from E-93 to T-90, then to T-84; benzene vapors from the top of the K-52 column into the air-cooled condensers T-54/1-3; condensate (returnable benzene) from the T-54/1-3 condensers flows into the E-56 collector, and, partially, in the form of reflux, is fed into the K-52 column; the stripping from the T-54/1-3 air coolers is directed to the T-55 condenser cooled by circulating water; condensate (returnable benzene) from the T-55 condenser is fed to the K-52 column; an excess of benzene at the level in the E-56 tank enters the T-57a refrigerator; vapors of rectified EB from the top of the K-62 column to the T-64 refrigerator; vapors of polyalkylbenzenes from the top of the column K-72 into air-cooled condensers T-74/1,2; the stripping from the T-74/1.2 apparatus enters the T-75 condenser; the stripping after the T-75 condenser goes to the steam ejector unit; then the defrost is condensed in the T-81 heat exchanger; azeotrope vapor from the top of the K-42 column into the T-44 condenser; the azeotrope condensed in the T-44 apparatus, having previously cooled in the T-50 heat exchanger, enters together with the condensate from the T-45 apparatus into the settling chamber of the E-41 tank, where benzene is separated from moisture; the stripping from the T-44 condenser enters the T-45 cooler; the bottom liquid of the K-42 column (dried benzene) into the K-3 alkylator through the T-48 heat exchanger, in which it heats the benzene charge fed to the K-42 column; vapors of hydrocarbons from the top of the column K-112 into condensers T- 114/1.2 and T-114a/1.2; acidic stripped water from the bottom of the K-112 column to the T-114b/1, T-114b/3 refrigerators in parallel, then after the T-114b/1 to the T-114b/2, after the T-114b/3 to the T-114b/4, where it is cooled by circulating water and sent to the E-116 settling tank.
Cold streams: Alkylate from tanks E-10, E-11, E-12 to heat exchanger T-88, then to heat exchanger T-89, after the alkylate is sent to heat exchanger T-90, where it receives heat from steam condensate from E-93, after T-90, alkylate goes to rectification in K-52; the bottom liquid of the K-52 column into the T-53 boiler, heated by steam 12 kgf/cm2, then returns back to the K-52; the bottom liquid of the K-62 column into the T-63 boiler, heated by steam 28 kgf/cm2, then returns back to the K-62; steam condensate from E- 83/1.2 vat liquid of column K-72 enters the boiler T-73, heated by steam 28 kgf/cm2, then returns back to K-72; benzene charge (fresh and returnable benzene) from containers E-13, E-14 and benzene-distillate from E-41, into the heat exchanger T-48 and into the heat exchanger T-48b then enters the K-42; part of the bottom liquid of the K-42 column (hot jet) is heated in the T-43 boiler, which is heated with steam 2.5 kgf/cm2, then returns back to the K-42.
Steam is used as a hot coolant in column-reboilers (K-42, K-52, K-62, K-72) (
Figure 2). Recycled water is used to cool the streams. As a result, a stream data table [
27], which is a digital representation of the HEN of the unit (
Table 1), was built.
4. Determination of the Potential for Energy Saving in the Process of EB Production
To analyze the energy efficiency of the existing HEN, economic data relevant to the enterprise in question were clarified. Low pressure steam costs
$ 27/t, medium pressure steam costs
$ 31/t, and high pressure steam costs
$ 51/t. The cost of the installed heat exchange equipment is determined by the ratio [
28]:
where:
S—heat exchange surface area of heat exchanger; 0.87—factor reflecting the non-linear dependence on the value of the cost of the heat exchanger to the heat transfer surface.
The HEN of the existing process consists of three recuperative heat exchangers T-48, T-89, and T-90 with a total heat load equal to
Qrec = 312 kW. Further, using the stream data table and special software [
29], composite curves were constructed for the existing EB production process, so that the projection of the overlap of cold and hot composite curves along the stream enthalpy axis was equal to the heat recuperation capacity in the existing HEN unit (
Figure 3a). This graphical plot shows clearly the values of the payloads used by the hot and cold utilities process:
QHmin = 4.962 kW and
QCmin = 6.647 kW, respectively. The composite curve diagram also shows the Pinch location in the process streams system. The minimum temperature difference between heat carriers in the heat exchange equipment of the existing HEN for vertical heat transfer is Δ
Tmin = 43 °C, and the Pinch is localized at the Pinch temperature of hot process streams
THp = 136 °C and cold streams
TCp = 93 °C.
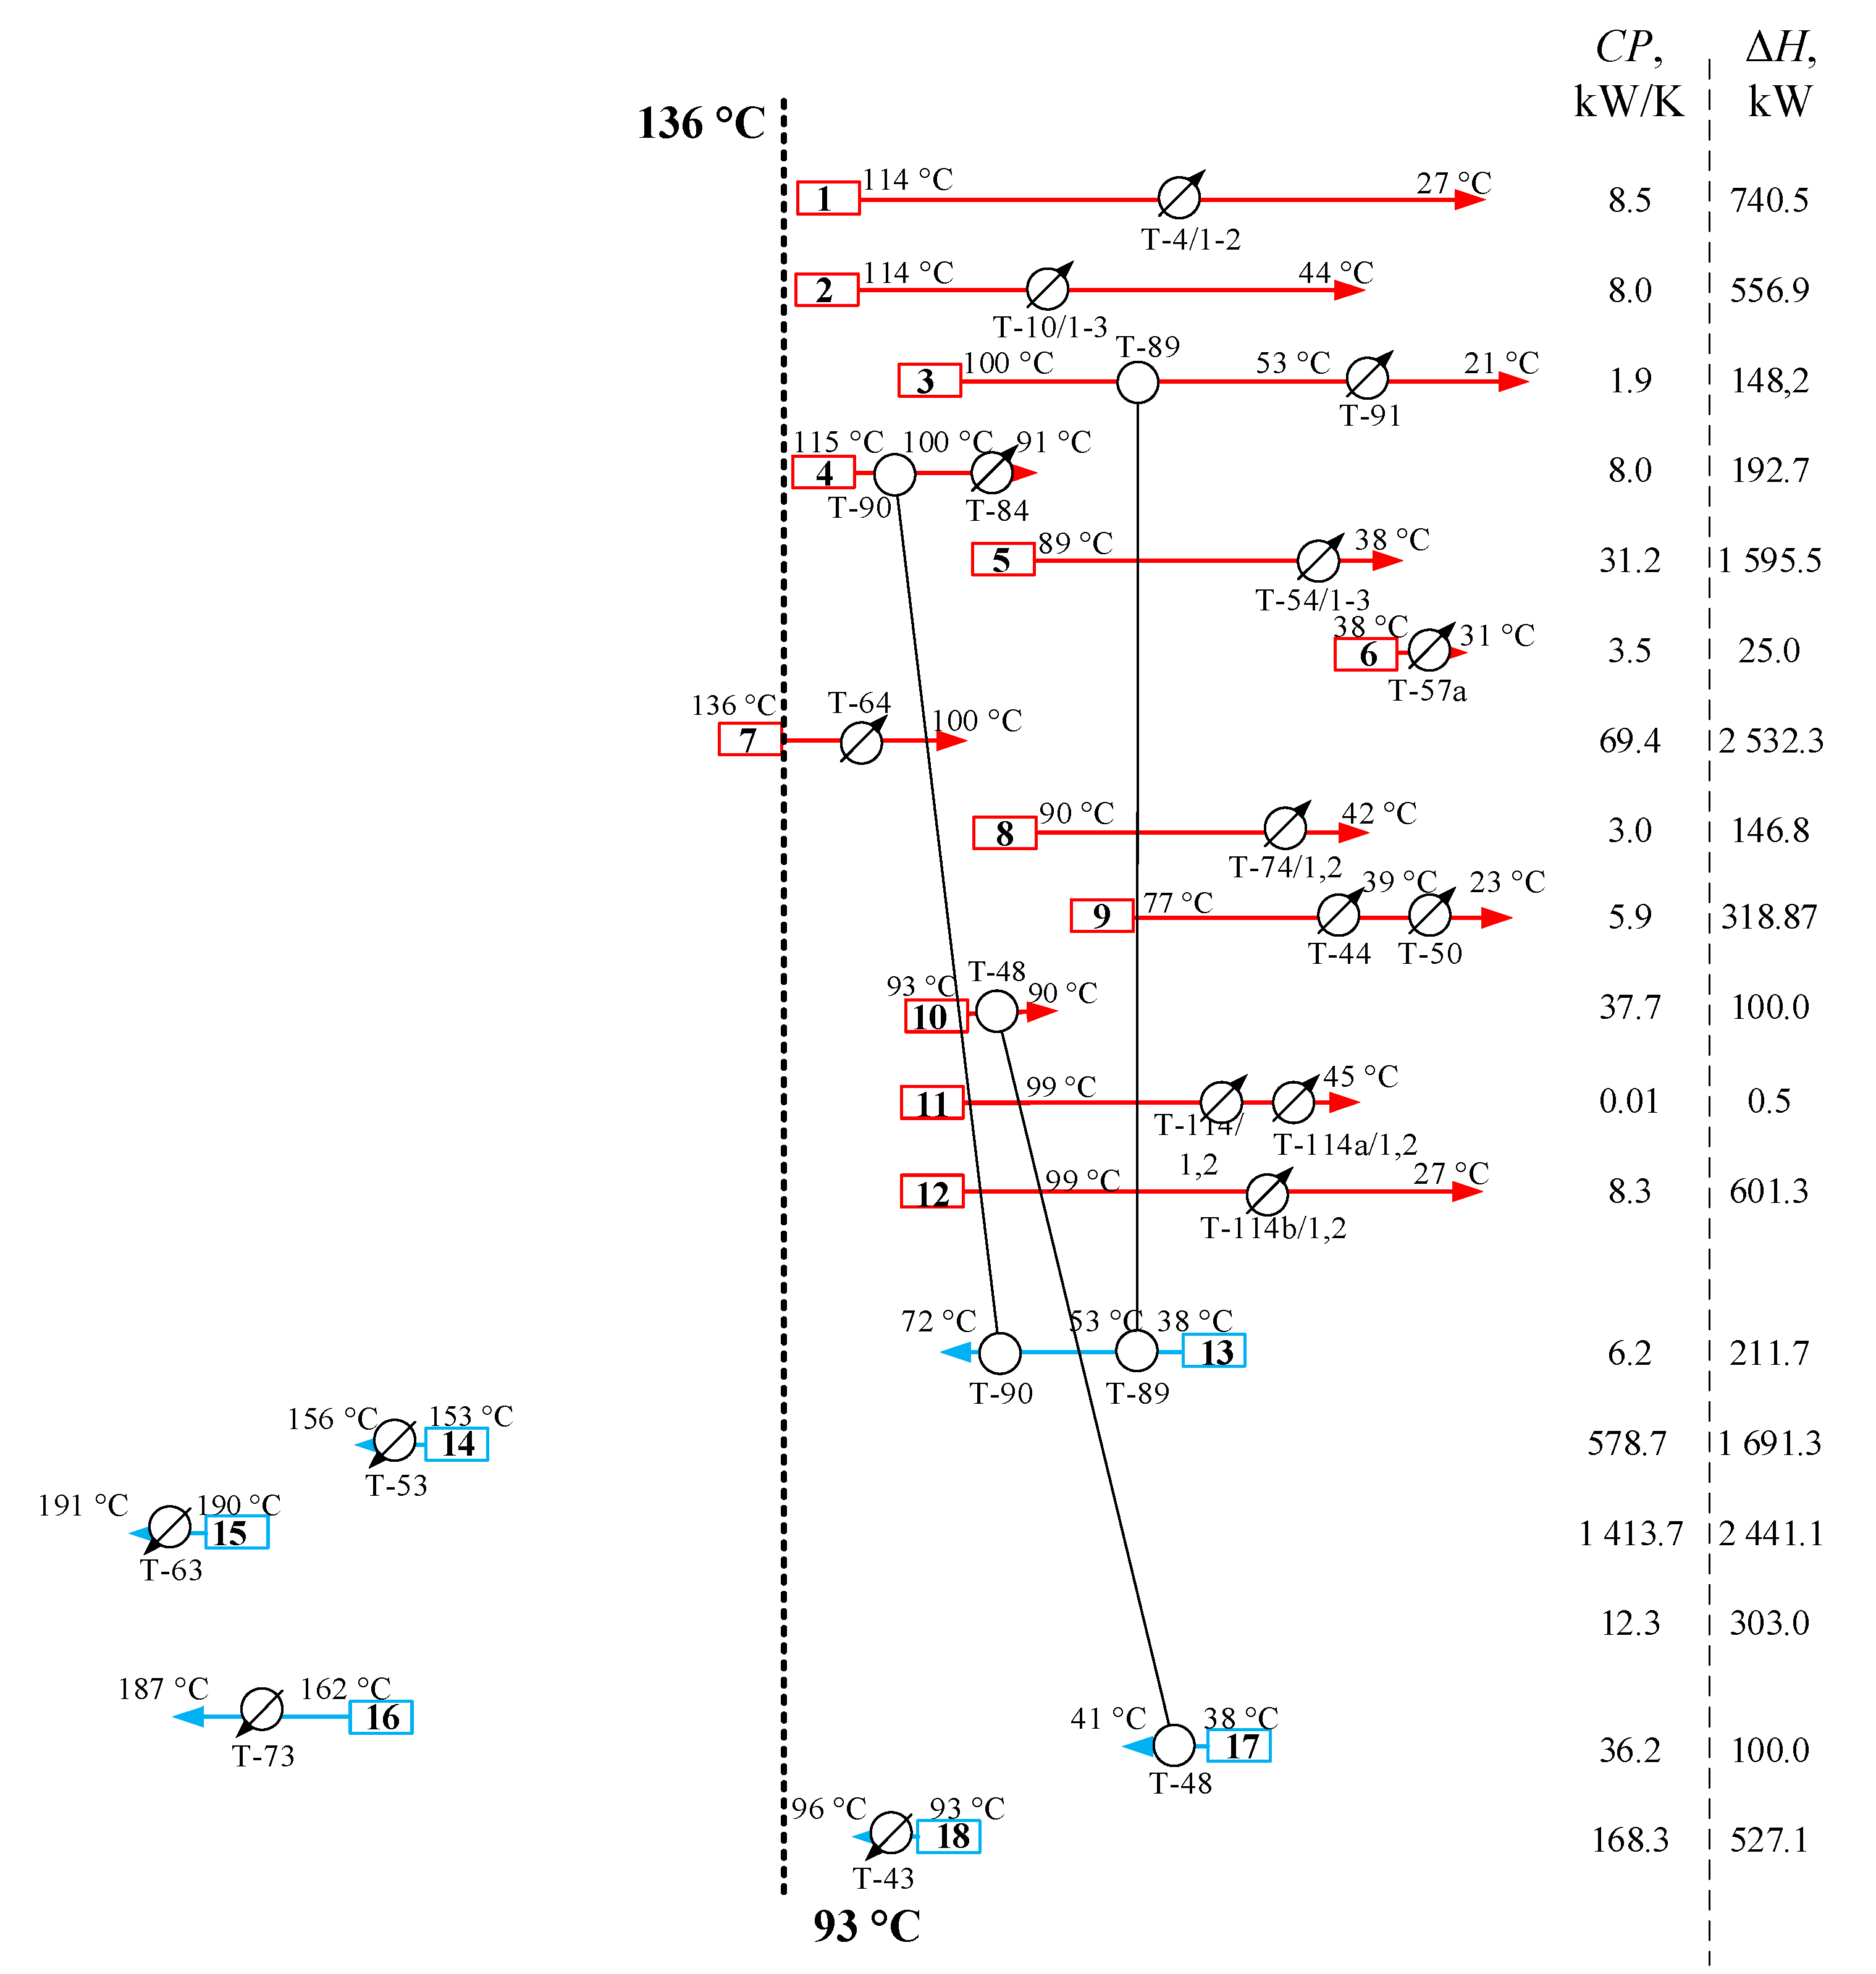
The obtained values allow to display correctly the grid diagram of the existing HEN process (
Figure 4). We see that the entire heat exchange system of the EB production facility is located below the Pinch, where some of the hot utilities are also used. At present, on average, ~8.1 t. of steam per hour are consumed to carry out the process of EB production.
Using the stream data table and economic data with the help of Pinch SELOOP software [
29], we construct functional dependencies of the discounted values of the energy cost, the cost of modernization HEN, and the total cost of the project (
Figure 5). Since the structure of the composite curves shows that it is impossible to make the driving forces for vertical heat exchange less than 40 °C in the system of technological flows of the EB production process; therefore, the cost dependences begin precisely from this value, and it is at this value that the minimum value of the total present value of the reconstruction project Δ
Tminopt is observed (
Figure 5).
For this value of the heat transfer minimum driving force, we construct composite curves for the technological streams involved in heat transfer of the EB production process (
Figure 3b). The construction shows that the heat recovery capacity can be increased by 527.1 kW to the value
Qrec = 838.7 kW, the capacity of hot and cold utilities will be decreased by the same amount, i.e., to the values
QHmin = 4435.3 kW and
QCmin = 6119.9 kW, respectively. The Pinch in this case is localized at the Pinch temperatures of hot flows
THp = 136 °C and cold flows
TCp = 96 °C (
Figure 3b).
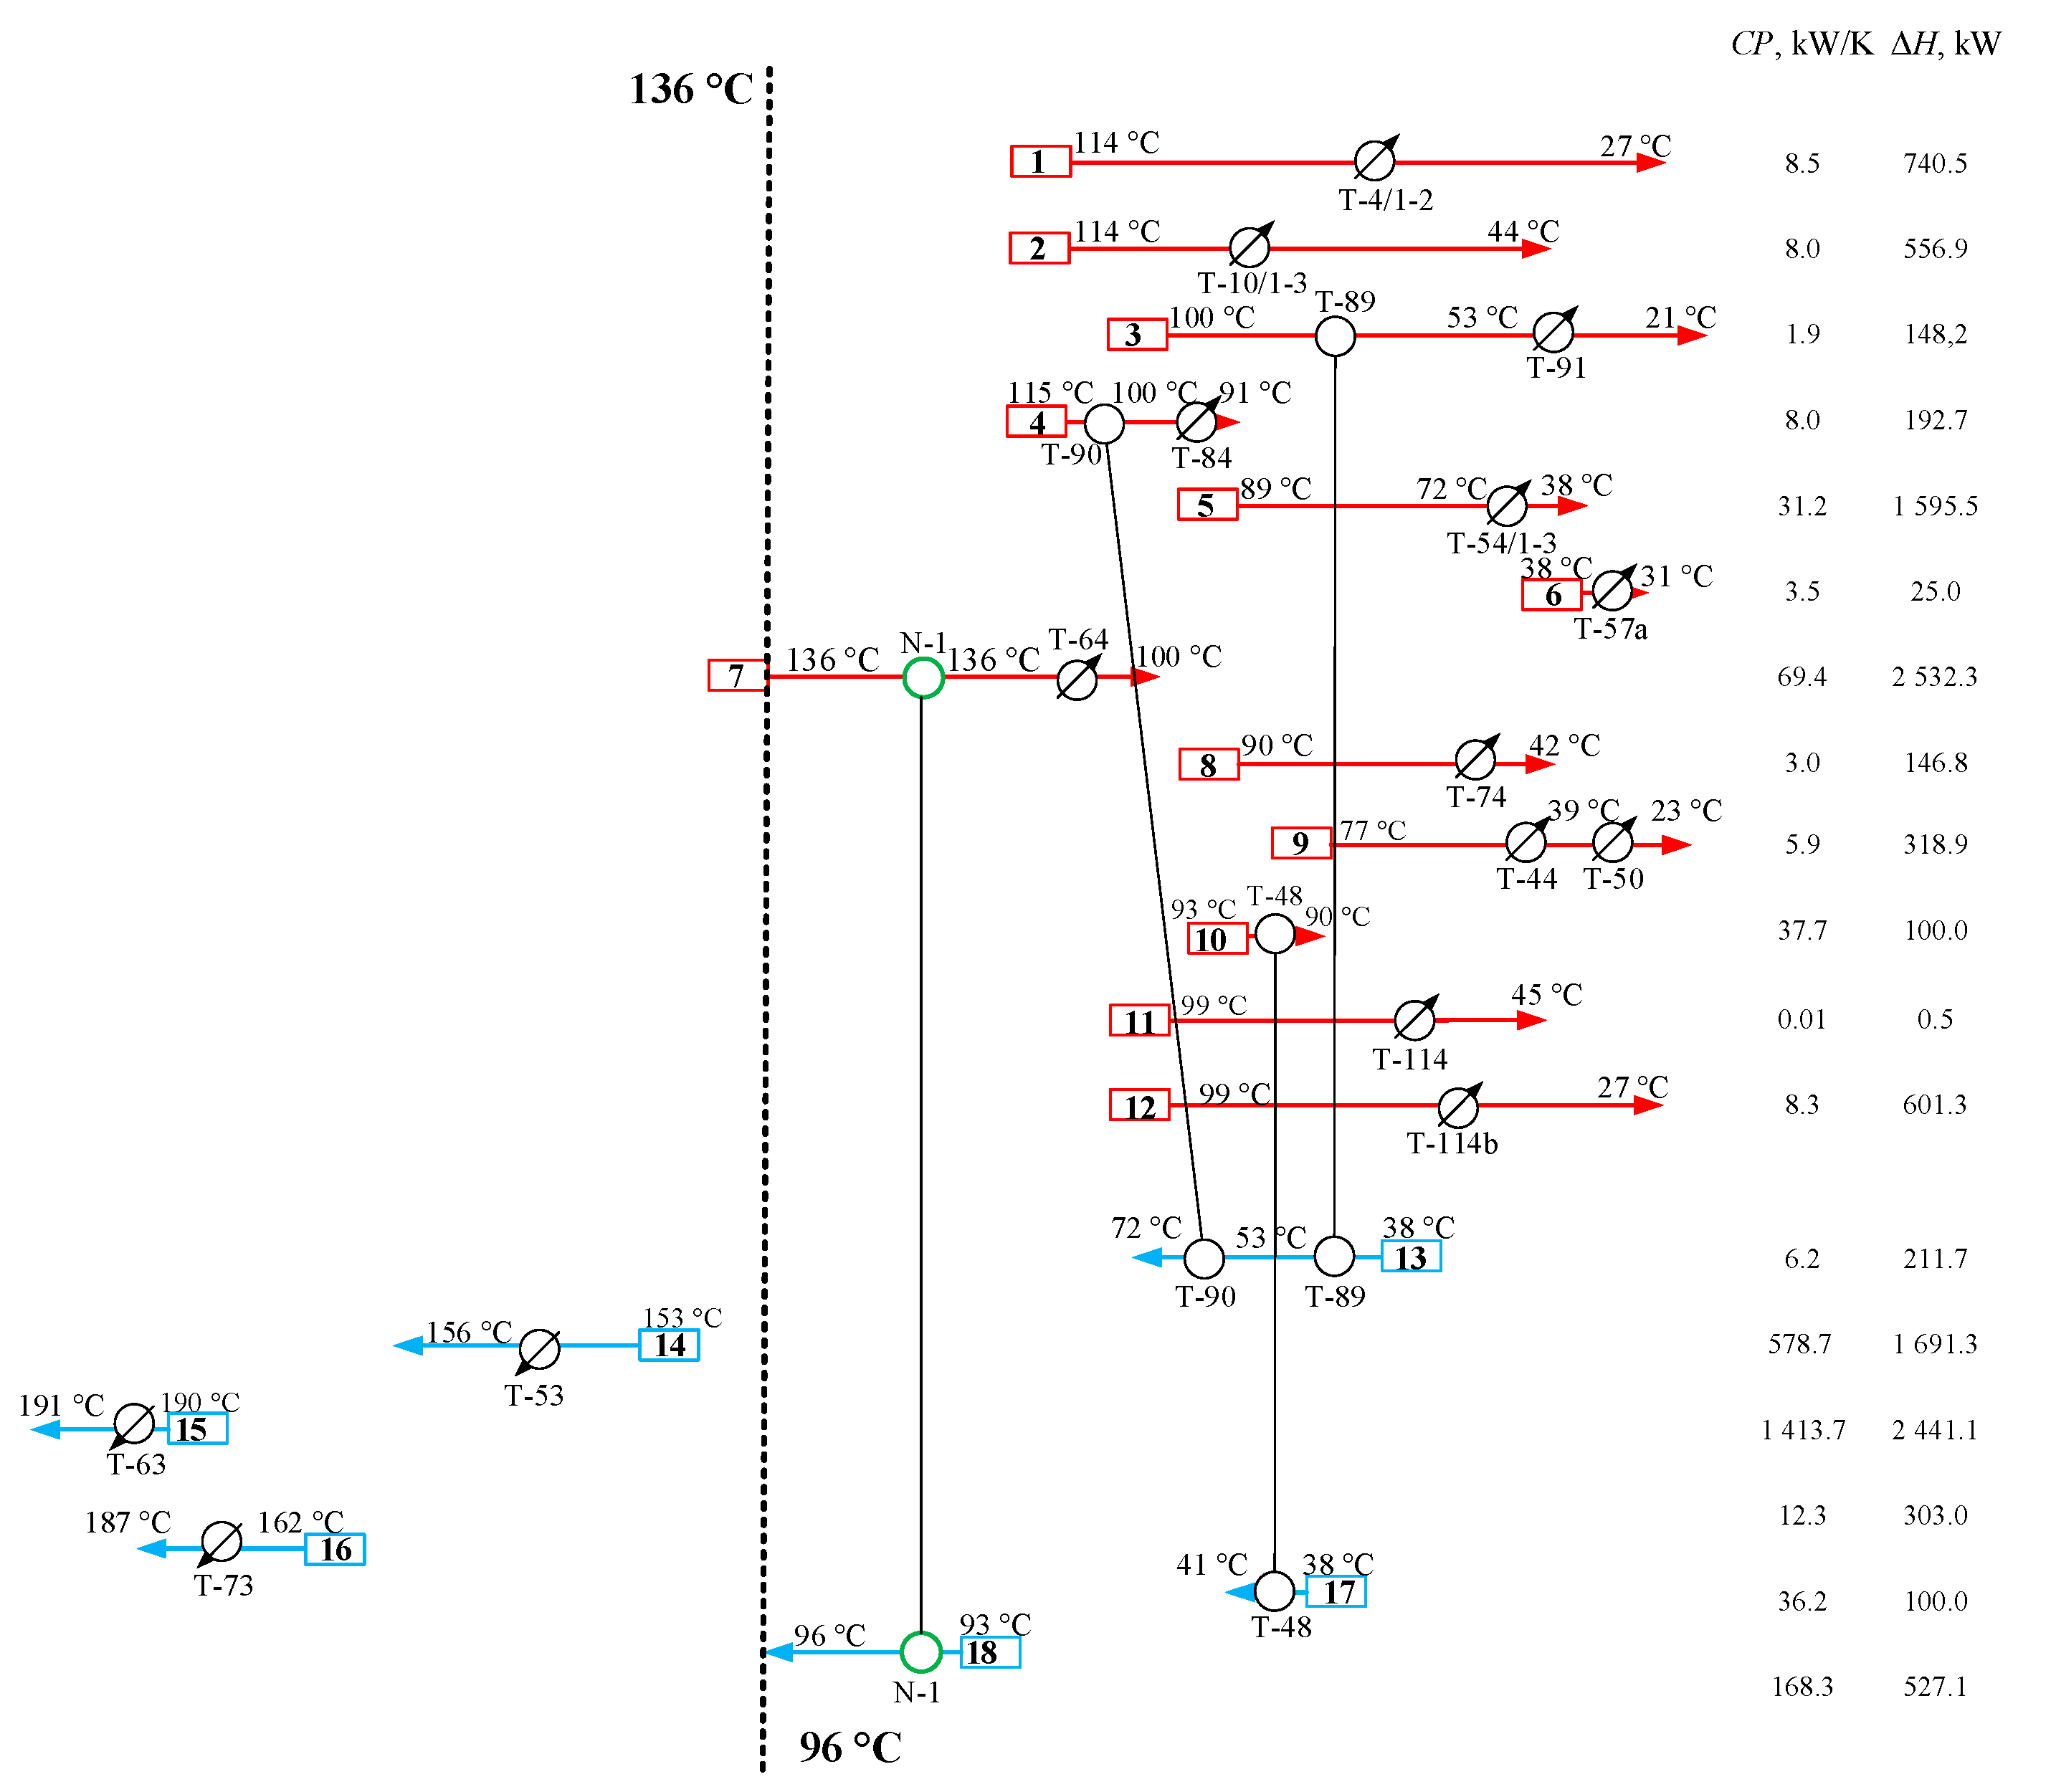
Further, the synthesis of the retrofit project is in many ways similar to the synthesis of the reconstruction project for threshold problems [
27], since the entire HEN is located below the Pinch. By replacing the low-pressure steam that heats the hot stream of the K-42 column with the EB vapor from the top of the K-62 column, we exclude the consumption of low-pressure steam. This requires one new heat exchanger
N-1 (
Figure 5). The cost of installing the heat exchanger will be about USD 258,503.
Despite the good relative economic performance, the 10-year discounted cash flow is negligible at less than USD 1 million (
Table 2). Economic efficiency indicators were calculated under the following planning assumptions such as discount rate 5%, planning horizon (calculation period) 10 years.
Figure 3b shows clearly that the minimum temperature difference, equal to Δ
Tmin = 40 °C, is the limiting value with an increase in the heat recovery power in the process under consideration by the methods of classical Pinch analysis. This value is achieved when organizing heat exchange between the technological overhead stream of ethylbenzene vapor from the K-62 column and the hot jet from the K-42 column (
Figure 5). The use of this stream as a hot heat carrier for other heat consumers (bottom heating of K-52, K-62, K-72) is limited by its current temperature and the condensation temperature at the initial pressure.
5. Integration of the Heat Pump with the EB Production Process
To deepen the thermal integration of the EB manufacturing process, let us consider the grand composite curve (GCC) with the heat integration of the process already performed (
Figure 6). GCC is a tool for the optimal placement of utilities and heat engines in the Pinch methodology. The GCC analysis for the considered EB production process shows the possibility of organizing at least two heat pump technological schemes. This is facilitated by the compact layout of the equipment at the ethylbenzene production unit, which allows integrating a heat pump between two columns. This allows the conversion factor of the heat pump to be increased and the economic efficiency of the heat pump integration is greatly increased.
In both options for integrating a heat pump with columns, we will consider a recompression scheme.
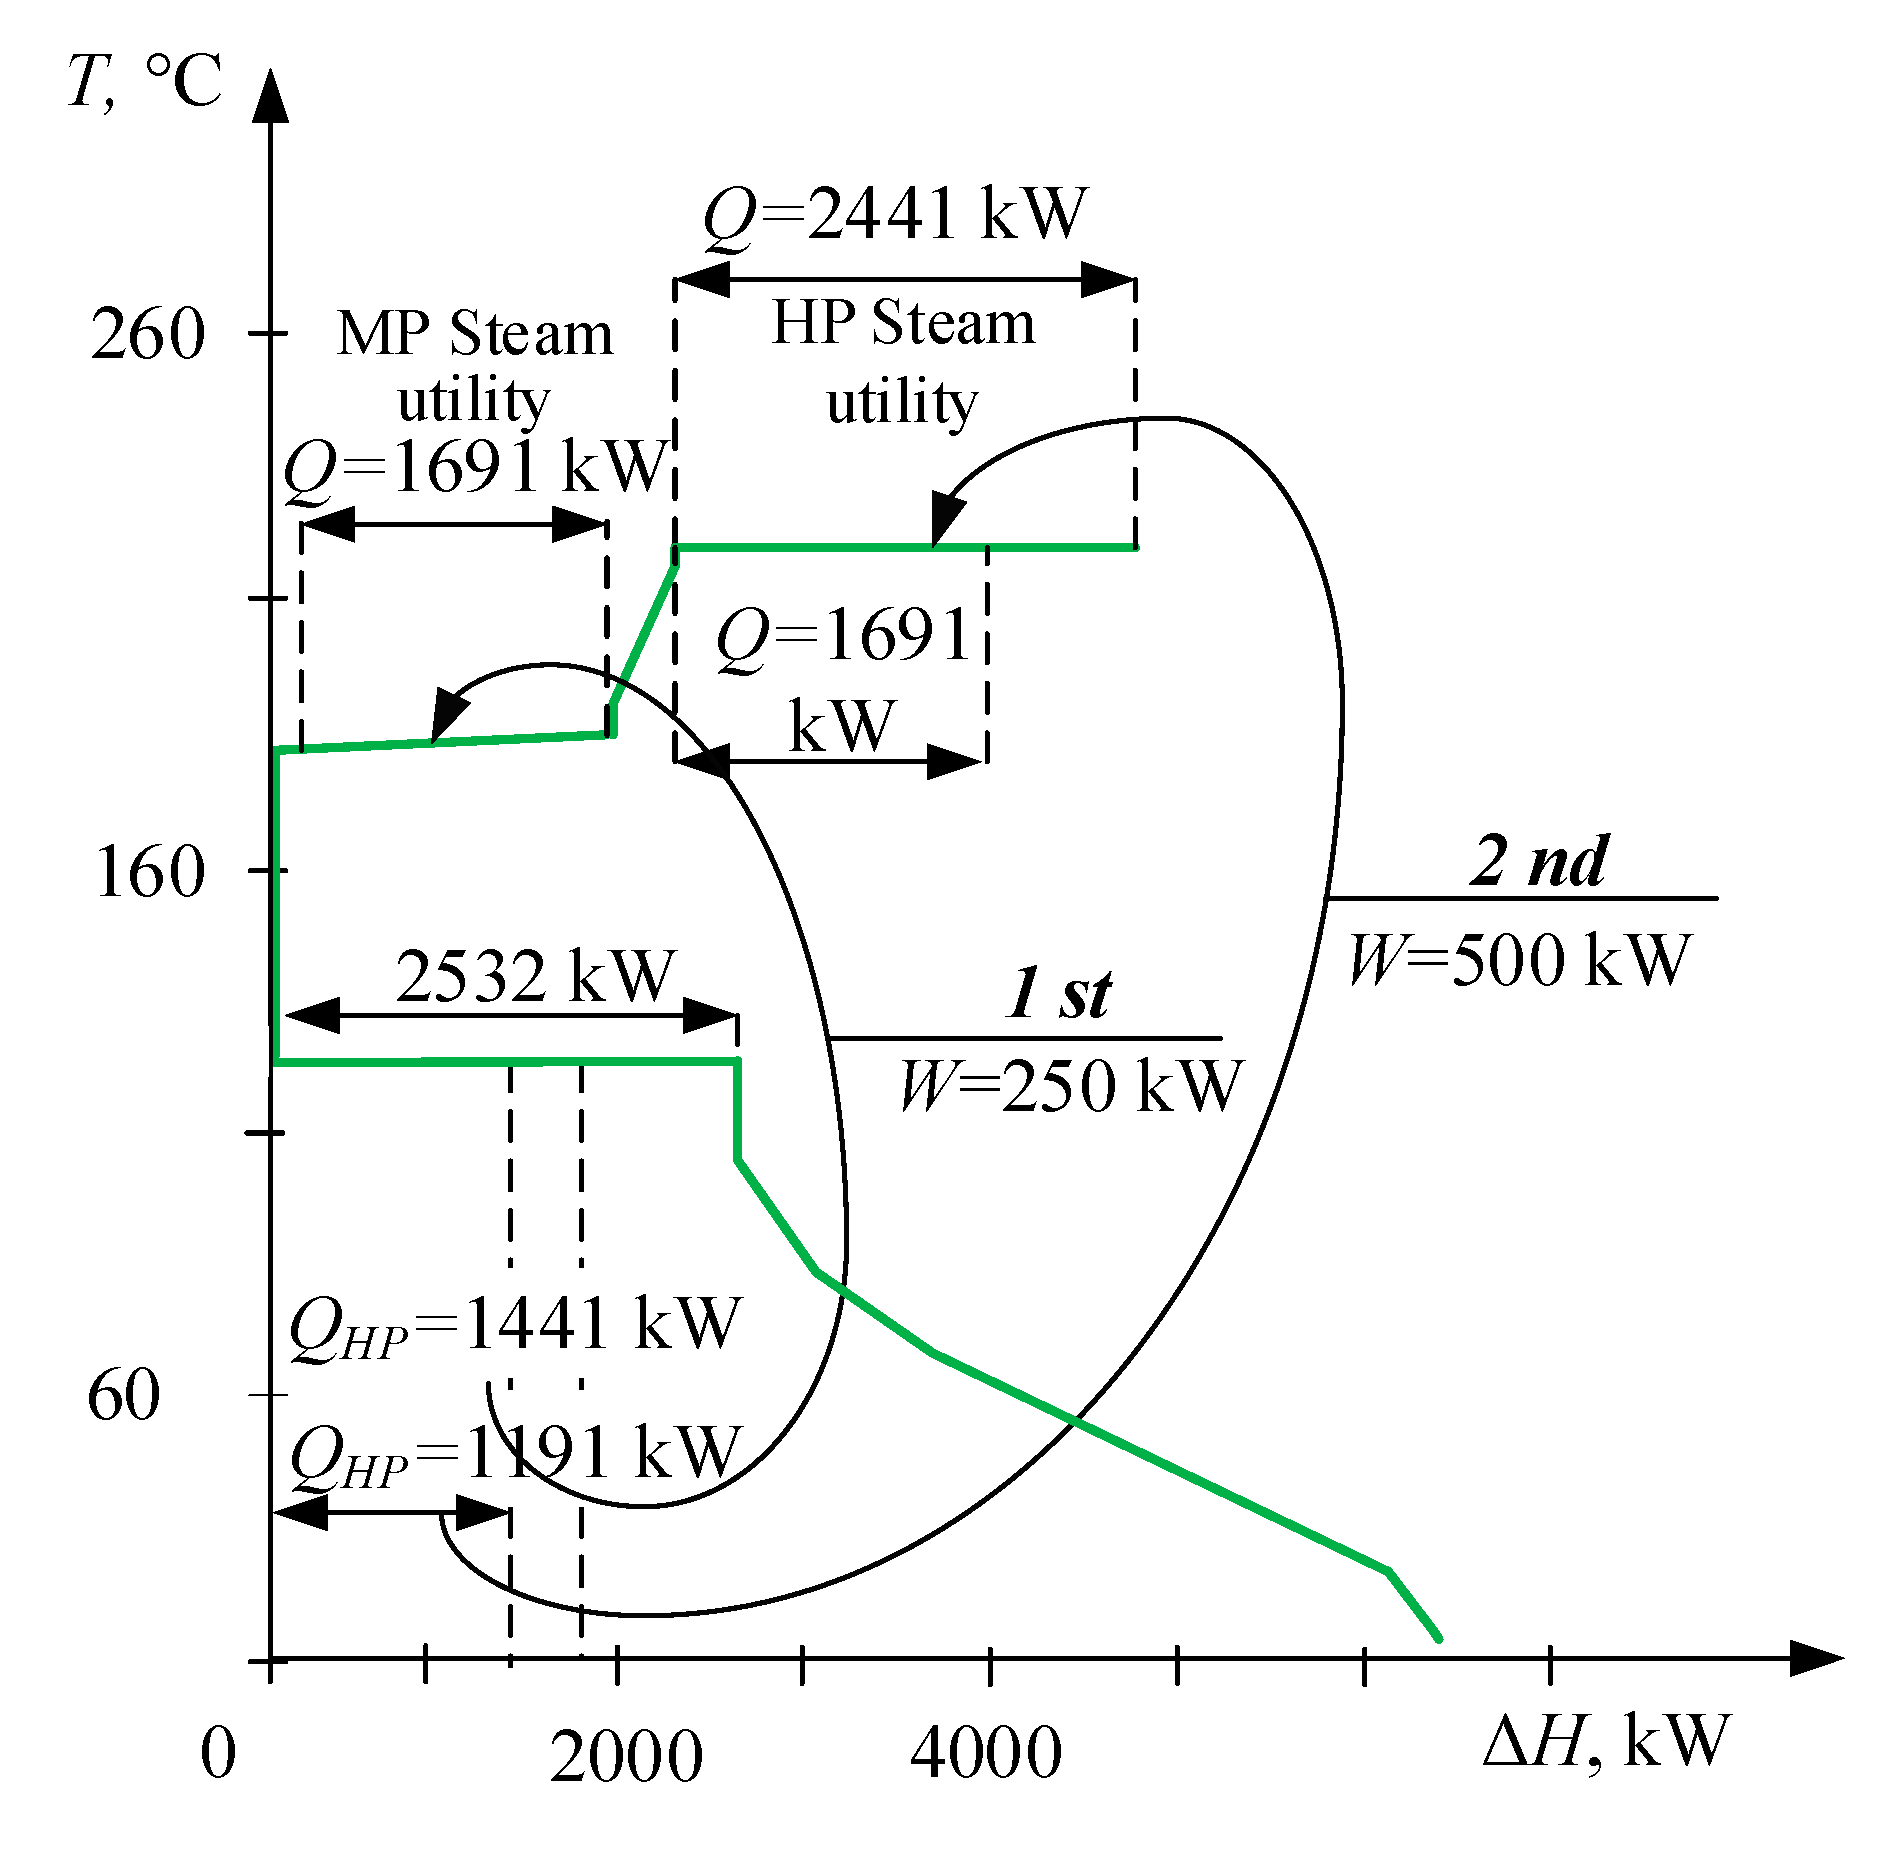
In the first variant, E-benzene vapors from the top of the K-62 column enter the separator, where the vapor part is separated from the condensate, the vapor part enters the compressor, the vapor pressure in the compressor rises to 3 at, while the temperature of the compressed gas increases from 139 up to 183 °C. After the compressor, as a hot carrier, the compressed EB vapor enters the N-1 reboiler, heating the bottom of the K-52 column, after which it is cooled to the target temperature in the water cooler. The heat load that is removed when the flow is cooled is 2532 kW. Due to the fact that, in the K-62 distillate stream, in addition to E-benzene there are impurities of other hydrocarbons, the condensation process occurs unevenly, with a decrease in the stream temperature. The simulation results show that when using the compressed stream to supply heat to the bottom of the K-62 column, 1691 kW can be effectively transferred, taking into account the compressor power. Further heat transfer is limited by the drop in temperature difference due to condensation of a multicomponent mixture, while an increase in compression does not give an economically justified result.
In the second variant, EB vapor from the top of column K-62 is also used as a compressed stream. E-benzene vapors from the top of the K-62 column enter the separator, where the vapor part is separated from the condensate, the vapor part enters the compressor, the vapor pressure in the compressor rises to 11 at, while the temperature of the compressed gas increases from 139 to 257 °C. After the compressor, as a hot carrier, the compressed EB vapor enters the N-1 reboiler, heating the bottom of the K-62 column, after which it is cooled to the target temperature in the water cooler. Here, the capacity removed from EB vapors is 1191 kW, but due to the higher power on the compressor shaft, a heat capacity equal to 1691 kW is transferred to the hot jet K-62.
The efficiency of heat pump integration is assessed by calculating the Coefficient of Performance, which is defined as the ratio of the useful energy transferred to the process to the work expended on it. However, in real conditions, the conversion factor of a heat pump is not always an objective criterion for assessing the location of a heat pump; therefore, economic criteria were also used in the work.
The conversion ratio of the heat pump is calculated as:
For first option: Where QTH = 1441 kW, and W = 250 kW, COP = 6.76.
Second option: QTH = 1191 kW, and W = 500 kW, COP = 3.38.
Further comparison of the two options for placing the heat pump is carried out taking into account the fact that the heat exchangers provide the same logarithmic temperature difference, the load of the heat exchangers is also identical (
Figure 7 and
Figure 8). Therefore, it can be assumed that the heat exchange surface area and the cost of heat exchangers will be the same. The model of the reconstruction project according to the heat pump scheme is shown in
Figure 4.
N-1—plate heat exchanger. Average heat transfer coefficient (without contamination) is ~200 W/(m
2 K). In addition, the heat exchange surface area is ~141 m
2 (reserve 25%).
Despite the fact that in the two considered options, the loads on the new recuperative heat exchangers are the same, the cost of hot utilities in each case is different. This significantly influences the decision on the location of the heat pump. The price of the medium pressure steam is 34 USD/t, the price of the high pressure steam is 51 USD/t. The high cost of high-pressure steam is a common case, this is due to the fact that high-pressure steam is generated in a CHP, and medium-pressure steam can be obtained directly at the process plant (for example, by recovering heat from flue gases). Comparison of the economic parameters of the two projects is presented in
Table 3.
The results of economic analysis show that the indicators of the first and second projects are quite close, in addition, the NPV of the second project is 24% higher than the NPV of the first project. These results show the importance of economic assessment on decision making of suitability of the project implementation. In this case, the key parameter was the payback period; it was decided to implement the first option for integrating the heat pump.
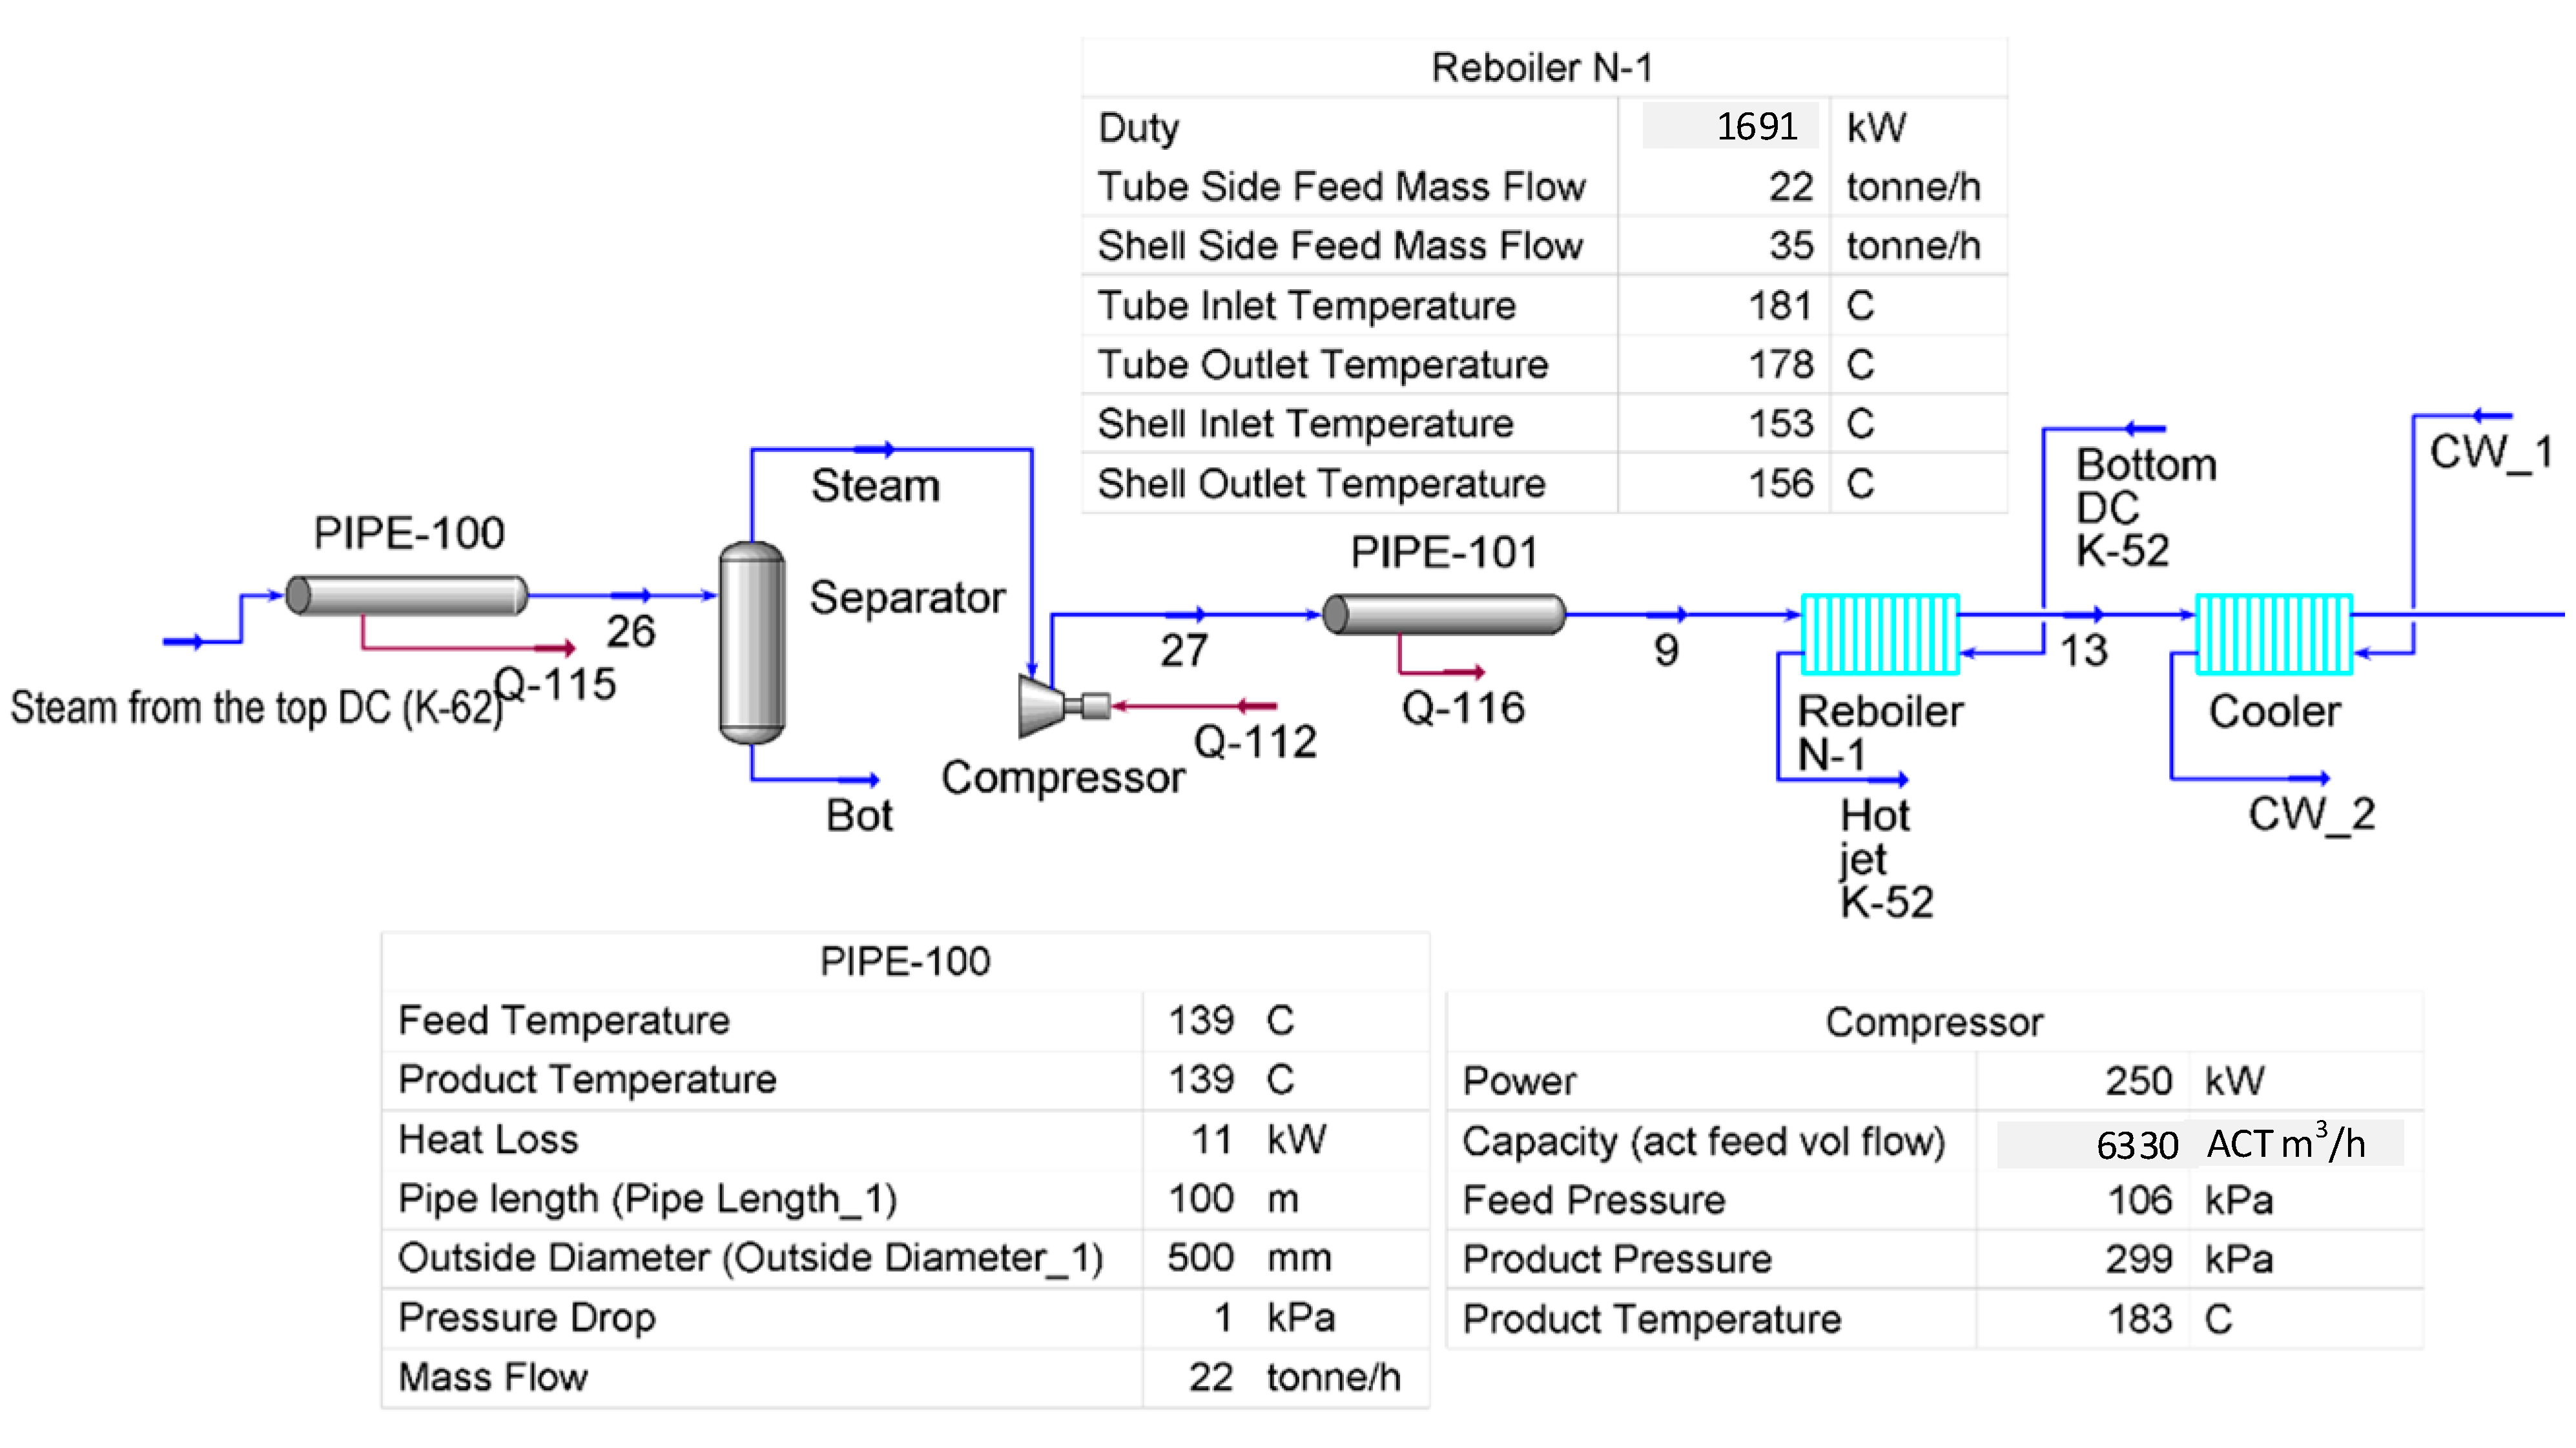
The presented flowsheet (
Figure 9) works as follows—helmet vapors K-62, constituting a multicomponent mixture with a mass fraction of ethylbenzene of 96%, enter the separator, where the liquid and gas phases are separated, after which the gaseous part enters the compressor, consisting of three stages, after the first and second stages, separators are installed to drain the liquid phase. After the third stage, the compressed vapors as a hot heat carrier enter the new heat exchanger
N-1, where they give off heat, heating the cube of the K-52 column. The
HP integration reduces heat consumption and the load on the cooling system. Due to the integration of the
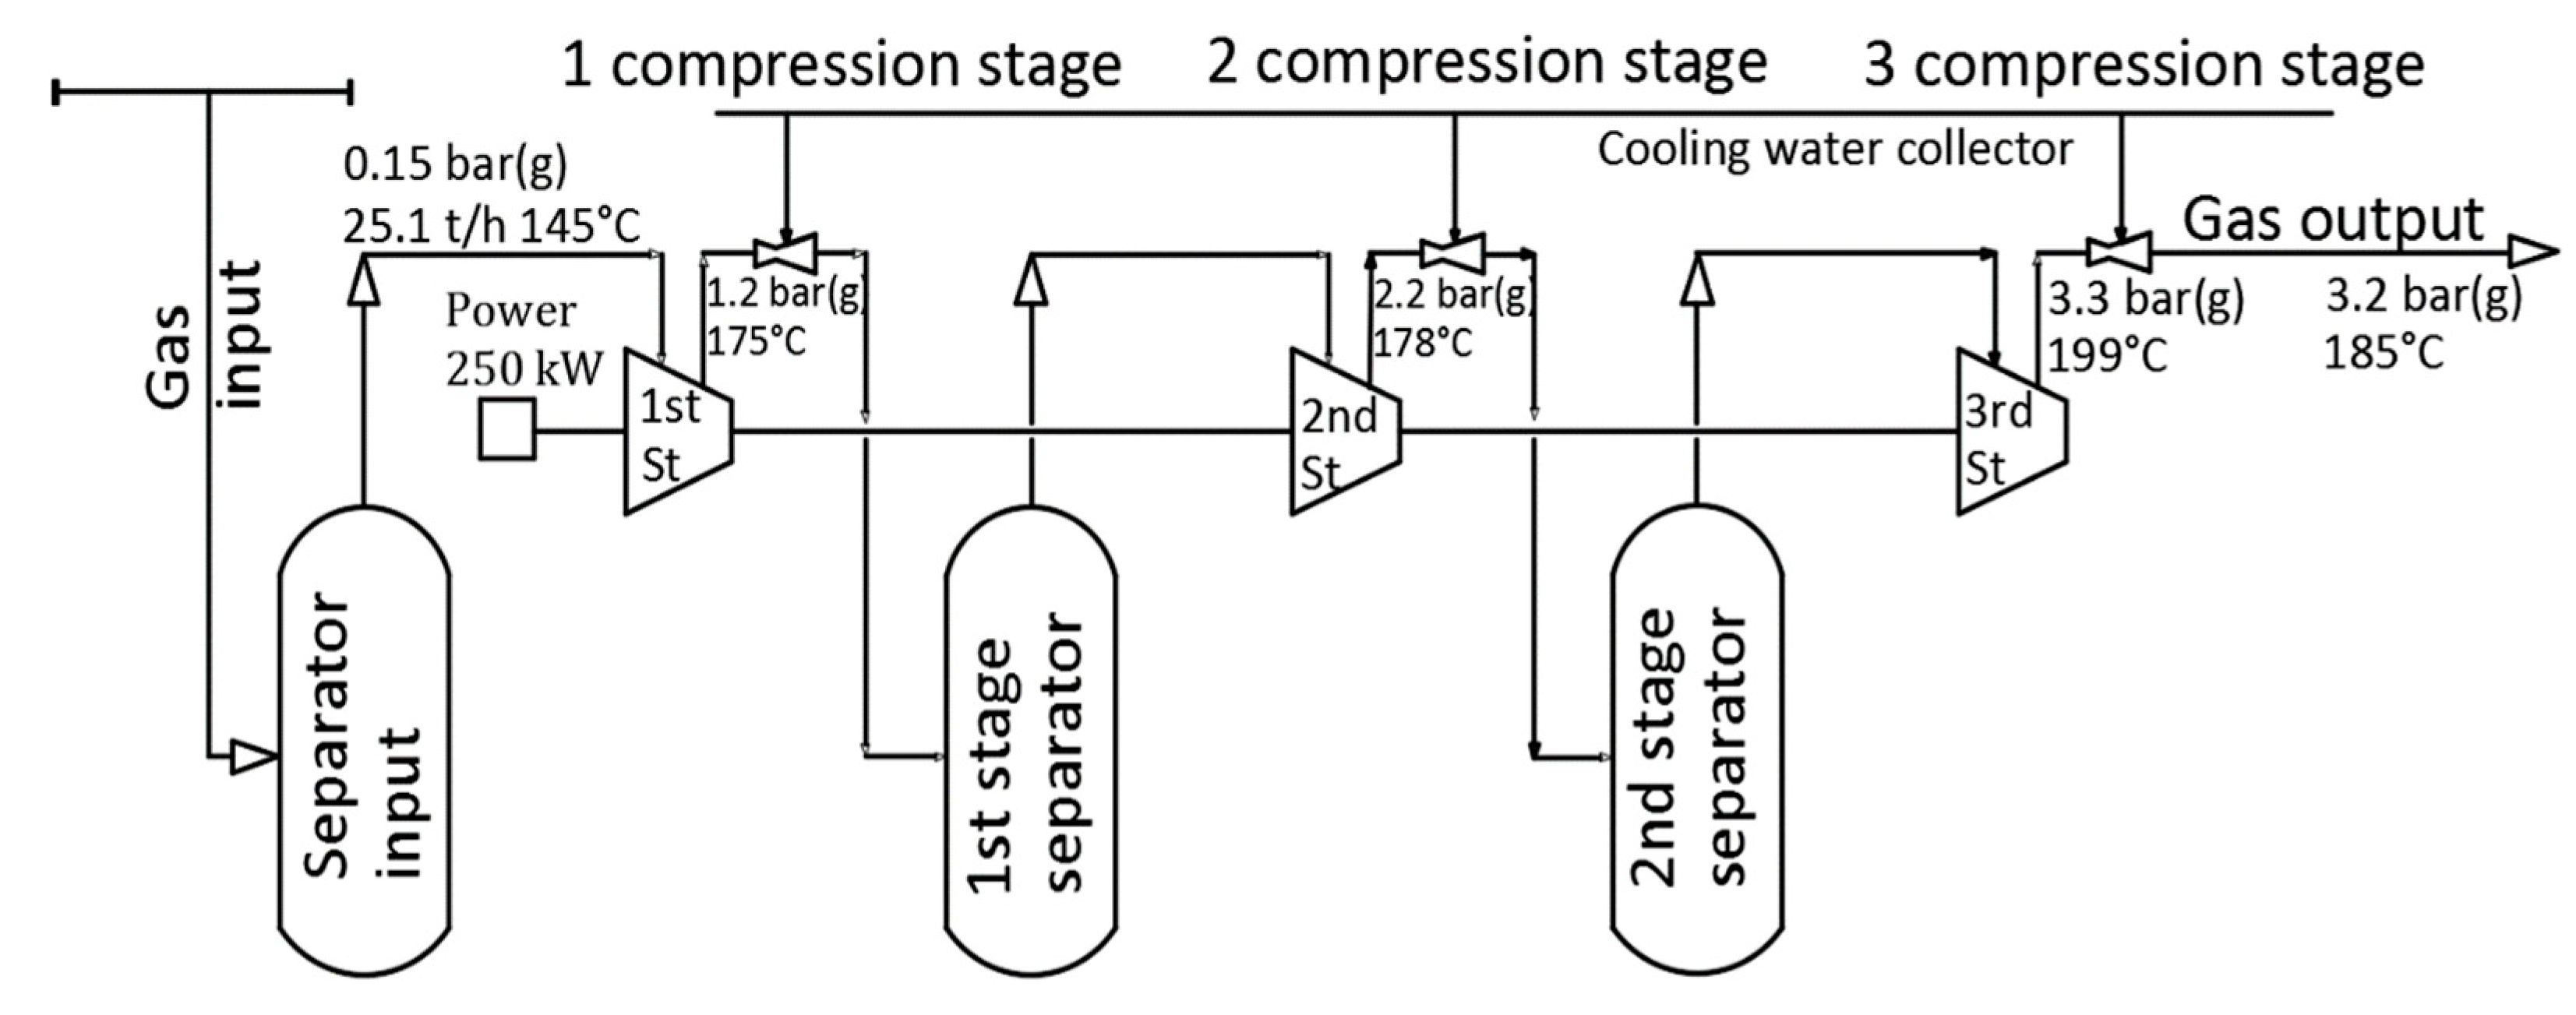
HP, the steam savings will be 2.9 t/h, and the rated power consumption on the compressor shaft will be 250 kW. Detailed characteristics of the compressor are shown in
Figure 10. The project provides for the unit of a compressor, heat exchanger and liquid phase separators. Due to the fact that the compressor and separators of the first and second stages have significant weight and dimensions, their unit in the upper part of the column is not advisable in practice, for the unit of the compressor the zero mark has been chosen. When the steam of the column moves to the zero point, condensate is formed in the steam, as a result of which a separator must be installed in front of the inlet of the compressed gas into the first stage of the compressor. It should also be noted that practical implementation will require a separate foundation for installing the compressor.
Note that when implementing any of the projects for integrating the heat pump with the EB production process, the steam savings will be more than three times greater than with the Pinch integration. At the same time, in all cases, the thermal potential of the helmet vapor of the K-62 column is used to increase the heat recuperation capacity. The capacity that is released during the condensation of these vapors is sufficient for simultaneous use for both Pinch integration and heat pump integration. Therefore, we can consider joint Pinch integration and heat pump integration not as a complex solution, but as a step-by-step solution. Step-by-step retrofit of HEN systems is more acceptable at existing enterprises. Therefore, we can combine Pinch integration with heat pump integration in the first option. Hysys model of such a solution is shown in
Figure 11.
Here, E-benzene vapors from the top of the K-62 column enter the separator, where the vapor part is separated from the condensate, the vapor part enters the compressor, the vapor pressure in the compressor rises to 3 at, while the temperature of the compressed gas increases from 139 to 183 °C. After the compressor, as a hot coolant, compressed ethylbenzene vapors enter the N-1 reboiler, heating the bottom of the K-52 column, after which they are sent to the HE-1 reboiler, in which the bottom of the K-42 column is heated and then partially condensed K-62 vapors are cooled to the target temperature in the water cooler.
The comparison of the economic results for the three configurations of integrating of the heat pump with the EB manufacturing process shows that the combined project gives the best results. (
Table 3). In the case of combining Pinch integration with heat pump integration, the discounted payback period is the smallest one, and the IRR and NPV are the largest one. Steam consumption will be decreased by 3.01 t/h to accommodate the reduction in hot and cold utilities for power generation for the compressor. This is 37% less than the current consumption of the process. Considering that the coefficient of efficiency of steam production is ~0.7; greenhouse gas emissions will be decreased by ~1 t/h. The given project can be completed in stages and it is the best one.
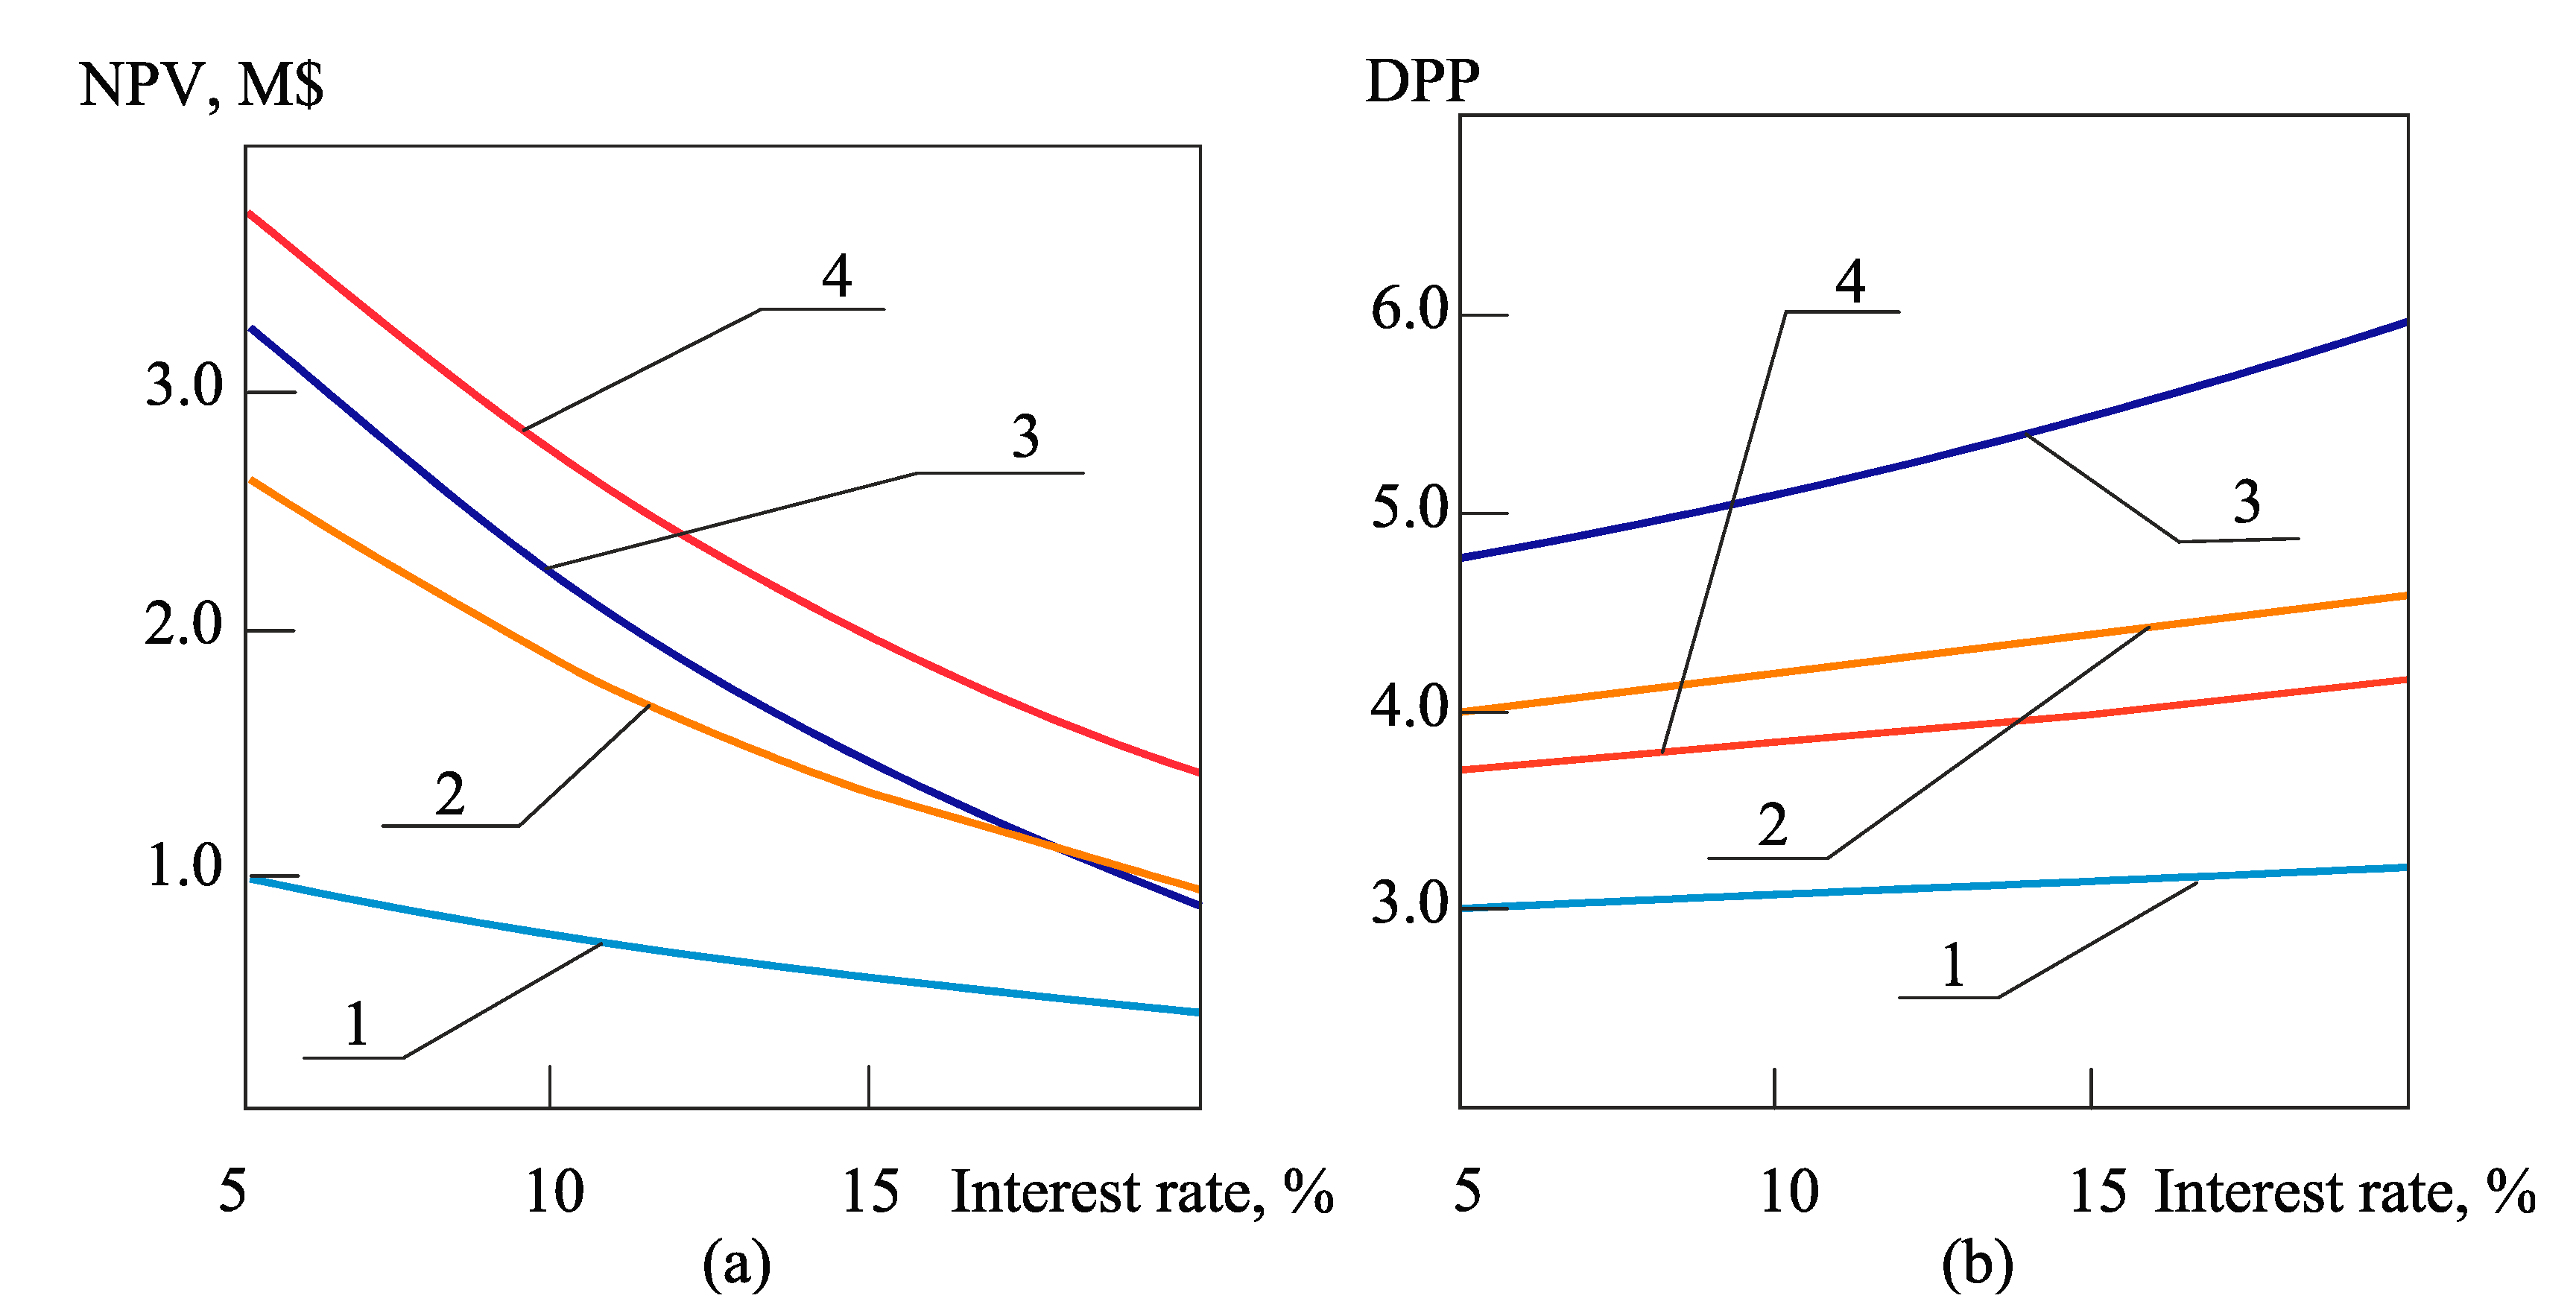
Analysis of the bank’s value of interest rates shows that during the year their value can be changed several times. Comparison of the change in the value of net cash flow with the change in the Interest rate shows that the lowest NPV value will be observed when the project of the Pinch retrofit is implemented, but for the same project, the lowest discounted payback periods are observed (
Figure 12).
When integrating a heat pump according to option 1 for all values of interest rate, the discounted payback period is shorter than when integrating a heat pump according to option 2, but for low values of interest rate, NPV for option 2 is greater than for option 1 (
Figure 11). However, at large values of the interest rate, the advantage of option 1 over option 2 becomes obvious.
The largest generation of capital, for all values of the Interest rate, will be observed during the implementation of the stage-by-stage Pinch reconstruction and retrofit project according to option 1. Therefore, this particular project is the most preferable.
6. Conclusions
In this work, the thermal integration of the existing EB production is carried out. For this, a survey and analysis of the EB production facility was carried out, a Hysys simulation model of the facility was built, and a new methodology was developed, which is presented in the article in the form of a block diagram of an algorithm for performing thermal integration of the EB production process.
In the presented work, four variants of the modification of the recuperative heat exchange system for the existing production of EB are investigated. The first of them is the modification of HEN using the methods of classical Pinch analysis, which makes it possible to reduce the consumption of hot utilities by 10.7%, and this value in this approach is the largest, since the further reduction of utilities is limited by the structure of technological flows.
To increase the heat recovery power in HEN, two modifications have been proposed using the integration of a recompression heat pump.
In both cases, the vapor from the top of the rectified ethylbenzene production column is used for recompression. In the first embodiment, the compressed vapors are fed to the reboiler of the recycle benzene stripper. In the second variant, the hot jet of the rectified ethylbenzene separation column is heated with compressed vapors (i.e., HP integrates with one K-62 column).
In both integration options, hot utilities are reduced by 1691 kW, or 34%, but in the first option, the power on the compressor shaft is 250 kW, and in the second option, it is 500 kW. Despite the fact that in the second case compressed EB vapors replace more expensive high-pressure vapor, the payback period of this option is longer than that of the first HP integration option, so the first option turned out to be preferable.
Analysis of the proposed options for HEN reconstruction using classical Pinch analysis and using HP integration has shown that the combination of these methods does not represent a complex solution, but can be considered sequentially. Therefore, combining the flowsheet obtained with the help of the classical Pinch analysis with the preferred HP integration option, we obtain the most effective project for the HEN modernization of an EB production unit. The implementation of this reconstruction project will reduce the average steam consumption by ~3.01 t/h or 37% of the existing consumption, while reducing CO2 emissions by 1.0 t/h. It should also be noted that the use of combined thermal integration of ethylbenzene production by classical Pinch analysis methods with optimal integration of a heat pump allows reducing the average steam consumption by more than 30% compared to previously performed works that used only Pinch analysis to integrate ethylbenzene production. This reconstruction option generates the largest capital out of all considered at various values of the interest rate, and its payback period is only inferior to the Pinch integration project.


