Article

Microsecond Enhanced Indirect Model Predictive Control for Dynamic Power Management in MMC Units

by
Ajay Shetgaonkar
*,
Aleksandra Lekić
,
José Luis Rueda Torres
and
Peter Palensky
Intelligent Electrical Power Grids, Electrical Sustainable Energy, Faculty of Electrical Engineering, Mathematics and Computer Science, TU Delft, 2628 CD Delft, The Netherlands
*
Author to whom correspondence should be addressed.
Energies 2021, 14(11), 3318; https://doi.org/10.3390/en14113318
Submission received: 8 May 2021 / Revised: 30 May 2021 / Accepted: 1 June 2021 / Published: 5 June 2021
(This article belongs to the Special Issue Power Converter Control Applications in Low-Inertia Power Systems)

Abstract

:
The multi-modular converter (MMC) technology is becoming the preferred option for the increased deployment of variable renewable energy sources (RES) into electrical power systems. MMC is known for its reliability and modularity. The fast adjustment of the MMC’s active/reactive powers, within a few milliseconds, constitutes a major research challenge. The solution to this challenge will allow accelerated integration of RES, without creating undesirable stability issues in the future power system. This paper presents a variant of model predictive control (MPC) for the grid-connected MMC. MPC is defined using a Laguerre function to reduce the computational burden. This is achieved by reducing the number of parameters of the MMC cost function. The feasibility and effectiveness of the proposed MPC is verified in the real-time digital simulations. Additionally, in this paper, a comparison between an accurate mathematical and real-time simulation (RSCAD) model of an MMC is given. The comparison is done on the level of small-signal disturbance and a Mean Absolute Error (MAE). In the MMC, active and reactive power controls, AC voltage control, output current control, and circulating current controls are implemented, both using PI and MPC controllers. The MPC’s performance is tested by the small and large disturbance in active and reactive powers, both in an offline and online simulation. In addition, a sensitivity study is performed for different variables of MPC in the offline simulation. Results obtained in the simulations show good correspondence between mathematical and real-time analytical models during the transient and steady-state conditions with low MAE. The results also indicate the superiority of the proposed MPC with the stable and fast active/reactive power support in real-time simulation.

1. Introduction

Based on the Paris climate agreement [1], the countries strive to exchange fossil fuel-fired generation with renewable energy sources. In the North sea, the Dutch part, 60 GW offshore wind farm is expected to be installed. Offshore wind farms will be connected to onshore using High Voltage Direct Current (HVDC) based transmission link. For the AC to DC and DC to AC conversions power converters are used, usually Voltage Switching Converters (VSCs). The most promising VSC technology is MMCs, due to their high scalability [2] and the possibility to operate on high power. However, to install a 60 GW wind farm, it is necessary to have power converters that can support the conversion of such a huge power. It is assumed that power converters will be grouped in hubs which will represent Multi Terminal DC (MTDC) power systems. With the introduction of power electronic conversion devices, steady-state disturbance in the power grid has been shifted to the transient domain from milliseconds. With this shift, there is a need for faster control actions. In the past decade, significant research efforts have been devoted to the modeling of MMCs. However, advanced control methods are needed to quickly and effectively control the active/reactive power without causing adverse implications on the stability of interconnected power systems. A significant amount of research on advanced power management is carried out at the lower and medium voltage DC-AC microgrids [3]. All of this presents a new topology and a very important research topic.
To precisely verify the implementation of MMC’s controls, and operation of MTDC, it is important to have good models of each component. MMC is usually characterized only from AC [4,5] or from the DC [6] side in the spectral domain. However, these models do not allow AC and DC side interactions. Therefore, some methods are relying on the Fourier series, such as dynamic phasors [7] and harmonic state-space analysis [8,9]. These two methods are compared and they give similar results [10]. Dynamic phasors and harmonic state-space algorithms, although being very accurate, are also generating huge system matrices. One more approach is described in [11], where a state-space model of an MMC in d q z -frame employs three harmonics. This model gives sufficient complexity with the clearly defined system of nonlinear differential equations. Thus, it is used as the basis for a mathematical model in our paper. Since MMC is a new technology, the proper verification of the mathematical models can be made using the real-time simulation tool RSCAD that runs on RTDS clusters. In this paper, the mathematical model is benchmarked and compared with the simulation results obtained in RSCAD during the small disturbance. The error comparison is conducted for different MMC signals in pre, during, and post-disturbance conditions. The developed mathematical and RSCAD model is used afterward for deriving new controls.
Currently, the HVDC system usually employs a centralized power management approach [12]. The dispatch control, which is a centralized scheme, provides the setpoints and mode of operation to the active/reactive power control (upper control). In the future, there will be a need for centralized “communication” between MTDC connected MMCs. For that purpose, an algorithm for distributed optimal power management can be used [13,14] mainly for estimation of the active/reactive power and DC voltage setpoints. The active/reactive power controls of MMC are predominantly implemented as cascaded proportional-integral (PI) controllers. The time response of these controllers is around 100 ms, which is slow, considering the fast nature of electrical transients in power systems with high RES. Additionally, the PI controllers have limited reach and can be used to control only one variable at a time—thus the research towards nonlinear control methods, which can control multiple variables, within allowable safe boundaries and constraints [15].
One promising approach for nonlinear control of power electronic converters is the model predictive control (MPC). The direct and indirect formulations of the MPC are the most appealing options for systems dominated by power electronic converters [16]. Both variants of MPC have been applied to MMC units for fast mitigation (within a few milliseconds) of frequency excursions due to sudden active power imbalances in low-inertia power systems [17,18]. Other applications of MPC for VSC units operating in interconnected power systems have been reported in [19]. In addition, the authors in [20,21] have illustrated the extension of the operating region with active and reactive power control for a single-phase MMC. However, the most challenging part of MPC is the computational burden during an online optimisation [22]. An increase in the computation burden is caused by a large combination of input sequence for the next simulation time step for the explicit MPC. This burden increases when multiple variables are simultaneously controlled.
This paper presents a variant of implicit MPC developed by employing Laguerre’s function in the formulation and solution of the discrete MMC model. The advantage of Laguerre’s function is the removal of the dependency on the control horizon of existing forms of MPC [23,24]. This lowers the computational burden. The MMC model is discretized using an exact solution of the ordinary differential equation, assuming that the state-space matrices are nearly constant during one simulation interval. The designed MPC is indirect implicit MPC. The indirect implicit MPC provides the modulating signals to the lower-level controls of the MMC unit. Lower-level controls are converting the modulating signal into the gating pulses for the semiconducting switches in the sub-modules. The advantage of implicit MPC is that the excited harmonics are near switching frequency. The proposed MPC is computational efficiency due to the small prediction horizon and lower amount of parameters. In addition, the designed MPC produces optimized modulating signals within certain safe bounds during the online cost function optimization. The bounds on constraints are applied to the rate and amplitude of modulating signals. In this paper, we are comparing MPC and PI controls both in MATLAB and in RSCAD. Designed MPC has been shown to be superior over PI control as it gives smaller overshoots and faster response to disturbances. As it is mentioned previously, the mathematical model of the MMC is programmed in MATLAB and is benchmarked in RSCAD. This model represents with sufficient detail MMC’s behavior and can be used for further dynamical operation studies.
The paper is organized as follows. Section 2 contains MMC modeling guidelines, both using a mathematical approach and in RSCAD. Section 2 is also given a comparison of PI controls for the MMC between mathematical models and RSCAD in the form of small-signal analysis. Section 3 describes the discrete MMC model, the design of implicit MPC, and the comparison of mathematical implicit MPC MMC design with RSCAD. Section 4 presents the advantages of the proposed implicit MPC control over classical PI control. The simulated cases in RSCAD are discussed in detail. Section 5 presents the concluding remarks.

2. MMC Modeling

This section provides mathematical descriptions of MMC and its classical controlling loops. Mathematical models are compared with real-time simulations using a state-of-the-art simulation tool called RSCAD, which runs on RTDS racks.

2.1. Mathematical Model of the MMC

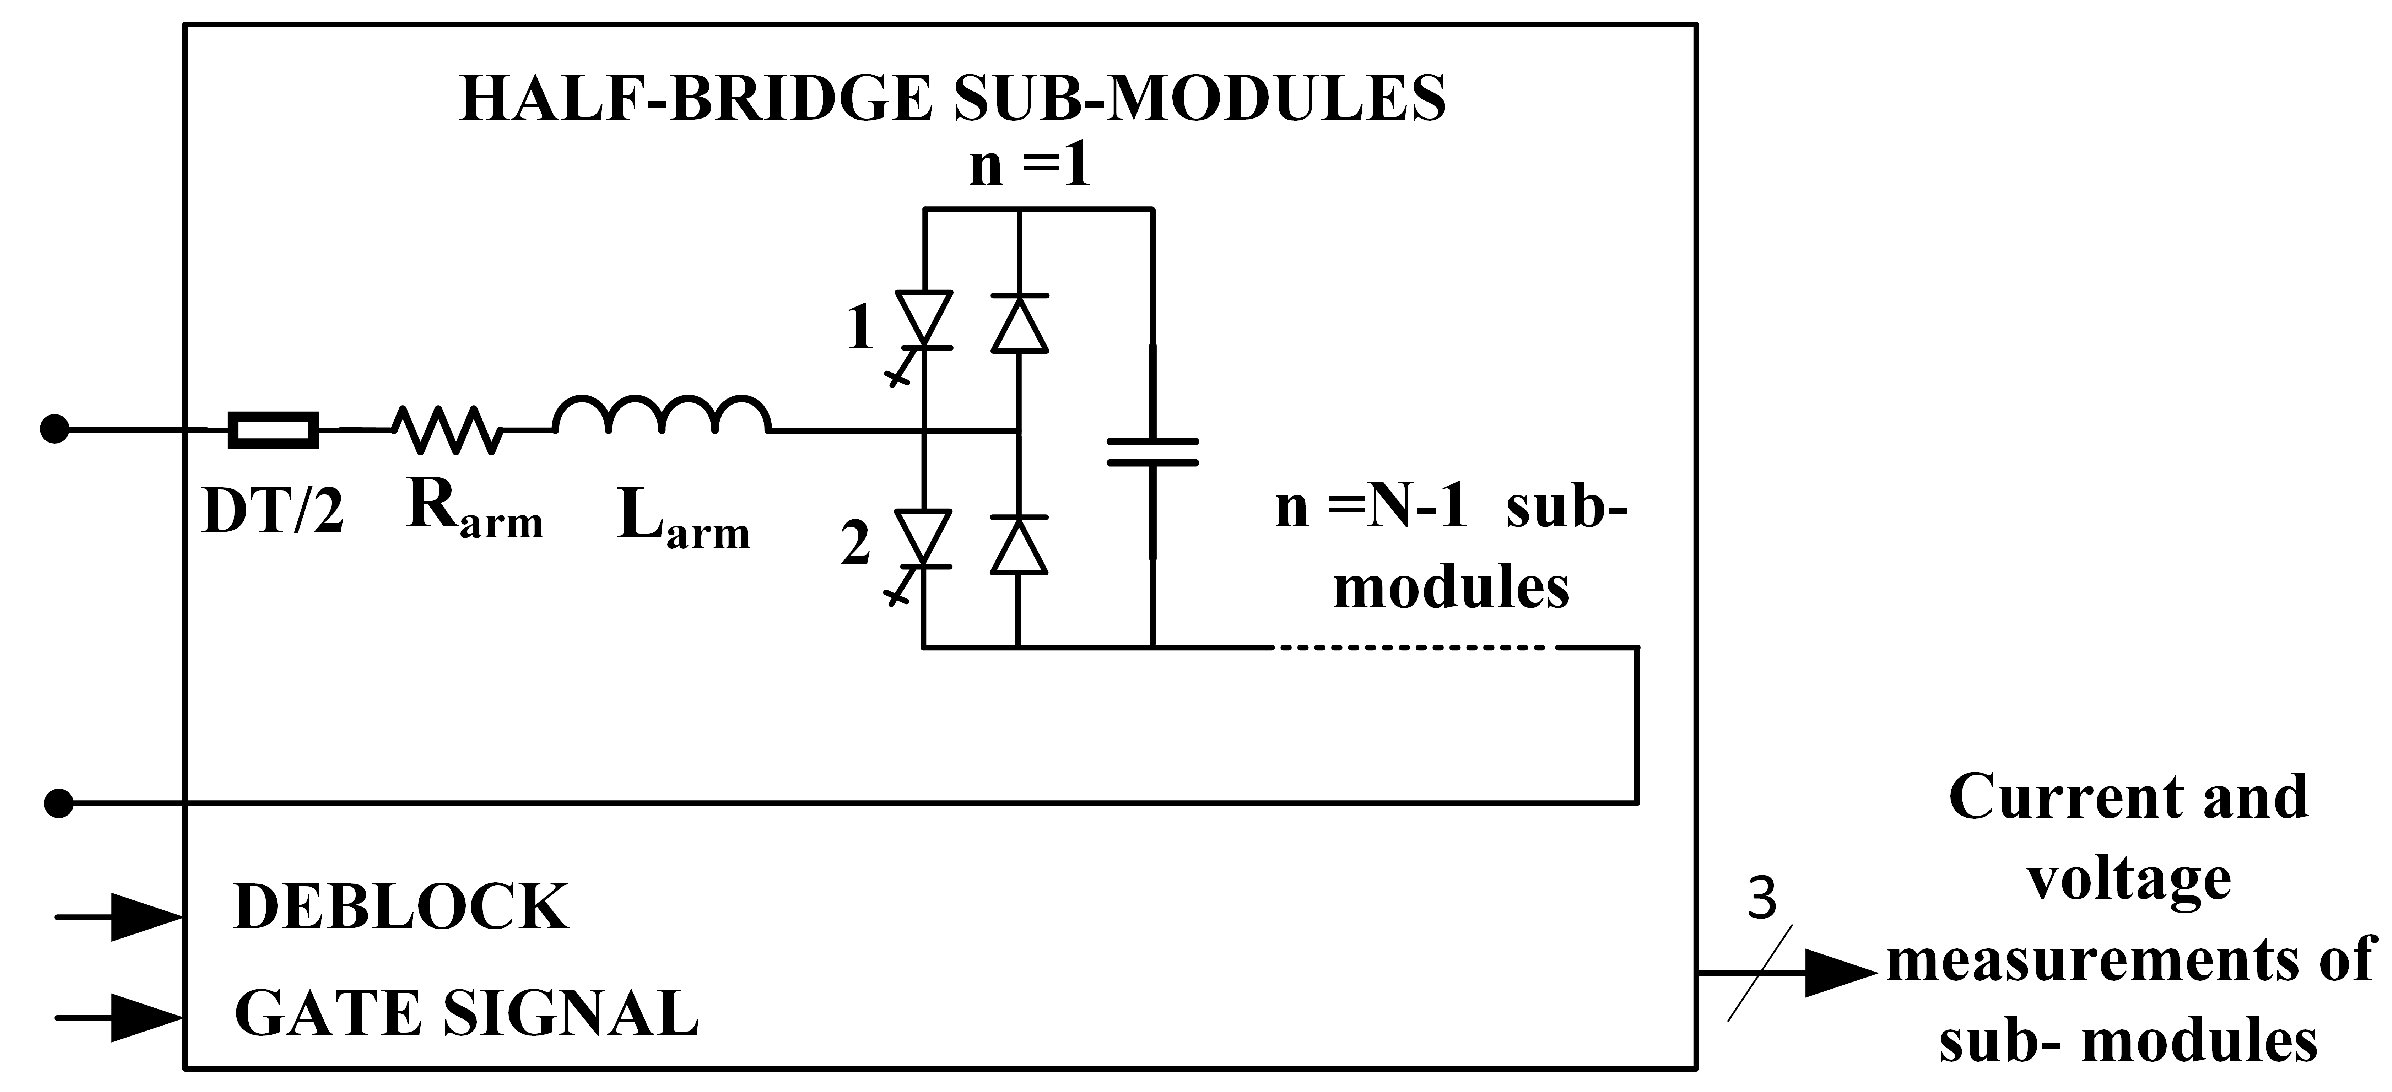
The methodology reported in [11] is used as a mathematical model of MMC. This MMC model uses multiple d q z -frames, which enables simulation both in balanced and unbalanced operating scenarios. For analysis, is considered MMC design depicted in Figure 1 is considered. Figure 1 with SMs denotes H-bridge submodules, L r and R r are the reactor’s inductance and resistance, and L a r m and R a r m are equivalent arms inductance and resistance.
In each arm, there are a N S M number of Sub-modules (SMs) connected in series. Sub-modules are modeled as average equivalent with currents and voltages given by the following equations for the upper and lower arm for each phase:
v a U , L = m a U , L v C a U , L , i a U , L = m a U , L i a U , L
v b U , L = m b U , L v C b U , L , i b U , L = m b U , L i b U , L
v c U , L = m c U , L v C c U , L , i c U , L = m c U , L i c U , L
where m a U , L , m b U , L and m c U , L are upper and lower arm insertion indices for three phases. Voltages v C j U , L , for phases j { a , b , c } , and upper U and lower L arms, are voltages of equivalent SM’s capacitance denoted as C.
The capacitor voltages and inductor currents of upper and lower arm of MMC are represented using Σ Δ nomenclature, which can be given in the following:
i j Δ = i j U i j L , i j Σ = i j U + i j L 2 ,
v C j Δ = v C j U v C j L 2 , v C j Σ = v C j U v C j L 2 ,
m j Δ = m j U m j L , m j Σ = m j U + m j L ,
v M j Δ = v M j U + v M j L 2 = ( m j Δ v C j Σ + m j Σ v C j Δ ) 2 ,
v M j Σ = v M j U + v M j L 2 = m j Σ v C j Σ + m j Δ v C j Δ 2 ,
where j { a , b , c } , which represents the three phases. Using the above definition, 12 new state variables in terms of the d q z frame can be derived as mentioned in [11], which is defined as follows:
d d t i d q Δ = v M d q Δ ω L e q a c J 2 + R e q a c I 2 i d q Δ v d q G L e q a c ,
d d t i d q Σ = v M d q Σ + R a r m I 2 2 ω L a r m J 2 i d q Σ L a r m ,
d d t i z Σ = v d c 2 L a r m v M z Σ + R a r m i z Σ L a r m ,
d d t v C d q Δ = N S M 2 C i M d q Δ ω J 2 v C d q Δ ,
d d t v C Z d q Δ = N S M 8 C Ψ 3 ω J 2 v C Z d q Δ ,
d d t v C d q z Σ = N S M 2 C i M d q z Σ + 2 ω J 3 v C Z d q z Σ ,
where
i M d q Δ = P ω t ( P 2 ω 1 t m d q z Σ P ω 1 t i d q z Δ 2 + P ω 1 t m d q z Δ P 2 ω 1 t i d q z Σ ) ,
i M d q z Σ = P 2 ω t ( P 2 ω 1 t m d q z Σ P 2 ω 1 t i d q z Σ + P ω 1 t m d q z Δ P ω 1 t i d q z Δ 2 ) ,
v M d q z Δ = P ω t 2 ( P ω 1 t m d q z Δ P 2 ω 1 t v C d q z Σ + P 2 ω 1 t m d q z Σ P ω 1 t v C d q z Δ ) ,
v M d q Σ = P 2 ω t 2 ( P ω 1 t m d q z Δ P ω 1 t v C d q z Δ + P 2 ω 1 t m d q z Σ P 2 ω 1 t v C d q z Σ ) ,
Ψ = i d Δ m d Σ + 2 i d Σ m d Δ + i q Δ m q Σ + 2 i q Σ m q Δ + 4 i z Σ m Z d Δ i q Δ m d Σ + 2 i d Σ m q Δ i d Δ m q Σ 2 i q Σ m d Δ + 4 i z Σ m Z q Δ ,
where L e q a c = L r + L a r m 2 , R e q a c = R r + R a r m 2 . Here, the P ω 0 ( t ) = 2 3 cos ( ω 0 t ) cos ω 0 t 2 π 3 cos ω 0 t 4 π 3 sin ( ω 0 t ) sin ω 0 t 2 π 3 sin ω 0 t 4 π 3 1 2 1 2 1 2 and P ω 0 1 ( t ) = 3 2 P ω 0 T ( t ) + 1 2 0 0 1 0 0 1 0 0 1 are the Park’s transformation and inverse park’s transformation at ω 0 angular frequency and ω 0 { 2 ω , ω , 3 ω } . I n is the identity matrix with an order of n × n , while matrices J 2 = 0 1 1 0 , and J 3 = 0 1 0 1 0 0 0 0 0 .

2.2. RSCAD Model of the MMC

Among the different arm models of an MMC in RSCAD, the “rtds_vsc_MMC5” model is selected. This model, depicted in Figure 2, is processor-based [25]. The chosen MMC RSCAD model is the Average Arm Model (AAM) with the features specified in [26], and it is suitable for testing the outer control strategies. It does not require extra hardware. This model consists of the automatic submodule capacitance voltage balance algorithm, and it runs at the small time step. The small-time step of RTDS lies between 1.2 µs to 2.5 µs due to the constant conductance matrix. The upper limit for sub-modules in this arm model of MMC is 512 modules.
MMC is designed with three legs connected in parallel. Each leg consists of two arms. At the midpoint of each leg, there is an interface for AC connection. The far end of the legs, i.e., upper and lower ends, are connected in series which provides a DC interface. The transformer, AC, and DC source are adopted from the small-signal models of the RSCAD database, which is reported in the [26].

2.3. Comparison between Mathematical and RSCAD Model of the MMC

A simple test system used for an MMC analysis is depicted in Figure 3. The test system consists of a 380 kV AC source as an infinite bus with zero phase shift. The AC source is connected to the MMC via a star-delta transformer, where the transformer’s star point is solidly grounded. The parameter rating of transformer and MMC are given in Table 1. To check the performance of an MMC, DC voltage is kept constant, i.e., it is represented as a DC source with 400 kV.
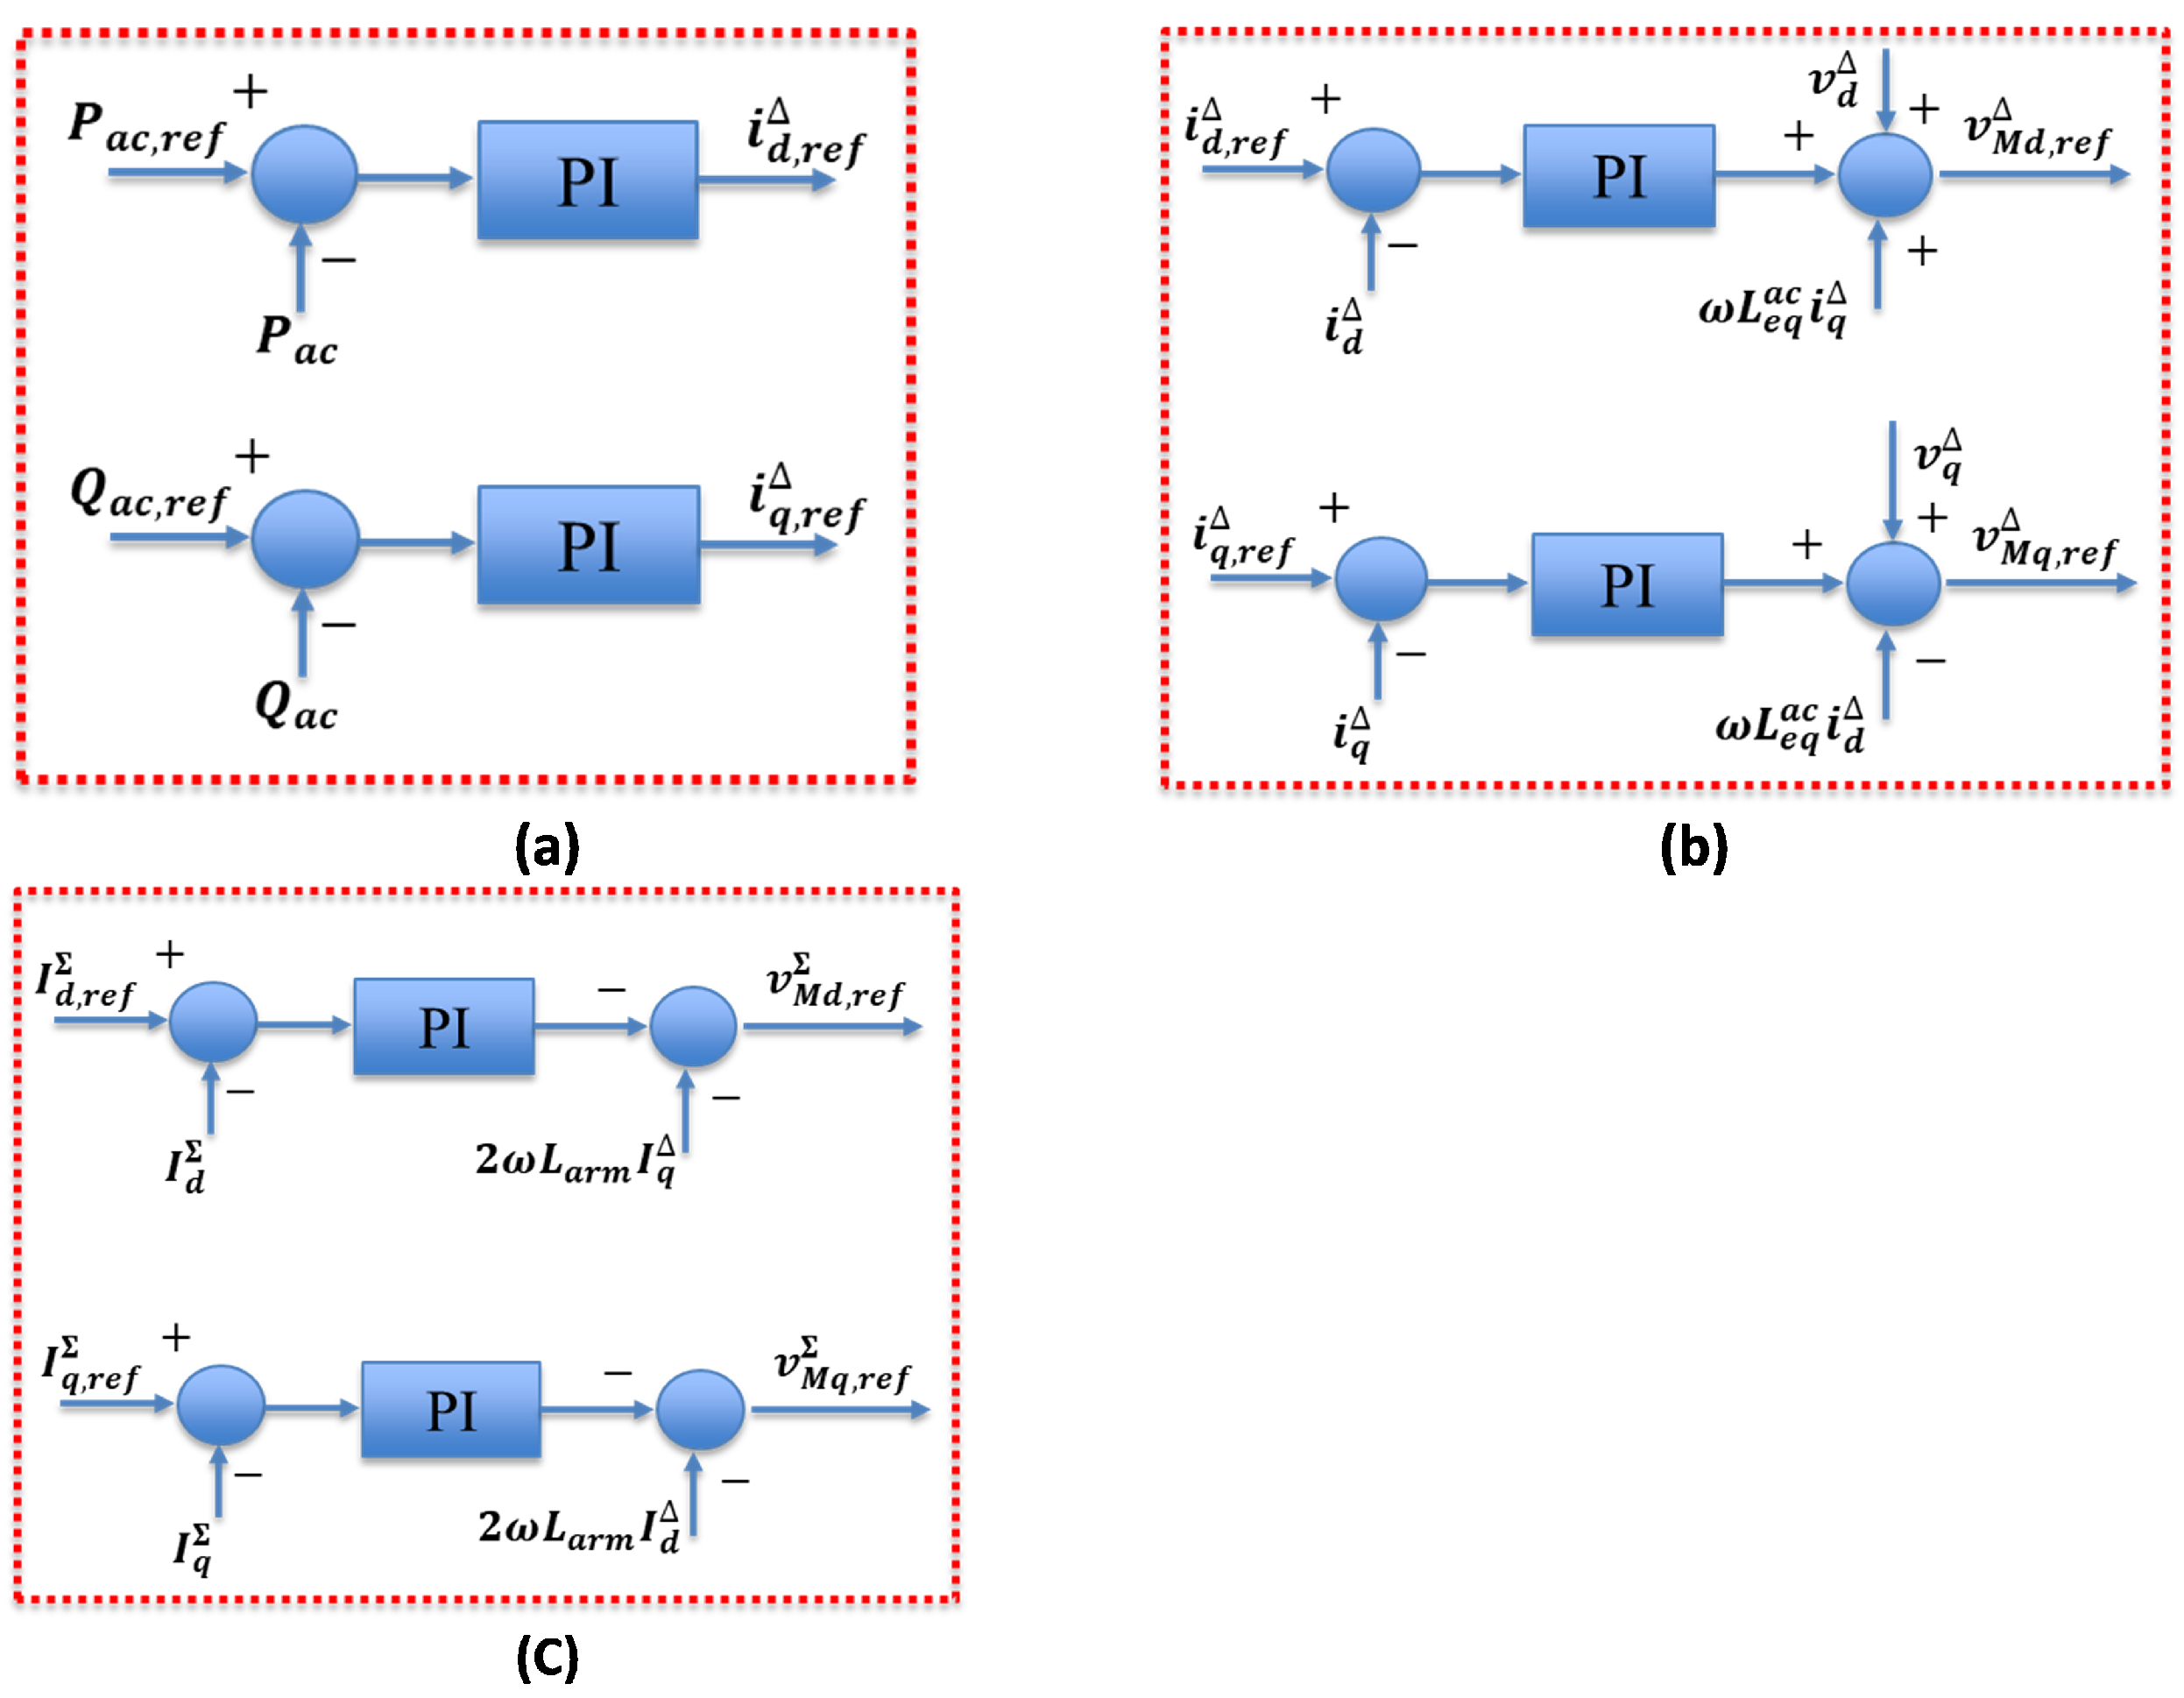
In both tools, RSCAD and MATLAB, three classical PI controlling loops for the MMC are implemented, i.e., active and reactive power control, output current control, and circulating current control. Due to the constant DC voltage and delta configuration of the converter’s transformer, the zero circulating current and energy control are not implemented. As seen from Figure 4a, active and reactive power controls provide the d and q reference for output ( Δ ) current for the subsequent control loop. The set-point for the active and reactive power control is set by the dispatch control. These d and q current reference points are converted into the modulation voltages with output current control as shown in Figure 4b. The modulated signals are further converted into gating signals by the lower-level control.
Without circulating-current-suppression control (CCSC), the MMC faces the problem of second-order harmonics in the circulating current (CC) in the steady-state. This circulating current increases net power loss in the MMC [27]. Hence, by implementing the CCSC as shown in Figure 4c, the power loss is reduced by setting the d and q circulating current components to zero. The simulated proportional and integral gain parameters for each controlling loop are given in Table 2.
The following subsections provide a comparison of simulation results for the small signal analysis and behaviour of the system in case of small signal disturbance and model error analysis.

2.3.1. Small Signal Analysis

In order to benchmark the mathematical model of the MMC with its RSCAD implementation, we are providing small signal comparisons. All simulations are done considering classical PI controlling loops for the MMC.

Active Power Step Change

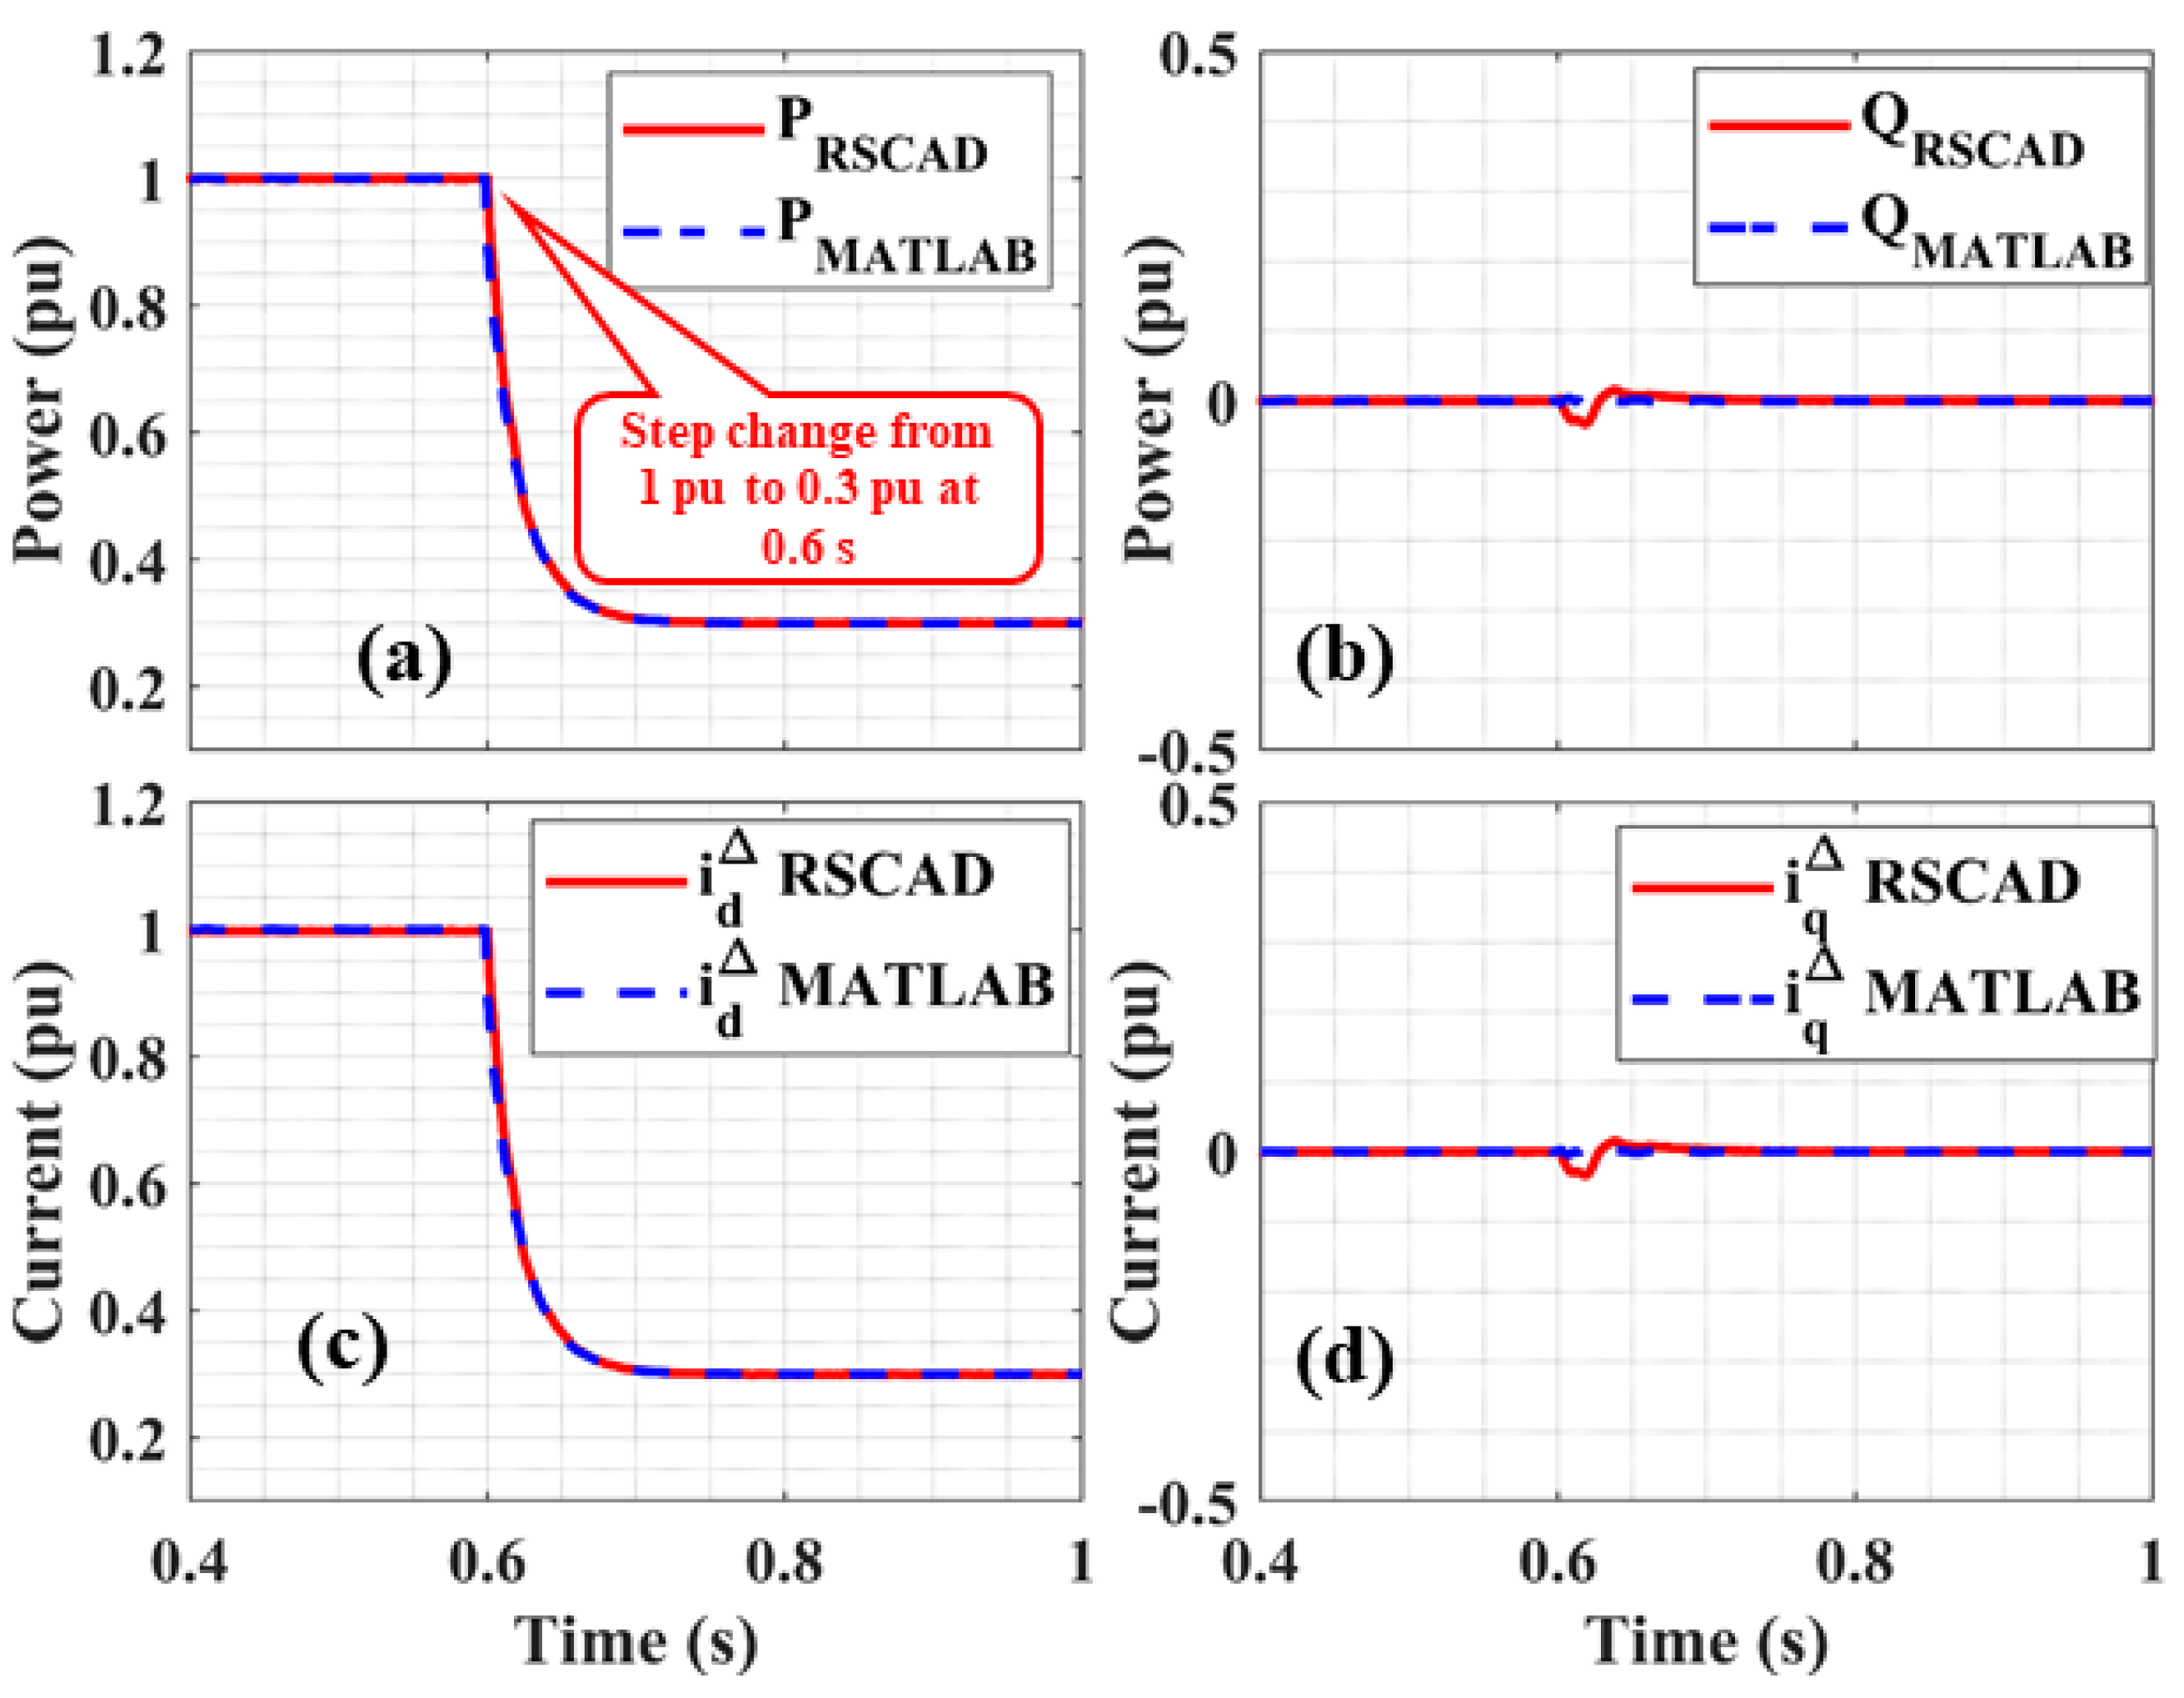
The behaviour of the MMC during the active power step change, by changing the reference i d Δ from 1 p.u. to 0.3 p.u. at the time instance t = 0.6 s , is observed. In this paragraph, all diagrams are given in MATLAB and RSCAD with blue and red lines, respectively. In both models, MATLAB and RSCAD, active power diagrams overlap with each other during the steady-state and transient as seen from Figure 5a,c. However, due to the reactive and active powers decoupling, a change in the reactive power and q component of grid current, i q Δ , is not observed.
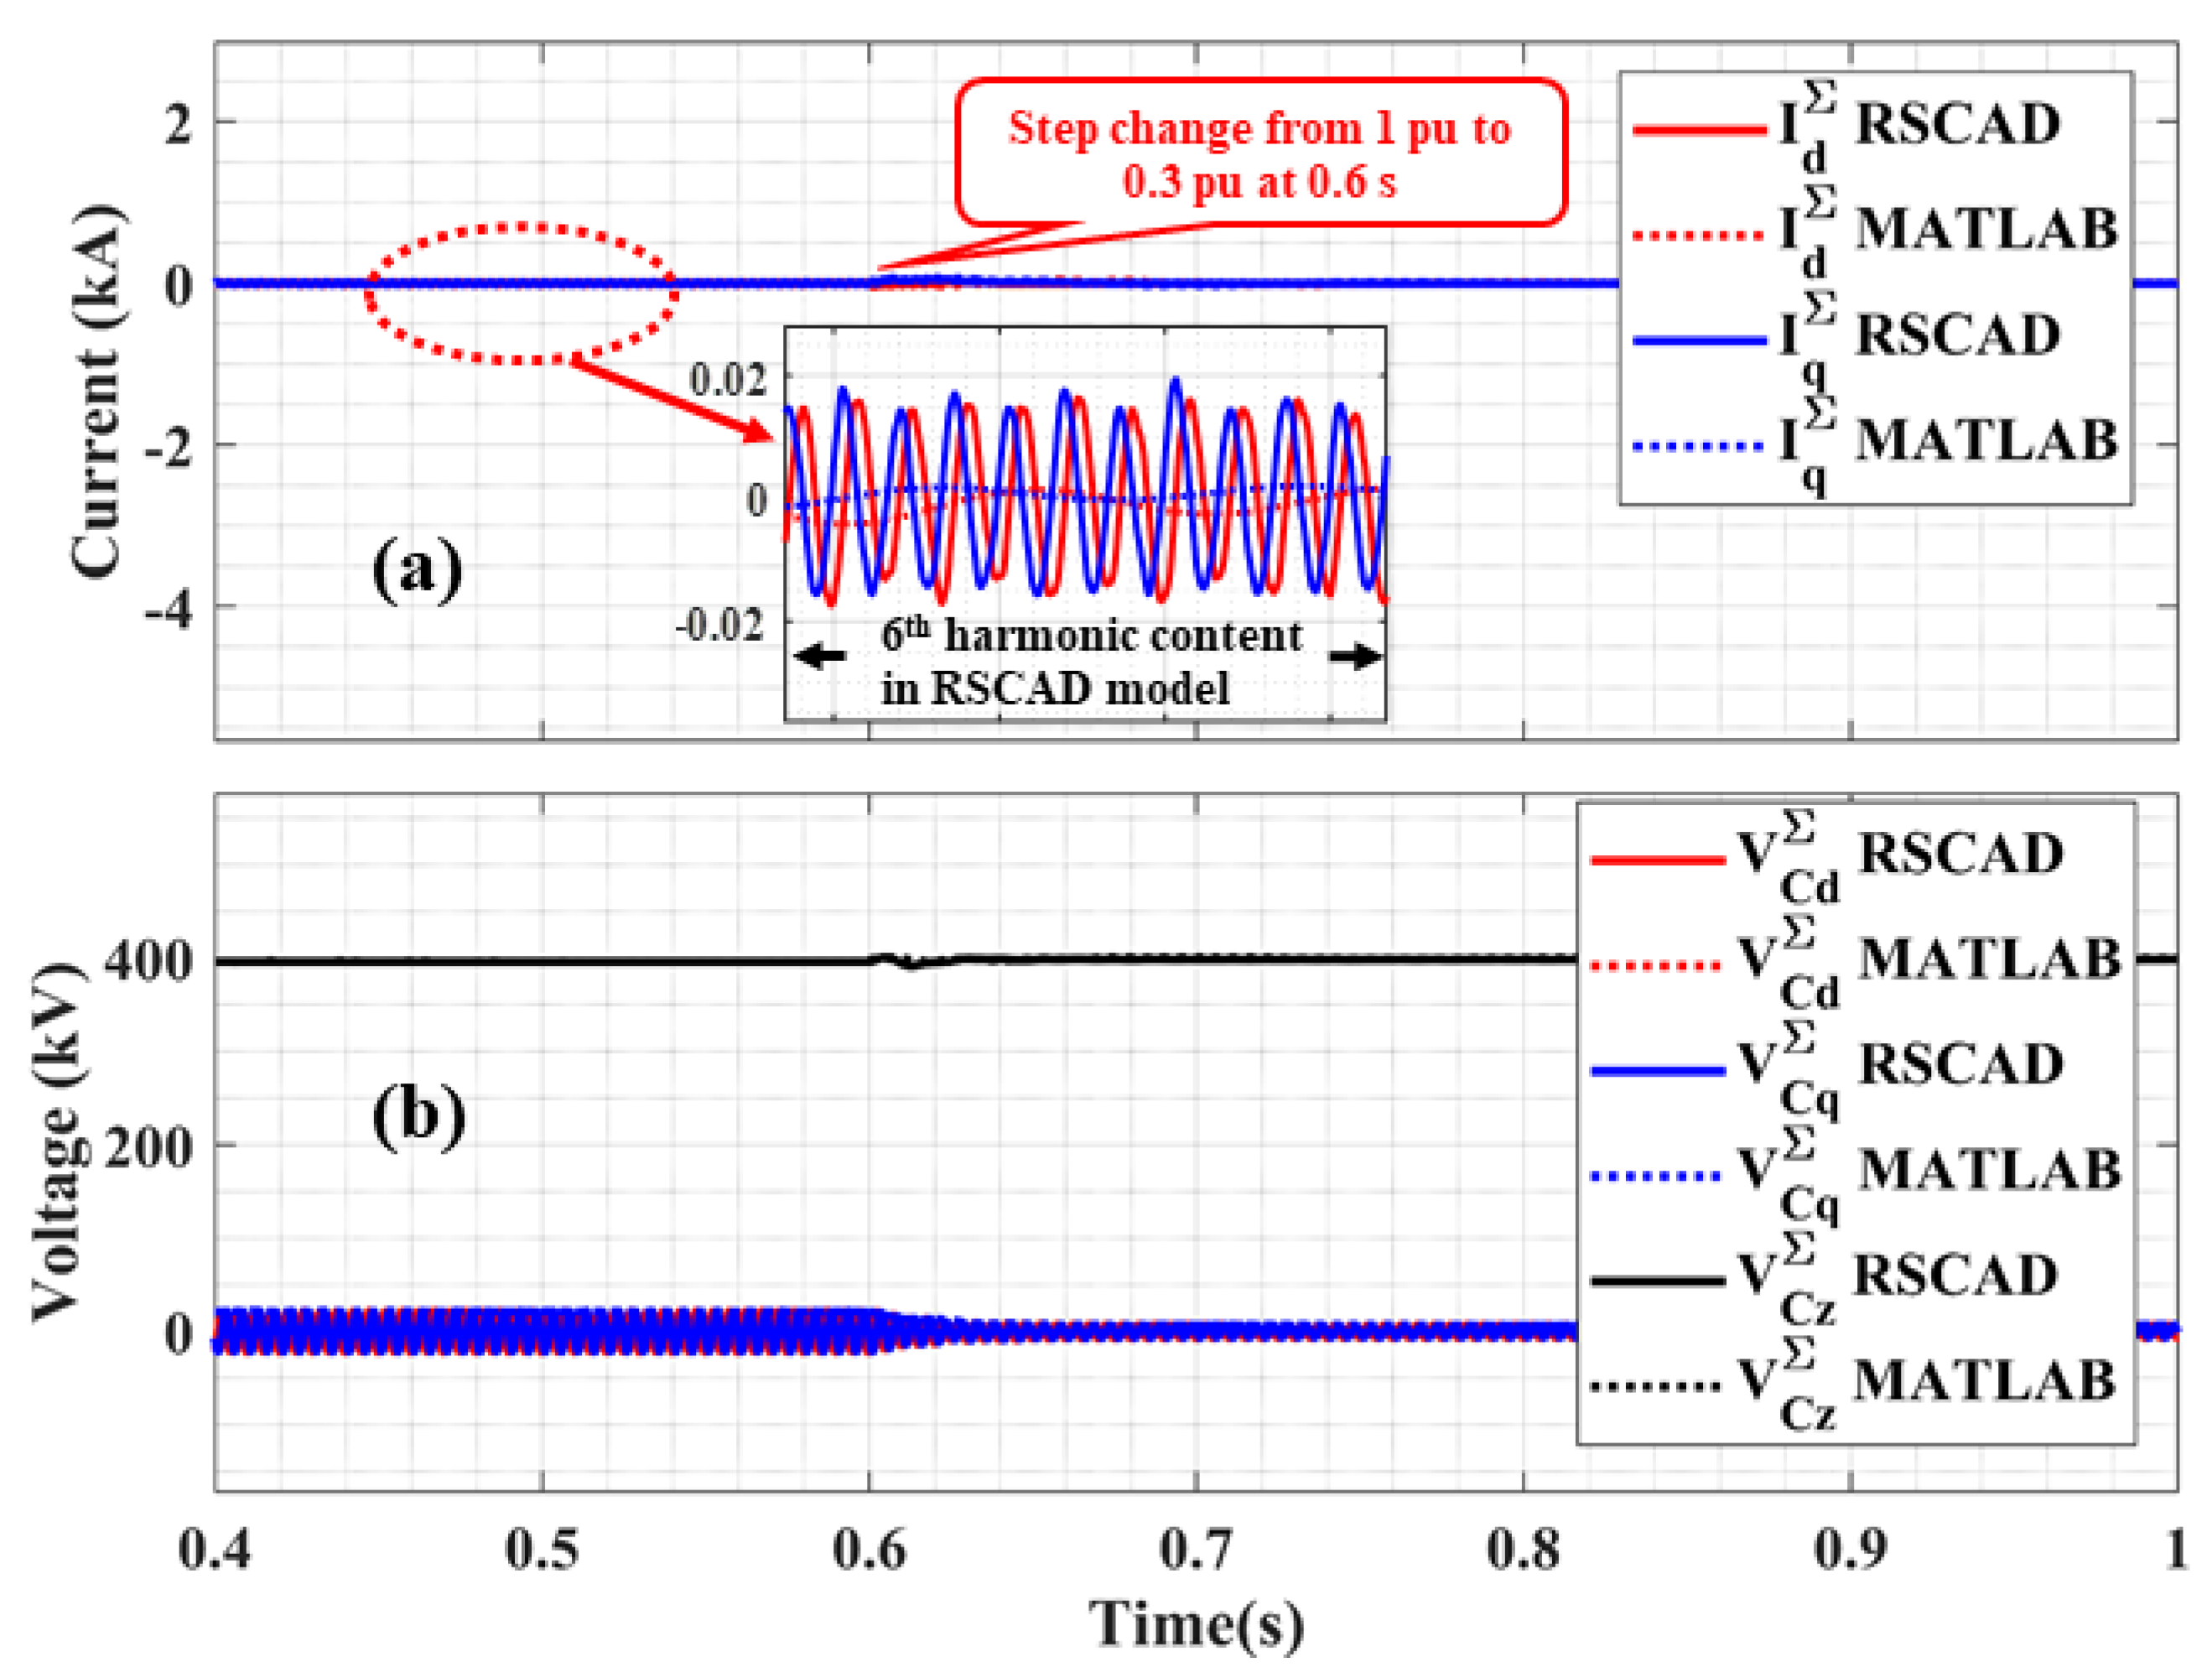
In the simulations, the circulating currents are set to zero, to achieve circulating current suppression control effect (see Figure 6a). However, it is observed that, in the RSCAD circulating currents, i d , q Σ contain the 6th harmonic. This harmonic component is absent in the mathematical model, which, for the simplicity of representation, uses only DC values, and harmonic components on 3 ω , 2 ω and ω for ω being line angular frequency. During the change in active power, the circulating current remains zero as observed in Figure 6a.
The Σ -components of the arm capacitor voltages, v d , q , z Σ , are illustrated in Figure 6b. It can be observed that the z component of the arm capacitor voltage is equal to the DC-link voltage for both models. As explained in the paragraph above, the RSCAD model contains the 6th harmonic, which is absent in the mathematical model. With the change in the active power’s set point, the amplitude of the d and q components of arm capacitor voltage reduces as observed in Figure 6b. Moreover, with the constant DC voltage, the z component is not affected by this change.
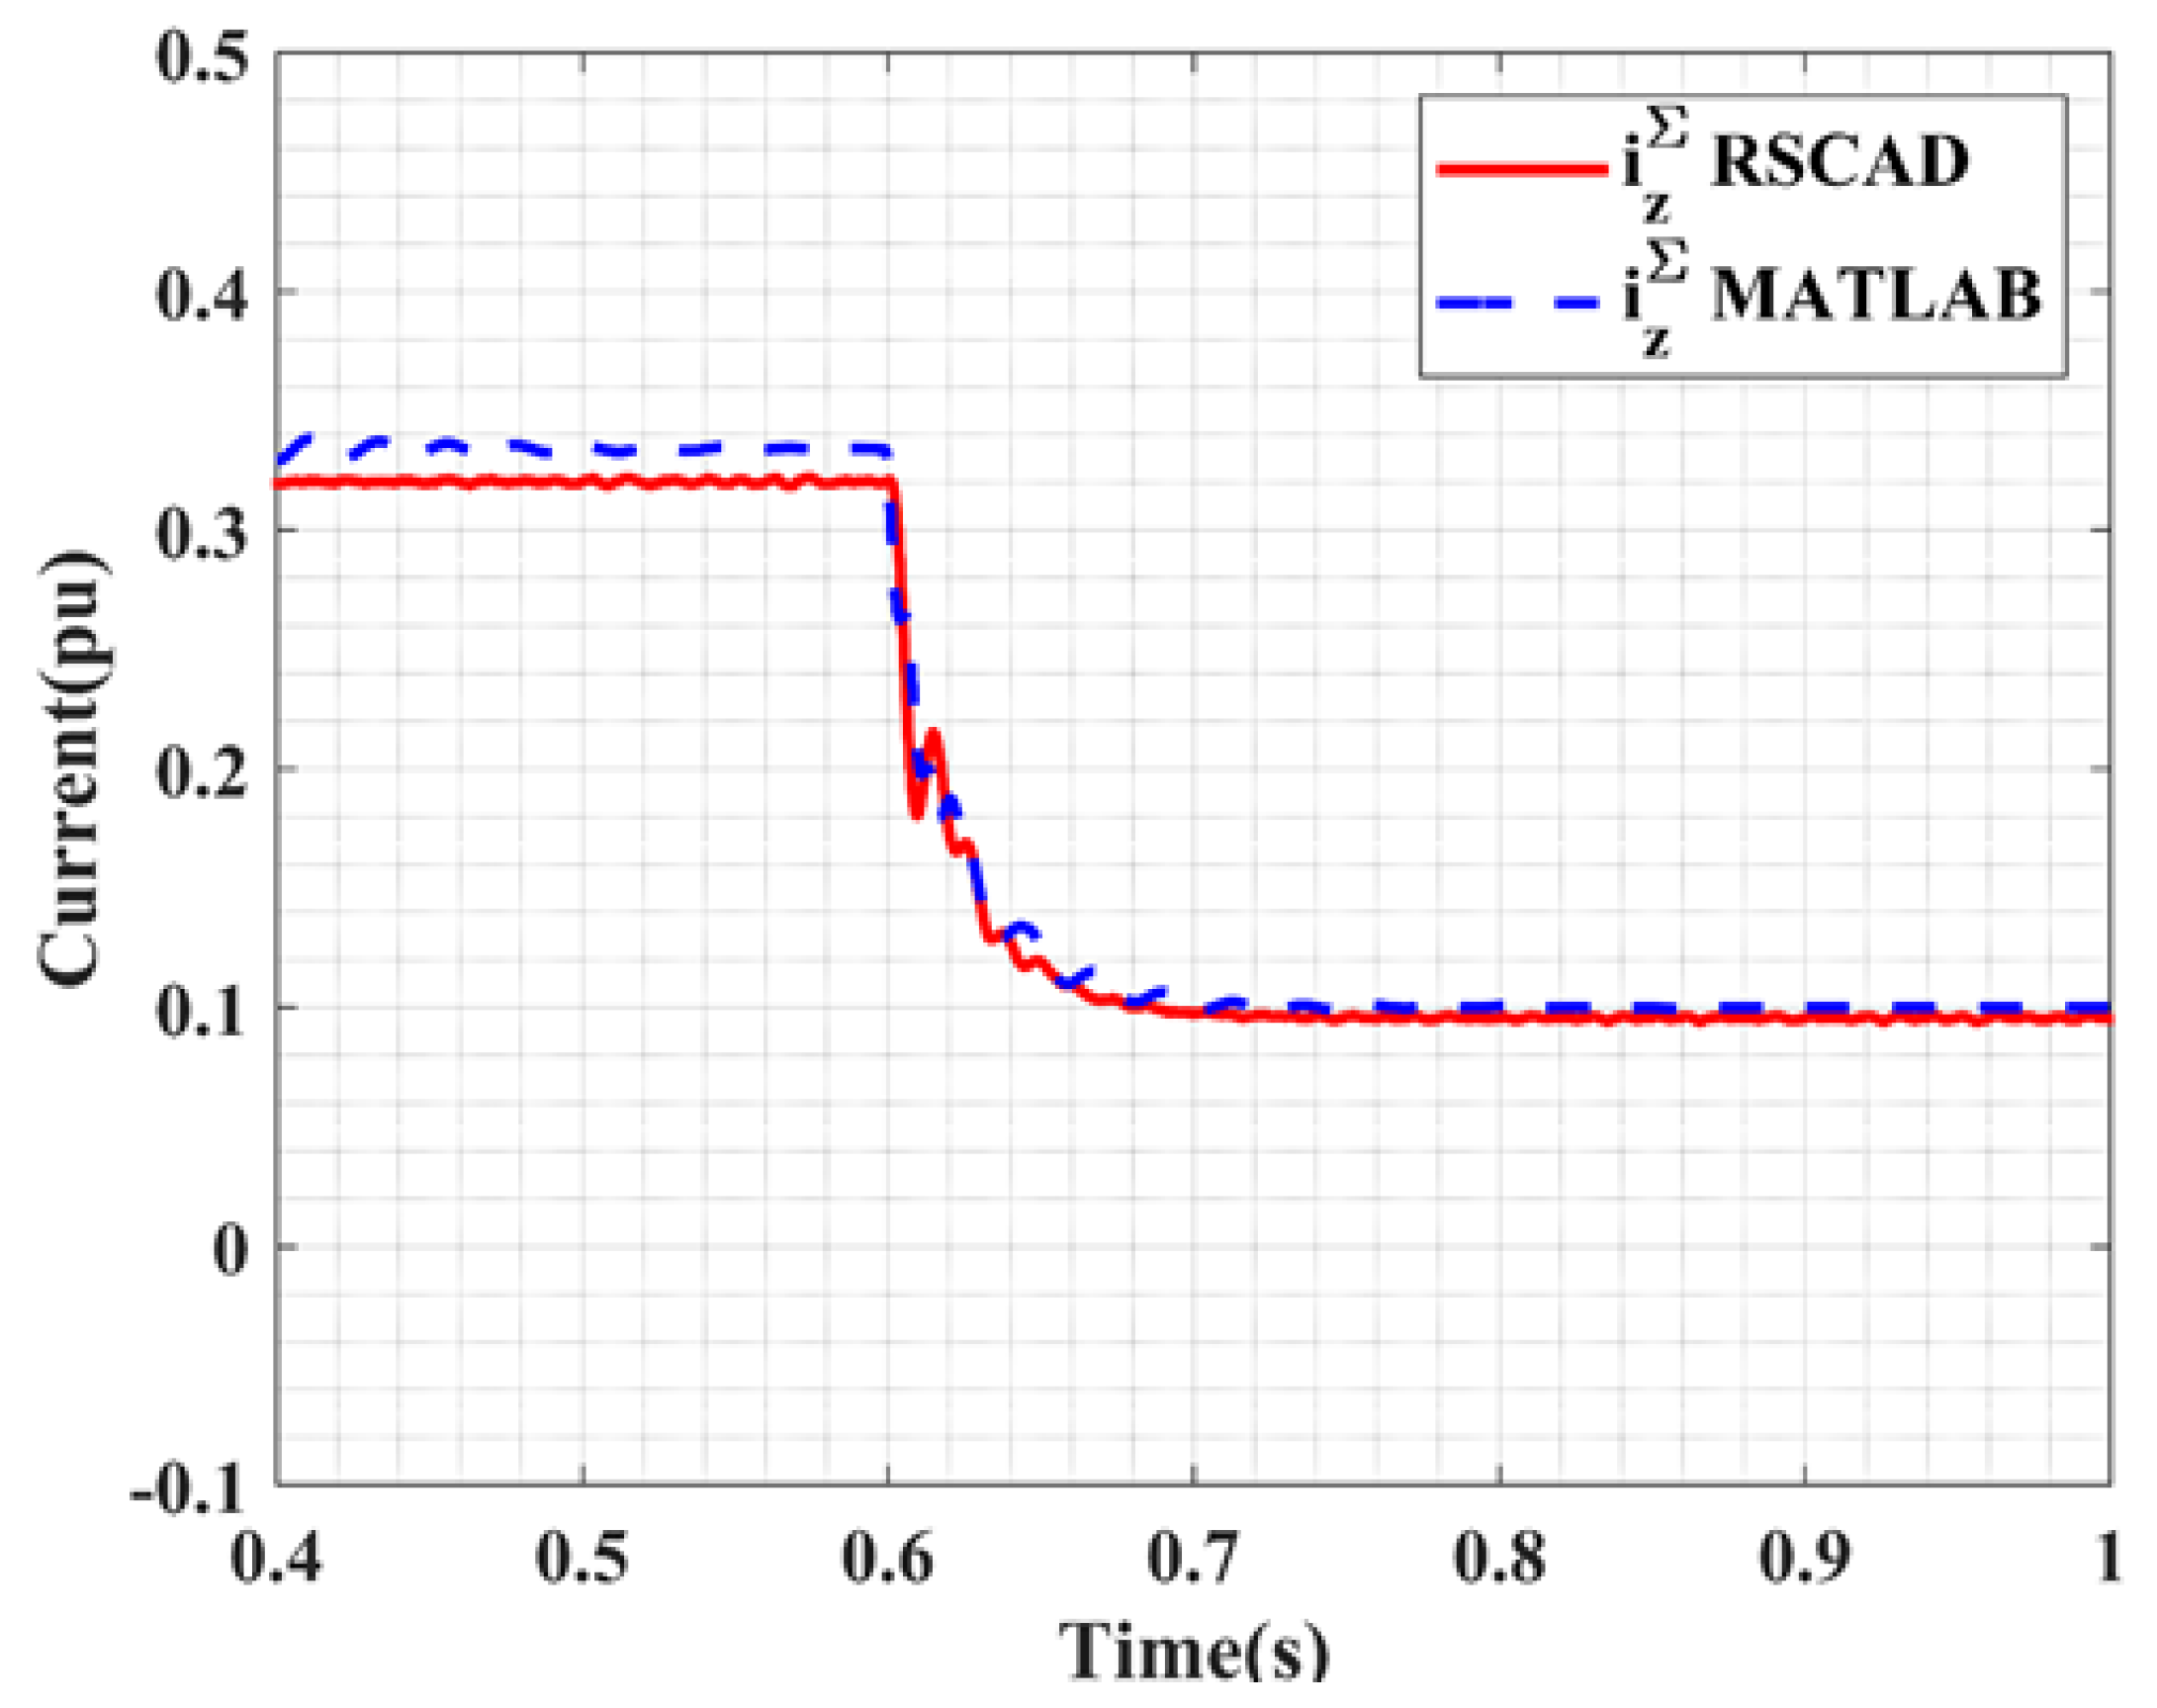
Figure 7 indicates the effect of the change in the active power on the circulating current i z Σ . Due to the change in the active power reference, the amplitude of the i z Σ reduces. As observed in both models, the current follows the same profile during the steady and transition state. MMC’s DC current will be i d c = 3 i z Σ , which is in this case 2 kA at rated power and 0.6 kA at 240 MW.

Reactive Power Step Change

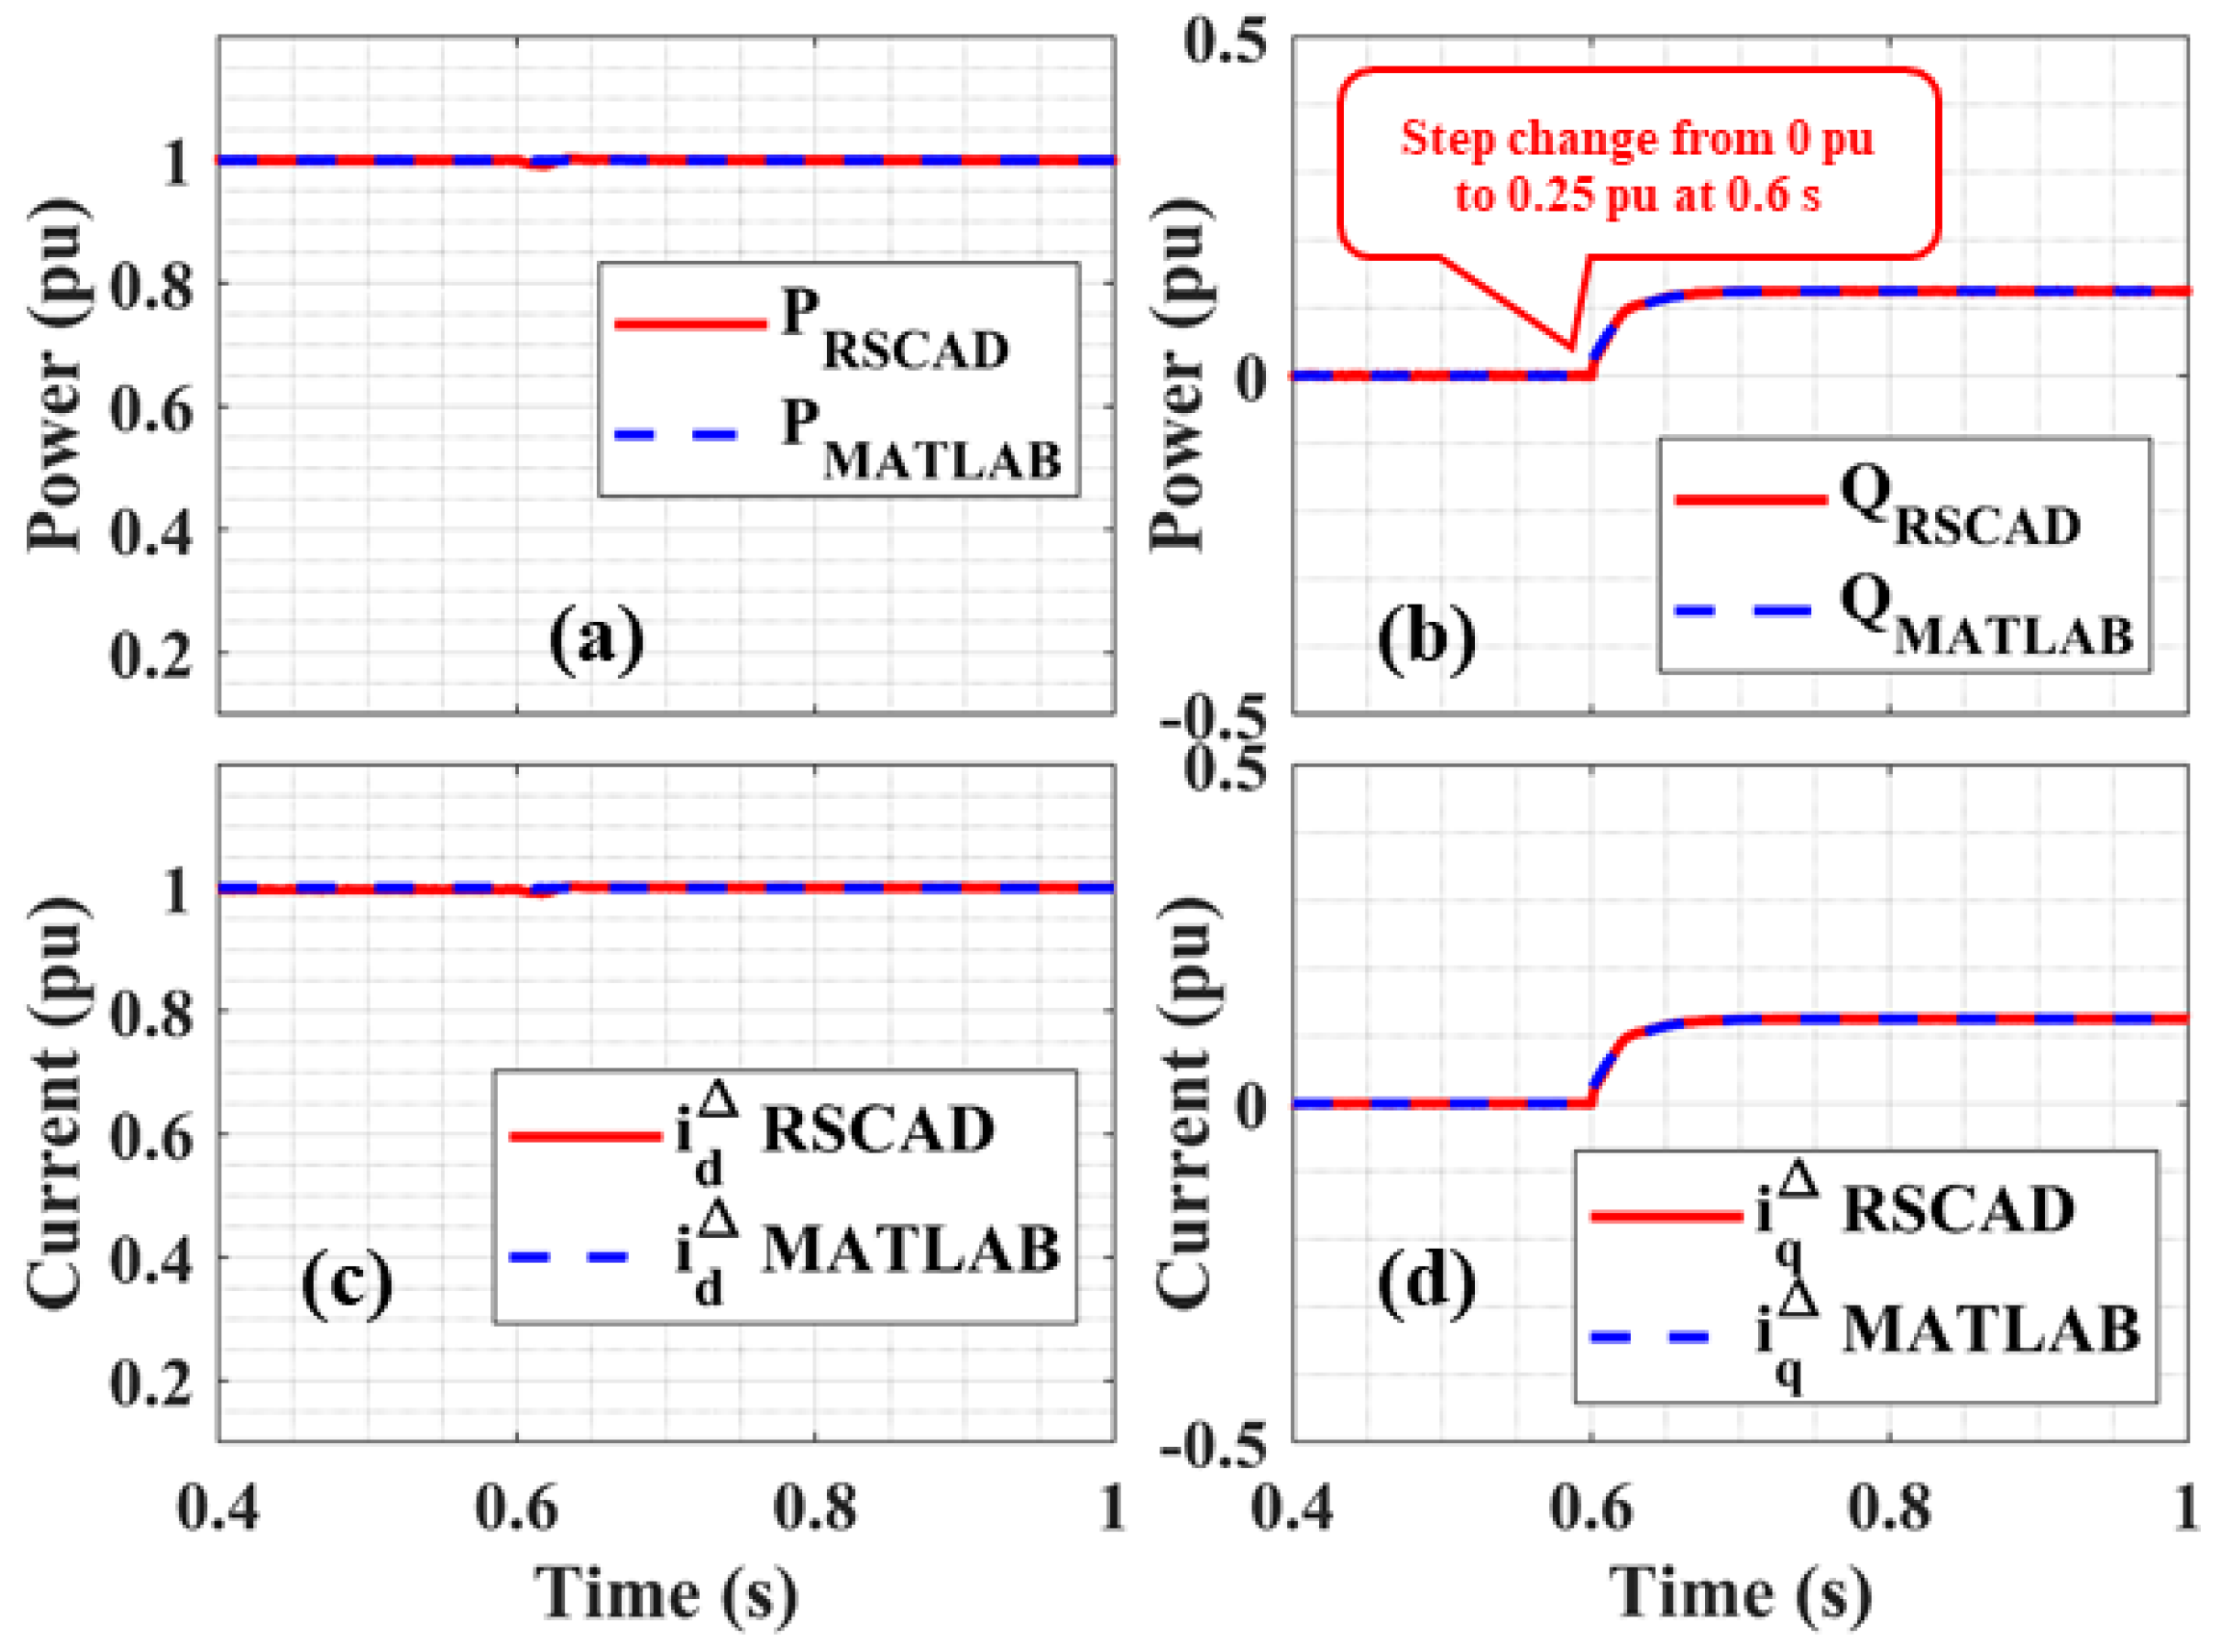
Figure 8 illustrates the effect of the reactive power change from 0 p.u. to 0.25 p.u. As observed in Figure 8b,d, reactive power and the grid current’s component i q Δ overlap for both models. Similarly, due to the decoupling nature of d q components, the change in reactive power does not affect the active power as seen in Figure 8a,c.
As discussed in the previous paragraphs, a change in reactive power does not influence the d q z circulating current components, as can be seen in Figure 9a. Similarly, with the change in reactive power’s set point, the Σ component of the arm capacitance remains constant and equal to the voltage of DC link, as observed in Figure 9b.

Active Power Reversal

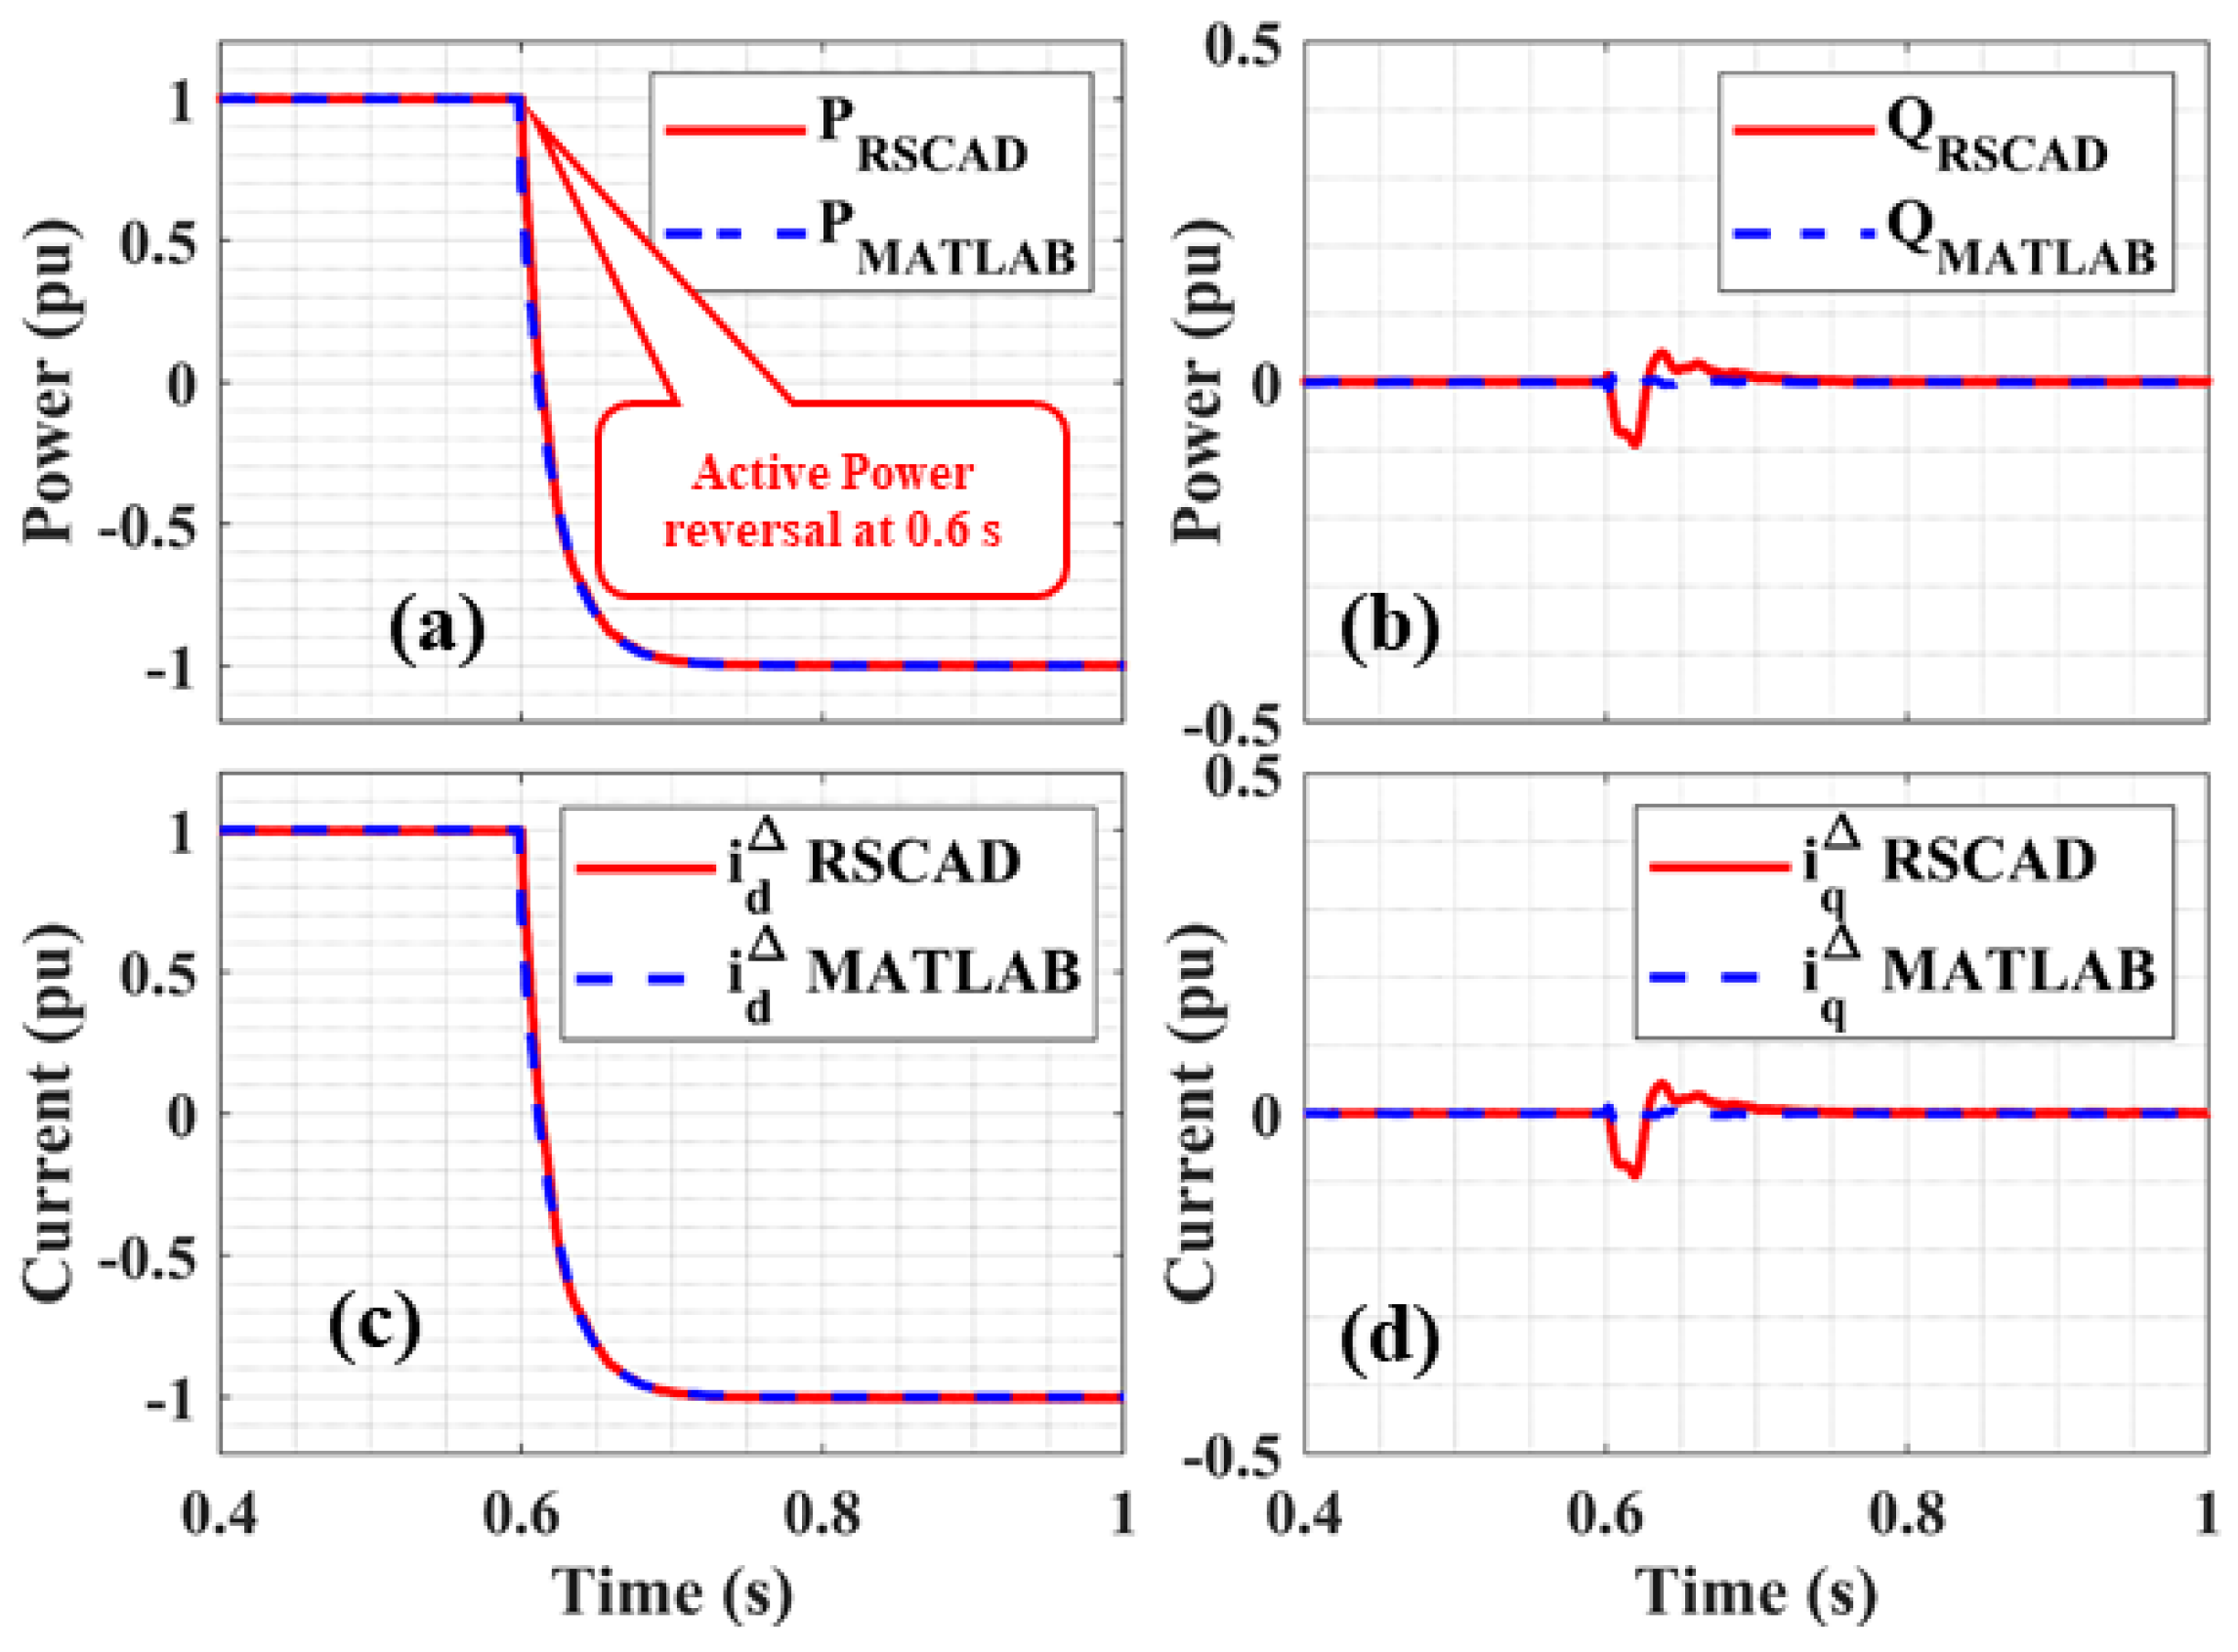
In the pre-disturbance stage, active power is transferred from the DC source to the AC system. However, with the active power reversal at the time instance t = 0.6 s , the power direction changes, as it is shown in Figure 10a. In both models, the same response is observed. The transition period for both models is approximately 100 ms. It is equal to the time constant of the active power controlling loop. Even with the decoupling of the active and reactive power components, there is a small variation in reactive power during this transition. This is due to the uncompensated modulation of an MMC in both models.
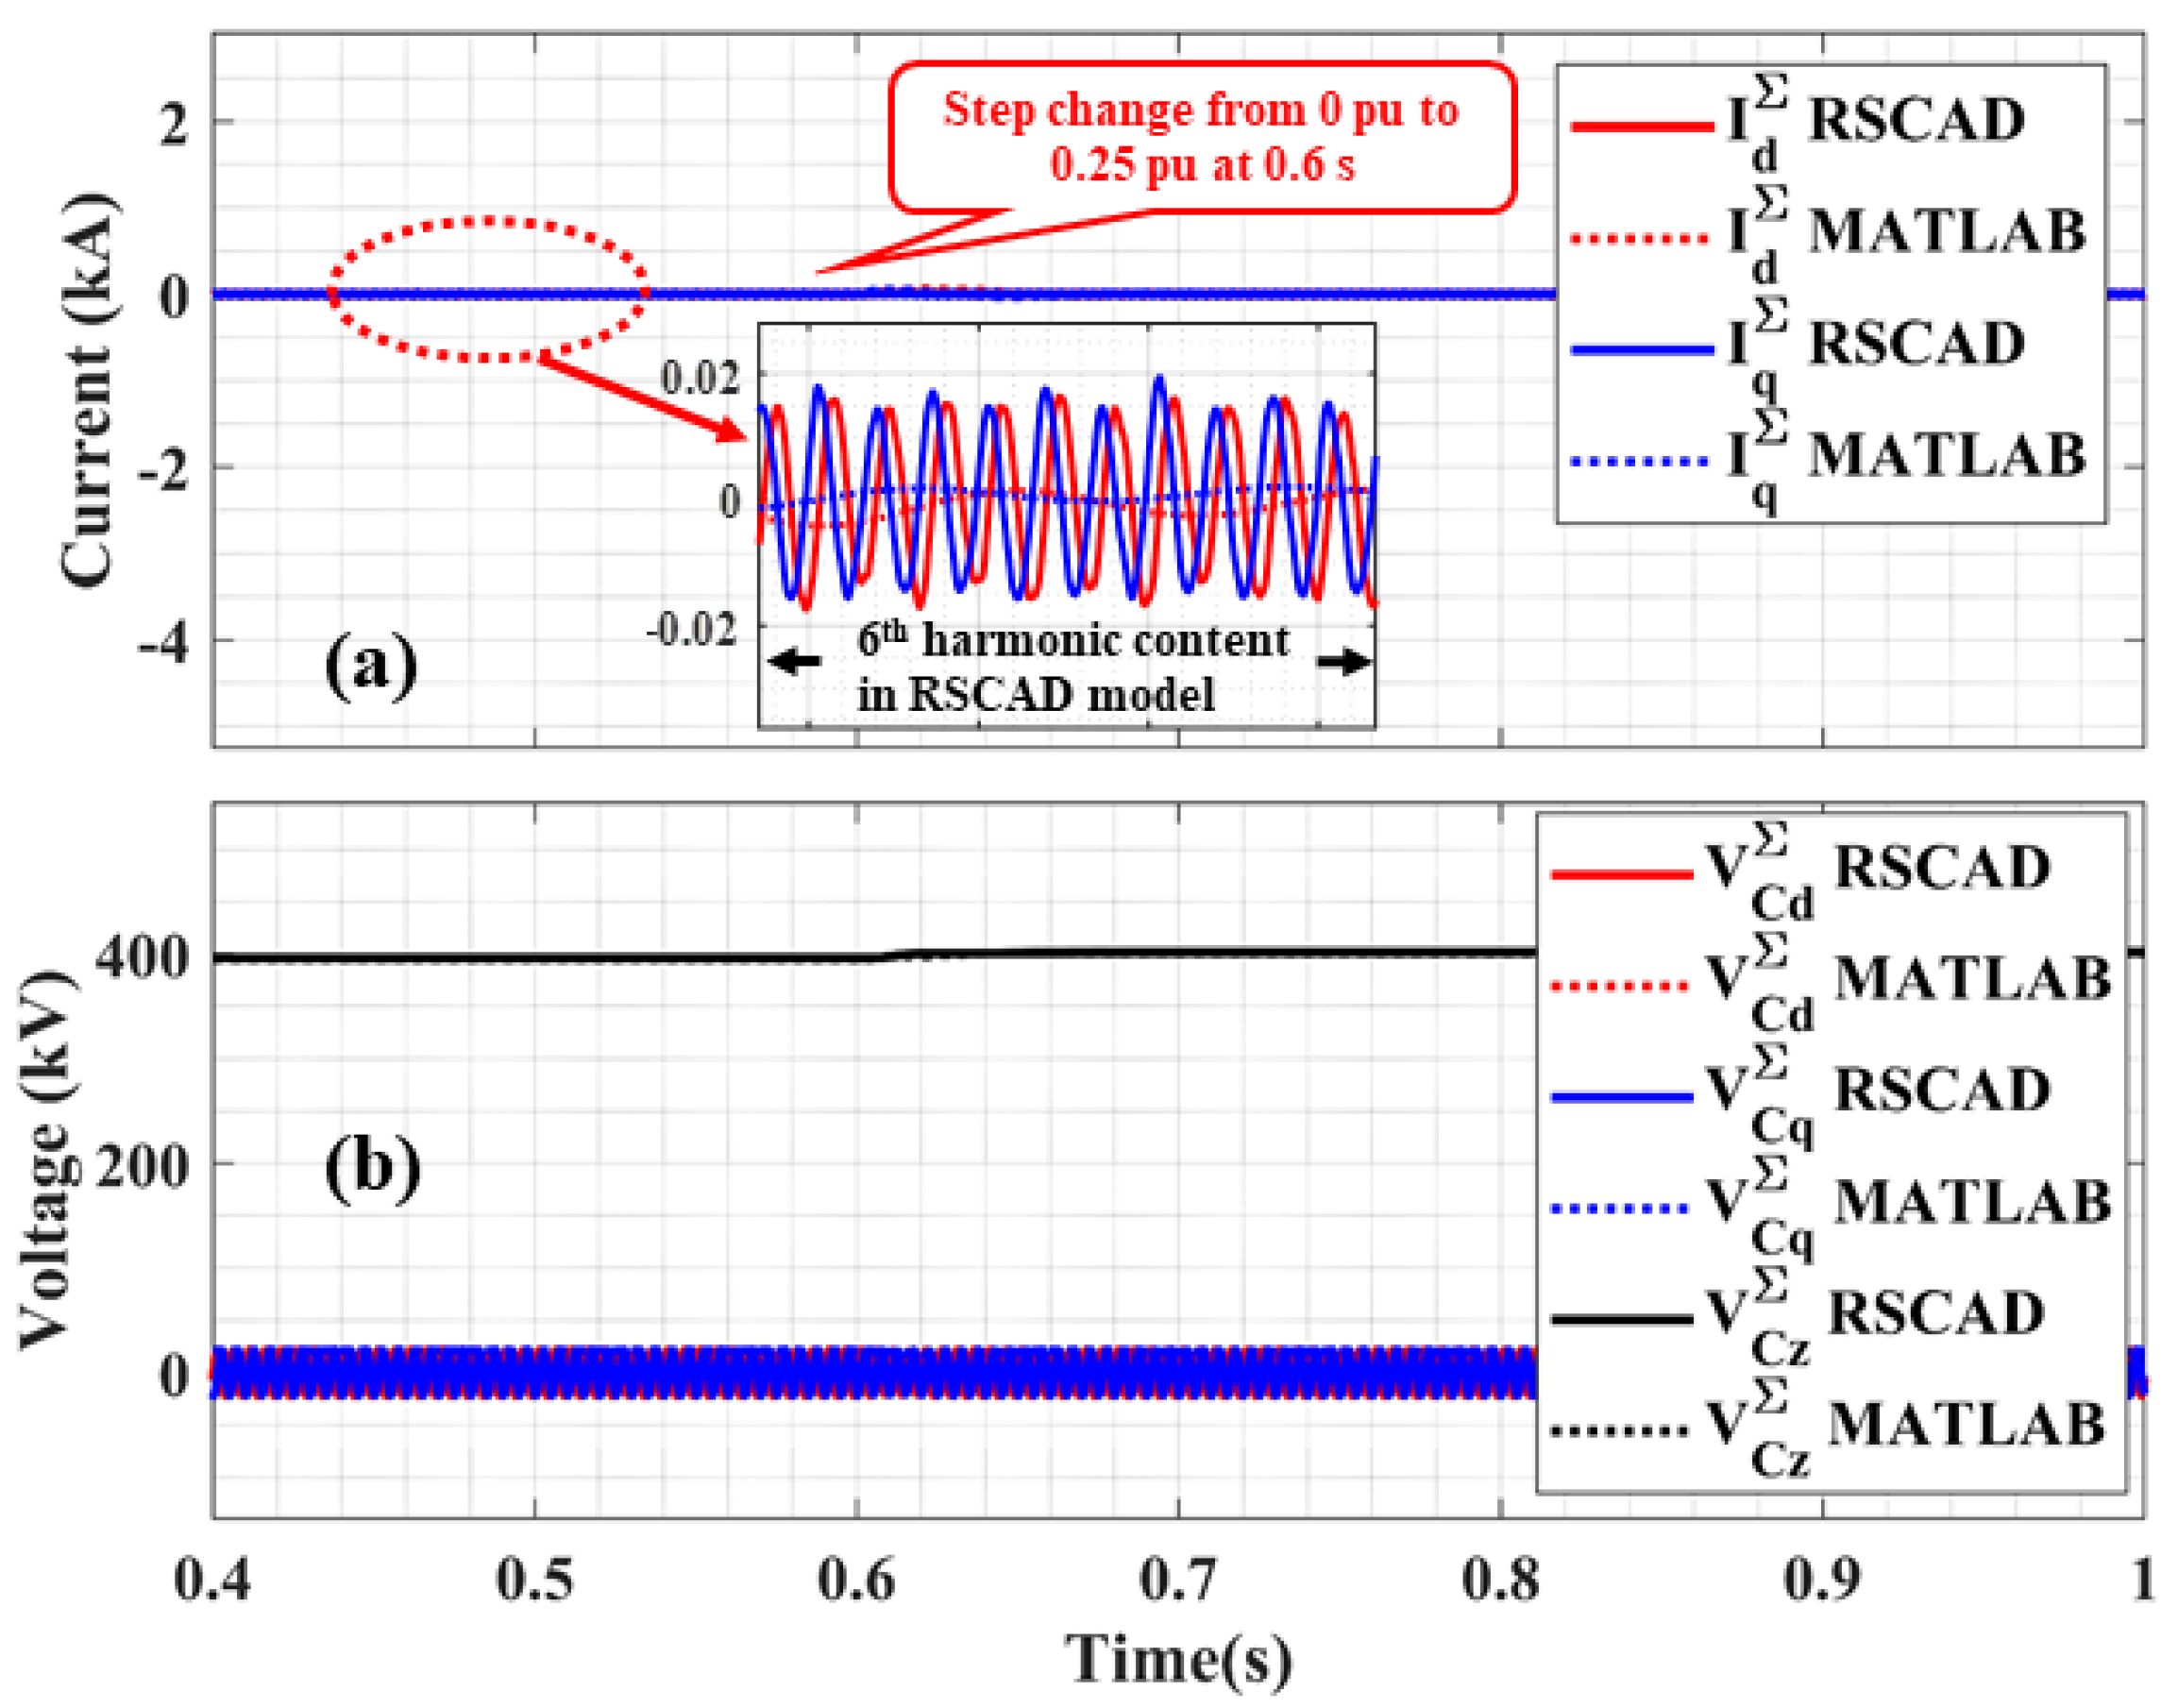
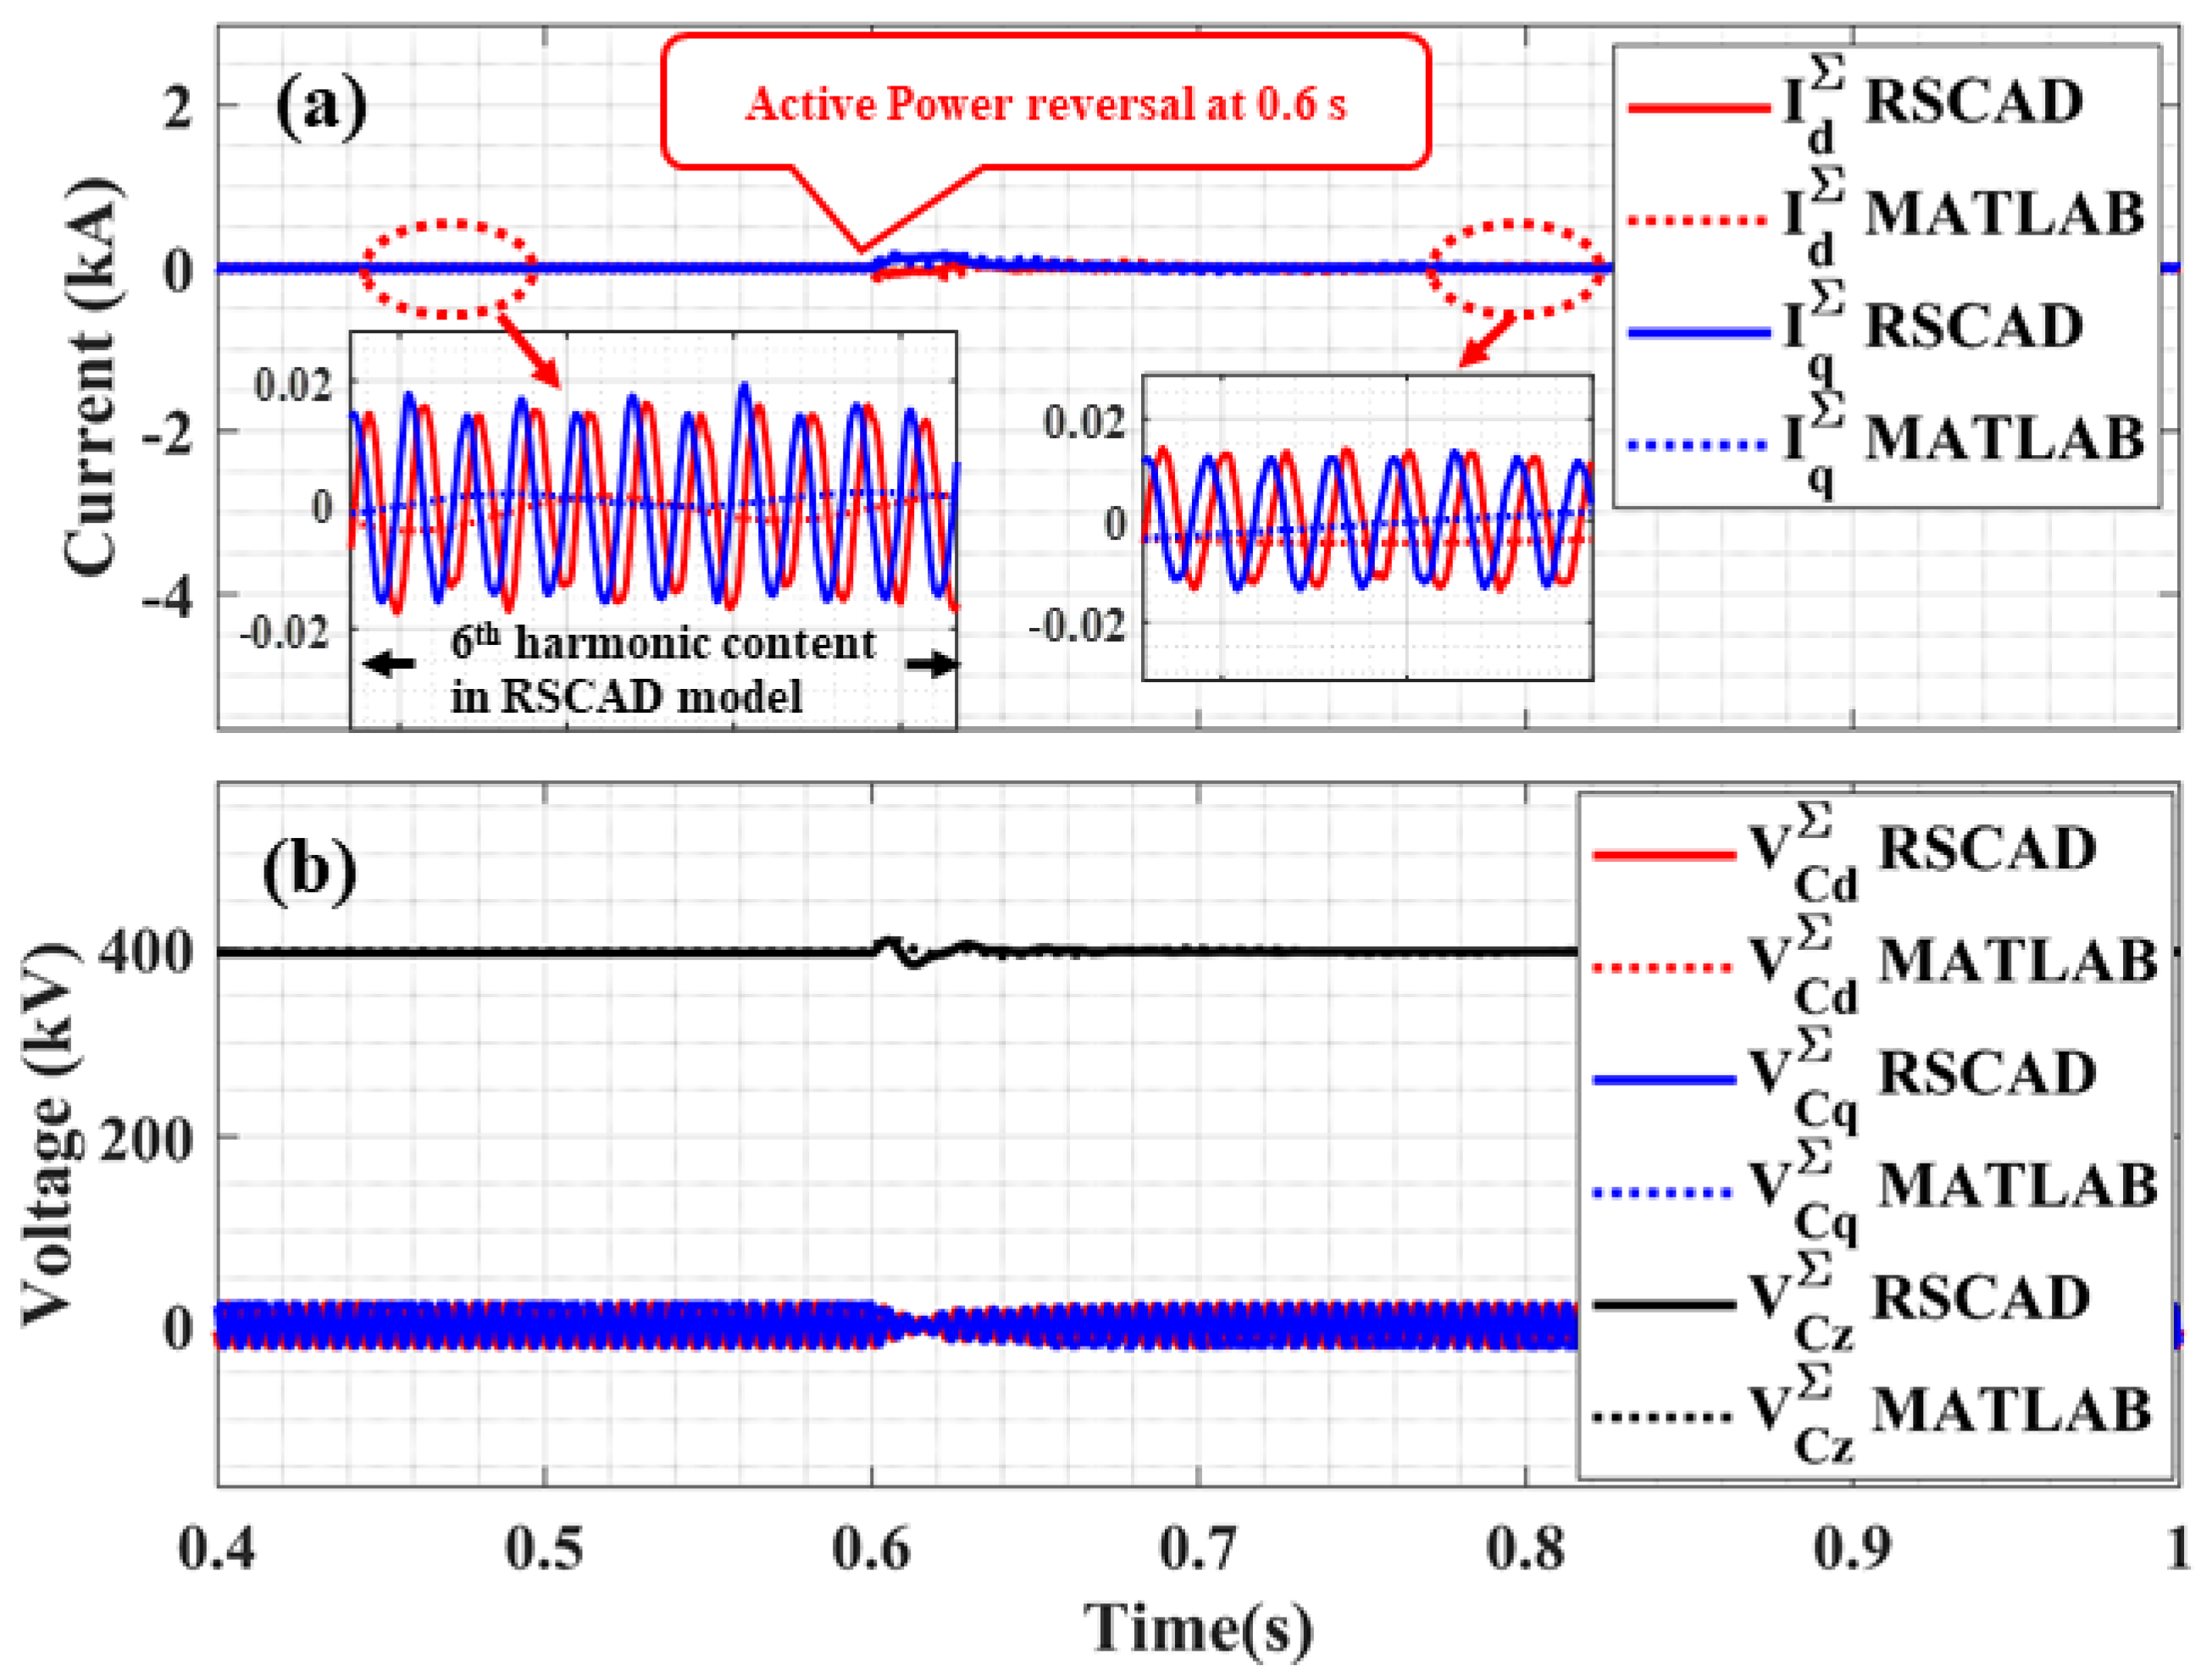
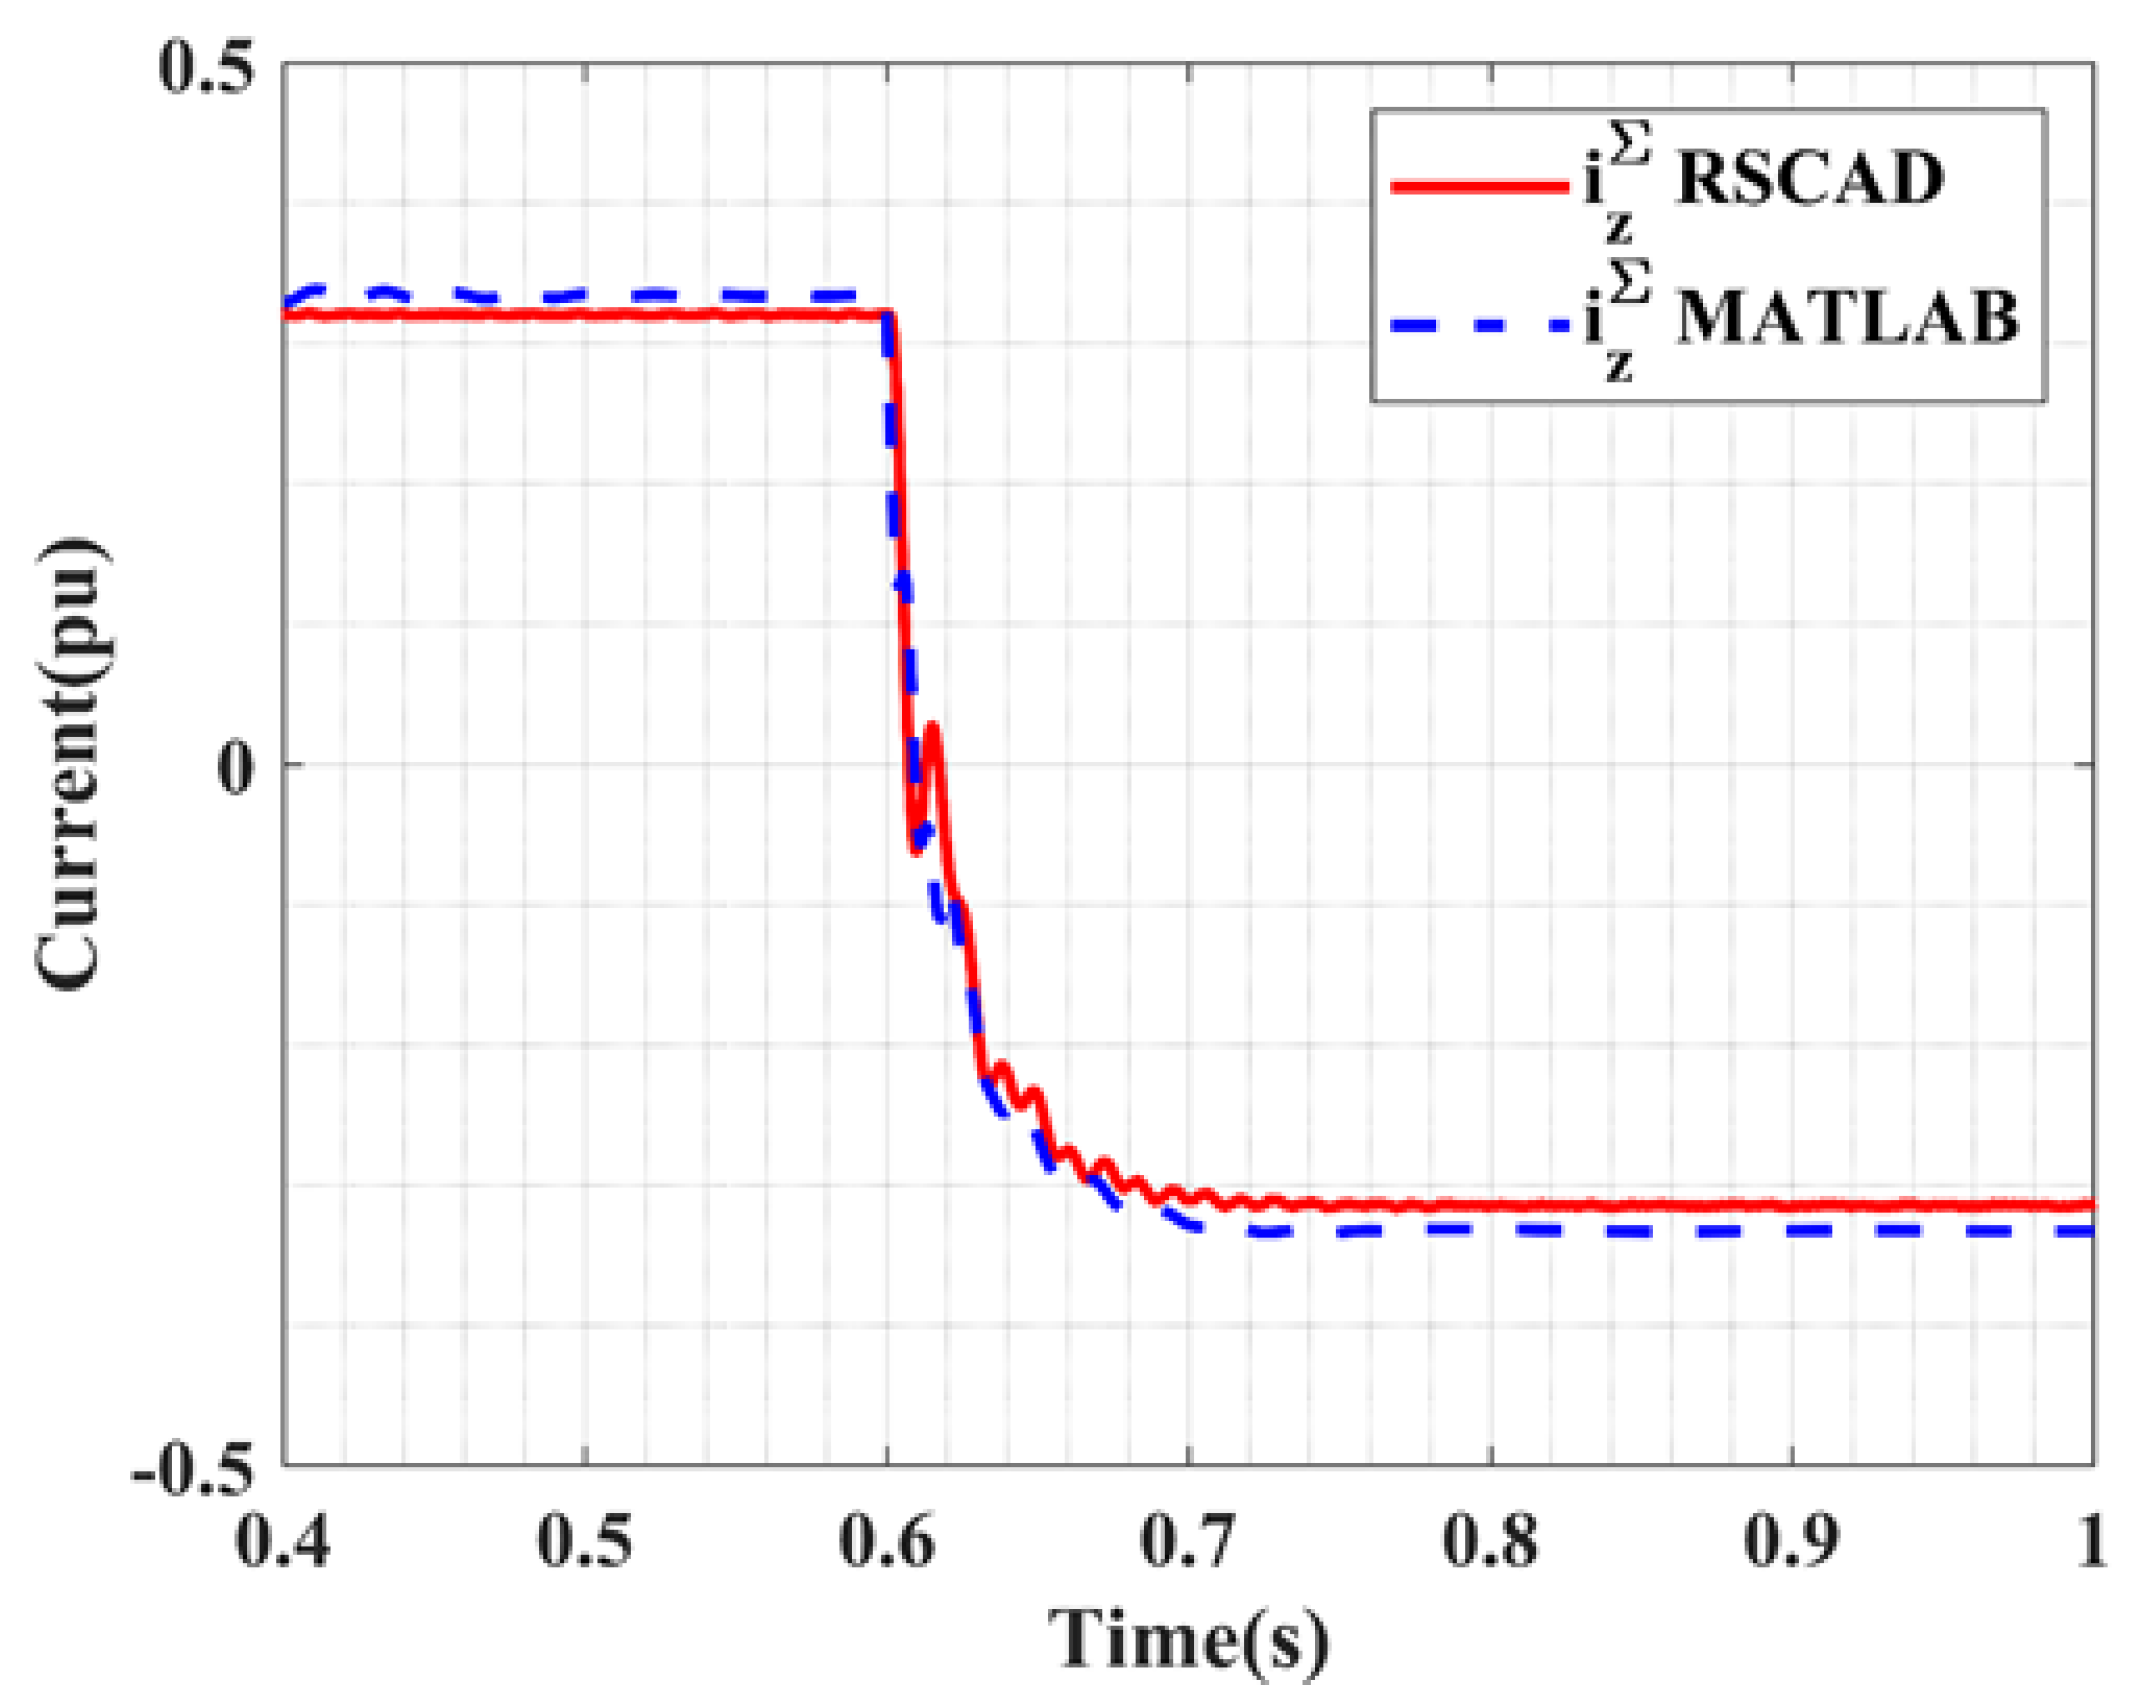
As discussed in the previous section, the circulating currents are nearly zero for both models. Again, the RSCAD model contains the 6th harmonic content as observed in Figure 11a. Similarly, d q z components of the arm capacitance voltage remain constant after the reversal because ideal voltage is on the DC side (see Figure 11b). With the change in the active power direction, the current direction reverses, which is observed in both models as depicted in Figure 12.

2.3.2. Model Error Analysis

In order to validate the mathematical models’ accuracy with the RSCAD model, a mean absolute error (MAE) is determined in pre-, during, and post-disturbance periods. MAE gives a measure of correspondence between mathematical and RSCAD models. MAE is calculated for small signal disturbances as described in the previous subsection: The mean absolute error is given by [28],
M A E = i = 1 N a b s y p i y o i M ,
where y p i and y o i are the predicted and observed values for the ith instance with total M observations.
In case of the step change in the active power, the measured active power in mathematical model ( P M A T L A B ) exhibits very lower error during the pre-disturbance and post-disturbance as shown in Table 3. However, this error slightly increases during the disturbance. A similar pattern is observed in the case of the measured reactive power in the mathematical model ( Q M A T L A B ) . The zero sequence components’ errors ( i d Σ and i q Σ ) is caused by the absence of 6th harmonic content. Moreover, this error reduces after disturbance, see Figure 6 and Table 3. The zero sequence circulating current ( i z Σ ) has a considerably higher error rate, which is visible in Figure 7 and in Table 3. This error arises due to the fact that, in RSCAD, there are ohmic losses that are not considered in the mathematical model. In addition, with the reduction in the active power, this error drops exponentially.
From Table 4, with an increase of reactive power to 200 MVAR at 0.6 s, there are no significant changes observed. The MAEs for various signals are much smaller than in the previous case. In the case of active power reversal, the error during disturbance is higher for most of the signals, as can be seen in Table 5.
The presented results show that the mathematical model provides a good level of performance during the steady-state and transient operation for the RSCAD model. There are simplifications in the mathematical model. Namely, the 6th harmonic content is absent compared to the RSCAD model. It is observed that the percentage of the error during the transient condition is higher in the case of the mathematical model compared with the RSCAD model. However, this error was less than 5%. Therefore, this mathematical model is suitable for advanced modern control and controller development.

3. Indirect Implicit MPC with Laguerre’s Function

3.1. Discrete Mathematical Model of MMC

The MMC’s operation can be fully described by using the AC side modeling format citezama2018high with the following differential equation in the discrete form:
x ˙ = A x + B u ,
where x = [ i d Σ , i q Σ , i z Σ , i d Δ , i q Δ ] T is the state vector of the output current in a d q -frame, and u = [ v M d Σ , v M q Σ , v M z Σ v d c 2 , v M d v d Δ , v M q v q Δ ] T is a difference between voltages in the d q -frame. The matrices A and B are given by
A = R a r m L a r m 2 ω 0 0 0 2 ω R a r m L a r m 0 0 0 0 0 R a r m L a r m 0 0 0 0 0 R e q a c L e q a c ω 0 0 0 ω R e q a c L e q a c , B = diag 1 L a r m , 1 L a r m , 1 L a r m , 1 L e q a c , 1 L e q a c .
These equations are developed from Equations (3) and (4).
With no approximation of the real model, a zero-order hold method is preferred for discretization. Zero order hold is especially suitable for switching power converters since it ensures good harmonic correspondence with the continuous model up to one half of the converter’s switching frequency. It is usually used for the design of controllers for power converters. Hence, zero order hold is used to represent the continuous state-space model of the MMC in discrete time [29]. Thus, upon discretization, (6) can be written as
x ( k + 1 ) = F ( T s ) x ( k ) + G ( T s ) u ( k )
y ( k ) = H ( T s ) x ( k ) ,
where H ( T s ) is an identity matrix, whereas F ( T s ) and G ( T s ) are given by
F ( T s ) = e A T s ,
G ( T s ) = A 1 e A T s I B .
The above model provides an AC and DC model of MMC for Active-Reactive power control, circulating current suppression control and AC support.

3.2. MPC Definition

Among different MPC topologies, the indirect implicit MPC is considered the most suitable for MMC applications. Looking at the discrete MMC model from the AC side, it can be considered as a five input and five output system. In this model, vector u are the control signals and x m are output signals. To eliminate the steady-state error, an integral is added to the output. Thus, the DMMC’s augmented model is obtained. The standard form of the MMC model is given by (8), which is further represented as an augmented model by (9) [30]
Δ x ( k + 1 ) y ( k + 1 ) x m ( k + 1 ) = F ( T s ) o T H ( T s ) F ( T s ) 1 A m x y x m + G ( T s ) H ( T s ) G ( T s ) B m u ( k ) ,
y m ( k ) = o 1 C m x m ( k ) .
Here, o is zero matrix with size 1 × n s , where n s is the number of state variables. In addition, Δ x ( k + 1 ) = x ( k + 1 ) x ( k ) is forward difference, and u ( k ) = u ( k ) u ( k 1 ) is backward difference. The representation of the DMMC model in (9) is the starting point for the formulation of MPC. One of the advantages of Laguerre function is that it removes the dependency on the control horizon, which is present in the conventional MPC [30]. This is done by representing the u ( k ) with the Laguerre network. The removal of the dependency on the control horizon gives the MPC using Laguerre function as an advantage for the real-time applications, as the number of parameters is reduced. With Laguerre’s function, the control parameter changes to η from u ( k ) as described below at kth instance:
u ( k + k i | k ) = L ( k i | k ) T η ,
L ( k i + 1 | k ) = A l L ( k i | k ) ,
A l = a 0 0 0 β a 0 0 a β β a 0 ,
L ( 0 ) = β 1 a a 2 ( 1 ) N 1 a N 1 ,
η = c 1 c 2 c N T .
Here, a is called Laguerre’s network pole with a value between 0 < a < 1 for safeguarding the network’s stability. In this paper, it is assumed that a = 0.237 and β = 1 a 2 . N is the number of terms required to represent the approximate system response, set to 4 for the considered MMC application. The value of η is calculated by minimising the objective (cost) function, subject to equality and inequality constraints. The cost function is formulated considering LQR as a base. Hence, the cost function is given by
m i n η J = m = 1 N p x ( k + m | k ) T Q x ( k + m | k ) + η T R η ,
subject to A η b ,
x ( k + m | k ) = r ( k ) y m ( k + m | k ) .
where Q o and R o weighting matrices. In this paper, Q is identity matrix (I), and R is set to 0.0001 I . N p is the prediction horizon. In this paper, N p is set to 4. For variables x ( k ) , vector r ( k ) is a reference signal. Here, A and b are column vectors related to constraint information on rate and amplitude. The above quadratic programming problem is solved by making use of Hildreth’s quadratic programming procedure [30].
The Algorithm 1 begins with the initialisation of the augmented model, the Laguerre’s parameter and the prediction horizon. Controllers’ input x is measured at the k-th sampling instance at step 1. The output is computed by optimising the quadratic problem given by (11a) in step 2. Here, the output is η , which is further used to calculate u ( k ) in step 3. The computed u ( k ) consists of N p terms which represent the N p future control signals for current measured signals. By applying the preceding horizon principle, only the first term is applied to the system model at a k + 1 sampling instance, and other terms are neglected in step 4. This entire process continues until the end of the simulations.
Algorithm 1: MPC using Laguerre’s function
 Initialization: Augmented model ( A m , B m , C m a n d D m ), A l , N, a, A, N p and b.
Step 1: Measure Δ x at k-th instance.
Step 2: Compute optimal η by minimising the quadratic cost function (11a) using Hildreth’s Quadratic programming procedure considering the constraints.
Step 3: Compute u ( k ) using with η from step 2 to calculate equations (10).
Step 4: Using the receding horizon principle, apply u ( k ) corresponding to kth instance and neglecting the inputs at other sampling instances.
Step 5: Go to step 1.

3.3. Indirect Implicit MPC Simulation Results in Matlab

Table 6 presents given parameter values used in the simulation of MMC in this subsection.
To check the performance of the MMC (from Figure 1) using MPC, the active and reactive power setpoints are varied. This variation was directly reflected through the d q -frame output currents. In general, there are two cases: small and large disturbance scenarios. Within each case, we have simulated two events at different time instances. Similarly, each case has two variables, i.e., active and reactive power and their values are changed at different time instances, as summarised in Table 7.
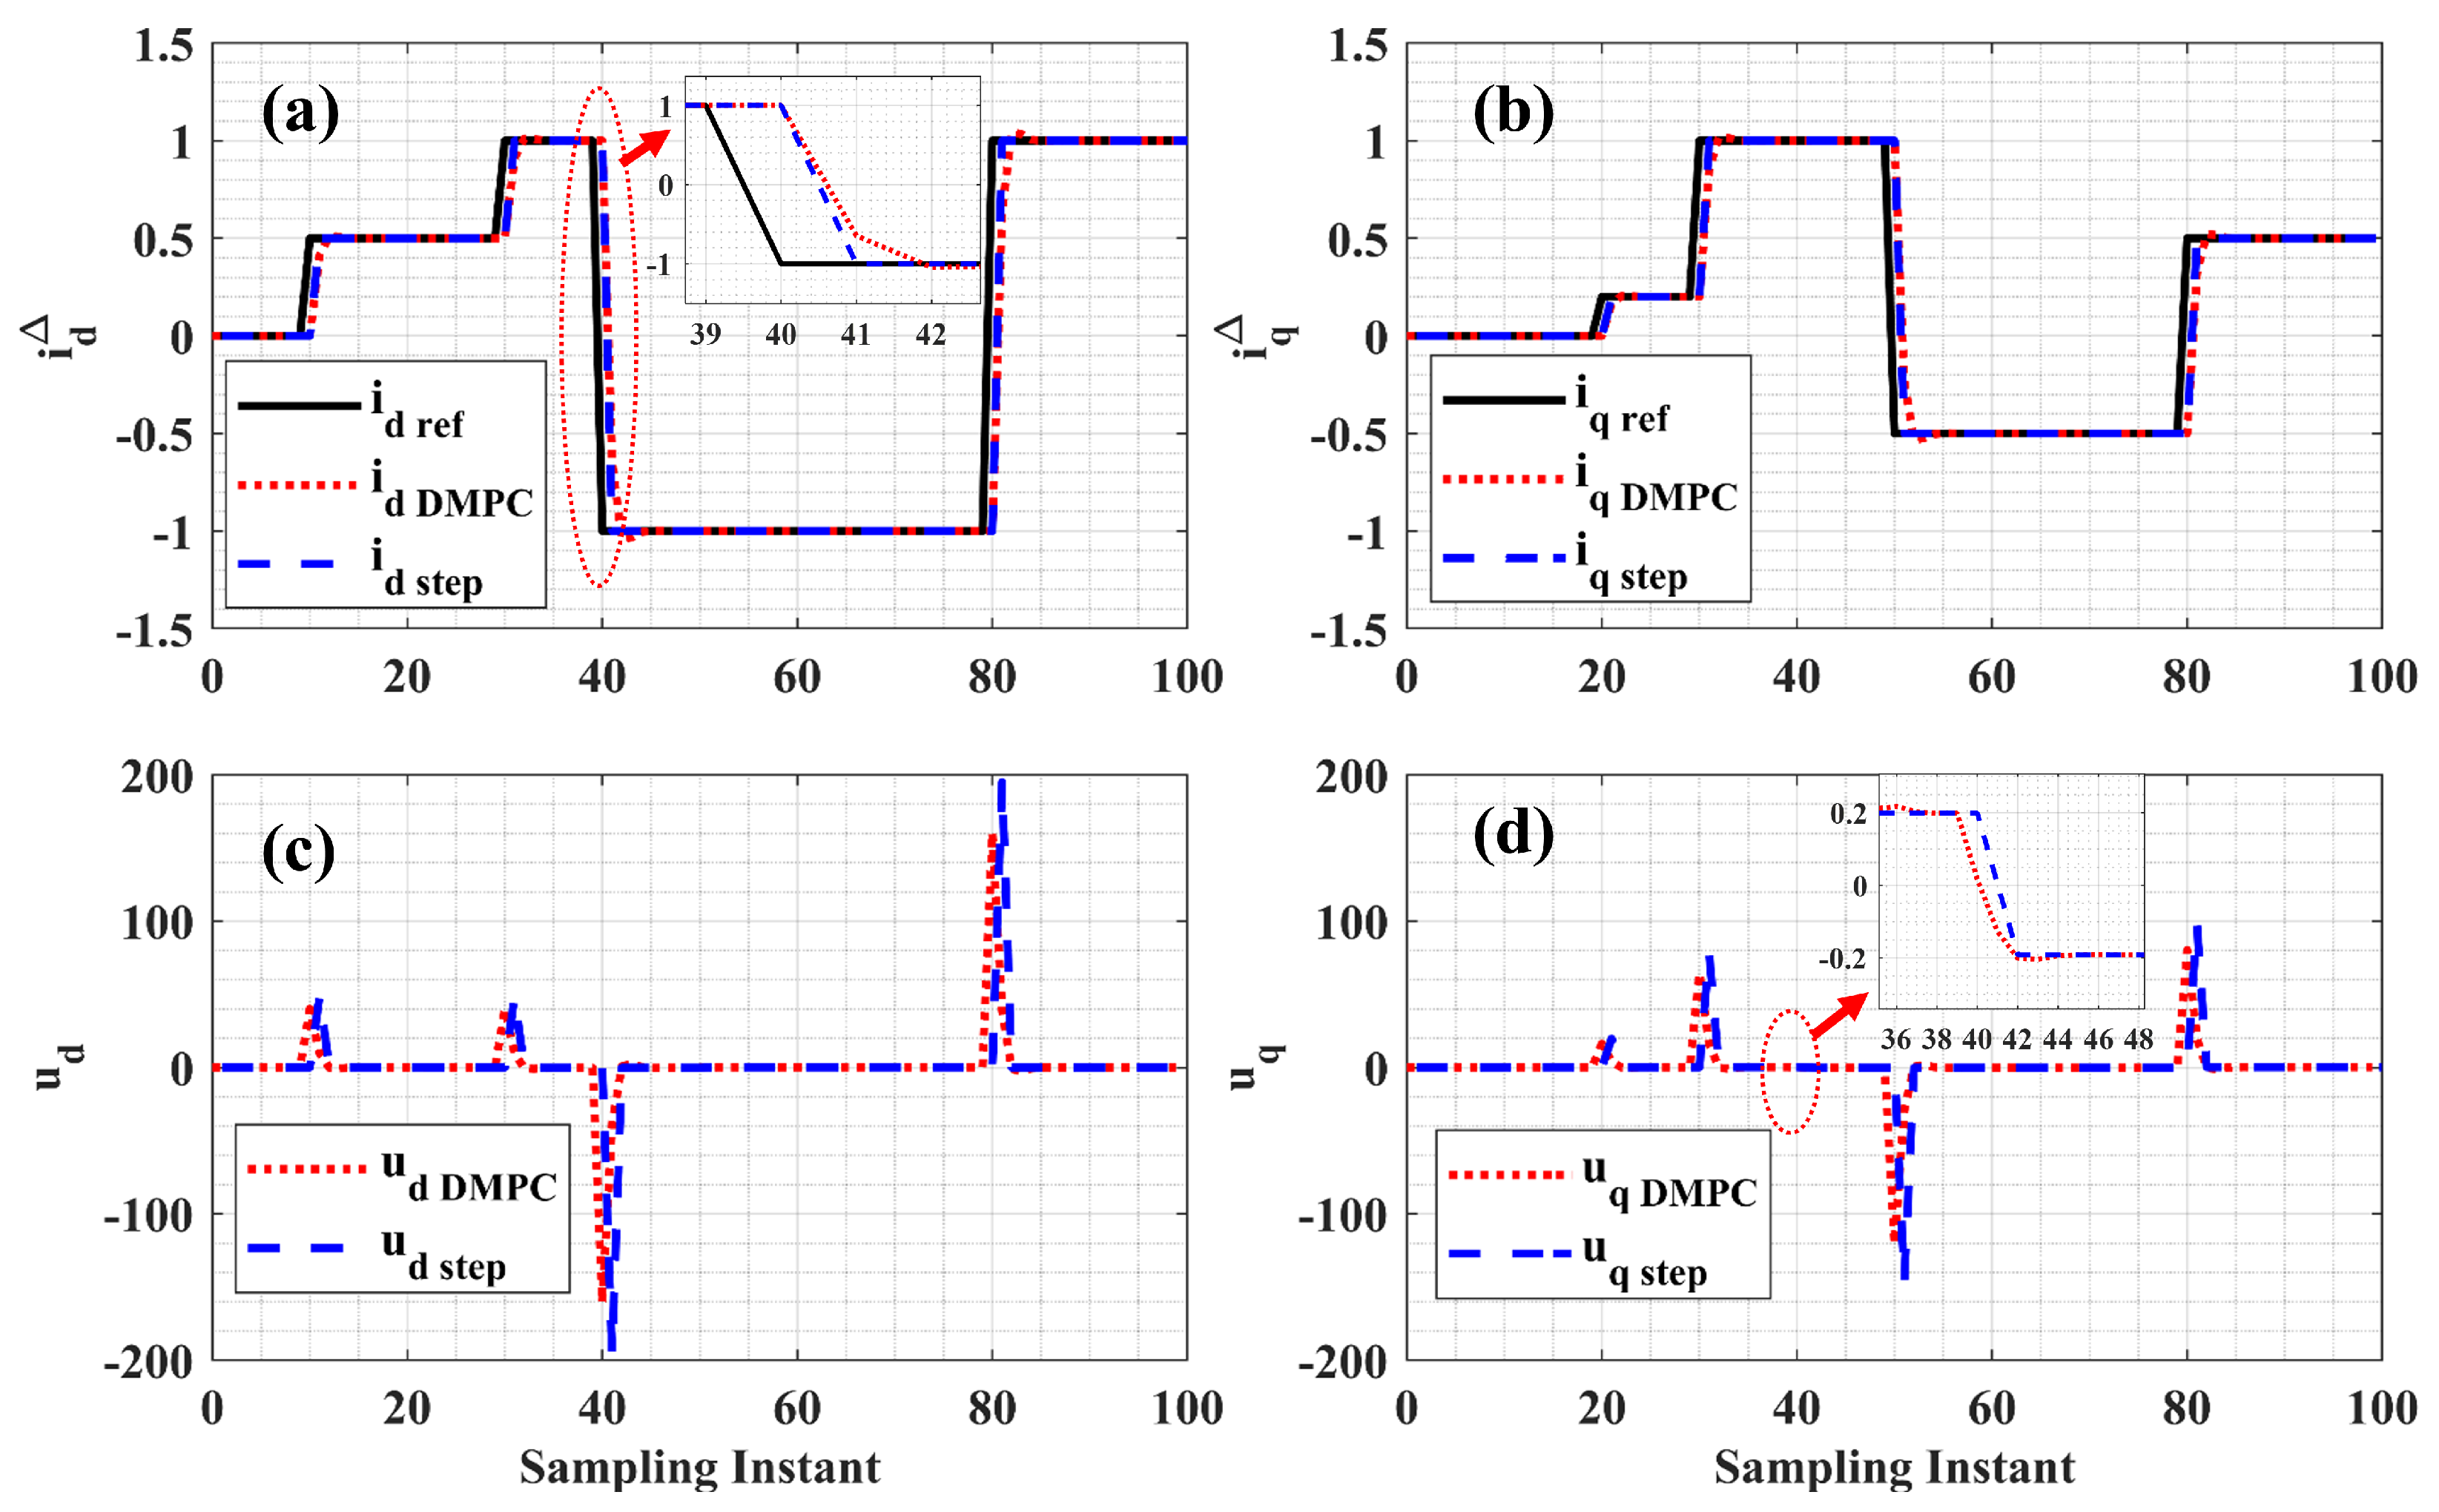
First, the unconstrained problem is tackled, i.e., no constraints on any state variables. At the beginning of the simulation, the active and reactive power setpoints are kept zero, as shown in Figure 13. For the sake of comparison, the response of MPC is contrasted against the close loop step response of the MMC.
Thus, with the change of reference signal at different time instances, it can be seen that the MPC and close loop step response show similar results. For the small disturbance, some overshoots are less than 2% in d q -frame output currents. Similarly, we have a higher overshoot during the large disturbance than with the small disturbance. Due to the uncompensated MMC model, as discussed in the previous section, currents i d Δ and i q Δ are dependent on each other, which is seen in the change of u d = v M d v d Δ and u q = v M q v d Δ control voltages (see Figure 13). For example, with the change active power reversal from 1 pu to −1 pu at the 40-th sampling instance, there is a dependence of u d , which corresponds to the sharp peak with a maximum amplitude of −160 and −190 in MPC and step response, respectively. However, at the same time, u q changes its direction from 0.2 to −0.2 as predicted. The width of this sharp peak is equal to the width of the current reversal transient.
MPC is designed with parameters turned using a discrete linear quadratic regulator (DLQR). Thus, with an unconstrained condition, the quadratic optimisation problem is linear. This means that the underlined response is the same as that of DLQR, which is shown by the lower relative error between eigenvalues of DLQR and MPC in Table 8.

3.3.1. Constraint Satisfaction Problem

The MPC’s constraint handling in the online optimisation problem draws a line between MPC and DLQR. In this section, the effect of two constraints, i.e., Rate Constraint and Amplitude Constraint. However, the constraint on the output is not considered as it is linearly dependent on the rate and amplitude constraints and sometimes causes instability.

Rate Constraint

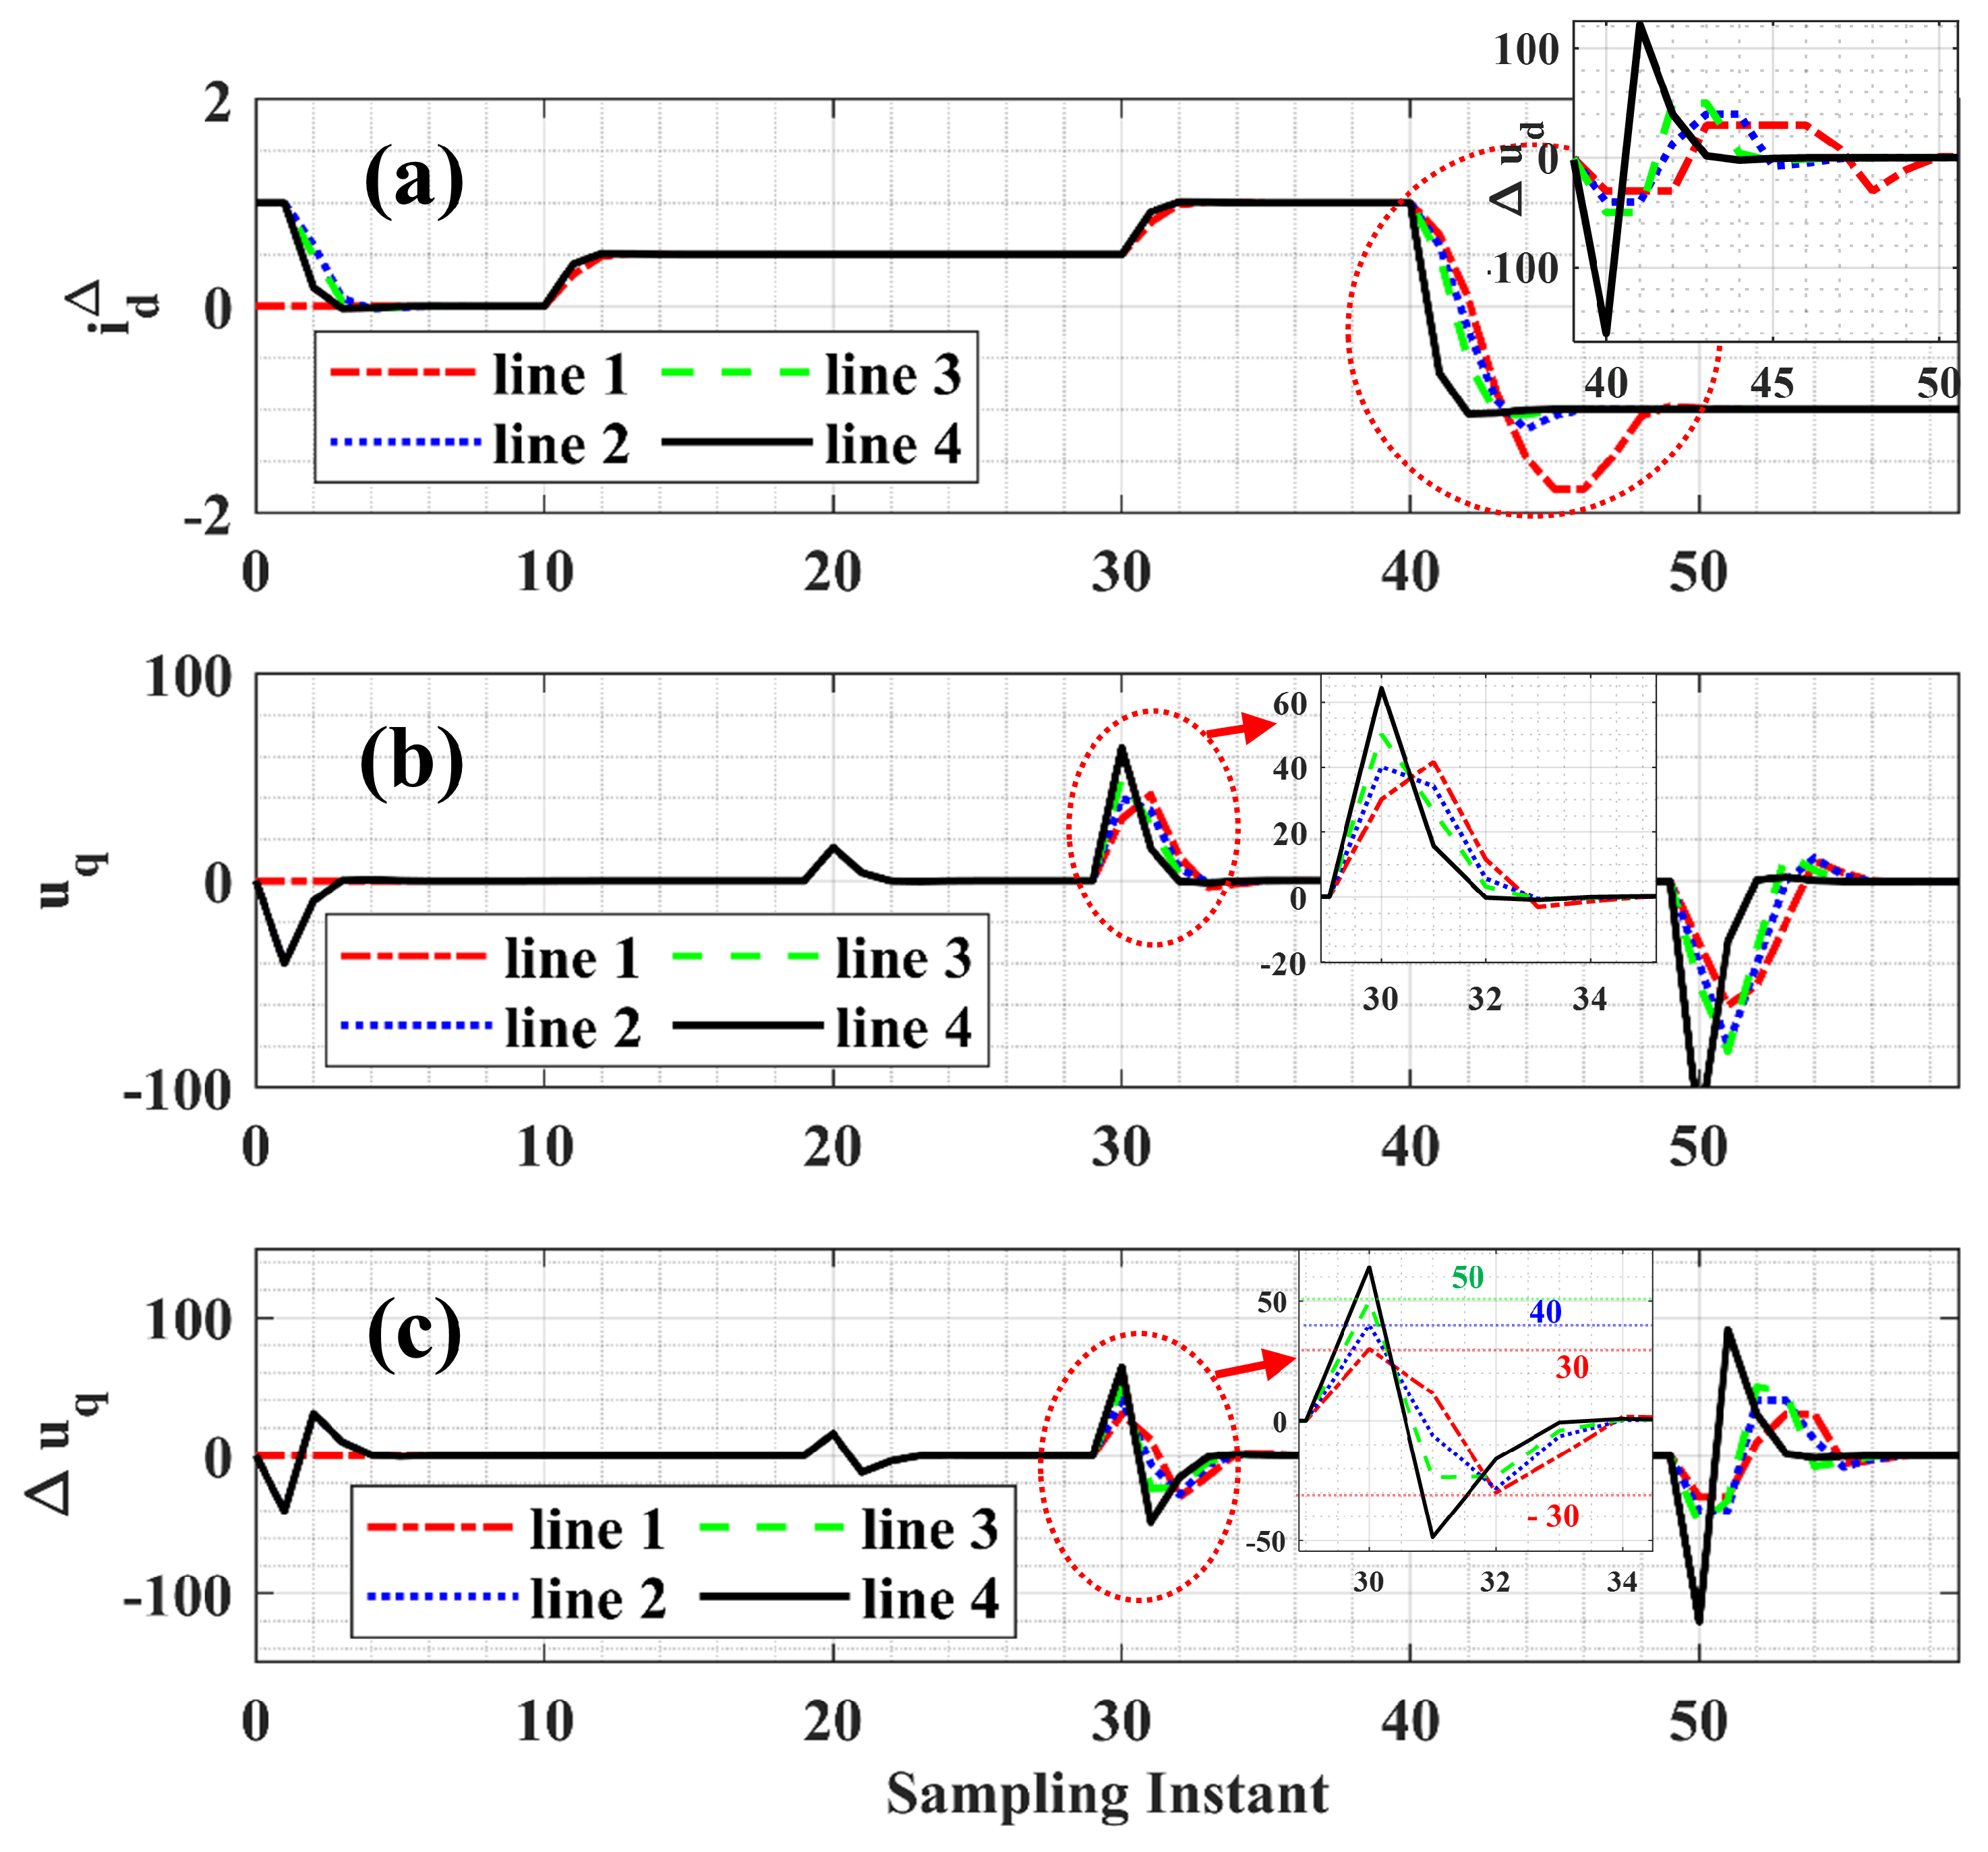
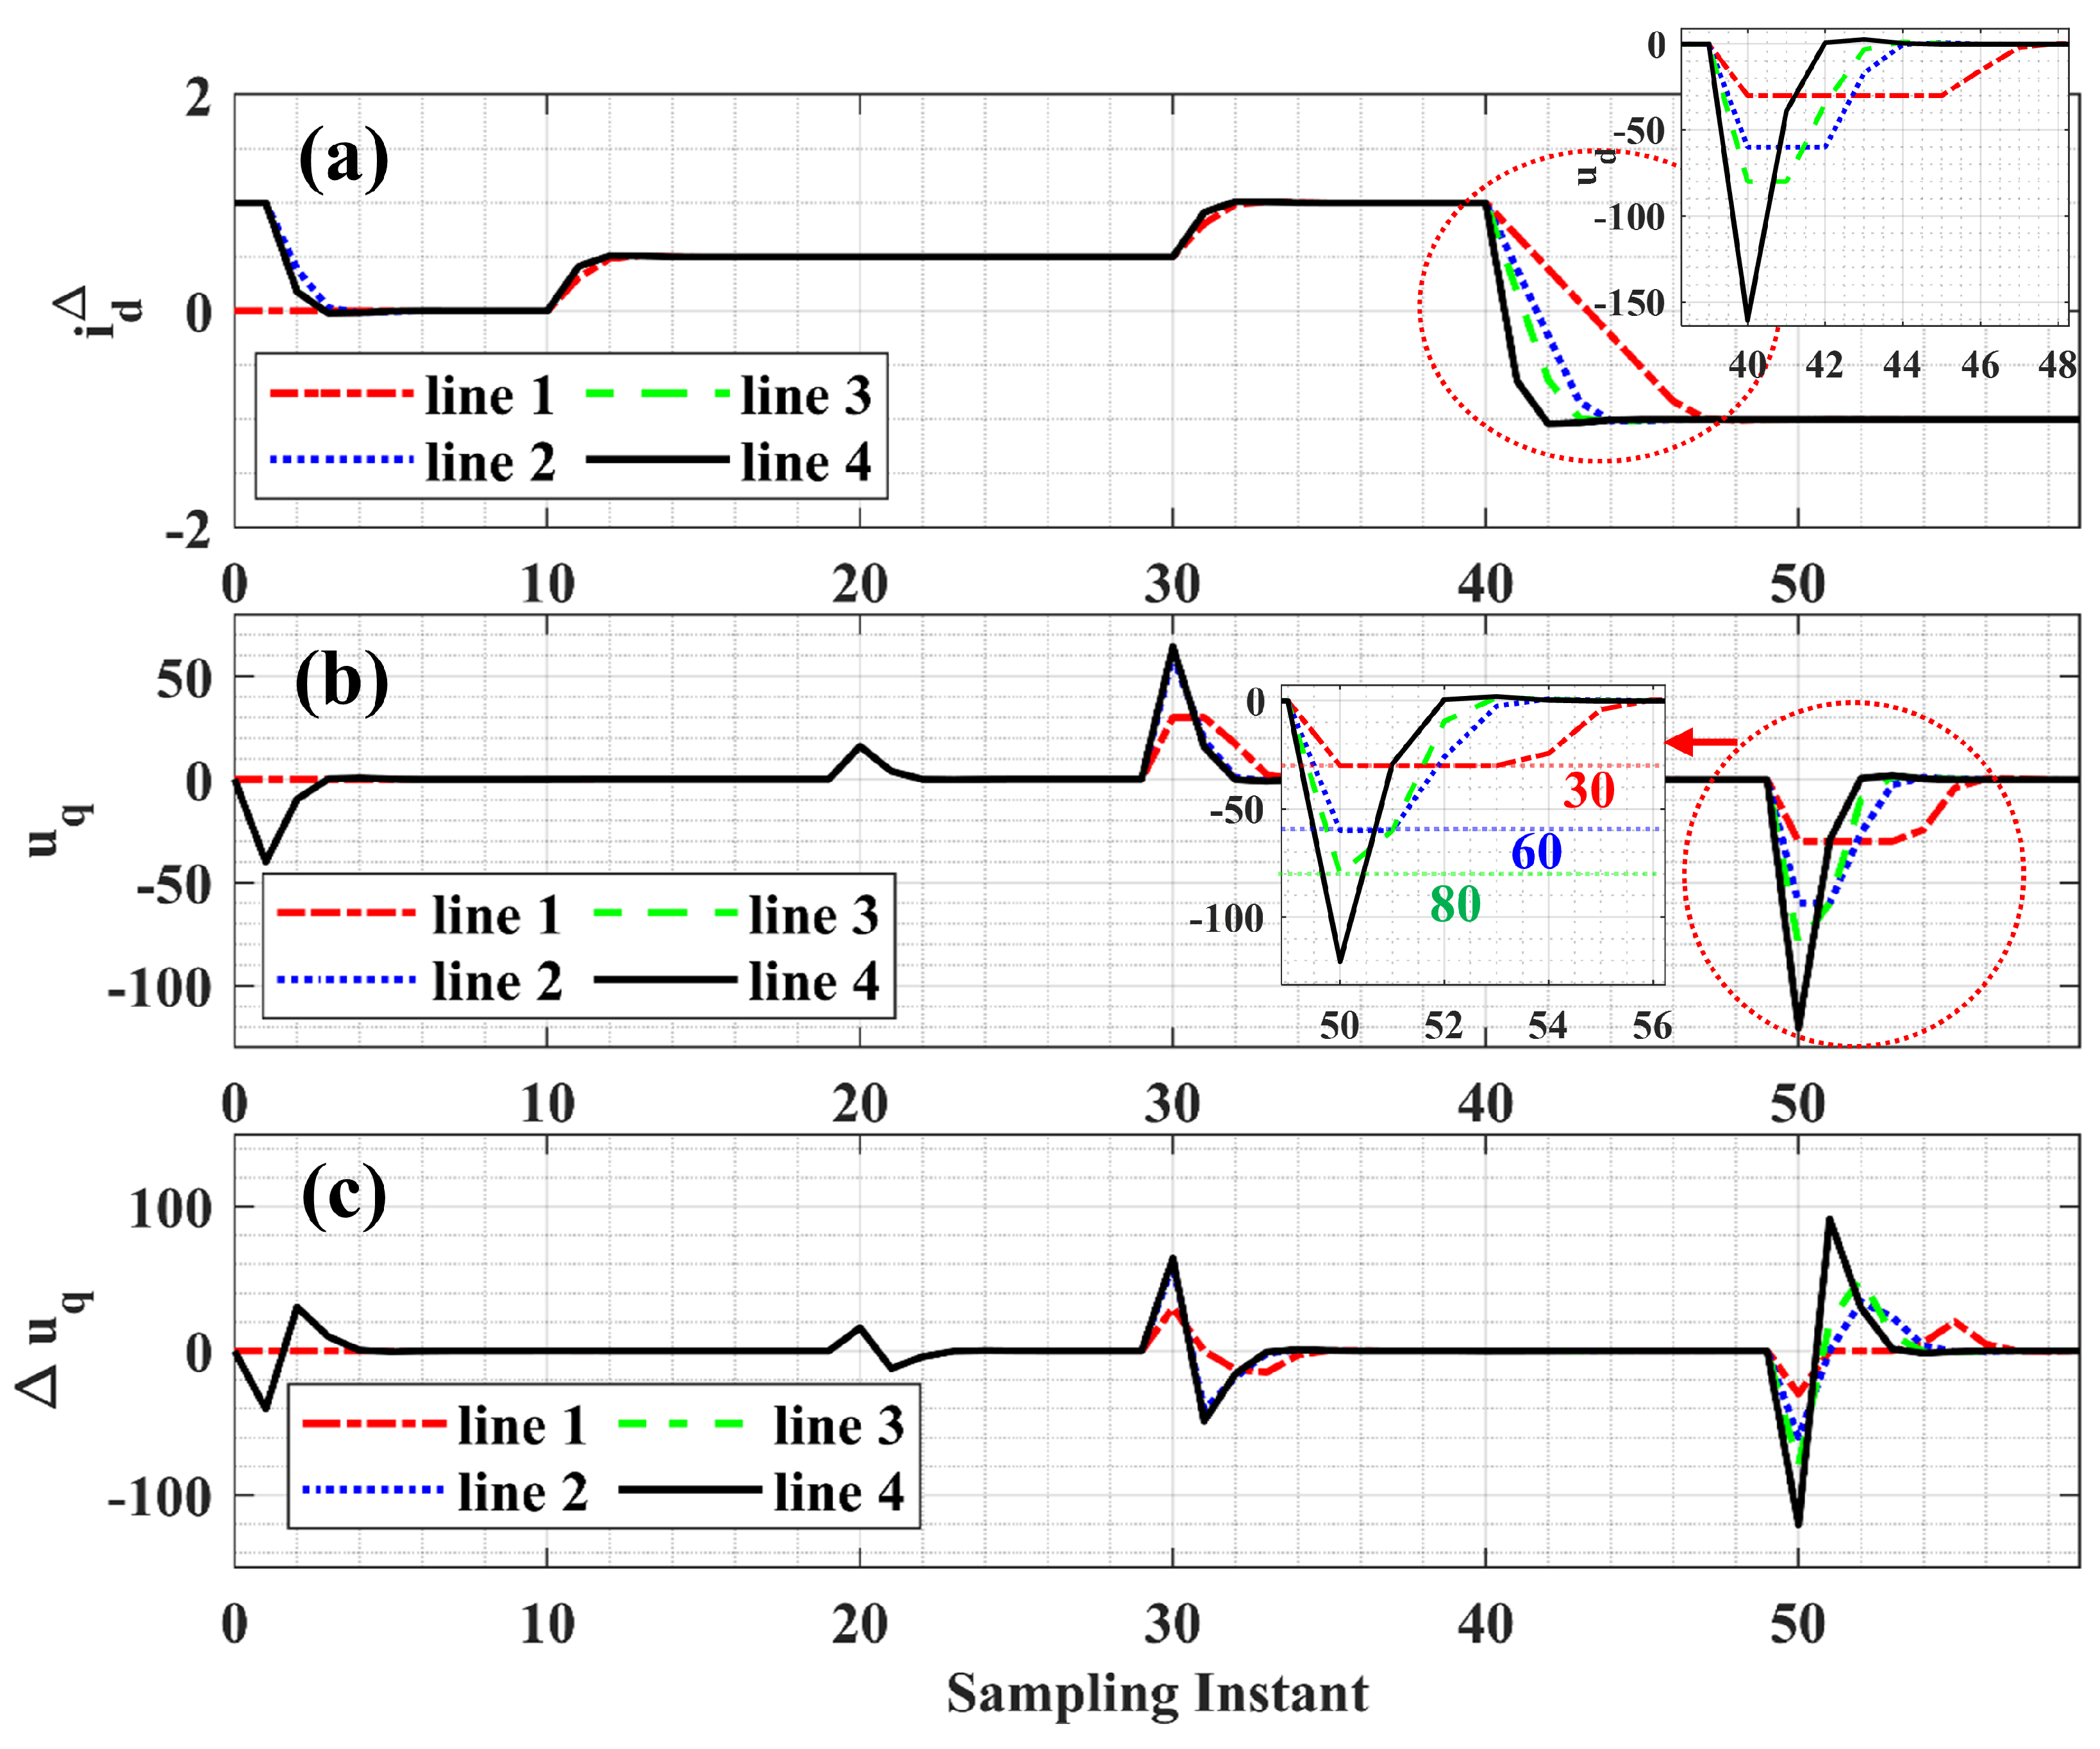
In the case of the MMC control, the control signals are u d and u q , which is already discussed in Section 2. However, it is observed from the unconstrained case that the rate of increase of the control voltages is higher than in the unconstrained case. To limit this high rate, a limit can be imposed during the online quadratic optimisation. In order to see the effect of rate constraints, three limits are chosen which are: | Δ u d | = | Δ u q | = 30 , | Δ u d | = | Δ u q | = 40 , and | Δ u d | = | Δ u q | = 50 . Figure 14 illustrates the consequence of the rate constraint on the input and output signals. In Figure 14c, we can see that the rate of u q does not violate the respective constraints. The reduction of rate constraint has a direct impact on the dynamic response of the i d Δ and i q Δ . With the small disturbance, the rate constraints have a significantly lower impact during the transient response of i d Δ , as it is below the respective constraint limit. However, during active power reversal, there is a large peak in Δ u d (shown in a small window in Figure 14a). However, due to the constraint, the rate saturates to its respective limits, and thus leads to a slower transient response.
Among all the constraints, the | Δ u d | = | Δ u q | = 30 constraints have a severe impact on the transient response of the i d Δ , and it has a higher undershoot. Since the amplitude of control signal u d is unconstrained, it is therefore derived from the rate of control signal.

Amplitude Constraint

In order to examine the effect of the amplitude constraint on the output response, three amplitude constraints are considered which are: | u d | = | u q | = 30 , | u d | = | u q | = 60 , and | u d | = | u q | = 80 . Figure 15 shows the control and output response with the amplitude constraint on the control signal, i.e., u d and u q . During the small disturbance, there are no violations of the constraints, which is depicted in Figure 15b. However, in the case of large disturbance, we can see that some constraints tend to violate, but they are well maintained within the limits due to online optimisation. For example, with a constraint corresponding to line 3, the input signal is optimised, which in turn changes the rate of an input signal. Similar to rate constraints, the dynamic response of the i d Δ and i q Δ is affected due to the amplitude constraints as seen in Figure 15a. It is also observed that there is no undershoot as it was present in the previous section.
Another set of constraints can be imposed on the controller, which is the combination of both rate and amplitude constraint of the control signal. However, in the application of MMC, the i d Δ current has a similar response to that of amplitude constraints. Due to the constraints, rate and amplitude remain within their limits as the predictive controller computes the control signals online considering this limit.

3.3.2. Sensitivity Analysis

The performance of MPC is governed by various parameters. Hence, to check the robustness of the controller, sensitivity analysis is carried out. The main aim of sensitivity analysis is to identify the factors that severally affect the performance of the controller during transient and steady-state.

Sample Time ( T s )

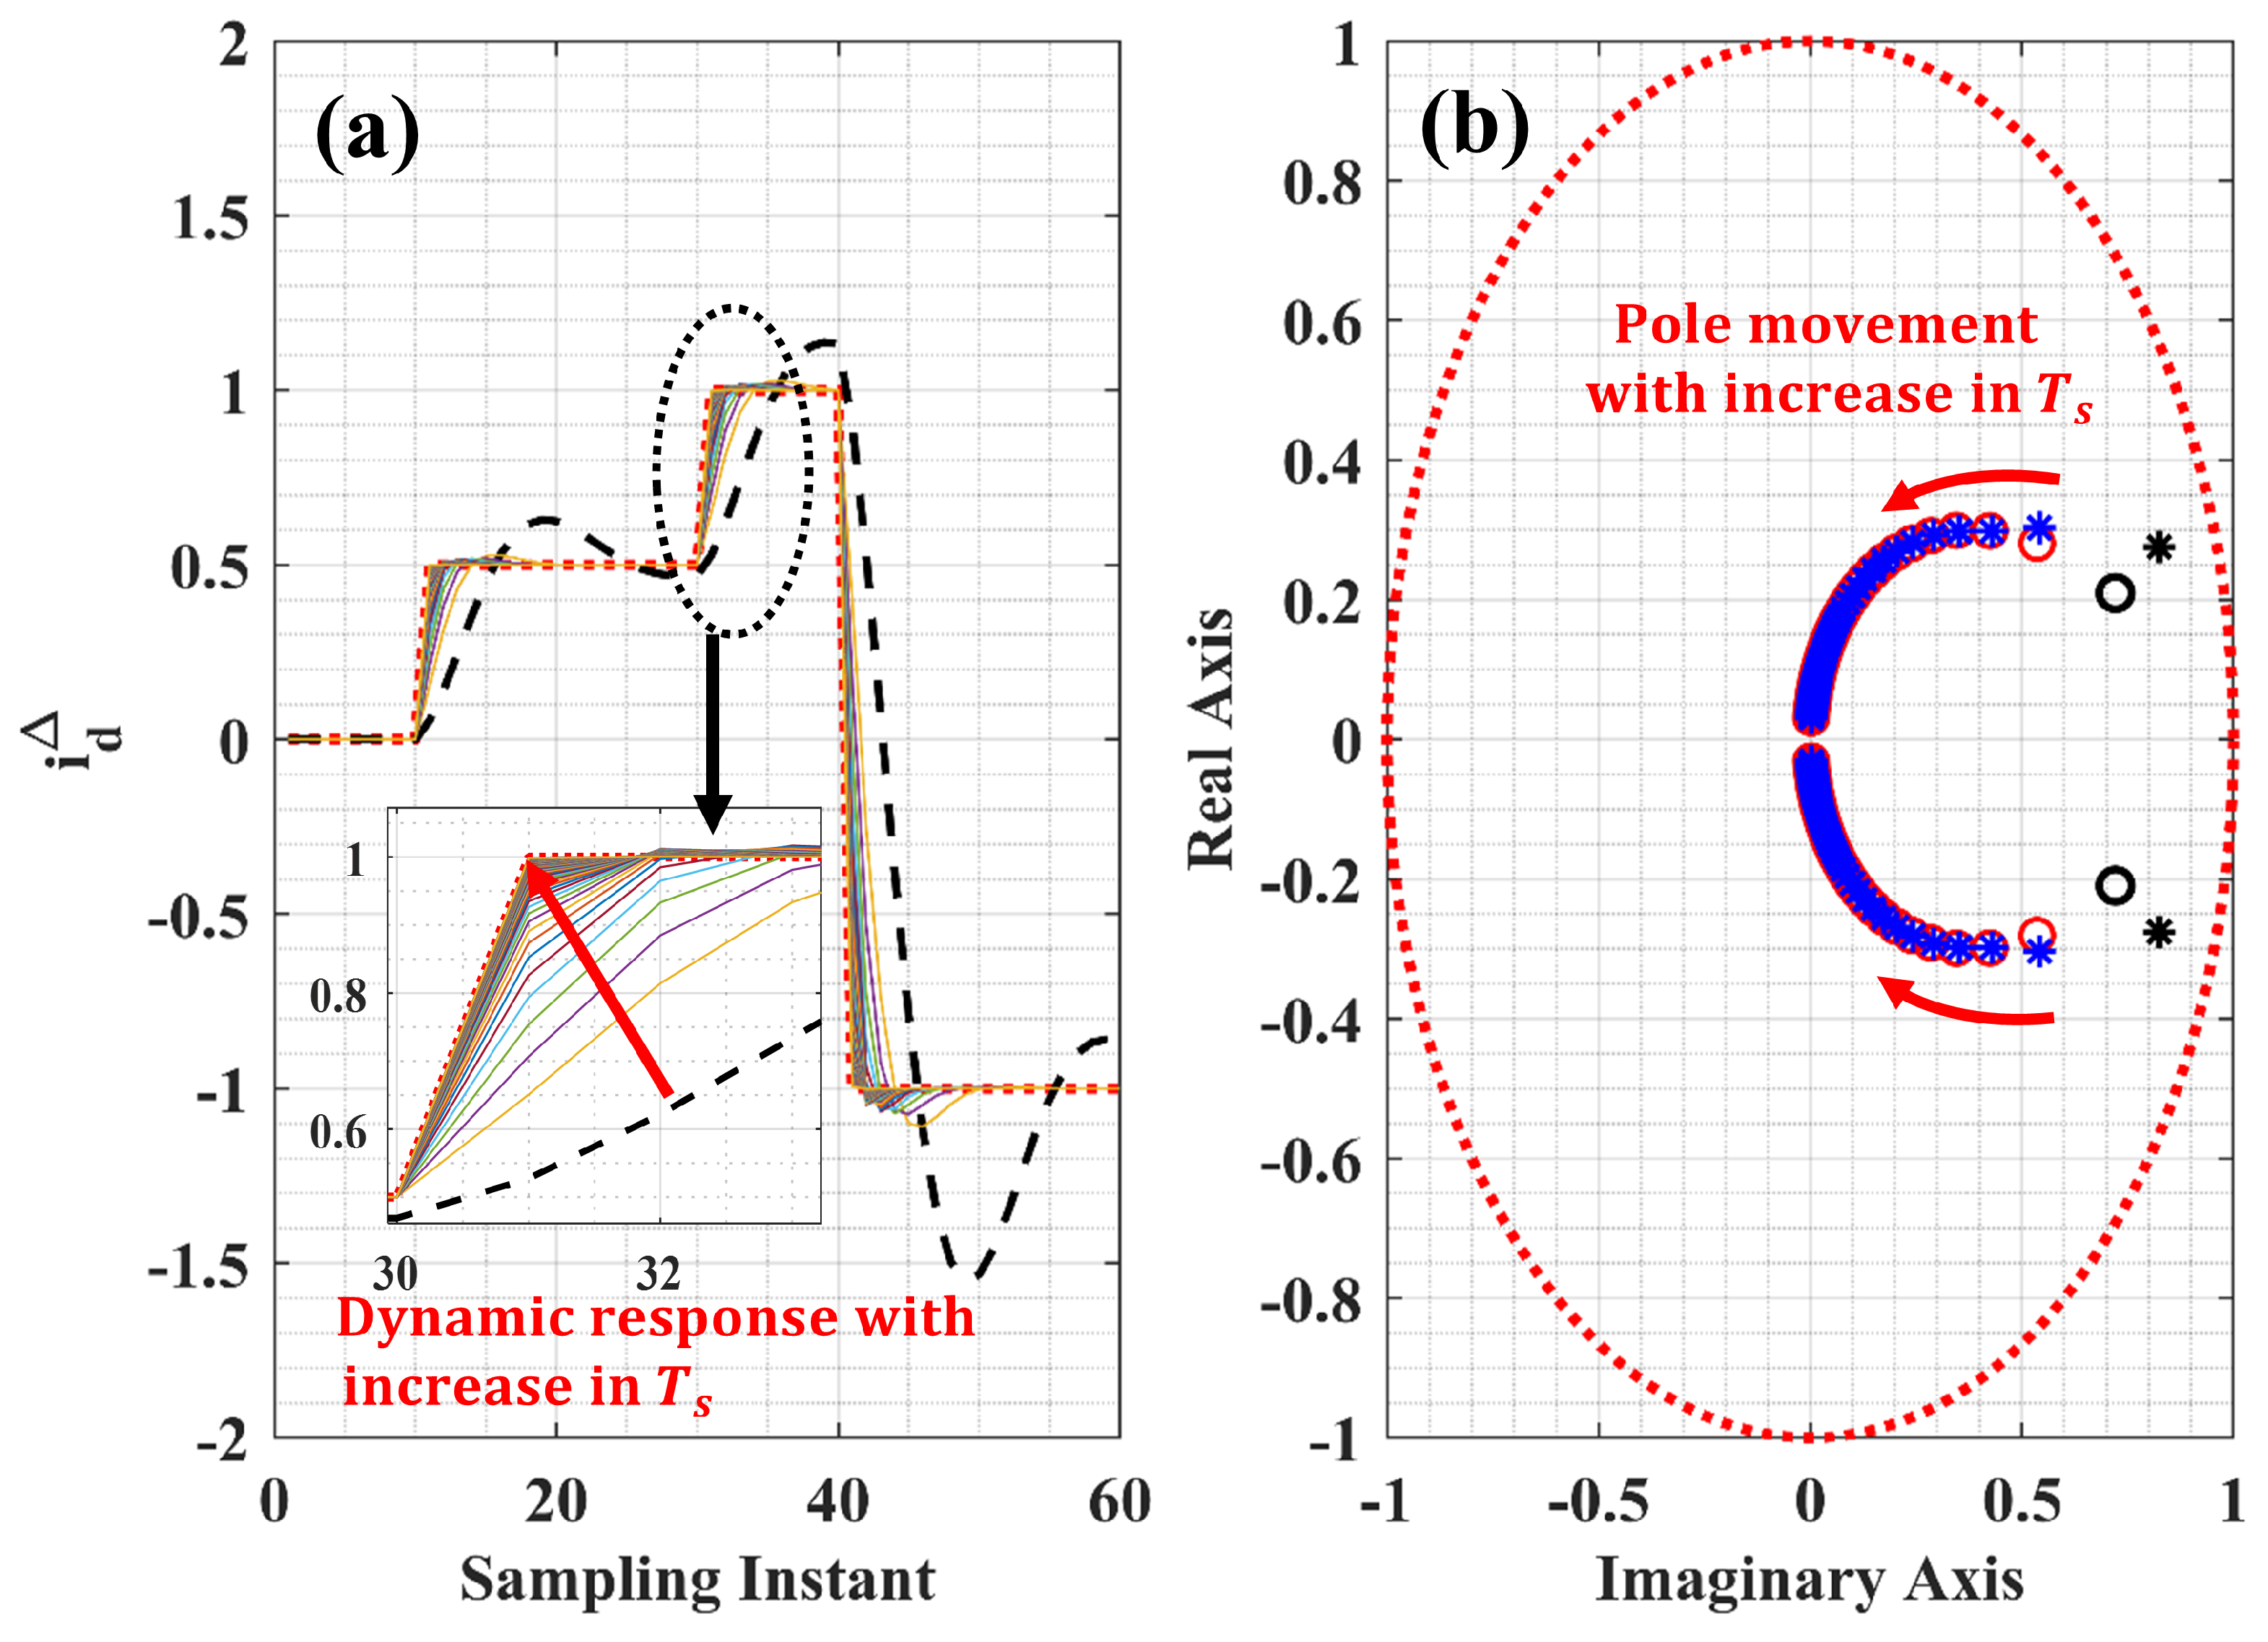
Figure 16 shows the effect of the sample time ( T s ) on the stability and dynamic response. As Figure 16 indicates, with the increase in the sample time from 0.1 ms to 10 ms, the dynamic response is faster especially during the large disturbance. Furthermore, as we increase the sample time, the underlined DLQR response (∘) overlaps the MPC (∗) without tuning the N and a parameters. However, with a lower sample time (0.1 ms), we see that there is a significant error between the two responses that are shown by the bold black ∘ and ∗ symbols. In addition, at different sampling instances, we can see that there are overshoots and higher settling time even for the small disturbance (bold black dash line).

Weighting, Predictive Horizon and Laguerre’s Parameter

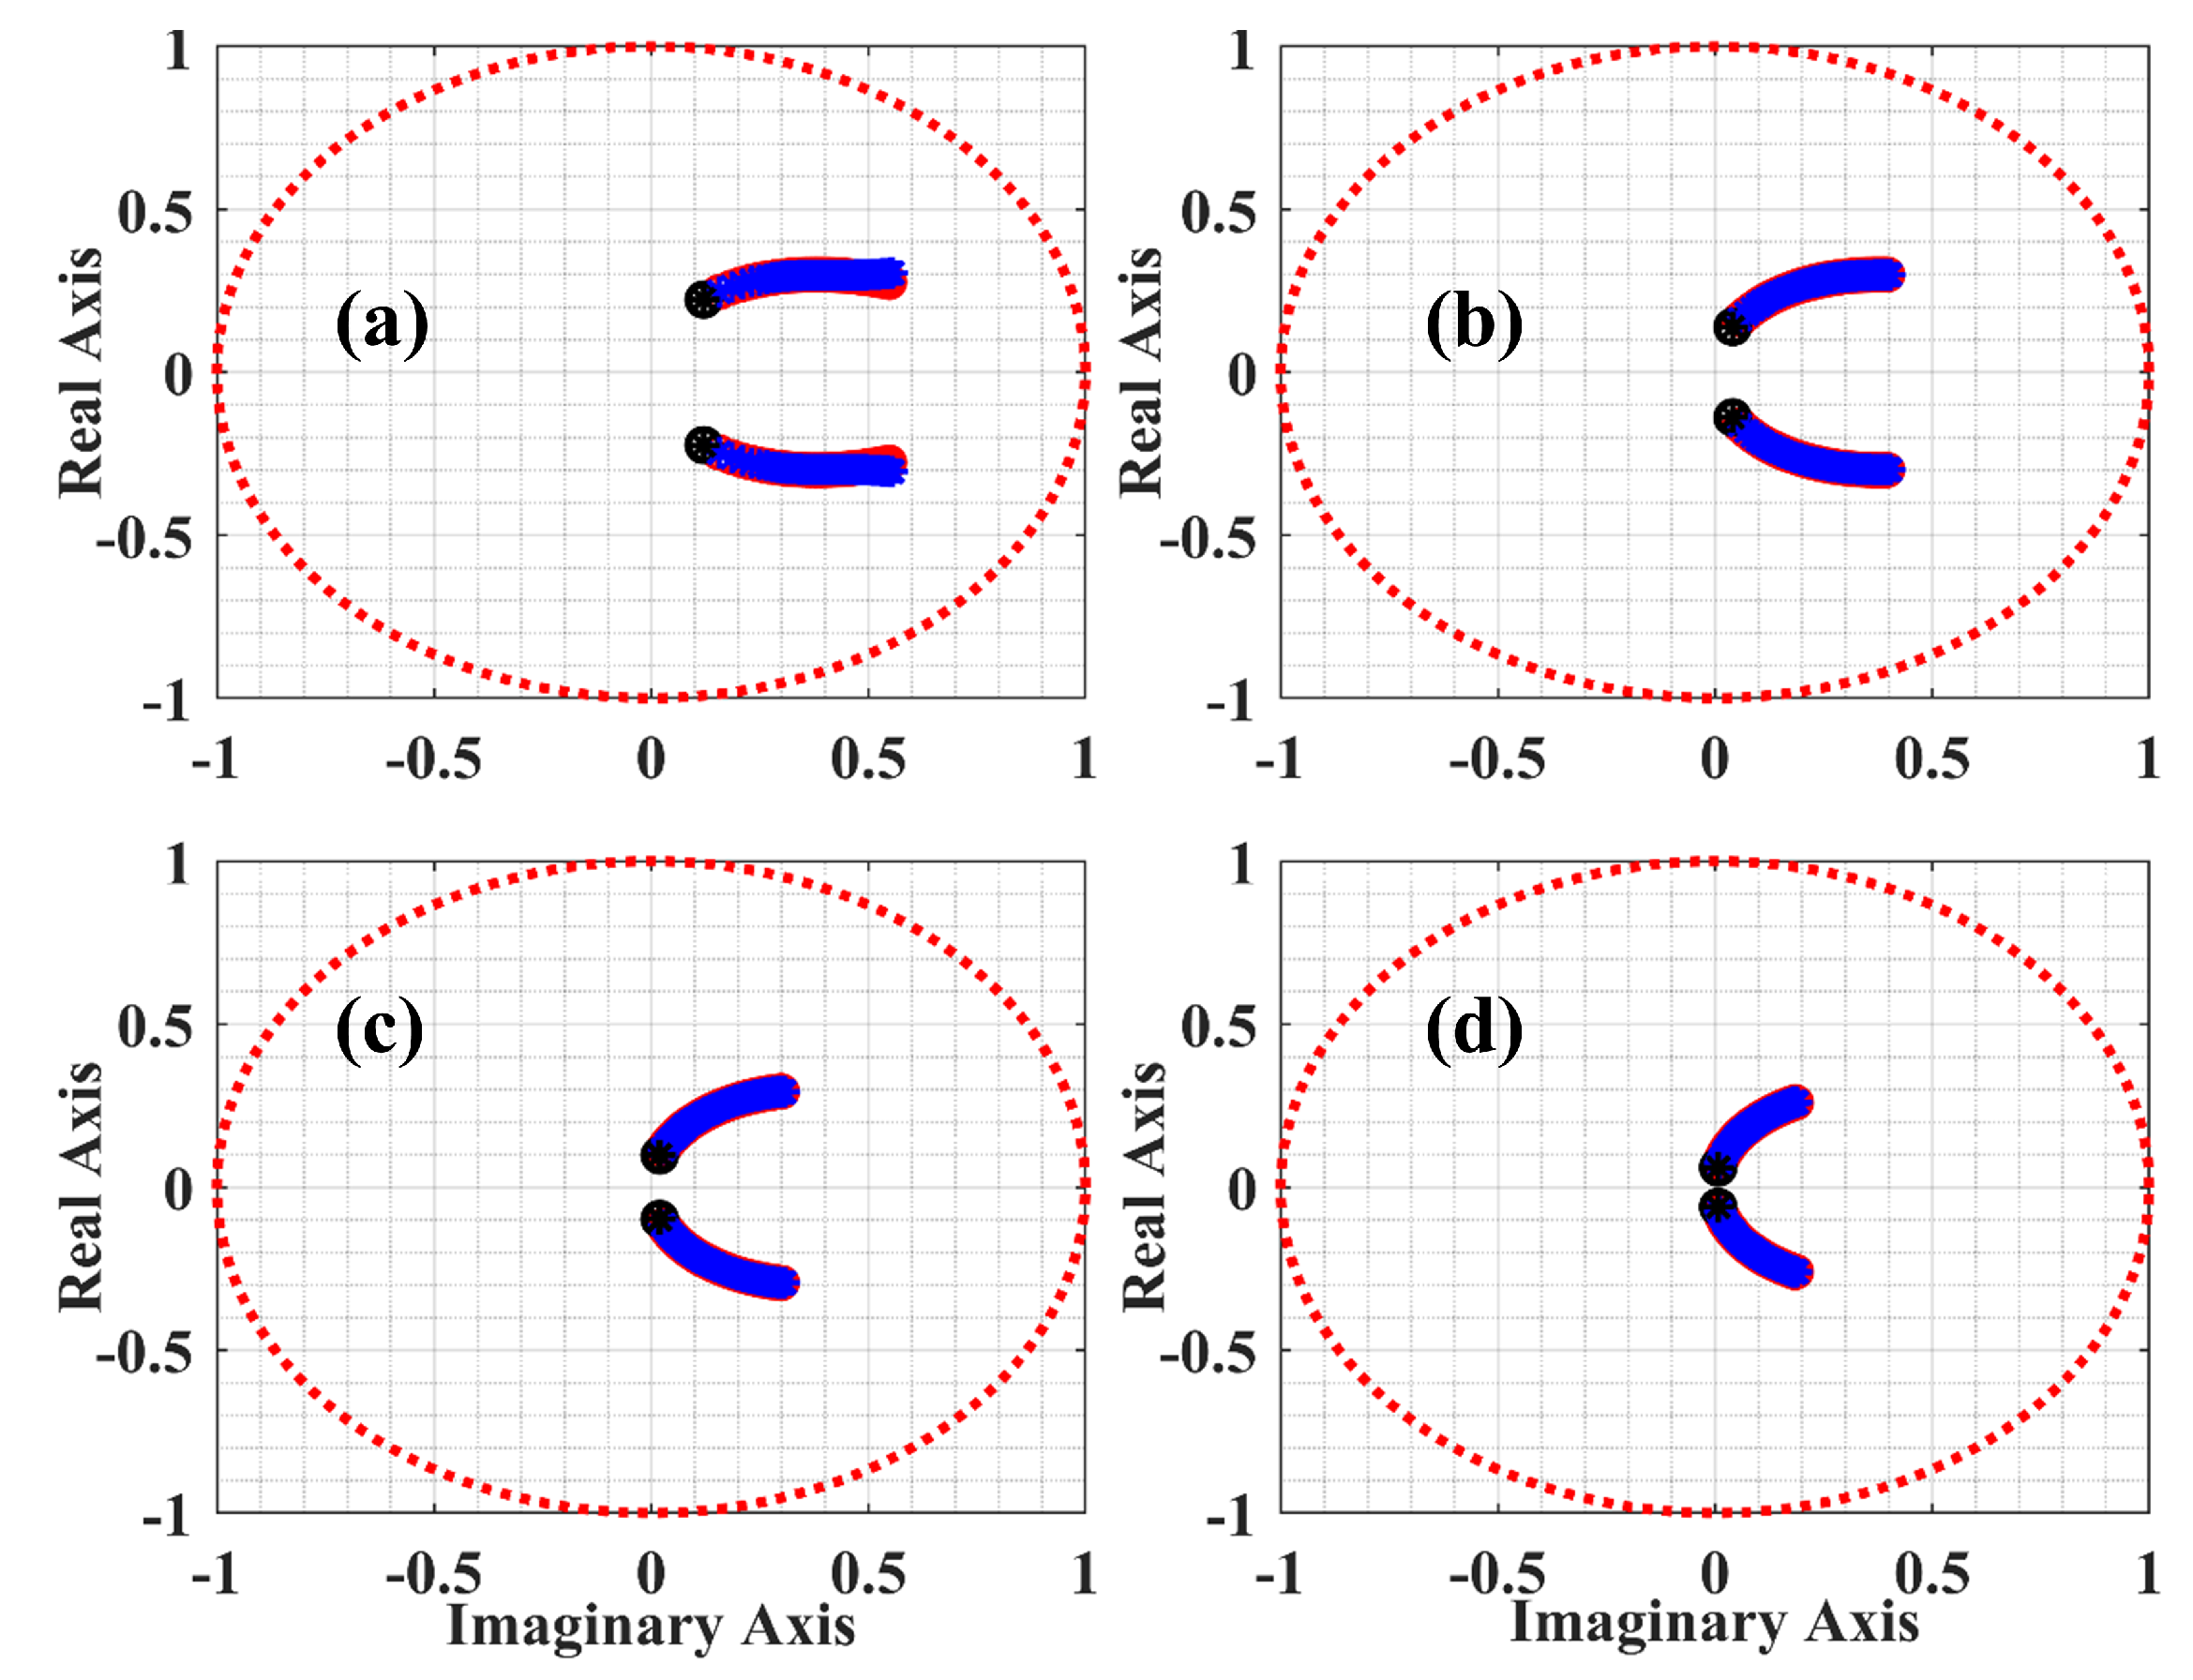
Typically, R and Q are the objective function’s weighing parameters. However, in this section, we will only discuss the effect of R on the control and output response. Similarly, the effect of variation in N and a is studied. With the increase in the R, the dynamic response of the controller reduces and the pole moves toward the unit circle as shown in Figure 17. Here, the bold black ∘ and ∗ indicates the initial condition. In addition, this figure illustrates the effect of the sample times on the pole movement with an increase in R. With higher T s = 10 ms, the pole movement is restricted within the circle with a radius of 0.2 as R increases, which indicates a damped and faster response. With the higher sample time and lower R, the response of MPC is more similar to the step response as shown by the dotted red line in Figure 16a.
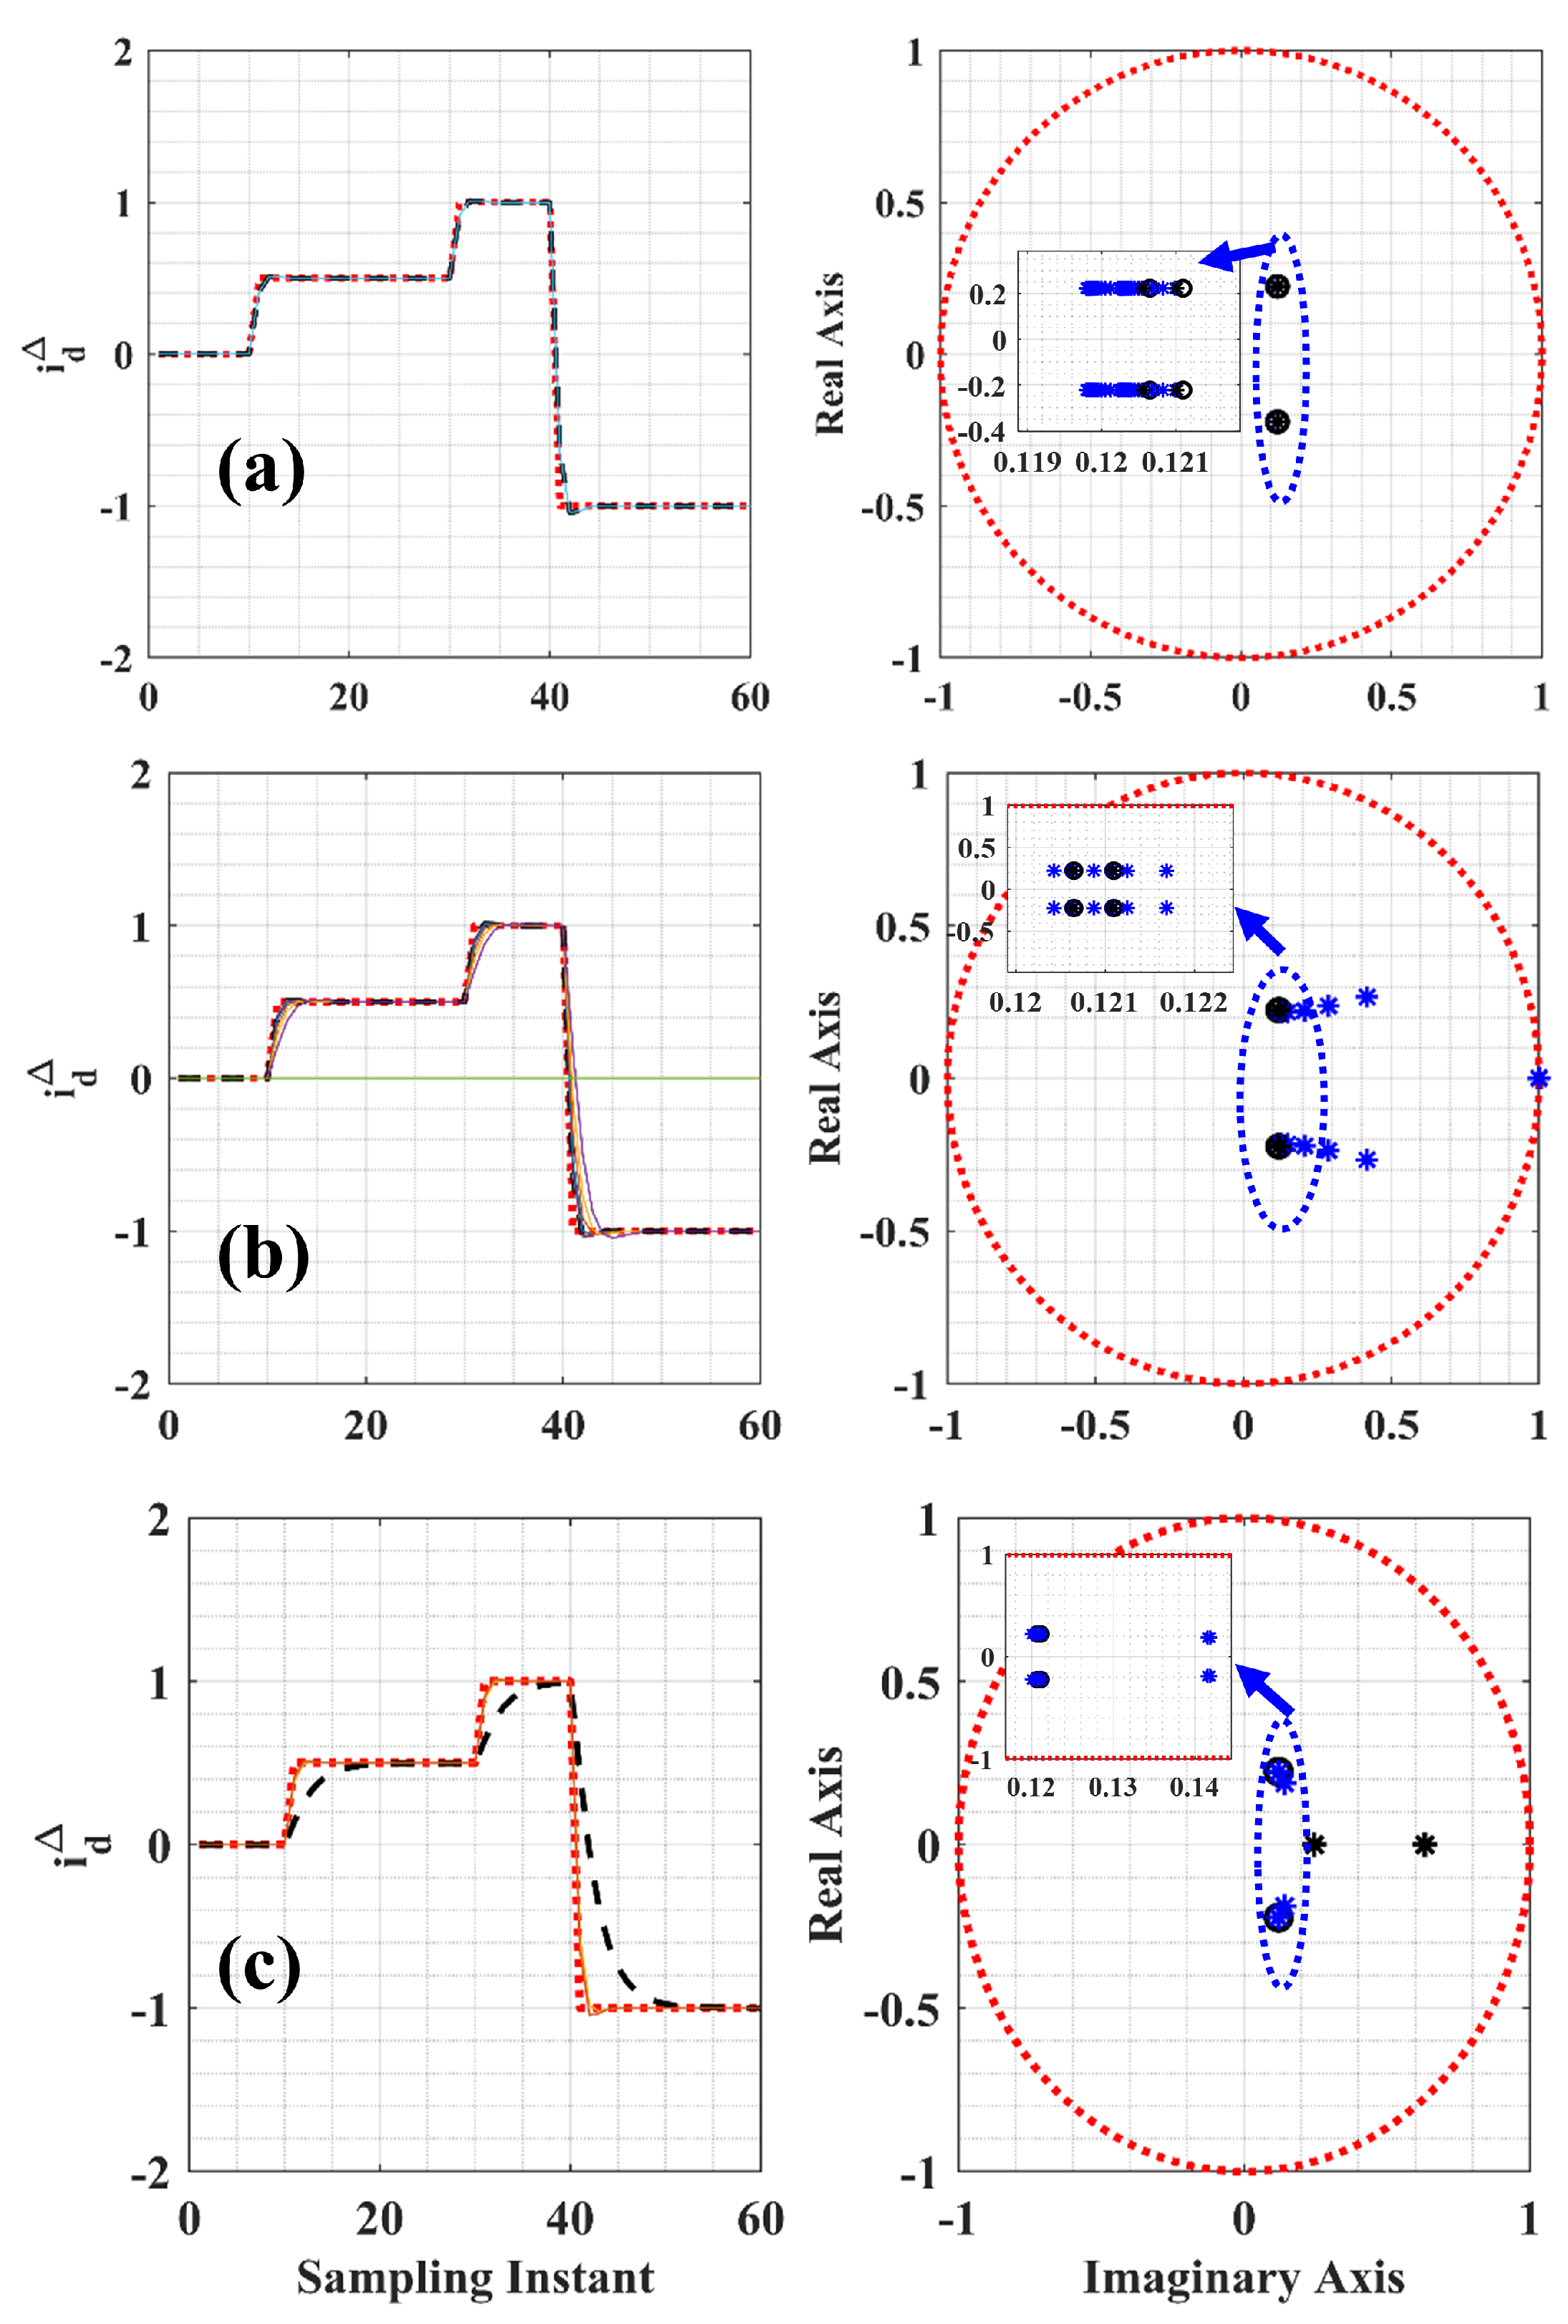
The effect of Predictive horizon ( N p ) and Laguerre’s parameter are shown in Figure 18. By looking at the eigenvalues, we see that the effect of the N p is minimum for fixed N and a at a given sample time ( T s ). The response of the system with N p = 4 is the same as that of N p = 100 , which indicates the independence of the MMC model on the Predictive horizon. However, if we look at the effect of the Laguerre’s parameter on the output signal, we can see that, at given N p , both of the parameters show alternative behaviour, i.e., with the increase in the N value system, the pole converges to the underline DLQR poles, while with the increasing a, the system goes into the unstable state, as a pole on the unit circle (as shown in Figure 18b). With a = 0 , the i d Δ response is equal to the conventional MPC, i.e., u as control variable.

3.4. Indirect Implicit MPC Simulations in RSCAD

The operation of MPC is verified with real-time simulation in RSCAD. MPC is implemented via C-builder, which runs at the time step of 80 µs.The RISC processor of NovaCor in RTDS consists of 10 cores which operate at 3.5 GHz each. A dedicated core is utilized for the MPC. Under steady-state conditions, the MPC with online quadratic optimization takes 6 ms. However, during transients, the computation time rises to 65 ms due to constraint handling. By contrast, without online optimization, the computation time remains at 9 ms for both conditions. Thus, the proposed MPC with and without online optimization can theoretically run on real-time applications. To test the performance of the MPC, a small and large disturbance in active and reactive power is observed, as discussed in Section 3.3 The constraint satisfaction problem is analyzed in the RSCAD.

3.4.1. Simulations of Disturbance in Active and Reactive Power

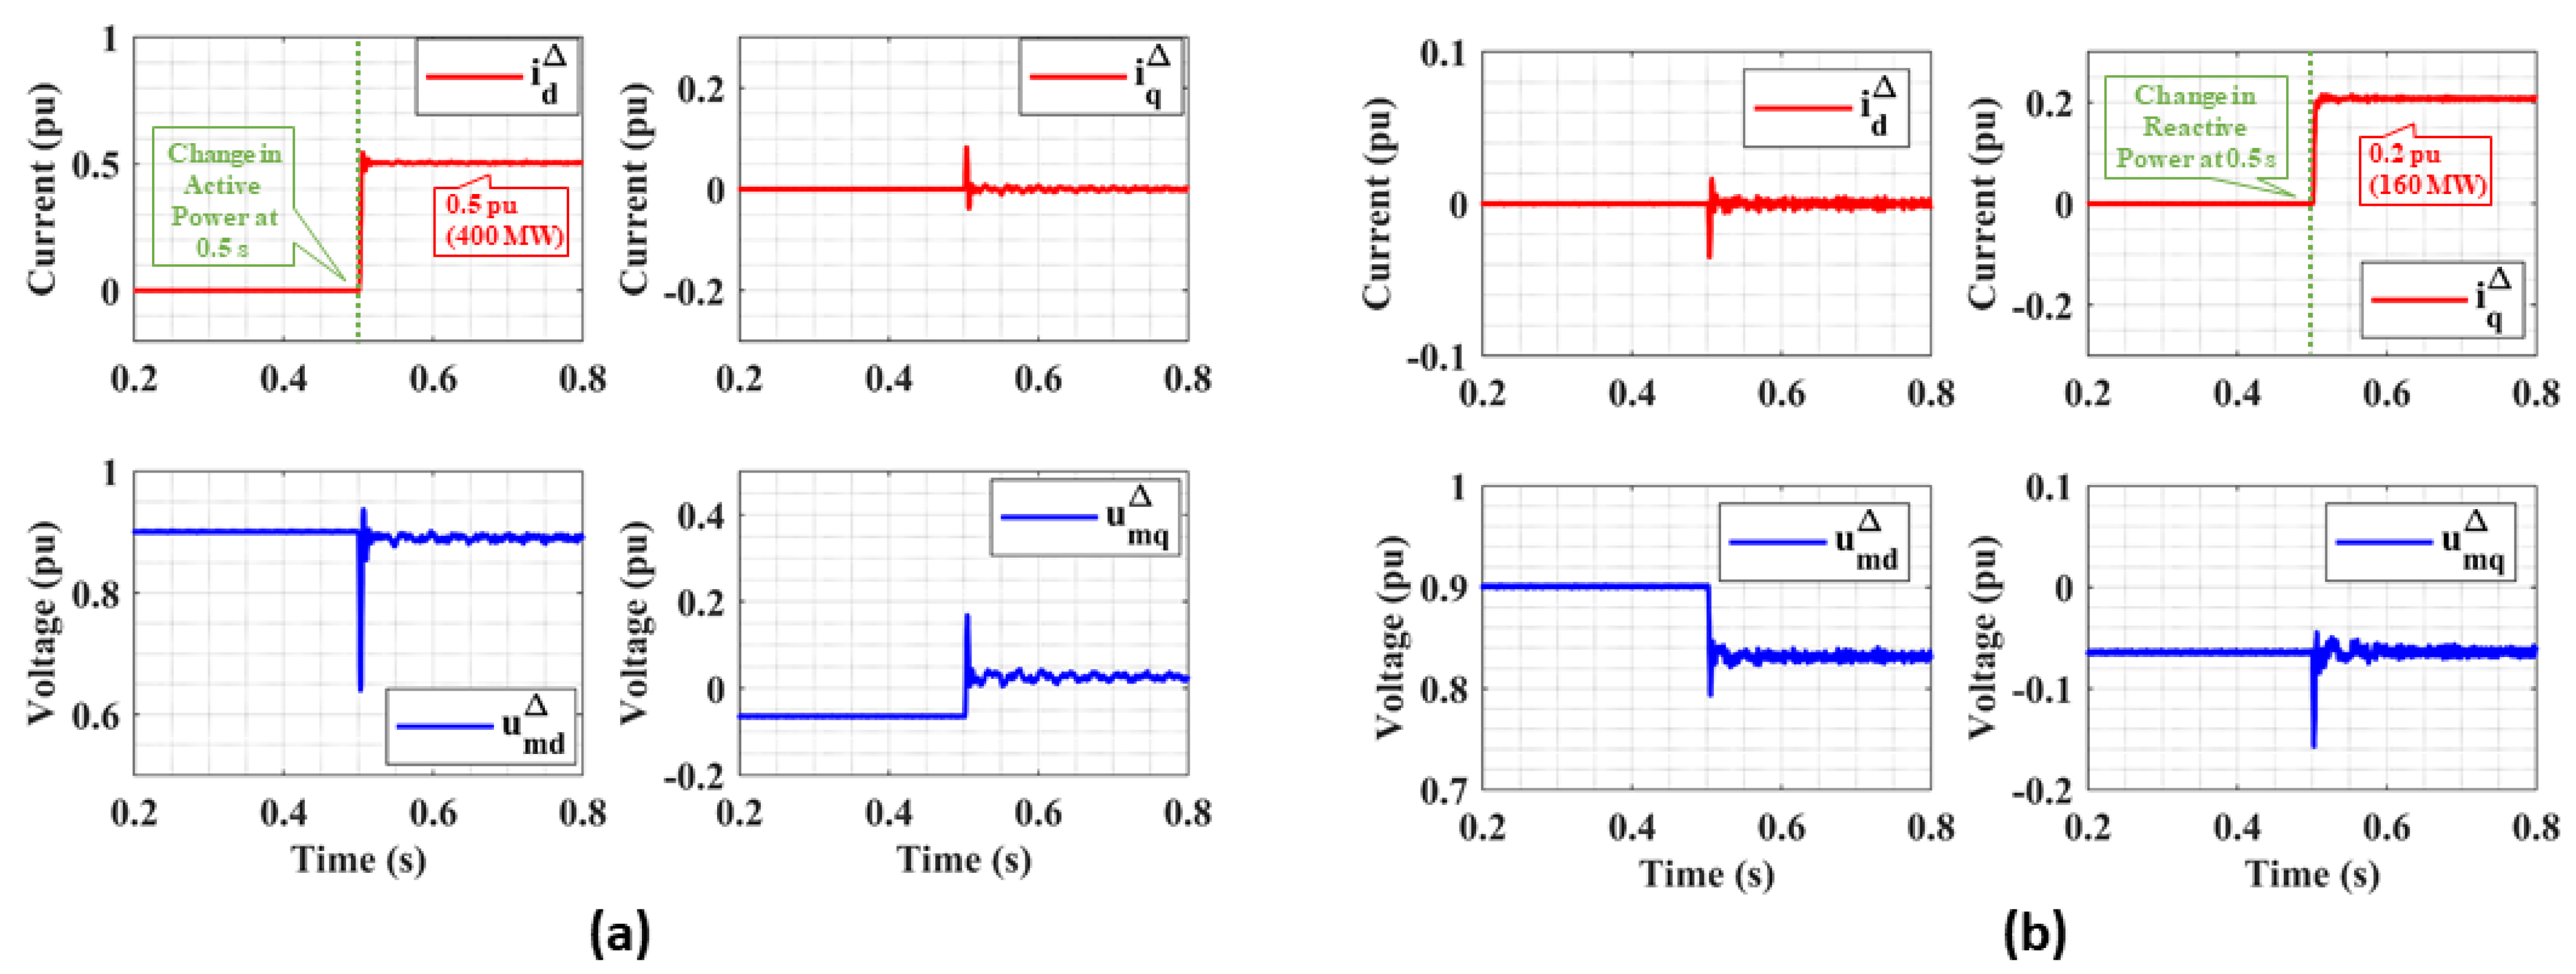
Figure 19 and Figure 20 show the small and large disturbance due to the change in active and reactive power reference. With the change in the active power reference from 0 to 0.5 p.u. at the time instance t = 0.5 s (see Figure 19a), MPC provides optimised modulating voltages values u d Δ and u d Δ after 50 µs. As a result, the d-component of grid current i d Δ tracks the reference within 4 ms as it is shown in Figure 19a. Due to the decoupling of d q components, the change in the active power set-point did not influence the reactive power component i q Δ in the steady state. However, during the transient, there is some influence, caused by the average model of MMC in RSCAD and the uncompensated modulation.
Similarly, when reactive power reference changes from 0 to 0.2 p.u. at the time instance t = 0.5 s , the diagrams are depicted in Figure 19b.
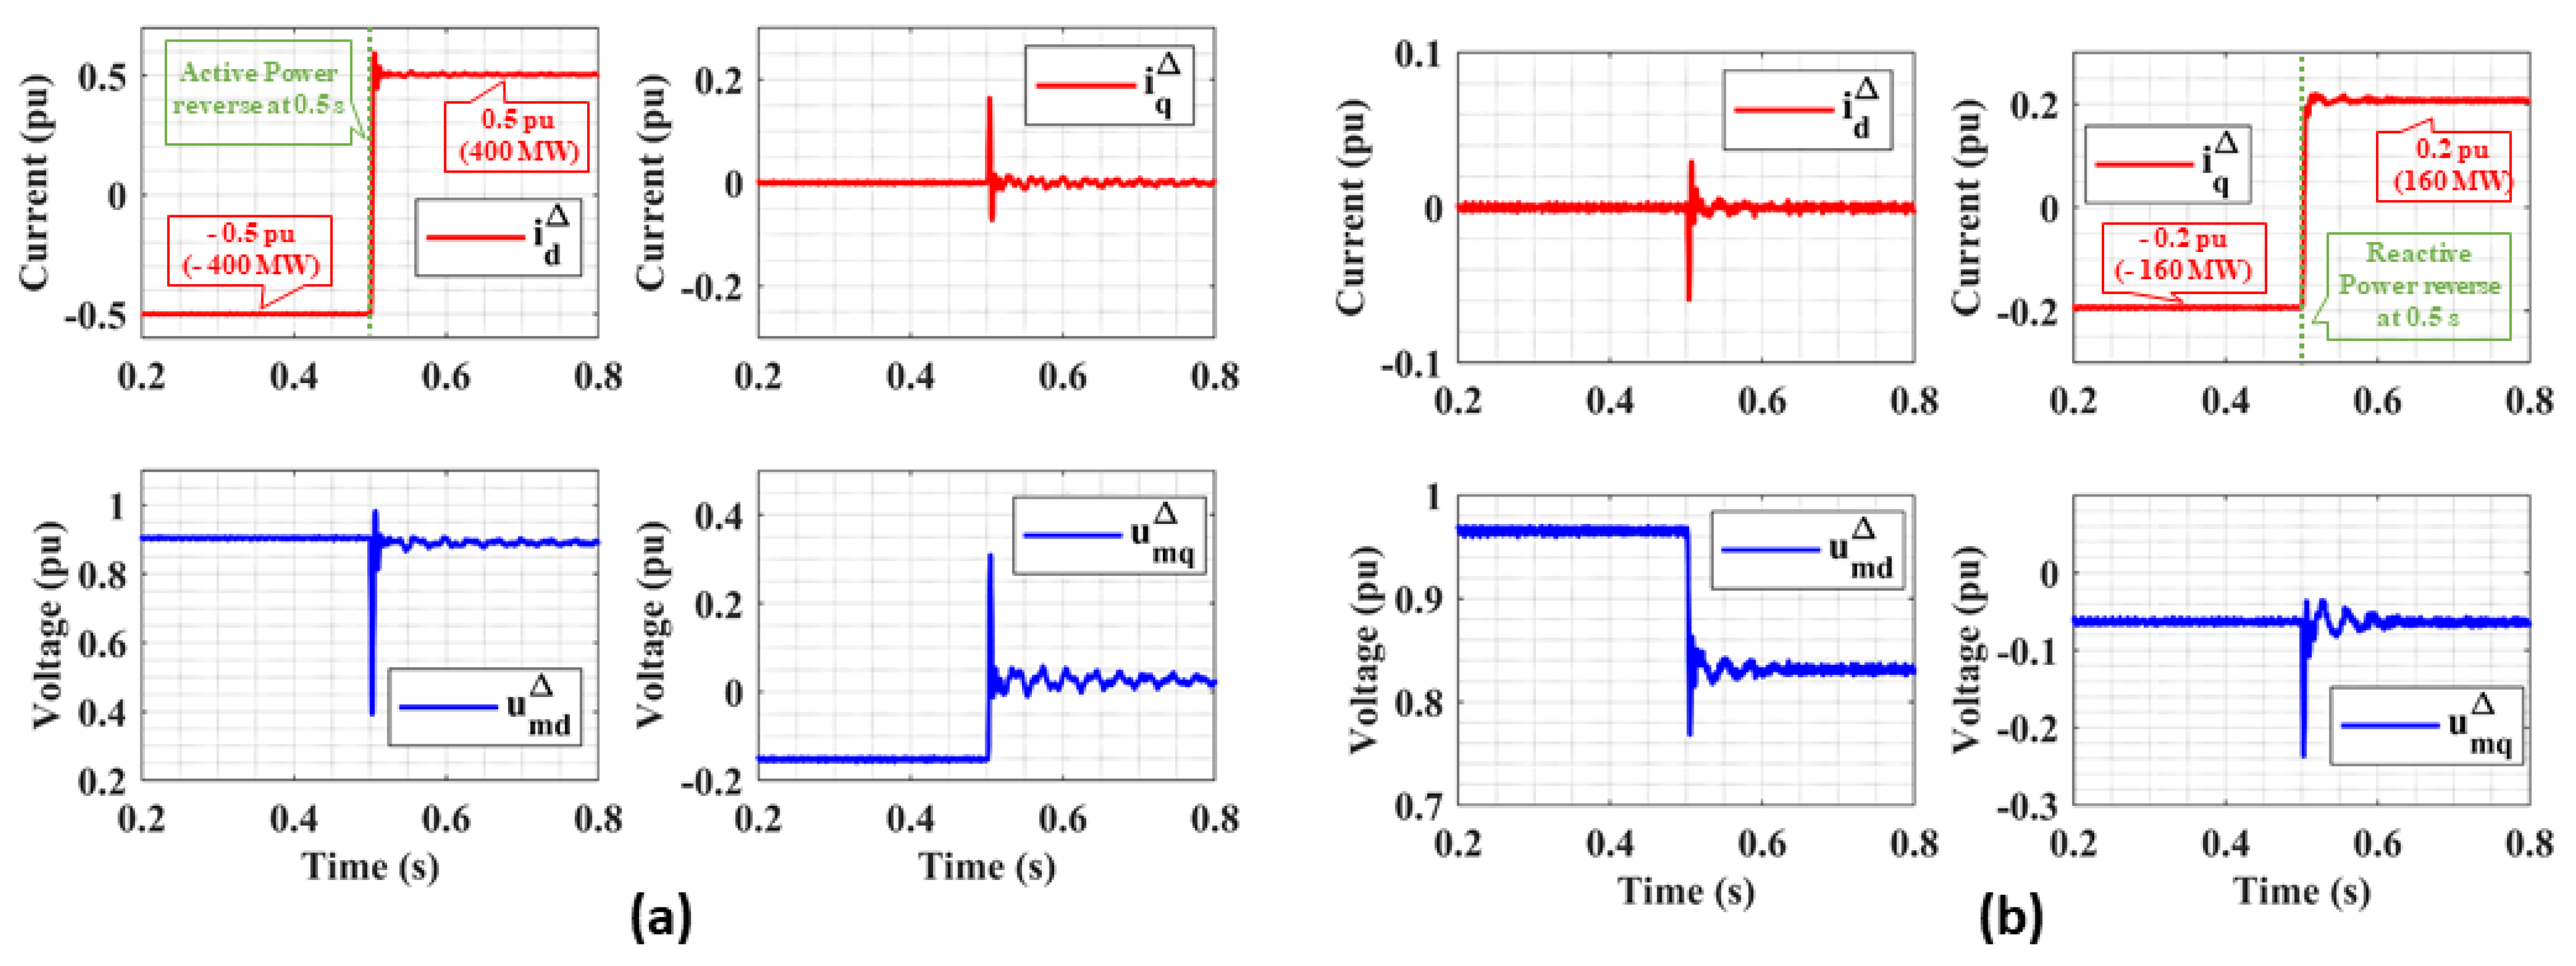
The active and reactive powers’ reversal causes small overshoots in both d q components of grid current after t = 0.5 s , see Figure 20. However, these overshoots last less than 2 ms , due to the fast response of the MPC. MPC enables quick damping of the currents and their convergence to desired references. The magnitude of overshoot is less than 5% in the case of rated power.

3.4.2. Constrained Satisfaction Problem in RSCAD

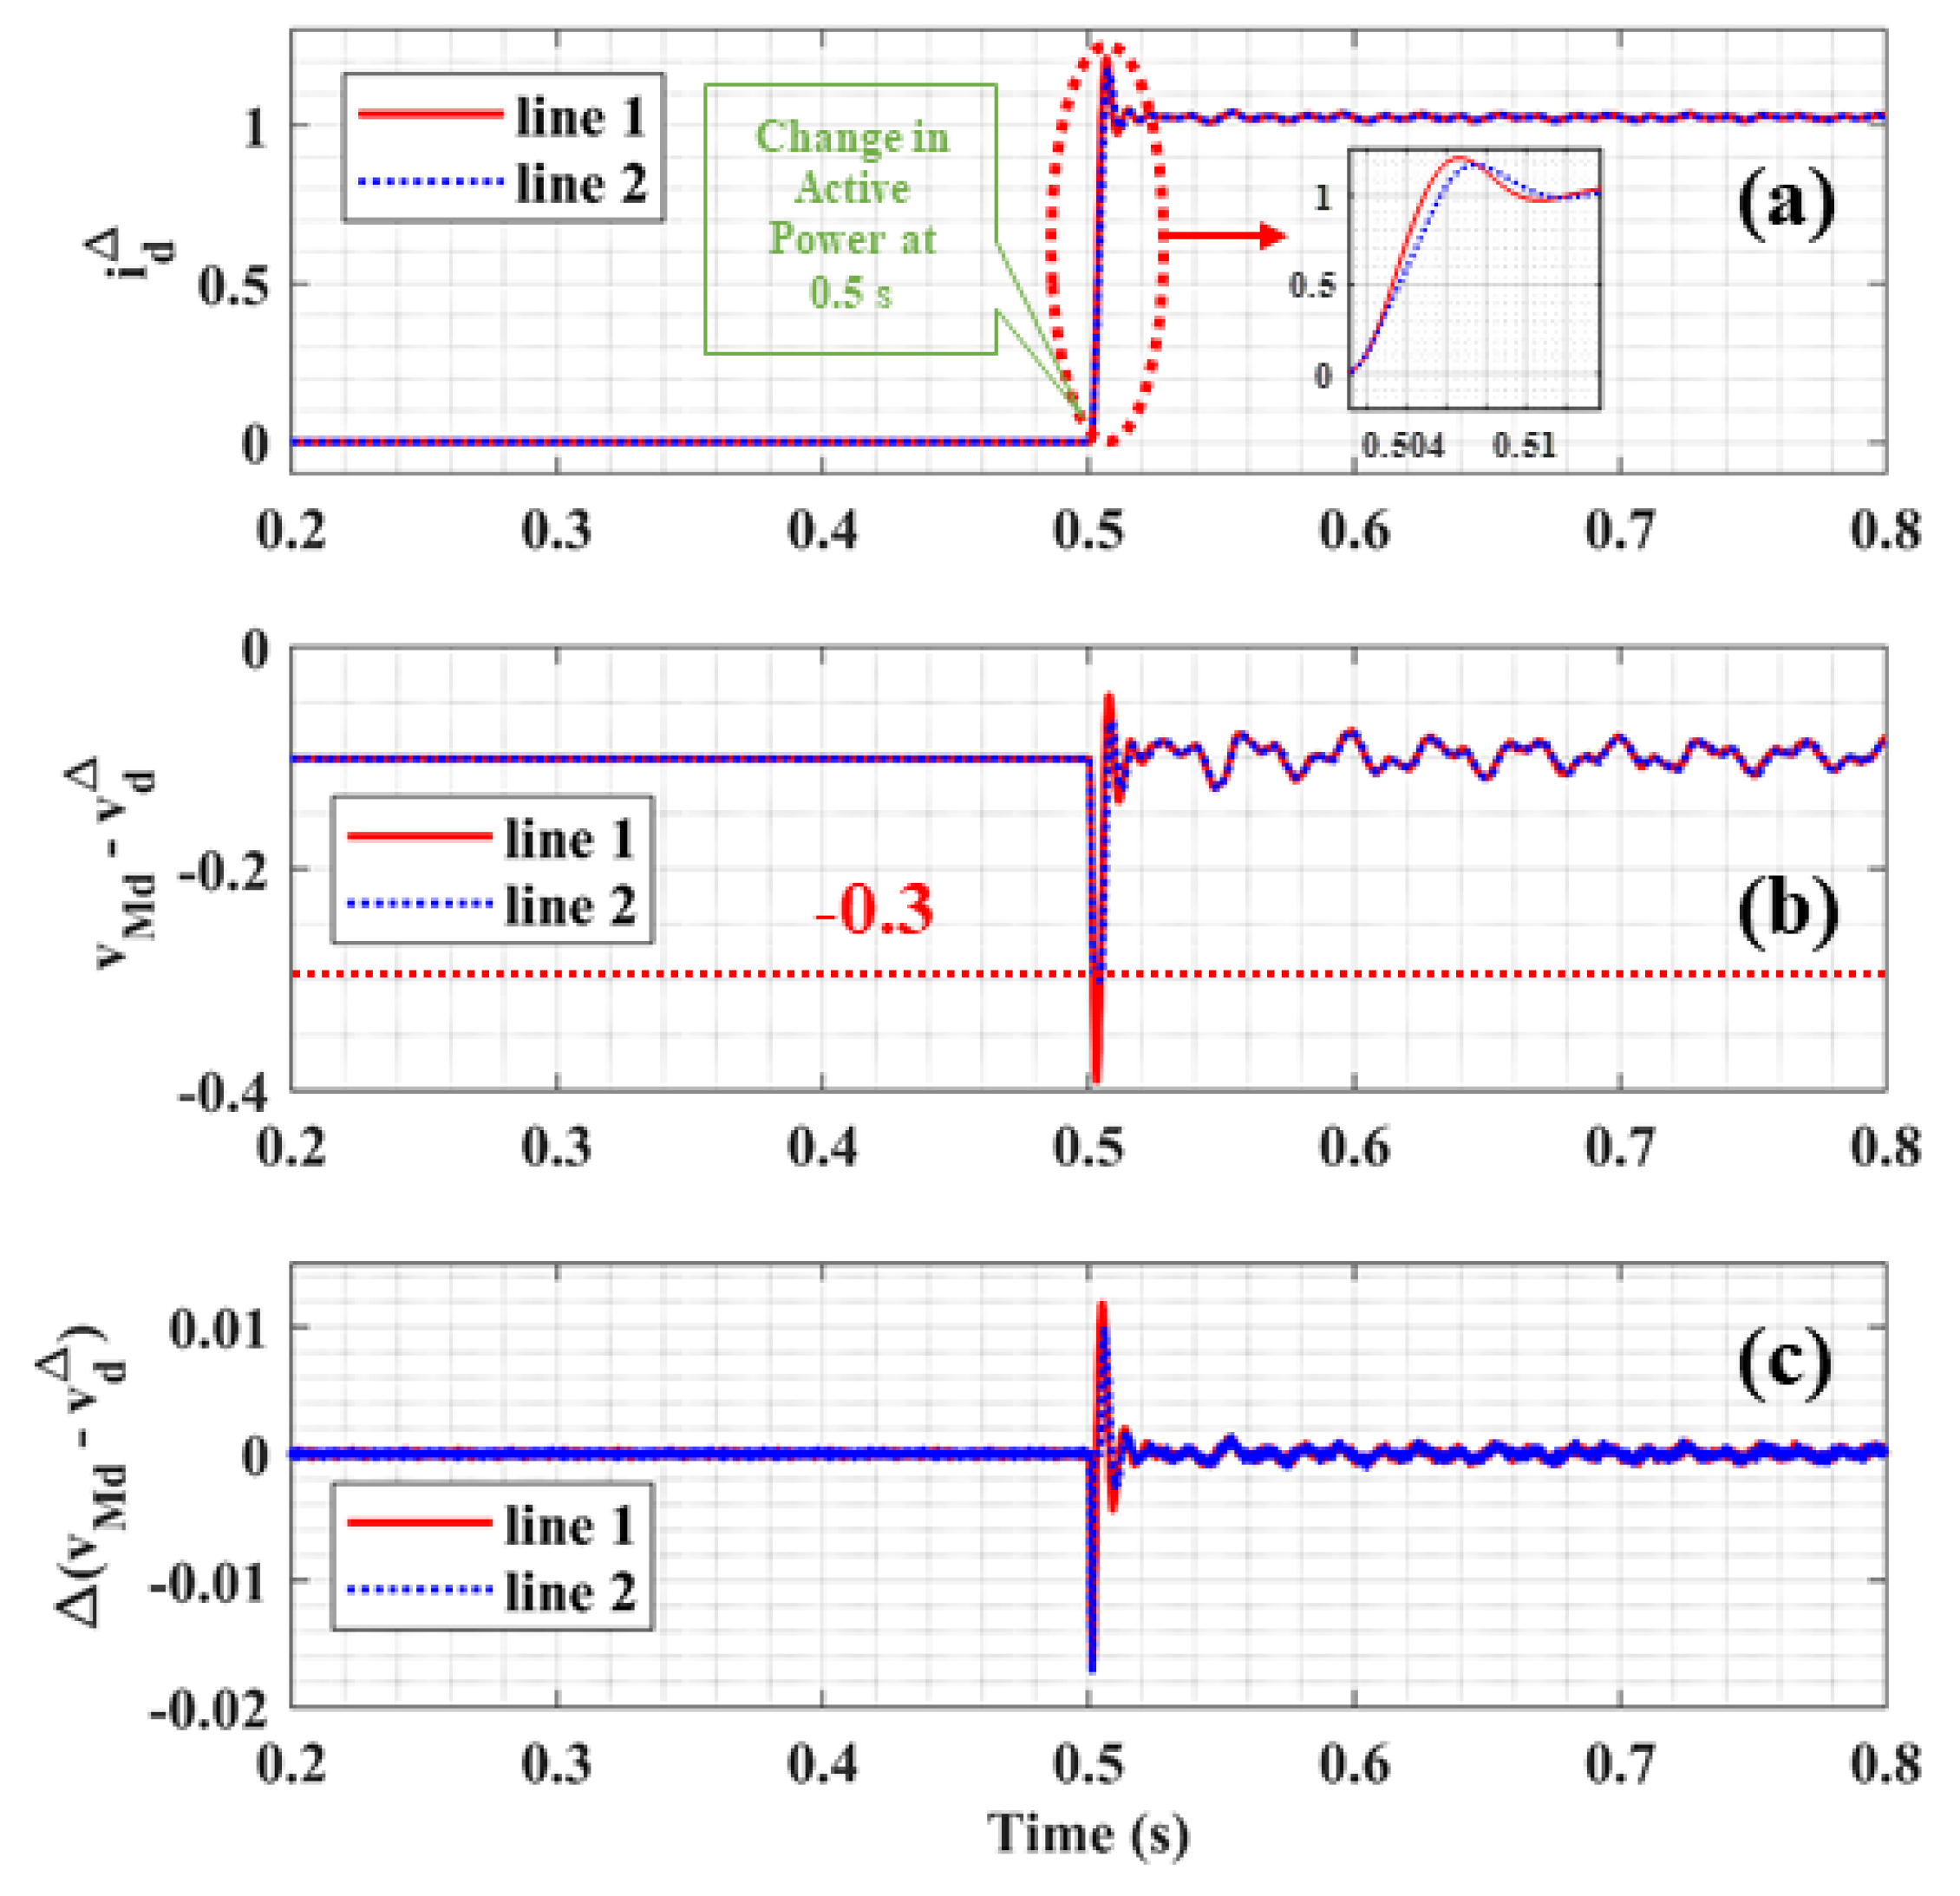
Figure 21 illustrates the effect of the constraints on the amplitude and rate of MPC’s control variables. The amplitude and rate limit are set to ± 0.3 and ± 0.1 , respectively. With the application of the constraints, the amplitude of v M d v d Δ is limited to the lower limit and the control signal is recomputed to avoid the violation. This is not the case for the unconstrained scenario at the time of disturbance as seen in Figure 21b. However, due to the amplitude, the increase of the control signal is affected as it is directly dependent on the amplitude (see Figure 21b). With the reduced rate of a control signal, the response of the MPC is delayed as seen in Figure 21a, which further leads to a reduction of the current overshoot. This delay is very small, as seen in a small window of Figure 21a. However, the reduction in the limit can result in significant delay or even cause instability.

4. Comparison of PI and MPC Controls for the MMC in RTDS

To compare the performance of MPC with PI, three control strategies are considered. The parameters of PI controllers are given in Table 2.
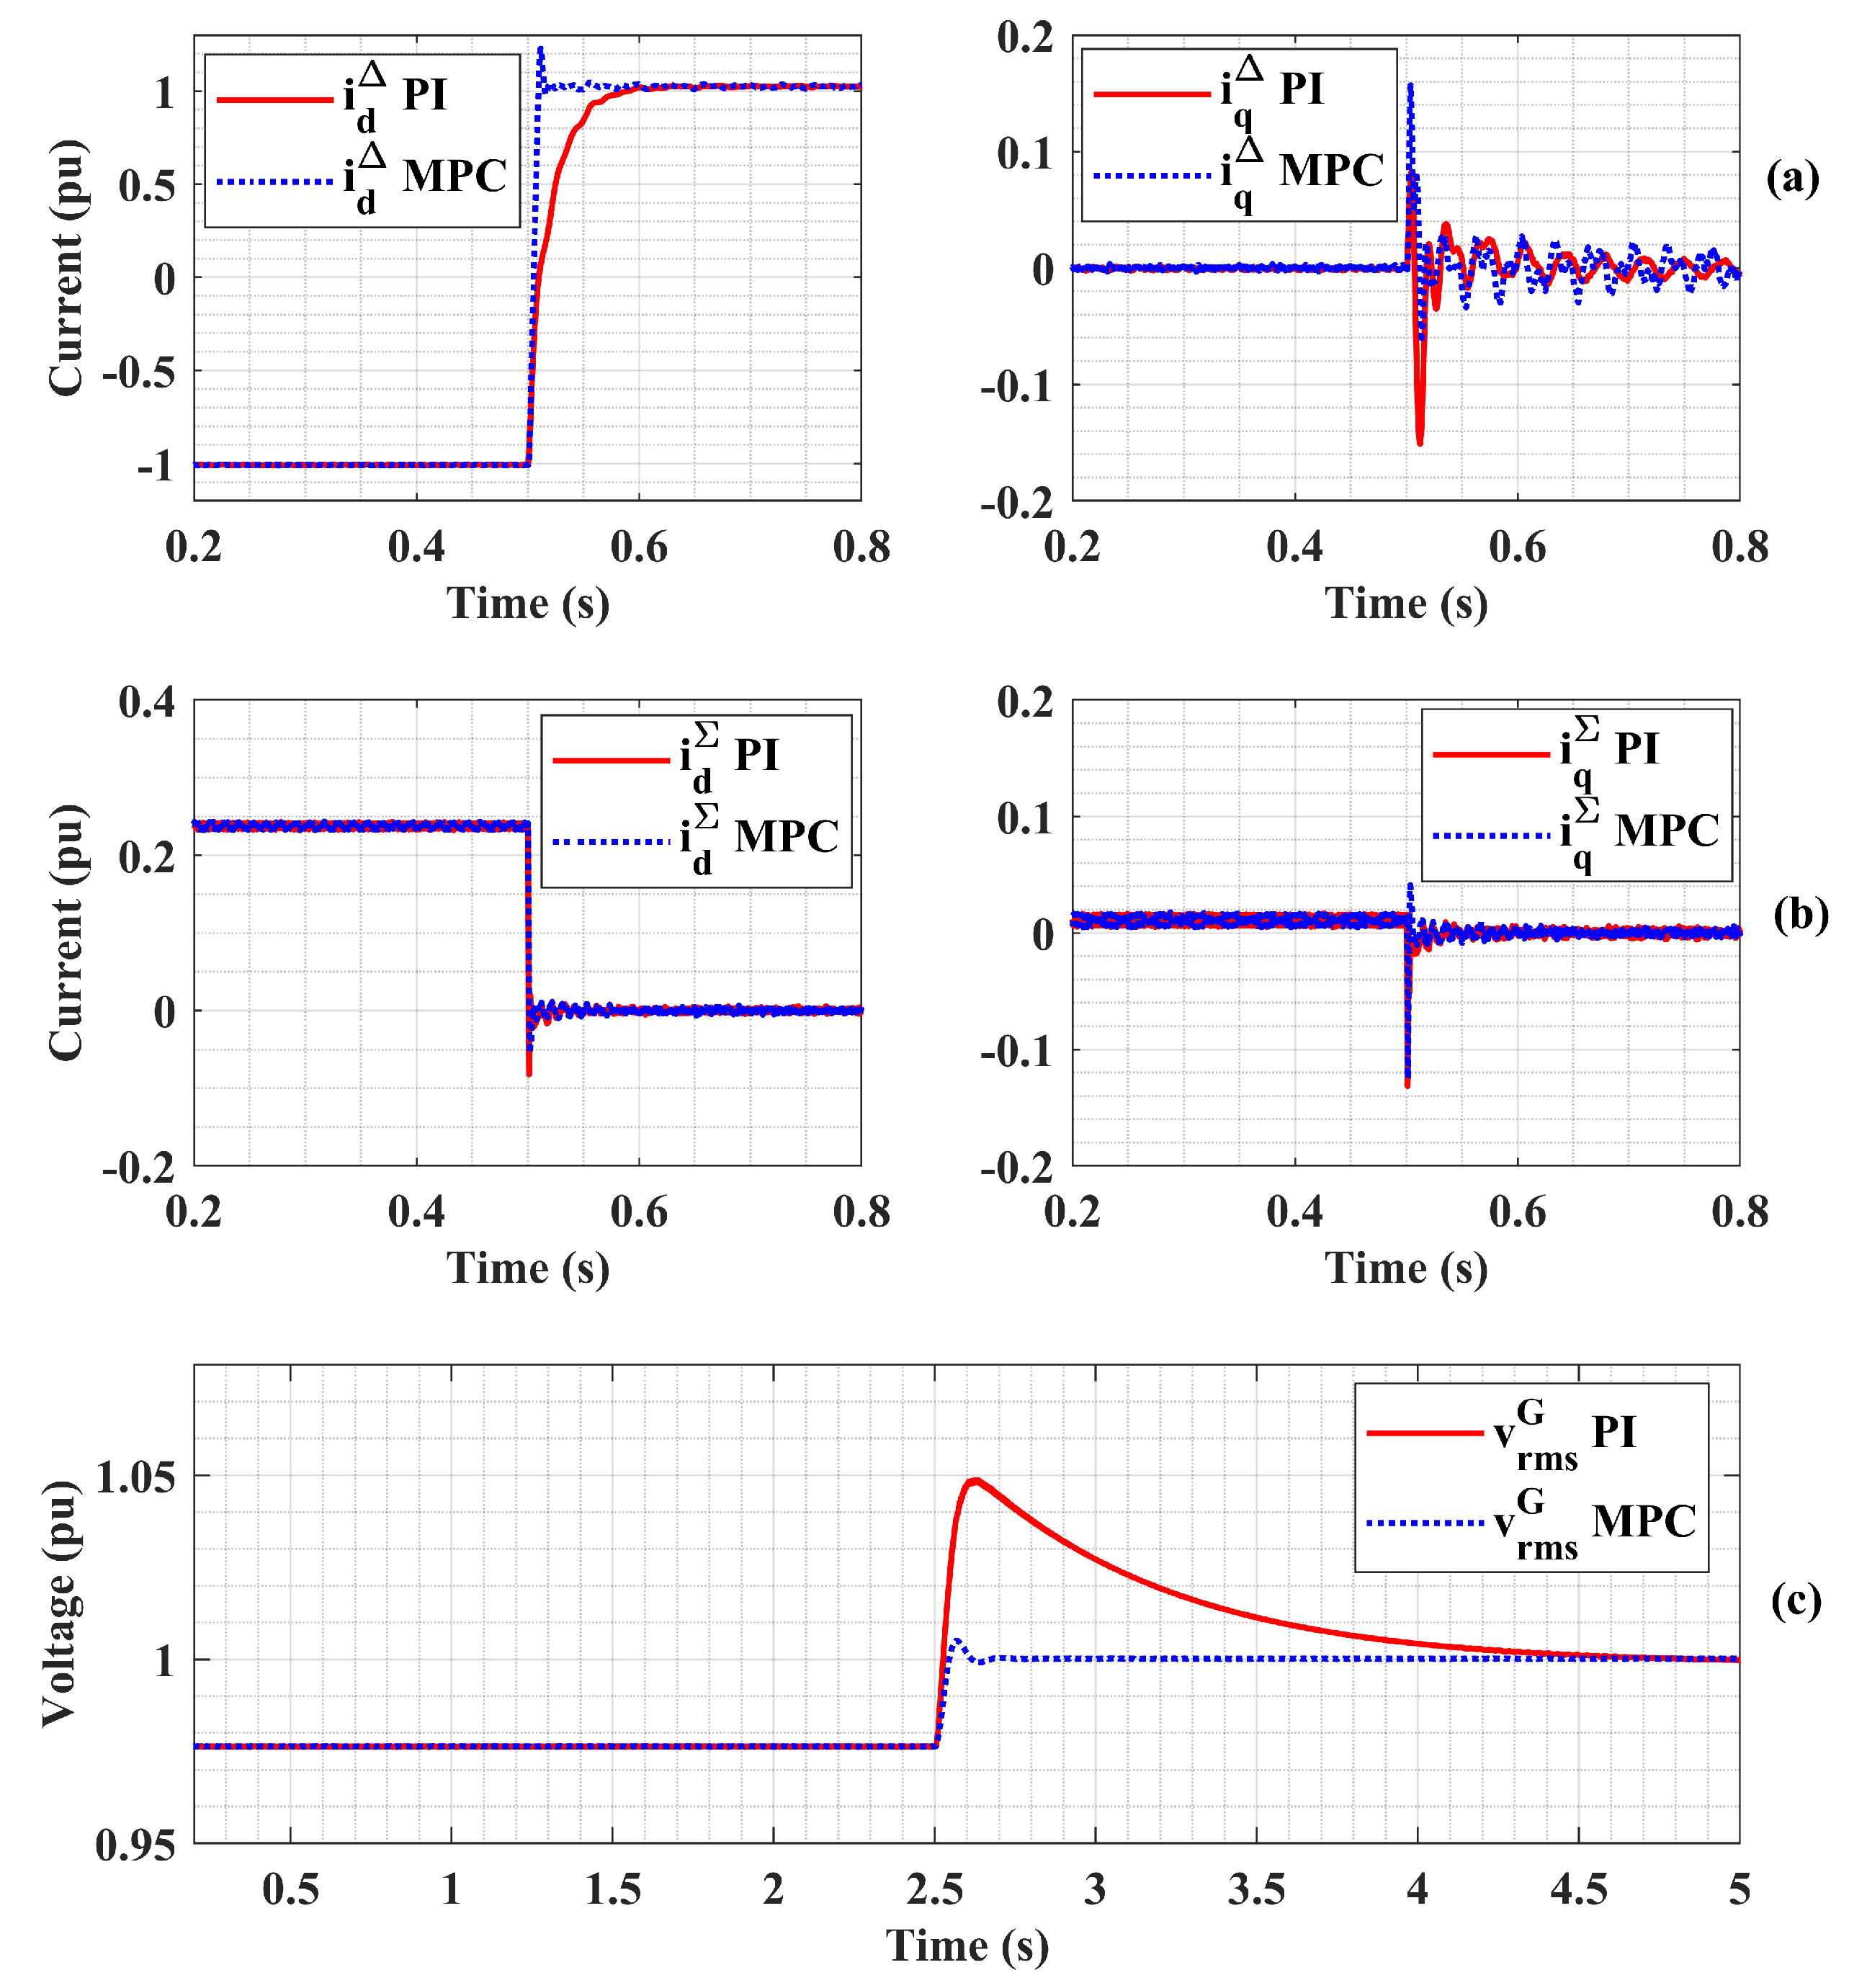
Figure 22a shows a comparison of MPC and PI controller during an active power reversal. Initially, in both cases, the active power reference is set to the rated power (i.e., −800 MW). At the time instance t = 0.5 s , a reversal command is given which changes the reference to 1 p.u. (800 MW), as shown in Figure 22a. During the power reversal, the MPC tracks the reference within 10 ms with an overshoot of 20%. Furthermore, the overshoot lasts for 5 ms. In PI controlled MMC, i d Δ current tracks the reference point from t = 0.6 s . This delayed response is due to cascaded PI controllers in PI controlled MMC, as discussed in the previous section. In both controllers, the decoupling of active and reactive power controls is seen in the steady state. Due to uncompensated modulation, d q components are interdependent during a transient.
Figure 22b indicates the effect of circulating current suppression control in both controllers. Initially, the system runs at rated power (800 MW). The CCSC is activated at 0.5 s for both controllers. As seen from Figure 22b, d q components of the circulating current drop to zero indicating activation of CCSC. Due to the lower time constants in the PI, the response of PI and MPC overlaps.
Figure 22c illustrates reactive power support for both controllers. At rated active power, the RMS value of AC bus voltage drops to 0.97 p.u. With the activation of reactive support, bus voltage restores to 1 p.u. (380 kV) in both controllers. The response of the MPC is faster as compared to PI, and with a much smaller overshoot. The MPC restores the AC bus voltage within 100 ms, which is not the case for the PI controlled MMC. The PI controller takes 2 s to settle to the reference value (1 p.u.). This higher time is due to the slower outer controlling PI loop.

5. Conclusions

This paper presents the mathematical model of the MMC and its controls, which is verified in the real-time simulation tool RSCAD. Models are verified with the number of relevant simulation scenarios. The presented results show that the mathematical model provides a good level of performance during the steady-state and transient operation concerning the RSCAD model.
Furthermore, this paper presented a variant of MPC by using Laguerre’s function for the discretized MMC with exact differential equations’ solution. The MPC is designed as a discrete with indirect implicit control. Both constrained and unconstrained scenarios were analysed and compared taking into account changes of active and reactive power setpoints. In general, with the constraints on the states, the dynamic response is affected. However, there is no effect on the steady-state response. With the amplitude constrained control signals, the overshoot is reduced with recomputation during an online optimisation. It is shown that the transient response is largely dependent on the sample time ( T s ). Thus, with the increase in the T s , a highly damped model is obtained, with a response equivalent to the step response of the model. The designed control is computationally efficient, with a small prediction horizon, which does not influence pole placement. Thus, it can be considered as a potential candidate for real-time simulation and testing. The pole movement with the change in the weighting factor R gets concentrated below the unity circle with an increase in the T s , which makes the model stable. Similarly, the pole movement due to an increase in N gets saturated after a certain value, whereas the pole movement with a change in Laguerre’s pole varies. Furthermore, the implementation of the proposed variant of MPC is verified in RTDS. The comparison between PI and proposed MPC during different operating scenarios indicates the stable and faster response of MPC, which is essential during transient events. The proposed MPC has a clear advantage over classical controlling methods. The future work will be solving the challenges of the proposed MPC in Hardware in loop (HIL).

Author Contributions

Conceptualization, methodology, formal analysis: A.S. and A.L.; simulations: A.S.; writing—original draft preparation: A.S., A.L., J.L.R.T. and P.P.; idea: A.L., supervision: A.L., J.L.R.T. and P.P. All authors have read and agreed to the published version of the manuscript.

Funding

This research was fully funded by the Delft University of Technology through Sectorplan project.

Conflicts of Interest

The authors declare no conflict of interest. The funders had no role in the design of the study; in the collection, analyses, or interpretation of data; in the writing of the manuscript, or in the decision to publish the results.

References

  1. United Nations. Paris Agreement. In United Nations Treaty Collection; United Nations: New York, NY, USA, 2015; pp. 1–27. [Google Scholar]
  2. Lesnicar, A.; Marquardt, R. An innovative modular multilevel converter topology suitable for a wide power range. In Proceedings of the 2003 IEEE Bologna Power Tech Conference Proceedings, Bologna, Italy, 23–26 June 2003; Volume 3, p. 6. [Google Scholar] [CrossRef]
  3. Toghani Holari, Y.; Taher, S.A.; Mehrasa, M. Power management using robust control strategy in hybrid microgrid for both grid-connected and islanding modes. J. Energy Storage 2021, 39, 102600. [Google Scholar] [CrossRef]
  4. Bessegato, L.; Harnefors, L.; Ilves, K.; Norrga, S. A Method for the Calculation of the AC-Side Admittance of a Modular Multilevel Converter. IEEE Trans. Power Electron. 2019, 34, 4161–4172. [Google Scholar] [CrossRef] [Green Version]
  5. Beza, M.; Bongiorno, M.; Stamatiou, G. Analytical Derivation of the AC-Side Input Admittance of a Modular Multilevel Converter With Open- and Closed-Loop Control Strategies. IEEE Trans. Power Deliv. 2018, 33, 248–256. [Google Scholar] [CrossRef]
  6. Stamatiou, G.; Beza, M.; Bongiorno, M.; Harnefors, L. Analytical derivation of the DC-side input admittance of the direct-voltage controlled modular multilevel converter. IET Gener. Transm. Distrib. 2017, 11, 4018–4030. [Google Scholar] [CrossRef]
  7. Sakinci, O.C.; Beerten, J. Generalized Dynamic Phasor Modeling of the MMC for Small-Signal Stability Analysis. IEEE Trans. Power Deliv. 2019, 34, 991–1000. [Google Scholar] [CrossRef]
  8. Lyu, J.; Zhang, X.; Cai, X.; Molinas, M. Harmonic State-Space Based Small-Signal Impedance Modeling of a Modular Multilevel Converter with Consideration of Internal Harmonic Dynamics. IEEE Trans. Power Electron. 2019, 34, 2134–2148. [Google Scholar] [CrossRef] [Green Version]
  9. Sun, J.; Liu, H. Sequence Impedance Modeling of Modular Multilevel Converters. IEEE J. Emerg. Sel. Top. Power Electron. 2017, 5, 1427–1443. [Google Scholar] [CrossRef]
  10. De Rua, P.; Sakinci, O.C.; Beerten, J. Comparative Study of Dynamic Phasor and Harmonic State-Space Modeling for Small-Signal Stability Analysis. Electr. Power Syst. Res. 2020, 189, 106626. [Google Scholar] [CrossRef]
  11. Bergna-Diaz, G.; Freytes, J.; Guillaud, X.; D’Arco, S.; Suul, J.A. Generalized Voltage-Based State-Space Modeling of Modular Multilevel Converters With Constant Equilibrium in Steady State. IEEE J. Emerg. Sel. Top. Power Electron. 2018, 6, 707–725. [Google Scholar] [CrossRef] [Green Version]
  12. Cigré, W. Guide for the Development of Models for HVDC Converters in a HVDC Grid; Technical Brochures B4.57; CIGRÉ: Paris, France, 2014; Volume 604, pp. 1–222. [Google Scholar]
  13. Hosseinzadeh, M.; Schenato, L.; Garone, E. A distributed optimal power management system for microgrids with plug&play capabilities. Adv. Control Appl. Eng. Ind. Syst. 2021, 3, e65. [Google Scholar]
  14. Kang, W.; Chen, M.; Lai, W.; Luo, Y. Distributed real-time power management for virtual energy storage systems using dynamic price. Energy 2021, 216, 119069. [Google Scholar] [CrossRef]
  15. Aguilera, R.P.; Acuna, P.; Su, X.; Lezana, P.; McGrath, B. Sequential Phase-Shifted Model Predictive Control for multicell power converters. In Proceedings of the 2017 IEEE Southern Power Electronics Conference (SPEC), Puerto Varas, Chile, 4–7 December 2017; pp. 1–6. [Google Scholar] [CrossRef]
  16. Dekka, A.; Wu, B.; Yaramasu, V.; Fuentes, R.L.; Zargari, N.R. Model Predictive Control of High-Power Modular Multilevel Converters—An Overview. IEEE J. Emerg. Sel. Top. Power Electron. 2019, 7, 168–183. [Google Scholar] [CrossRef]
  17. Stanojev, O.; Markovic, U.; Vrettos, E.; Aristidou, P.; Callaway, D.; Hug, G. Enhanced MPC for Fast Frequency Control in Inverter-Dominated Power Systems. In Proceedings of the 2020 International Conference on Smart Energy Systems and Technologies (SEST), Istanbul, Turkey, 7–9 September 2020; pp. 1–6. [Google Scholar] [CrossRef]
  18. Stanojev, O.; Markovic, U.; Aristidou, P.; Hug, G.; Callaway, D.S.; Vrettos, E. MPC-Based Fast Frequency Control of Voltage Source Converters in Low-Inertia Power Systems. IEEE Trans. Power Syst. 2020, 1. [Google Scholar] [CrossRef]
  19. Zheng, C.; Dragicevic, T.; Blaabjerg, F. Model Predictive Control Based Virtual Inertia Emulator for an Islanded AC Microgrid. IEEE Trans. Ind. Electron. 2020, 1. [Google Scholar] [CrossRef]
  20. Rodriguez-Bernuz, J.M.; Junyent-Ferré, A. Model predictive circulating current regulator for single-phase modular multilevel converter. In Proceedings of the 2018 IEEE Energy Conversion Congress and Exposition (ECCE), Portland, OR, USA, 23–27 September 2018; IEEE: Piscataway, NJ, USA, 2018; pp. 4824–4830. [Google Scholar]
  21. Rodriguez-Bernuz, J.M.; Junyent-Ferré, A. Operating Region Extension of a Modular Multilevel Converter using Model Predictive Control: A Single Phase Analysis. IEEE Trans. Power Deliv. 2019, 35, 171–182. [Google Scholar] [CrossRef]
  22. Tavakoli, S.D.; Fekriasl, S.; Prieto-Araujo, E.; Beerten, J.; Gomis-Bellmunt, O. Optimal H Infinity Control Design for MMC-based HVDC Links. IEEE Trans. Power Deliv. 2021. [Google Scholar] [CrossRef]
  23. Darivianakis, G.; Geyer, T.; van der Merwe, W. Model predictive current control of modular multilevel converters. In Proceedings of the 2014 IEEE Energy Conversion Congress and Exposition (ECCE), Pittsburgh, PA, USA, 14–18 September 2014; IEEE: Piscataway, NJ, USA, 2014; pp. 5016–5023. [Google Scholar]
  24. Vazquez, S.; Rodriguez, J.; Rivera, M.; Franquelo, L.G.; Norambuena, M. Model predictive control for power converters and drives: Advances and trends. IEEE Trans. Ind. Electron. 2016, 64, 935–947. [Google Scholar] [CrossRef] [Green Version]
  25. Ou, K.; Maguire, T.; Warkentin, B.; Chen, Y.; Zhang, Y.; Kuffel, R.; Cai, Z.; Guan, L. Research and application of small time-step simulation for MMC VSC-HVDC in RTDS. In Proceedings of the 2014 International Conference on Power System Technology, Chengdu, China, 20–22 October 2014; pp. 877–882. [Google Scholar] [CrossRef]
  26. Real-Time Digital Simulator. VSC Small Time-Step Modeling; Technical Report October; RTDS Technologies: Winnipeg, MB, Canada, 2006. [Google Scholar]
  27. Wu, H.; Wang, X. Dynamic impact of zero-sequence circulating current on modular multilevel converters: Complex-valued AC impedance modeling and analysis. IEEE J. Emerg. Sel. Top. Power Electron. 2019, 8, 1947–1963. [Google Scholar] [CrossRef]
  28. Sammut, C.; Webb, G.I. (Eds.) Mean Absolute Error. In Encyclopedia of Machine Learning; Springer US: Boston, MA, USA, 2010; p. 652. [Google Scholar] [CrossRef]
  29. Zama, A.; Benchaib, A.; Bacha, S.; Frey, D.; Silvant, S. High Dynamics Control for MMC Based on Exact Discrete-Time Model With Experimental Validation. IEEE Trans. Power Deliv. 2018, 33, 477–488. [Google Scholar] [CrossRef]
  30. Wang, L. Model Predictive Control System Design and Implementation Using MATLAB®; Springer Science & Business Media: Berlin/Heidelberg, Germany, 2009. [Google Scholar]
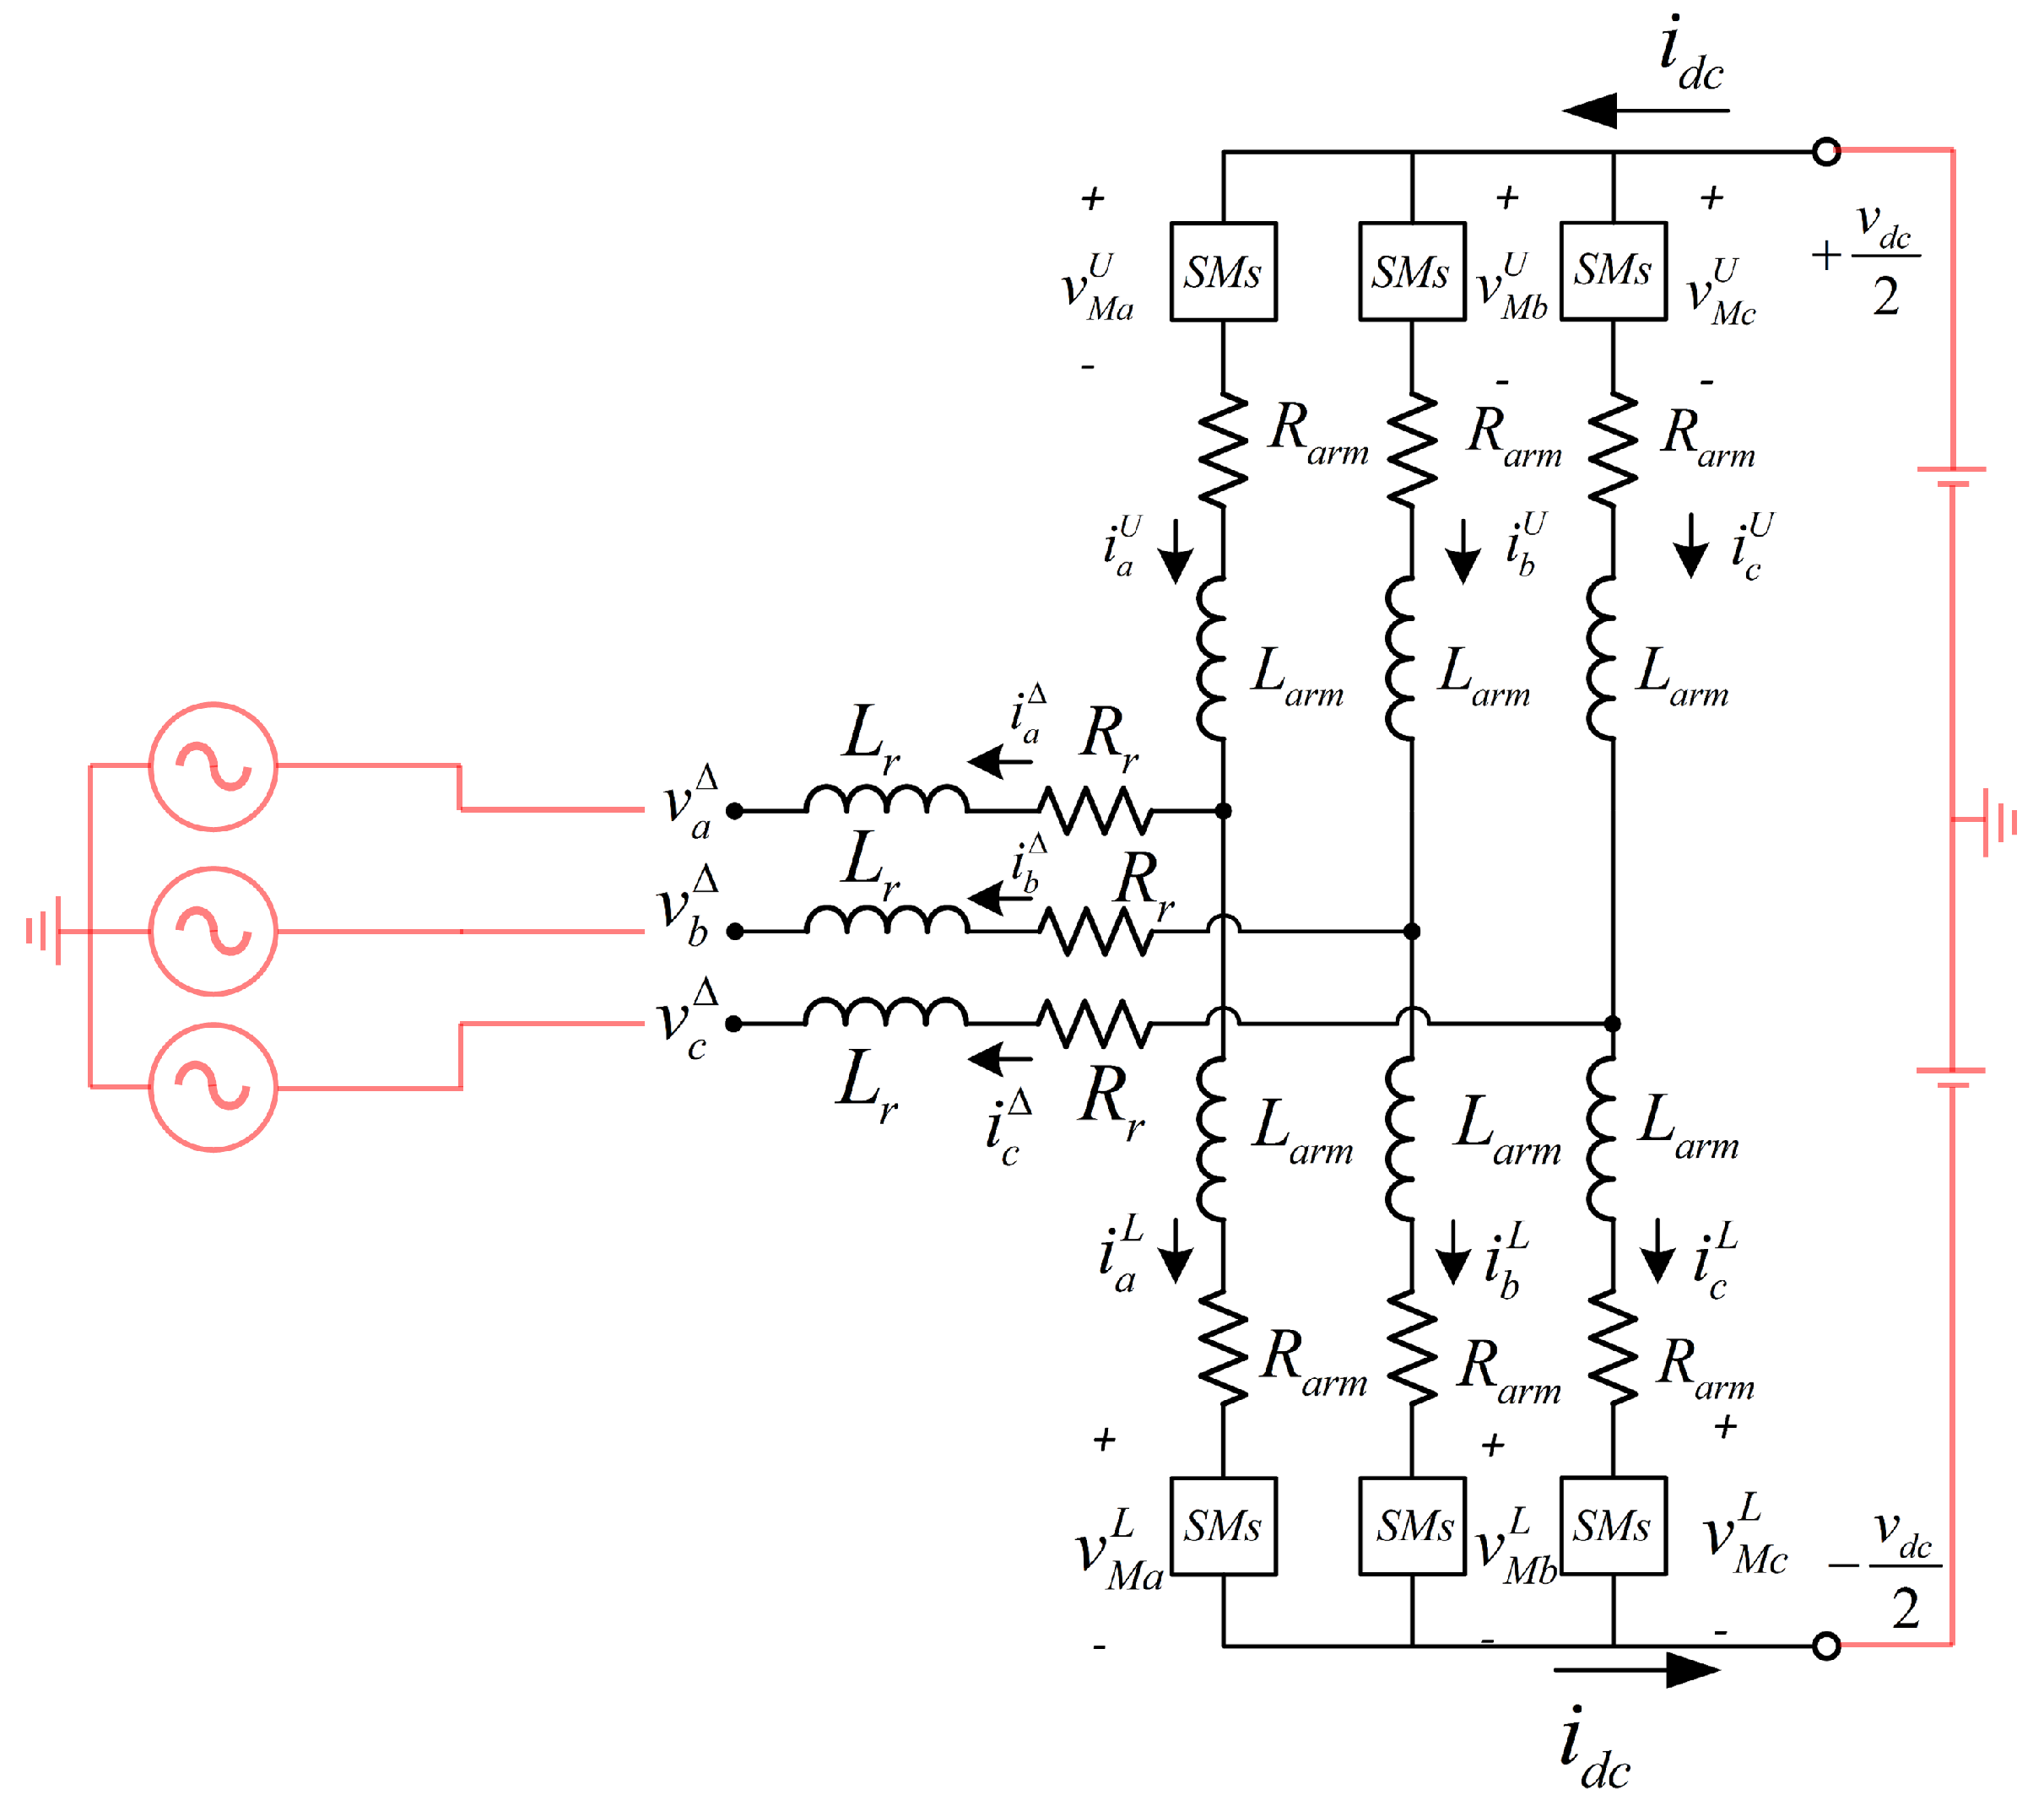
Figure 1. MMC-topology.
Energies 14 03318 g001
Figure 2. An arm representation of MMC in the RSCAD [26].
Energies 14 03318 g002
Figure 3. Test circuit for model validation.
Energies 14 03318 g003
Figure 4. Implemented controlling loops for: (a) active and reactive power control; (b) output current control; and (c) circulating current control.
Energies 14 03318 g004
Figure 5. Comparison of: (a) active power; (b) reactive power; (c) output current i d Δ ; and (d) output current i q Δ ; in MATLAB (blue) and RSCAD (red) during step change of the active power from 1 p.u. to 0.3 p.u. at the time instance t = 0.6 s .
Energies 14 03318 g005
Figure 6. Comparison of (a) circulating current ( i d Σ and i q Σ ); (b) Σ components of capacitor voltage in dqz reference frame; in MATLAB (blue) and RSCAD (red) during step change in active power from 1 p.u. to 0.3 p.u. at the time instance t = 0.6 s .
Energies 14 03318 g006
Figure 7. Comparison of the zero sequence circulating current i z Σ MATLAB (blue) and RSCAD (red), during step change in active power from 1 p.u. to 0.3 p.u. at the time instance t = 0.6 s .
Energies 14 03318 g007
Figure 8. Comparison of: (a) active power; (b) reactive power; (c) i d Δ current; and (d) i q Δ current; in MATLAB (blue) and RSCAD (red) during step change in reactive power from 0 p.u. to 0.25 p.u. at the time instance t = 0.6 s .
Energies 14 03318 g008
Figure 9. Comparison of: (a) circulating currents i d Σ and i q Σ ; (b) Σ components of capacitor voltage in the d q z reference frame; in MATLAB (blue) and RSCAD (red), during step change in Reactive power from 0 p.u. to 0.25 p.u. at the time instance t = 0.6 s .
Energies 14 03318 g009
Figure 10. Comparison of: (a) active power; (b) reactive power; (c) output current i d Δ ; and (d) output current i q Δ ; in MATLAB (blue) and RSCAD (red) during active power reversal from 1 p.u. to -1 p.u. at the time instance t = 0.6 s .
Energies 14 03318 g010
Figure 11. Comparison of: (a) circulating currents i d Σ and i q Σ ; (b) Σ components of arm capacitor voltage in the d q z reference frame; in MATLAB (blue) and RSCAD (red) during active power reversal from 1 p.u. to -1 p.u. at the time instance t = 0.6 s .
Energies 14 03318 g011
Figure 12. Comparison of zero sequence circulating current i z Σ in MATLAB (blue) and RSCAD (red), during active power reversal from 1 p.u. to -1 p.u. at the time instance t = 0.6 s .
Energies 14 03318 g012
Figure 13. Case- study with unconstrained scenario: (a) i d Δ current; (b) i q Δ current; (c) u d voltage; and (d) u q voltage.
Energies 14 03318 g013
Figure 14. Case- studies with rate constraint, line 1: | Δ u d | = | Δ u q | = 30 , line 2: | Δ u d | = | Δ u q | = 40 , line 3: | Δ u d | = | Δ u q | = 50 , and line 4: unconstrained.
Energies 14 03318 g014
Figure 15. Case-studies with amplitude constraint: line 1: | u d | = | u q | = 30 , line 2: | u d | = | u q | = 60 , line 3: | u d | = | u q | = 80 and line 4: Unconstrained.
Energies 14 03318 g015
Figure 16. Effect of sample time ( T s ) on the dynamic response and stability.
Energies 14 03318 g016
Figure 17. Effect of R on the dynamic response and stability with: (a) T s = 2 × 10 3 ; (b) T s = 4 × 10 3 ; (c) T s = 6 × 10 3 ; and (d) T s = 10 × 10 3 .
Energies 14 03318 g017
Figure 18. Effect of: (a) N p with a = [ 0.237 , 0.237 ] , N = [ 4 , 4 ] ; (b) a with N p = 4 , N = [ 4 , 4 ] ; and (c) N with a = [ 0.237 , 0.237 ] , N p = 4 on the dynamic response and stability.
Energies 14 03318 g018
Figure 19. Change at the time instance t = 0.5 s in: (a) active power reference from 0 p.u. to 0.5 p.u.; (b) reactive power reference from 0 p.u. to 0.2 p.u.
Energies 14 03318 g019
Figure 20. Change at the time instance t = 0.5 s in: (a) active power reference from −0.5 p.u. to 0.5 p.u.; (b) reactive power reference from −0.2 p.u. to 0.2 p.u.
Energies 14 03318 g020
Figure 21. Effect of constraints on (a) i d Δ ; (b) v M d v d Δ ; (c) rate of change of v M d v d Δ , where line 1: Unconstrained, line 2: Constrained.
Energies 14 03318 g021
Figure 22. Comparison of PI and MPC controller during: (a) active power reversal; (b) circulating current suppression; and (c) AC voltage support.
Energies 14 03318 g022
Table 1. Parameters of the test system from Figure 3.
ParameterSymbolValueUnit
Base powerP800MVA
Arm resistance R a r m 0 Ω
Equivalent transformer inductance L e q a c 35mH
Equivalent transformer resistance R e q a c 0.363 Ω
Submodule capacitanceC10mF
Number of submodules N S M 400-
Fundamental grid frequencyf50Hz
Rated pole to pole DC voltage V d c 400kV
Rated line to line primary voltage V A C p r i m 380kV
Rated line to line secondary voltage V A C s e c 220kV
Table 2. Proportional and Integral gain parameter of the classical CCSC, OCC, and power PI controllers from Figure 4.
ParameterValue
Active and reactive power controller proportional gain0.08 [pu]
Active and reactive power controller integral gain4 [p.u.]
Output current controller proportional gain0.8 [p.u.]
Output current controller integral gain80 [p.u.]
Circulating current suppression controller proportional gain0.8 [p.u.]
Circulating current suppression controller integral gain80 [p.u.]
Table 3. MAE in the mathematical model during the step change in Active Power from 1 p.u. to 0.3 p.u. at t = 0.6 s .
SignalsError in Percentage
Pre-DisturbanceDuring-DisturbancePost-Disturbance
P M A T L A B 0.050.480.02
Q M A T L A B 0.040.910.04
i z Σ 1.370.920.43
i d Σ 1.051.780.42
i q Σ 1.001.550.39
v C z Σ 0.150.740.57
Table 4. MAE in the mathematical model during the step change in Reactive Power from 0 p.u. to 0.24 p.u. at t = 0.6 s .
SignalsError in Percentage
Pre-DisturbanceDuring-DisturbancePost-Disturbance
P M A T L A B 0.040.160.03
Q M A T L A B 0.030.220.02
i z Σ 1.501.521.49
i d Σ 0.981.850.95
i q Σ 0.980.790.97
v C z Σ 0.250.320.24
Table 5. MAE in the mathematical model during active power reversal at t = 0.6 s .
SignalsError in Percentage
Pre-DisturbanceDuring-DisturbancePost-Disturbance
P M A T L A B 0.051.280.05
Q M A T L A B 0.062.550.11
i z Σ 1.352.331.79
i d Σ 1.023.741.34
i q Σ 0.993.961.25
v C z Σ 0.521.410.22
Table 6. Parameters of the MMC for Indirect implicit MPC validation simulations.
NameSymbolValue
Arm inductance L a r m 0.15 [p.u.]
Arm resistance R a r m 0.0015 [p.u.]
AC filter inductance L r 0.12 [p.u.]
AC filter resistance R r 0.003 [p.u.]
Sample time T s 2 [ms]
Table 7. Cases for the indirect implicit MPC simulation study.
CasesVariablesValue (Sampling Instance)Value (Sampling Instance)
Small DisturbanceActive power0.5 p.u. (10)1 p.u. (30)
Reactive power0.2 p.u. (20)1 p.u. (30)
Large DisturbanceActive power reversal−1 p.u. (40)1 p.u. (80)
Reactive power reversal−1 p.u. (50)0.5 p.u. (80)
Table 8. Eigenvalues comparison between DLQR and MPC under the unconstrained condition.
MPCDLQRRelative Error
0.121 ± 0.223 j 0.121 ± 0.223 j 5.28 × 10 4 2.46 × 10 4 j
0.121 ± 0.223 j 0.121 ± 0.223 j 3.63 × 10 4 + 2.36 × 10 4 j
Publisher’s Note: MDPI stays neutral with regard to jurisdictional claims in published maps and institutional affiliations.