Abstract
A new applicable safety factor index (SFI) was developed to identify the impact of mechanical stresses and hydrodynamic forces on the potential sanding of a sandstone reservoir. The SFI is calculated by a fully numerically coupled analysis of the mechanical deformation and hydrocarbon fluid flow in the sandstone formation via FLAC3D software, Itasca Consulting Group, Minneapolis, USA. Sand production is commonly ascribed to mechanical failure while the influence of hydrodynamic forces on sandstone erosion is neglected or underestimated. However, the new SFI enables the designer to quantify the impact of mechanical and hydrodynamic forces separately on the future occurrence of sanding. Quantitative comparison is a beneficial tool to choose the most appropriate layout of the wellbore and perforations. The results demonstrated that hydrodynamic forces may have a more significant effect on sand production than mechanical stresses. Furthermore, the sanding process does not necessarily commence at the wellbore wall and may occur at any spot around the perforations with the highest stress state. The calculated SFI was effectively utilized to reduce the sand production, an intensely problematic issue in the oil field used here as a case study. The new SFI can be deployed to design the optimum wellbore and perforation configuration to decrease the sanding potential in a sandstone formation.
1. Introduction
For the prediction of sand production, several physical, analytical, and numerical models have been introduced so far. Most of the models are based on comparing the strength of the rock and the effective stress around wellbore or perforation tunnels. It is assumed that sanding occurs if the strength of the formation is less than the present effective stress under a cycling loading. Reduction of the shear strength during cyclic loading has been investigated through numerous studies [1,2,3].
Early studies on sand production [4,5] demonstrated that sand production happens when the sandstone components cannot form an arc that is sufficiently stable to prevent it from collapsing. Morita et al. [6] declared that shear and tensile failure can cause instability around perforation tunnels. In Veeken et al. [7], triaxial compression and hollow cylinder collapse tests were carried out to investigate the stability of vertical and horizontal boreholes and sanding phenomenon.
Vardoulakis et al. [8] put forward the fundamental theory that sand production is a result of both mechanical and hydrodynamic forces that cause mechanical failure in the sandstone matrix and erode sand grains, respectively. This was a fundamental hypothesis and a large number of studies have utilized the sanding criteria on hydrodynamic forces acting on the failed zones near wellbores and perforations. In Tronvoll et al. [9], the influence of mechanical instability was investigated together with fluid-induced erosion on the sanding process. In this study, the hydrodynamic forces, in spite of their relatively small magnitude compared to the strength of the rock, were found to be a major source of significant sand production. Tronvoll et al. [10] developed a fully hydromechanical model as suggested in Vardoulakis et al. [8] through conducting a coupling analysis of the porous rock and the internal fluid flow.
With the growth of computers, the prediction of sand production became feasible through numerical modelling [11], incorporating sand erosion in the sanding process through numerical modelling. Thus, many researchers have used numerical simulation as a powerful means to predict the sandstone response under the coupling of mechanical stresses and hydrodynamic forces [12,13,14,15,16,17].
Apart from the sheer models for sand production prediction, several analytical approaches have been recently developed to investigate the mechanical failure mechanism in different materials. These techniques can contribute to understanding how a physical crack or fracture is created, and hence, how the subsequent mechanical failure develops through the substance. For instance, in Pham and Weijermars [18] the time-stepped linear superposition method (TLSM) was utilized to quantify and visualize the effect of pore pressure and far-field stress on the orientation of propagating hydraulic fractures in a poroelastic medium. These findings can be adopted to effectively enhance the fracture treatment solutions as well as to prevent the development of fracture hits. Furthermore, from a more complex point of view, Singh et al. [19] incorporated the effect of thermal loading on the crack propagation in an orthotropic infinite strip under mechanical loading. This method was based on the concept of the stress intensity factor at the crack tip. Through analytical solutions [19], the magnitude of this factor was calculated at all spots on an arbitrary crack face that was propagating under the mechanical loading together with the thermal stress effect.
In Kim et al. [20], a sanding model was developed in which an analytical force balance equation was created for a typical sand grain (element) in the numerical model and this obtained a close match with the laboratory results reported in Nouri et al. [15]. In this model, the origin of the hydrodynamic force was the pore pressure in the porous part of the rock. Each element remained in its place if the summation of strength forces was larger than the hydrodynamic forces tending to detach the element from the matrix. The strength force was obtained through calculations based on the parameters such as vertical stresses, cohesive force, and tangential stresses together with frictional forces between sand grains. The main benefit was that there was no calibration parameter for the sanding calculation. For instance, there was no need to define an experimental coefficient.
On the basis of the abovementioned theories, a wide range of models have been studied to identify which parameters are dominant in the sand production process. Amongst them, numerical simulations have gained popularity because the numerical and analytical solutions can be easily combined to achieve more precise responses to problems. The use of only analytical approaches is not acceptable for studying sophisticated large-scale issues such as sand production in a reservoir. As sanding occurs most prevalently in perforated wellbores, understanding the combination of such complicated geometrical and boundary conditions is of paramount importance.
In this research, numerical modelling is utilized to simulate the coupling between fluid flow and mechanical deformation around a candidate oil well in a sandstone reservoir situated in an Iranian oil field. The numerical modelling is conducted through the finite difference software of FLAC3D (Fast Lagrangian Analysis of Continua in 3 Dimensions). Through numerical modelling, two separate safety factors are defined with regard to instability of the matrix, and fluid-induced erosion of the grains. The mechanical safety factor is equal to the ratio of the shear strength of rock to the highest shear stress near the wellbore and perforations. Regarding the hydrodynamic safety factor, a minimum essential hydrodynamic force (EHF) is considered as the minimum fluid flow force that initiates the hydrodynamic erosion in an already mechanically failed zone. The EHF is deployed to calculate the hydrodynamic safety factor. After determination of the two safety factors formulas, a safety factor index (SFI) was defined for the sanding potential around the wellbore and perforations, incorporating both the mechanical and hydrodynamic safety factors in a single formula.
In spite of many previous studies that have considered mechanical shear failure as the initiation condition for sand production, the findings demonstrated that the hydrodynamic forces must also be taken into account, perhaps even more so than mechanical failure. Moreover, it was found that the number, length, and configuration of perforations (shots) can have a remarkable influence on the SFI.
2. Materials and Methods
2.1. Sanding Process
2.1.1. Mechanical Failure
Before drilling a wellbore or any other underground space, the in situ stresses are in balance. When the drilling operation starts, the stress distribution changes near the wellbore. To determine the stresses acting on the surrounding rock, a suitable constitutive model should be selected. The linear elasticity hypothesis for solid materials cannot provide an explicit explanation of the rock response in the presence of pore pressure. Thus, the linear poroelasticity hypothesis is frequently used in reservoir geomechanics [20]. According to poroelasticity theory, the highest stress concentration exists at the wellbore wall, and hence, the potential failure develops from that wall to the further points around the well. Normal and shear stresses at the wellbore wall are defined as [21]
where is the radial stress, pw is the internal wellbore pressure, is the tangential stress, is the normal x-direction stress before drilling, is the normal y-direction stress before drilling, is the angle measured clockwise from the (maximum horizontal stress) direction and can be between 0° and 360°, represents the shear stress acting along the X-Y section, β indicates the poroelastic stress coefficient, pres represents pressure in the reservoir, represents axial stress, indicates Poisson’s ratio, is the shear stress in -Z plane, represents the shear stress along the Y-Z section, and represents the value of shear stress along the X-Z plane. , , , , , , an be calculated as
where is the Biot coefficient, and and represent the maximum and minimum horizontal stress, respectively. In addition, represents the vertical stress, is the wellbore azimuth (which can be from 0° to 360° and is defined as the angle between the direction and wellbore centerline), and is the deviation angle of the wellbore (i can be from 0° to 90° and is measured from the vertical axis, Z, towards the centerline of the wellbore).
During hydrocarbon extraction, the pore pressure adjacent to the wellbore steadily declines, and consequently, the stress state changes continuously with reservoir depletion. This is why, in most sandstone reservoirs, sand production builds up gradually during the wellbore lifetime. Even wells that initially do not show any sign of sanding, eventually encounter the problem after a production period.
Shear failure is very common as a result of mechanical deformation in the sandstone reservoir. It may occur when a plane within the rock cannot withstand a larger shear stress than its shear strength. This phenomenon is prevalent and if combined with tensile fractures and excessive compressive stresses, it may give rise to instability of the wellbore wall [22].
In the Mohr-Coulomb rock failure criterion, it is assumed that failure occurs if the shear stress, τ overcomes the rock’s inherent strength along a weak plane. The inherent strength consists of two separate forces: frictional force and cohesion force. The magnitude of the frictional force is calculated as the normal stress σ, multiplied by a constant coefficient that is defined as the coefficient of internal friction, µ. This coefficient can be calculated as µ = tanφ in which φ represents the internal friction angle of the rock.
The cohesion force is defined as the force that resists the failure onset along the plane when there is no normal stress, or, the frictional force to withstand the shear stress acting on the plane. Therefore, in this condition, a finite force, C, is necessarily still present to prevent the failure. The parameter C is defined as the rock cohesion.
The abovementioned considerations were incorporated in the Mohr-Coulomb failure criterion, expressing that failure occurs along a plane if the underlying condition is satisfied:
Failure will not occur on any plane for which τ < C + µσ. In other words, failure occurs if 1 ≥ (C + µσ)/τ. A Mohr-Coulomb envelope can be achieved by conducting a set of confined and unconfined triaxial tests.
Mohr–Coulomb failure criterion can also be explained by the Mohr’s Circle. Figure 1 shows the Mohr’s Circle and Mohr–Coulomb failure line (AL line). If failure occurs, then the Mohr’s circle becomes tangent to the AL line. This means that for Mohr’s circles that lie under the AL line, the failure does not occur.
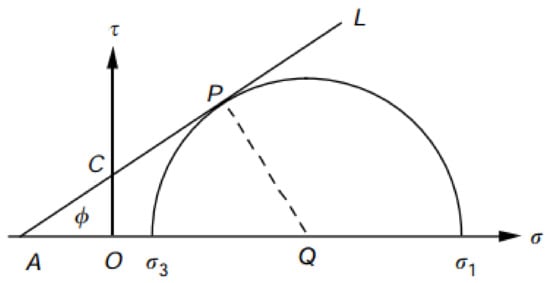
Figure 1.
Mohr’s Circle and failure line in Mohr-Coulomb criterion.
Equation (12) can additionally be expressed in several dissimilar but equivalent forms. The advantage is that in some circumstances, expressing the criterion is more convenient to analyze the failure problems. Figure 1 shows that under the failure condition, the following relation can be written
The point Q lies in the middle of σ1 and σ3. Hence, the coordinate of Q on the Mohr’s circle is (τ,σ) = ((σ1+σ3)/2, 0); therefore, |OQ| can be written as
From Equations (13)–(16), we obtain
In the presence of pore pressure, the term of p is added to the normal stresses, σ1 and σ3. After simplifying, this gives
Failure does not happen if the right side in Equation (18) is more than the left side as
In the current paper, Equation (19) was used to calculate the mechanical safety factor.
2.1.2. Hydrodynamic Erosion
Sanding is a phenomenon that occurs subsequent to mechanical failure in the formation rock. The first step is the occurrence of mechanical instability in the rock, followed by the second step in which the hydrodynamic forces erode the damaged and failed rock zones. Furthermore, hydrodynamic forces accelerate the rock plasticity, which contributes to more ongoing mechanical failure.
As a reasonable assumption, sanding does not occur automatically within an intact unconsolidated rock. The reason is that generally no fluid force can separate sand particles from the rock matrix. However, in a failed rock, the hydrodynamic force derived from the fluid flow may detach the grains from the sandstone matrix. This hydrodynamic force is described in the following section.
As an example, consider a cylindrical wellbore drilled in a sandstone reservoir. Assume that a sand grain of radius Rg is pressed in between the adjacent grains at the wellbore wall (Figure 2). It should be noted that the assumption is that sanding initiates from the wellbore wall towards the outer points.
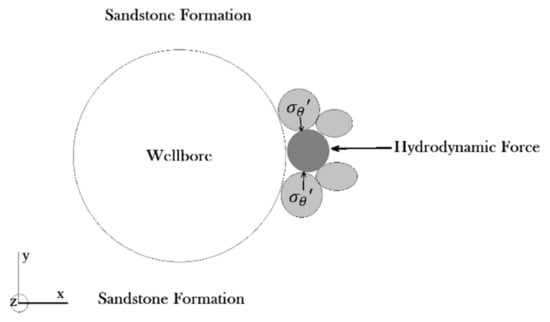
Figure 2.
Forces acting on a sand grain at wellbore wall.
Fattahpour et al. [23] carried out a number of laboratory tests on hollow cylindrical specimens of sandstone to investigate the effect of grain size on sand production. They concluded that d50 was a critical size as it significantly affected the sanding potential of the specimens. They observed that for the samples with d50 < 0.3 mm, as the grain size increased, a less confining stress was needed to initiate the sand production. Nevertheless, regarding the specimens with coarser grain size, d50 > 0.3 mm, as the grain size increased, the essential stress increased for sand production.
The essential force for separating the sand grain and pushing it towards the inner space of the wellbore is equal to the summation of four shear forces and one tensile force at the grain face. In other words, the shear failure must occur at four contact planes while tensile failure must happen in the contact plane at the back the sand grain. This can be written as [24]
where C is the cohesion, To is the tensile strength, and is the coefficient of internal friction. Moreover, and in Equations (2) and (3), respectively. In the next section, the usage of Equation (20) in the calculation of a hydrodynamic safety factor is described in detail.
The fluid flow around the sand grain causes a hydrodynamic force to act on the grain surface. The magnitude of this force can be determined as
where is the hydrodynamic force acting on the grain (N), is the cross-sectional area through which the fluid passes (m2), and is the pore pressure gradient (Pa) along the length of the grain, . The parameter of along the length of can be calculated through the Darcy’s law, which describes the fluid flow in a porous rock. This gives
where is the pore pressure gradient in the length of , (m3/s) represents the fluid flow rate, is the cross-sectional area through which the fluid flows, is the rock permeability (m2), and is the dynamic viscosity of the fluid (N.s/m2). A combination of Equations (21) and (22) gives
From Equation (23), it can be deduced that as the fluid flow rate increases, the hydrodynamic force acting on the grain increases. In this paper, the hydrodynamic safety factor is calculated by using Equations (20) and (23).
2.2. Definition of the Mechanical-Hydrodynamic SFI
In most cases, mechanical failure in sandstone around the wellbore and perforations does not automatically give rise to considerable sand production. However, as a time-dependent phenomenon, sanding may occur in the future life of the wellbore. Pore pressure gradients cause more stresses and deformations around the failed areas that have met the failure criterion. Together with the mechanical failure, sand erosion is also needed to prepare the conditions whereby sand particles can be removed from the failed parts and transported away to the wellbore inner space and ground surface.
When the onset of an unacceptable phenomenon such as mechanical shear failure or hydrodynamic erosion of sand grains is investigated, the safety factor can be expressed as the division of the strength features of the rock over the actively contributing stresses. Conventionally, a safety factor larger than one indicates allowable circumstances.
Additionally, in this study, a safety factor index (SFI) is defined to quantify the sandstone potential for sand production. This SFI is defined as
where is the safety factor for mechanical shear failure in the sandstone matrix and is defined as the safety factor for hydrodynamic erosion of sand grains. The reason for choosing the minimum safety factor for SFI is that the nature of is different from . Hence, the definition of any more developed relations between those two quantities requires a comprehensive study of sand production with real field data. can be calculated through Equation (19) as
In this paper, the values of σ1 and σ3 are obtained directly from the numerical simulation results. can be calculated through Equations (20) and (23) as
Combining Equations (24)–(26) gives
This equation was utilized to quantify the potential for sanding in terms of the SFI.
2.3. Case Study and Numerical Modelling
To evaluate the new SFI and conduct numerical modelling, a candidate oil well drilled in an Iranian sandstone reservoir was selected as the case study. The well was reported to produce a high amount of sand grains during production. To determine the microstructure of the sandstone reservoir, coring operations were performed and sieve analysis was conducted. The results indicated that the samples mostly fall within the range of 1–4 Phi or medium to fine-grained sand (Phi = −Log2d, where d is the grain diameter in mm). Therefore, it can be concluded that most samples are fine to medium-grained sand size. The size of the sand grains has a substantial impact on their movement in channels such as perforations or fractures [25]. For instance, in hydraulic fracturing, only sand grains of a limited range of size and shape are effective as a proppant. The structure of grains can contribute to their movement in fractures or any channel such as perforations [26].
The necessary data include in situ stresses, reservoir properties, wellbore and perforation geometries as well as the casing properties gathered during the seismic surveys, drilling operation, completion period, laboratory tests, etc. Table 1 illustrates the data used to model the reservoir, wellbore, perforations and casing in FLAC3D. The input parameter, the mobility coefficient is defined as the coefficient of the pressure term in Darcy’s law. It is related to the permeability, k, as
where m.c. is the mobility coefficient (m2/(Pa.s)), k is permeability (m2) of the sandstone and, represents the dynamic viscosity (N.s/m2).

Table 1.
Data used in numerical simulation.
The features that depend on the fluid type such as the Biot coefficient and Biot bulk modulus are very important in the response of porous sandstone to the active stress state. However, the measurement of these properties, which is often conducted by the acoustic velocity measurement apparatus, needs to set the temperature and pressure equal to the real conditions of the reservoir [27]. Reaching these temperatures and pressures is frequently difficult because of the limitations of the laboratory apparatus.
FLAC3D software allows users to conduct a fully coupled analysis between mechanical deformation and fluid flow within the reservoir. In FLAC3D, a full fluid-mechanical coupling occurs in two directions: changes in pore pressure bring about volumetric strains that affect the stresses; reversely, the straining that occurs influences the pore pressure [28].
Modelling a wellbore with a group of relatively small perforations needs to increase the number of fine elements in the grid. This makes the numerical simulation time-consuming and demanding, particularly in 3-dimensions. In FLAC3D, it is feasible to densify the grid only around the wellbore and perforations so that the size of the elements is close to the size of sand grains. This contributes to determining how the deformations occur in a much more precise way.
First, a grid was constructed according to the real geometry of the sandstone layer, wellbore, and perforations. The sandstone formation lies between a depth of 2328 m and 2366 m. Thus, the depth of the numerical mesh grid was chosen as 38 m. The wellbore is vertical and its diameter is 21.6 cm. Additionally, the perforations were created perpendicular to the wellbore vertical axis. The direction of the perforations was assumed to be parallel to the maximum horizontal stress, . The diameter of the perforations was 1.7 cm and they were initially created with a vertical spacing of 6 cm from each other. Figure 3 illustrates the generated grid for a typical 5 m of sandstone formation. The scale of the perforations is not graphically accurate; they have only been magnified here for a better view.
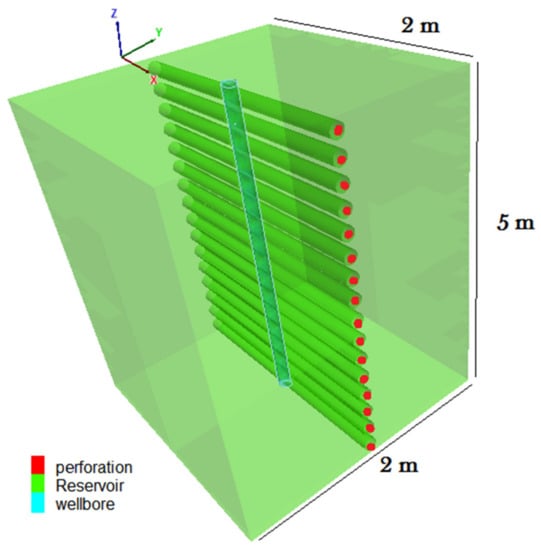
Figure 3.
Grid for 5 m of sandstone formation.
After creating the grid and assigning the needed properties, the models were run and the results were obtained. Through several numerical simulations, the direction of the perforations, their spacing from each other, and their length were changed to monitor the configuration effects on the stability of perforations and sand production.
3. Results
Apart from the magnitude of the in situ stresses, their direction is also a key parameter in wellbore and perforation stability [29]. In the real oil field, the wellbore was vertically drilled, and the perforations were created parallel to the direction of σH. The geometry of the perforations was 20 cm in length, 1.7 cm in diameter, with a space of 6 cm between their centers. This actual configuration was used initially for the numerical modelling in FLAC3D software. For this real configuration, the results showed that ongoing instability occurred in the second half of the perforation length. In this case, the mechanical safety factor was calculated as 0.98 while the hydrodynamic safety factor was computed as 1. Hence, the SFI obtained was 0.98, indicating that sand production is inevitable in the real-field perforation configuration. Hence, the obtained SFI confirmed the reported sanding issue in the candidate wellbore.
To achieve an optimal SFI, several numerical models with different perforation configurations were simulated and run. Table 2 displays the corresponding values for the mechanical safety factor, hydrodynamic safety factor, and SFI for different models, regarding both σH and σh directions. The obtained values for the real-field case have been marked with an asterisk (*). For all cases, the perforation diameter is constant and equal to 1.7 cm. These results are also shown in Figure 4 (solid lines and dashed lines represent the results for perforations parallel to σH and σh, respectively). According to this figure, when the perforation geometry is the same, a higher SFI is obtained if the perforations are created parallel to σh rather than the σH direction. The maximum SFI is 1.48 and is related to perforations with L (length) = 10 cm, D (diameter) = 1.7 cm, S (spacing) = 8 cm and parallel to σh. On the other hand, the lowest SFI is 0.8 and is associated to perforations with L = 10 cm, D = 1.7 cm, S = 4 cm and parallel to σH. Additionally, it is evident that as the spacing between the centers of perforations increases, the SFI values become larger. However, for a perforation length more than 20 cm, the SFI does not change remarkably.
Table 2.
SFMech, SFHyd and SFI for different perforation geometries and orientations; the numerical results for the real-field perforation configuration is marked with an asterisk (*).
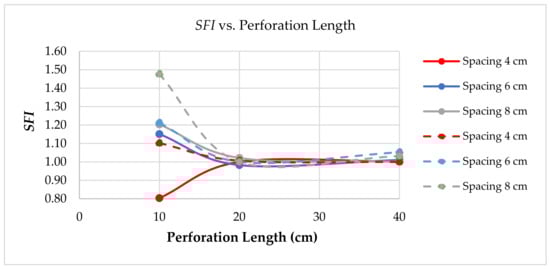
Figure 4.
SFI values vs. different geometry and orientation of perforations.
Figure 5 demonstrates the minimum essential hydrodynamic force (EHF) to initiate the sanding process in cases of different length and spacing for perforations parallel to the σH (solid lines) and σh (dashed lines). This force was calculated by using Equation (20) at any point on the perforation wall that had the most crucial displacement towards the inner space of the perforation. Because the area of the mesh elements (the term of in Equation (20)) was identical for all grid zones, the force, Fr, was shown in MPa (stress).
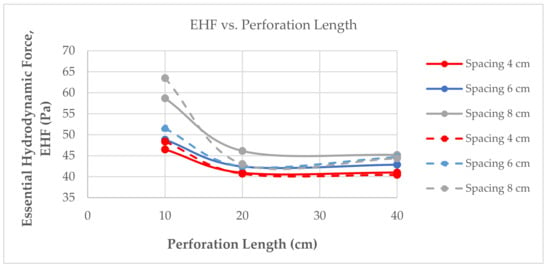
Figure 5.
Essential hydrodynamic forces for sanding onset.
According to Figure 5, for perforations parallel to the σh, the value of the minimum essential hydrodynamic force for grain erosion is higher than perforations parallel to the σH. This means that in this case, the perforations undergo the minimum hydrodynamic erosion of the sand grains. In addition, as the spacing between perforation channels decreases, the minimum hydrodynamic force for sanding onset declines. When the perforations are created and the middle intact sandstone parts that separate the perforations from each other are formed, the distribution of stresses in these parts are changed as a result of perforation creation. If the thickness of those middle parts is inadequate, the induced stresses of the upper and lower perforations may combine negatively, and hence, lead to larger deformations and instability. Furthermore, the thinner parts are more likely to be eroded hydrodynamically as a result of being subjected to fluid flow forces streaming in both the upper and lower perforations.
On the other hand, the maximum resistivity of the sandstone with sanding is when the perforation length is equal to the wellbore radius, Rw. If the perforation length is more than 2Rw, the essential hydrodynamic force does not change significantly. More numerical models showed that the crucial distance of the wellbore wall is 2Rw. Hence, if the perforation has a length more than 2Rw, the maximum displacement and stress concentration occurs at this point.
The effect of hydrodynamic forces can also be depicted from the fluid flow rate point of view. Figure 6 demonstrates the flow rate at the weakest point on the perforation wall for all different perforation configurations parallel to σH (solid lines) and σh (dashed lines). When the perforation length is equal to 10 cm and the spacing is 8 cm, the minimum flow rate, and hence, with a constant cross-sectional area, the minimum flow velocity is achieved. From Figure 5 and Figure 6, it can be determined that the optimal case for perforations with the lowest potential for sand erosion and flow rate is L = 10 cm, S = 8 cm, and parallel to σh. This configuration was implemented by the drilling company in the drilling operation of the new wellbores in the field. These improvements have contributed to adequate prevention of sanding occurrence in the field.
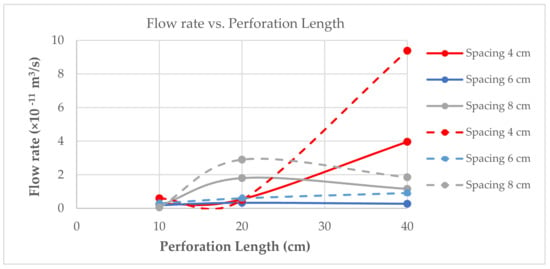
Figure 6.
Fluid flow rate vs. perforation length.
4. Discussion
From the results, it can be determined that as the unconsolidated reservoir has a weak sandstone formation, the hydrodynamic erosion seems to have a more critical impact on the degradation of the sandstone matrix and sand production. This confirms the results found by [30] regarding the sand production around the perforations in a weak sandstone reservoir. This study found that weak rocks can be easily eroded and decemented by hydrodynamic forces, while strong rocks show localized failure, which leads to bigger chunks of sandstone that cannot be simply eroded.
Regarding the effect of perforation direction, Knez et al. [31] suggest avoiding perforating in the direction parallel to the σh. They stated that in this case, perforation tunnels are subjected to larger values of compressive stresses, and therefore, higher potential of degradation and sanding onset. However, in this study, it was discovered that the perforation tunnels are more stable and have less potential for sanding onset when they are perforated parallel to the σh. The reason is that the in situ stresses, which are determining factors in the mechanical stability of the rock, may play a less important role when compared with the hydrodynamic stresses, especially in weak and unconsolidated formations. This is where the SFI can explain the different response of sandstone in the presence of different in situ stress regimes, sandstone physical and mechanical properties, poroelastic properties, and wellbore–perforation configurations.
Furthermore, the current numerical models showed that no sanding onset occurs at the perforation tip. This result confirms the findings in [5] where a failure model of a cylindrical wellbore and perforations was developed through experimental tests to investigate the sand production process. By conducting a large number of laboratory experiments on sanding onset, it was determined that sand production occurs less at perforation tips in comparison to perforation walls.
The parameters that were used to calculate the SFI can be determined through field or laboratory experiments. Because the nature of the mechanical and hydrodynamic safety factors are different, a comprehensive field study is suggested to investigate the relation between these safety factors. Such a study will need to consider many variables and find the effect of each parameter on the rest. For instance, stress cycling derived from production and injection is of paramount importance in fluid flow through the fractures or channels [32]. Moreover, some properties of sandstone probably have a greater influence on mechanical failure, fracture propagation, or sand erosion [33]. The effect of such contributing factors on sand production can be investigated through several methods such as the Monte Carlo simulation approach [34]. This approach is useful for conducting a sensitivity analysis on the basis of regular uncertainty in the input parameters [35].
Furthermore, as a very new approach, it is suggested that proxy models are utilized to simulate complicated reservoir problems such as sand production. The proxy model for sand production can be developed by petroleum engineers who are familiar with numerical modelling and machine learning approaches. In this case, a combination of machine learning codes and numerical equations can solve large-scale oil or gas field problems significantly faster than in the past [36].
5. Conclusions
To evaluate the sanding potential of a sandstone formation, it is important to take into account both the hydrodynamic forces and mechanical stresses. The new SFI can be utilized to quantify the sanding potential in a reservoir through the calculation of mechanical safety factor and hydrodynamic safety factor. Furthermore, using the new SFI, one can investigate the influence of frequency of shots, the length of perforations, wellbore geometry, and trajectory on the sand production in a sandstone reservoir.
The results illustrate that the SFI in an unconsolidated sandstone reservoir depends more on the hydrodynamic safety factor than the mechanical safety factor. In other words, the hydrodynamic forces play a more important role in the sanding process when they are compared to mechanical stresses in such reservoirs. In addition, the sanding that happened at the perforation walls and no sanding onset was observed at the perforation tip and perforation portal. In the current study, it was found that a higher SFI is achieved when perforations are conducted parallel to σh in comparison to σH. In addition, to achieve the minimum potential for sand erosion, the diameter, length, and spacing of the perforation tunnels were proposed as 1.7 cm, 10 cm, and 8 cm, respectively. These improvements have currently been adopted by the drilling company in the development phase of the new wellbores in an Iranian oil field. Recent surface measurements of the solid particles verified that the recent modifications have successfully led to a highly economic shift from the previous continuous sanding to transient sand production whereby the produced sand decreases with time and is temporarily present in the clean-up process after the perforating operations.
Author Contributions
Conceptualization, Formal Analysis, Data Curation, Writing-Original Draft Preparation, Visualization, Methodology: M.A.M.Z. and D.K.; Validation, Writing—Review and Editing, Supervision, Project Administration: D.K.; Software, Investigation, Resources: M.A.M.Z. All authors have read and agreed to the published version of the manuscript.
Funding
The project was supported by the AGH University of Science and Technology, Krakow, Poland subsidy 16.16.190.779.
Data Availability Statement
All relevant data are included in the paper.
Conflicts of Interest
All authors of this paper declare no conflict of interest.
References
- Willson, S.M.; Moschovidis, Z.A.; Cameron, J.R.; Palmer, I.D. New Model for Predicting the Rate of Sand Production. In Proceedings of the SPE/ISRM Rock Mechanics Conference, Irving, TX, USA, 20 October 2002. [Google Scholar] [CrossRef]
- Selvadurai, A.P.S.; Suvorov, A.P. Constitutive Relationships Governing Thermo-Poroelastic Processes. In Thermo-Poroelasticity and Geomechanics; Cambridge University Press: Cambridge, UK, 2016; ISBN 9781316543832. [Google Scholar] [CrossRef]
- Todorov, M. Cyclic Soils Properties. In Proceedings of the 7th International Structural Engineering and Construction, Honolulu, HI, USA, 18–23 June 2013. [Google Scholar] [CrossRef]
- Hall, C.D.; Harrisberger, W.H. Stability of Sand Arches: A Key to Sand Control. J. Pet. Technol. 1970, 22, 821–829. [Google Scholar] [CrossRef]
- Bratli, R.K.; Risnes, R. Stability and Failure of Sand Arches. Soc. Pet. Eng. J. 1981, 21, 236–248. [Google Scholar] [CrossRef]
- Morita, N.; Whitfill, D.L.; Fedde, O.P.; Levik, T.H. Parametric Study of Sand Production Prediction: Analytical Approach. SPE Prod. Eng. 1989, 4, 25–33. [Google Scholar] [CrossRef]
- Veeken, C.A.M.; Walters, J.V.; Kenter, C.J.; Davies, D.R. Use of Plasticity Models for Predicting Borehole Stability. In Proceedings of the ISRM International Symposium, Pau, France, 30 August 1989. [Google Scholar]
- Vardoulakis, I.; Stavropoulou, M.; Papanastasiou, P. Hydromechanical Aspects of the Sand Production Problem. Transp. Porous Media 1996, 22, 225–244. [Google Scholar] [CrossRef]
- Tronvoll, J.; Skjaerstein, A.; Papamichos, E. Sand Production: Mechanical Failure or Hydrodynamic Erosion. Int. J. Rock Mech. Min. Sci. 1997, 34, 1–17. [Google Scholar] [CrossRef]
- Stavropoulou, M.; Papanastasiou, P.; Vardoulakiz, I. Coupled Wellbore Erosion and Stability Analysis. Int. J. Numer. Anal. Methods Geomech. 1998, 22, 749–769. [Google Scholar] [CrossRef]
- Papamichos, E.; Vardoulakis, I.; Tronvoll, J.; Skjaerstein, A. Volumetric Sand Production Model and Experiment. Int. J. Numer. Anal. Methods Geomech. 2001, 25, 789–808. [Google Scholar] [CrossRef]
- Chin, L.Y.; Ramos, G.G. Predicting Volumetric Sand Production in Weak Reservoirs. In Proceedings of the SPE/ISRM Rock Mechanics Conference, Irving, TX, USA, 20 October 2002. [Google Scholar] [CrossRef]
- Vaziri, H.; Barree, B.; Xiao, Y.; Palmer, I.; Kutas, M. What Is the Magic of Water in Producing Sand? In Proceedings of the SPE Annual Technical Conference and Exhibition, San Antonio, TX, USA, 29 September–2 October 2002. [Google Scholar] [CrossRef]
- Wang, J.; Wan, R.G.; Settari, A.; Walters, D. Prediction of Volumetric Sand Production and Wellbore Stability Analysis of a Well at Different Completion Schemes. In Proceedings of the 40th U.S. Symposium on Rock Mechanics, Anchorage, AK, USA, 25–29 June 2005. [Google Scholar]
- Nouri, A.; Vaziri, H.; Belhaj, H. Sand-production Prediction: A New Set of Criteria for Modeling Based on Large Scale Transient Experiments and Numerical Investigation. Soc. Pet. Eng. J. 2006, 11, 227–237. [Google Scholar] [CrossRef]
- Detournay, C.P. Numerical Modeling of the Slit Mode of Cavity Evolution Associated with Sand Production. In Proceedings of the SPE Annual Technical Conference and Exhibition, Denver, CO, USA, 21 September 2008. [Google Scholar] [CrossRef]
- Pacheco, E.J.; Soliman, M.Y.; Zepeda, R.; Wang, J.; Settari, A. Sanding Prediction in a Gas Well Offshore Mexico Using a Numerical Simulator. In Proceedings of the Latin American and Caribbean Petroleum Engineering Conference, Cartagena de Indias, Bolívar, Colombia, 31 May 2009. [Google Scholar] [CrossRef]
- Pham, T.; Weijermars, R. Hydraulic Fracture Propagation in a Poro-Elastic Medium with Time-Dependent Injection Schedule Using the Time-Stepped Linear Superposition Method (TLSM). Energies 2020, 13, 6474. [Google Scholar] [CrossRef]
- Singh, A.; Das, S.; Craciun, E.M. Effect of Thermo-Mechanical Loading on an Edge Crack of Finite Length in an Infinite Orthotropic Strip. Mech. Compos. Mater. J. 2019, 55, 285–296. [Google Scholar] [CrossRef]
- Kim, H.S.; Sharma, M.M.; Fitzpatrick, H.J. A Predictive Model for Sand Production in Poorly Consolidated Sands. In Proceedings of the International Petroleum Technology Conference, Bangkok, Thailand, 15 November 2011. [Google Scholar] [CrossRef]
- Ewy, R.T.; Ray, P.; Bovberg, C.A.; Norman, P.D.; Goodman, H.E. Openhole Stability and Sanding Predictions by 3D Extrapolation from Hole-Collapse Tests. J. SPE Drill. Completion 2001, 16, 243–251. [Google Scholar] [CrossRef]
- Papanastasiou, P.C.; Vardoulakis, I.G. Numerical Treatment of Progressive Localization in Relation to Borehole Stability. Int. J. Numer. Anal. Methods Geomech. 1992, 16, 389–424. [Google Scholar] [CrossRef]
- Fattahpour, V.; Moosavi, M.; Mehranpour, M. An Experimental Investigation on the Effect of Grain Size on Oil-Well Sand Production. Pet. Sci. 2012, 9, 343–353. [Google Scholar] [CrossRef]
- Fjaer, E.; Holt, R.M.; Horsrud, P.; Raaen, A.M.; Risnes, R. Petroleum Related Rock Mechanics, 2nd ed.; Elsevier: Amsterdam, The Netherlands, 2008; ISBN 978-0-444-50260-5. [Google Scholar]
- Knez, D.; Calicki, A. Looking for a New Source of Natural Proppants in Poland. J. Bull. Pol. Acad. Sci. Tech. Sci. 2018, 66, 3–8. [Google Scholar] [CrossRef]
- Knez, D.; Mazur, S. Simulation of Fracture Conductivity Changes due to Proppant Composition and Stress Cycles. J. Pol. Miner. Eng. Soc. 2019, 2, 231–234. [Google Scholar]
- Rajaoalison, H.; Knez, D.; Zlotkowski, A. Changes of Dynamic Mechanical Properties of Brine-Saturated Istebna Sandstone under Action of Temperature and Stress. Przemysł Chem. 2019, 98, 801–804. [Google Scholar] [CrossRef]
- Fluid-Mechanical Interaction. In FLAC3D Manual; Itasca Group: Minneapolis, MN, USA, 2020.
- Knez, D. Stress State Analysis in Aspect of Wellbore Drilling Direction. J. Arch. Min. Sci. 2014, 59, 71–76. [Google Scholar] [CrossRef]
- Tronvoll, J.; Fjær, E. Experimental Study of Sand Production from Perforation Cavities. Int. J. Rock Mech. Min. Sci. Geomech. Abstr. 1994, 31, 393–410. [Google Scholar] [CrossRef]
- Knez, D.; Wiśniowski, R.; Owusu, W.A. Turning Filling Material into Proppant for Coalbed Methane in Poland-Crush test results. Energies 2019, 12, 1820. [Google Scholar] [CrossRef]
- Papanastasiou, P.; Zervos, A. Three-dimensional Stress Analysis of a Wellbore with Perforations and a Fracture. In Proceedings of the SPE/ISRM Rock Mechanics in Petroleum Engineering, Trondheim, Norway, 8 July 1998. [Google Scholar] [CrossRef]
- Knez, D.; Rajaoalison, H. Discrepancy Between Measured Dynamic Poroelastic Parameters and Predicted Values from Wyllie’s Equation for Water-Saturated Istebna Sandstone. Acta Geophys. 2021, 69, 673–680. [Google Scholar] [CrossRef]
- Quosay, A.A.; Knez, D. Sensitivity Analysis on Fracturing Pressure using Monte Carlo Simulation Technique. Oil Gas Eur. Mag. 2016, 42, 140–144. [Google Scholar]
- Quosay, A.A.; Knez, D.; Ziaja, J. Hydraulic Fracturing: New Uncertainty Based modelling Approach for Process Design Using Monte Carlo Simulation Technique. PLoS ONE 2020, 15, e0236726. [Google Scholar] [CrossRef]
- Amini, S.; Mohaghegh, S. Application of Machine Learning and Artificial Intelligence in Proxy Modelling for Fluid Flow in Porous Media. Fluids 2019, 4, 126. [Google Scholar] [CrossRef]
Publisher’s Note: MDPI stays neutral with regard to jurisdictional claims in published maps and institutional affiliations. |
© 2021 by the authors. Licensee MDPI, Basel, Switzerland. This article is an open access article distributed under the terms and conditions of the Creative Commons Attribution (CC BY) license (https://creativecommons.org/licenses/by/4.0/).