Article

The Establishment and Evaluation Method of Artificial Microcracks in Rocks

1
College of Engineering Science, University of Chinese Academy of Sciences, Beijing 100049, China
2
Institute of Porous Flow and Fluid Mechanics, University of Chinese Academy of Sciences, Langfang 065007, China
3
Research Institute of Petroleum Exploration & Development, Beijing 100083, China
4
School of Geosciences, Yangtze University, Wuhan 430100, China
*
Authors to whom correspondence should be addressed.
Energies 2021, 14(10), 2780; https://doi.org/10.3390/en14102780
Submission received: 1 March 2021 / Revised: 30 March 2021 / Accepted: 7 May 2021 / Published: 12 May 2021
(This article belongs to the Special Issue Geomechanics of Hydraulic Fracturing)

Abstract

:
It is necessary to carry out experiments on cores with different degrees of crack development when studying the seepage law of cracked reservoirs and evaluating cracks. The seepage experiment in the laboratory requires cores with different degrees of microcrack development; cores obtained via conventional drilling cannot meet the requirements, and the efficacies and evaluation methods of geological parameters used for artificial cracks are not perfect. In this study, cores are loaded using a triaxial gripper, and cracks are produced by changing the difference of stress; the relationship between the increased rate of permeability and the change in stress concentration is used to evaluate the degree of development of the crack in real time. The angle between the cracks and the maximum principal stress direction, calculated using the Mohr–Coulomb failure criterion, is 20–27.5°, which provides theoretical support for the process of crack creation. The experimental results show that the permeability variation curve shows two obvious turning points, which divide the whole zone into a reduction zone, a slow increase zone, and a rapid increase zone. Through the obtained experimental and evaluation results, a complete system for crack creation and evaluation is established, which can provide strong support for the study of cracked reservoirs.

1. Introduction

In recent years, tight oil has gradually received interest as a form of unconventional oil and gas development, and is known as the “black gold” of the petroleum industry [1,2,3,4]. Tight oil reservoirs have low porosity, low permeability, and strong heterogeneity [5,6,7,8]. It is thought that most tight reservoirs have microcracks, which are the main seepage channels of tight reservoirs. Therefore, it is necessary to study the seepage law of microcrack reservoirs in order to evaluate microcracks, and it is necessary to use cores with different degrees of microcracking in order to conduct experiments [9,10,11]. The cores obtained using conventional drilling present significant issues: first, regularity research requires cores with widely distributed cracks, which cannot be satisfied by drilling cores; and second, after the cracked cores are taken out of the formation, the stress conditions and original crack shape change, making the experimental results unreliable. Therefore, it is necessary to create artificial cracks in outcrop cores in order to study cracked reservoirs. At present, there are many methods used to make cracks—for example, the splitting rock sample method and the compression method [12,13,14,15,16,17,18,19,20,21].
The splitting rock sample method involves cutting the core into two half-cylinders along the axial section, removing the dust from the cross-section, and then joining the two half-cylinders together, where the split in the middle is used as a simulated crack. Shedid et al. (2006) [12], Eoff et al. (2007) [13], and Simjooet et al. (2009) [14] all used the splitting rock sample method to create cracks, and the evaluation of the cracks was mainly based on the crack width. There are two main methods for evaluating the crack width: first, calculating the width of the crack by comparing the change in permeability; and second, calculating the crack width by putting thin foil between the cracks. At present, the artificial crack method used to create split rock samples is mainly employed to create visible cracks, which is the basis of flow experiments. The advantages of this method are that it is simple and easy to implement and has a low cost. Meanwhile, the disadvantage is that only one visible crack can be prepared, which is far from what occurs with actual reservoir cracking. The compression method uses indoor equipment to compress rock samples in order to generate cracks that can be used to simulate natural cracks. Compared to the method of splitting rock samples, the cracks resulting from the compression method are closer to natural cracks. The compression method is divided into two forms: the longitudinal extrusion method; and the triaxial stress method. The longitudinal extrusion method involves a set of symmetrical stresses that are applied longitudinally along the core in order to create vertical tensile stress, which produces cracking. Lian et al. (2012) [15] and Katsuki et al. (2019) [16] used two symmetrical sharp wedges to compress the longitudinal axis of the core, which indirectly generated tensile stress and produced cracks along the axial direction. The cracked core is used to study the seepage mechanism. Although the cracks produced using this method are closer to the shape of real cracks, there are still some problems: First, this method is only suitable for making visible cracks, and it cannot simulate small cracks. Second, cracks can only be generated randomly, and the effects of the cracks cannot be controlled. Third, there is no effective system for producing and evaluating the cracks. The triaxial stress method refers to the formation of fractures by increasing the axial pressure under triaxial stress. Torsaeter et al. (1987) [22] used this method to create cracks that kept the pore pressure at 0 bar gauge and the lateral pressure at 50 bar, such that the axial pressure increased from a lateral pressure to approximately 0.3% axial compaction. However, no specific evaluation method was used to verify the occurrence or the degree of cracking. There are many studies on the cracking law of rocks using compression methods [17,18,19]. Yang et al. (2019) [20] used a series of X-ray micro-CT observations and three-dimensional (3D) numerical simulations to investigate hollow sandstone specimens with various borehole diameters under different confining pressures. A realistic 3D failure process analysis method was established for the simulation of the deformation failure behavior of hollow sandstone under conventional triaxial compression. Zhang et al. (2020) [21] conducted uniaxial compression experiments on a 4 × 8 mm rock sample in order to explore the process of rock compression and deformation and the laws of crack generation. This type of experimental method is mainly used to study the cracking laws of rocks, instead of being an experimental system that can control the degree of cracking, evaluate the effects of cracking, or be used in subsequent seepage experiments.
The mineral composition and particle size of the rock samples are important factors that affect the formation of artificial microcracks, and this article only considers the results of microcracks, but does not study their causes [23,24]. In this paper, the microcracks are obtained by increasing axial compression with fixed confining pressure. The gas permeability is used to evaluate the microcracks in real time during the experiment. At the same time, the Mohr–Coulomb failure criterion was used to analyze the rock fracture process and the rock deformation mechanism, and to provide theoretical support for the process of crack creation.

2. Samples and Experiments

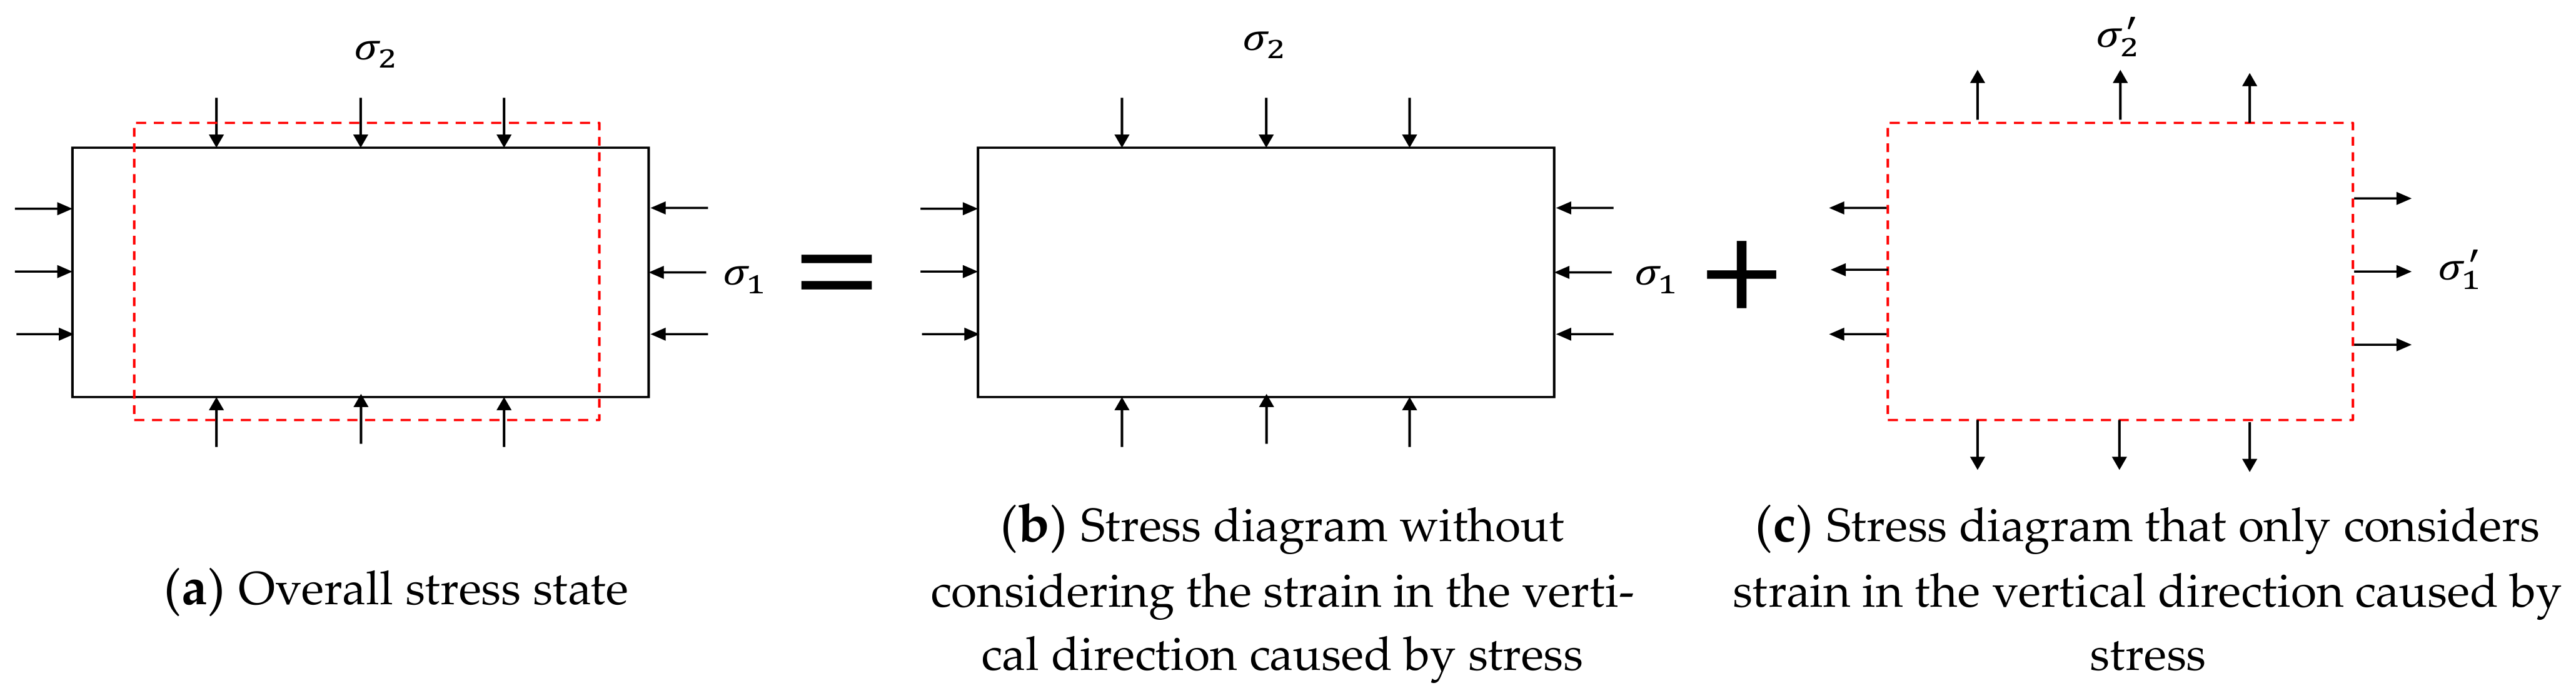
2.1. Rock Rupture Principle

Creating cracks via core fractures was achieved by increasing the stress difference until it reached the limit value of splitting of the rock. The core was subjected to axial and confining pressures, where the three principal stresses were σ1 (maximum principal stress), >σ2 (intermediate principal stress), and =σ3 (minimum principal stress). The stress state of the cross-section along the long axis of the core can be regarded as the planar stress state [25]. In this state, σ1 ≠ 0, σ2 ≠ 0, and σ3 = 0.
As shown in Figure 1, given that the stress on any oblique section “mn” is Sa, the normal stress is σa, the shear stress is τa, and the intersection angle between the outer normal and the normal stress σ1 is α, then σa and τa can be expressed as [26]:
σ a = σ a 1 + σ a 2 = σ 1 + σ 2 2 + σ 1 σ 2 2 cos 2 α
τ a = τ a 1 + τ a 2 = σ 1 σ 2 2 sin 2 α
The rock material was assumed to meet the uniform continuity, isotropy, and small deformation assumptions. In the planar state, the normal stress in the x-direction has a normal strain, with an opposite sign in the y-direction:
ε y = υ ε x = υ σ x E
where υ is Poisson’s ratio and E is Young’s modulus.
Therefore, the influence of rock deformation on the stress results under the traditional stress state conditions is considered; the planar stress state can be regarded as the superposition of two stress states: the first state does not consider the strain caused by stress in the vertical direction; while the second state only considers the strain caused by stress in the vertical direction. Both states are shown in Figure 2.
Under the small deformation assumption, the strains caused by the normal stress in the two directions are independent of one another; therefore, the superposition principle can be applied during calculations. A new Mohr circle of stress formula considering the influence of strain on stress can be obtained [27,28,29].
σ ( 1 υ ) σ 1 + σ 2 2 2 + τ 2 = ( 1 + υ ) σ 1 σ 2 2 2
Rock fracturing is not only related to the shear stress on the fracture surface, but also to the normal stress acting on the fracture surface; that is, in order to destroy the bonding force of the rock to form cracks, one must not only achieve the shear strength of the failure surface, but also overcome the friction force caused by the normal stress. Therefore, we suppose that the ultimate shear stress for shear failure is given as [30,31]:
τ = τ 0 + σ T o t a l α tan φ
where τ0 is the shear strength when σTotal−α = 0.
The tangent point is not the section with the maximum shear stress. This can be seen in Figure 3. When the rock undergoes shear failure, the angle between the shear surface and the maximum stress σ1 is:
θ = 45 ° φ 2
The internal friction angle of sandstone φ is 35–50°; therefore, the range of θ, which is the angle between the crack and the axis, is 20–27.5°.
MATLAB (2018a) software was used to program the calculation process and to perform the verification calculations in order to compare the effects of the deformation on the stress, not considering the effects of the deformation, confining pressure, stress difference, and other factors on the results. The simulated parameter table is shown in Table 1. The simulation results are shown in Figure 4: First, considering the influence of the rock deformation on the stress, the difference of the fracture pressure of the rock was decreased. Second, as the confining pressure increased, the difference of the fracture pressure of the rock increased and the rock strength increased. Third, during the increase of the axial pressure, the maximum principal stress changed from radial to axial, and the pressure difference first decreased, then increased. The radius of the Mohr circle of stress decreased first, and then increased.

2.2. Samples and Experiments

The nine outcrop core samples were selected from Sichuan and divided into three groups. The cores of the same group were taken from the same direction with the same lithology in order to ensure that they had similar properties. The specific data are shown in Table 2.
The fracturing experimental process is shown in Figure 5. It was necessary to keep the confining pressure and the nitrogen flooding pressure constant during the experiment, and increase the axial pressure in order to create cracks. The specific experiment steps are as follows:
(1)
Connect the experimental instrument, test the airtightness of the device, and select the core for drying treatment;
(2)
Load a small axial pressure first, fix the core position, and then load a fixed confining pressure, and it will always remain unchanged;
(3)
Open the gas cylinder, set a suitable gas drive pressure, and always keep it constant; Use a gas flow meter to test the gas flow rate at the outlet end of the core holder in order to calculate the real-time permeability of the core;
(4)
Set the axial pressure from 0, to 5 MPa, to 10 MPa, to 15 MPa, etc., until the gas permeability growth rate increases rapidly. At this time, increase the axial pressure growth in 1 MPa increments until the permeability is at an ideal level. When a certain axial pressure is loaded, keep the axial pressure constant; when the permeability does not change over time, increase the axial pressure. Different permeability growth rates represent different degrees of microcrack development;
(5)
Change the confining pressure, repeat step 4, and compare the effect of confining pressure on the result of making microcracks;
(6)
End the experiment and process the experimental data.
To verify the cracks generated under the triaxial stress conditions, pieces of uncracked cores were selected from the three series for comparative experiments. Twelve core samples were vacuumed for 24 h and then saturated in 100,000 ppm salt water for 48 h. Nuclear magnetic resonance experiments were then conducted in order to obtain the T2 curves of the core samples, and put the cores with visible cracks under the microscope in order to observe the characteristics of the cracks.

3. Results and Discussion

3.1. NMR T2 Spectrum Characteristics and Porosity Changes

Figure 6 shows that the T2 curves of the cores after cracking are moved to the right as a whole, and that the curve of the 101-core series has the largest rightward shift. The main difference in the T2 curves of the cores after crack formation is the “peak” corresponding to the large channel, where the “peak” corresponding to the T2 curve of the core with a large increase in permeability after crack formation is high. The saturated water signal of the cracked rock samples is enhanced.
It can be concluded that due to triaxial stress, the rock particles are broken, connecting the dead pores and the small pores that are not connected to form microcracks, where the microcracks become the main channel of the porous media [32,33]. Therefore, it can be seen that the T2 curve of the cracked core shifted to the right, the storage space was somewhat increased, and the signal volume was enhanced.
Figure 7 shows the core T2 relaxation times of 5 ms, 10 ms, and 100 ms as the boundaries. The sum of the corresponding nuclear magnetic signals within the boundaries roughly corresponds to the amount of fluid in the nanopores, micro-nanopores, sub-micropores, and micropores [34,35]. It can be seen from the figures that under triaxial stress, the proportion of nanopores and micro-nanopores decreases, while that of submicron and microsized pores increases, but the change rate of the proportion of each pore is small in the three series. While the permeability change rate varies greatly, indicating that the microcracks are generated under the action of triaxial stress, this also indicates that the generation of microcracks contributes greatly to core permeability.

3.2. Observation under the Microscope

By observing the nine cracked cores, we found that visible cracks only appeared on the surface of cores with a permeability growth rate of more than 90%. The observation of the visible cracks under the microscope shows that the crack width of the 101–1 core was 100 μm and its length was 1.9 cm; the width of the crack of the 101–10 core was 80 μm and its length was 1.8 cm; and the width of the crack of the 99–3 core was 60 μm and its length was 2 cm, the experimental results are shown in Figure 8. Furthermore, the direction of the crack development made an acute angle with the axis; that is, an angle of less than 30°, which is consistent with the theoretical calculation result.

3.3. The Evaluation Method of Artificial Microcracks in Rocks

The increase in the permeability of cracked cores is due to the generation of cracks, which can improve the seepage capacity of the matrix. Hence, this experiment used the rate of increase in permeability to evaluate the effect of the cracks, as shown in Figure 9. A large number of microcracks were generated at the inflection point, where the permeability increased rapidly. The mathematical expression of the permeability increase rate is:
S = K K 0 K 0 × 100 %
where S is the rate of increase of permeability, K is the permeability (10−3 μm2), and K0 is the initial permeability (10−3 μm2). There are many calculation methods for permeability [36,37,38,39]; the formula used in this article is as follows:
K = 2 Q o p o μ L A p 1 2 p 2 2
where Qo is the outlet gas flow, po is the atmospheric pressure, μ is the gas viscosity, L is the length of the core, A is the end area of the core, and p1 and p2 are the absolute pressures on the inlet and outlet sections, respectively.
Figure 9 shows that under triaxial stress, when the confining pressure is fixed and the axial pressure increased, the core permeability first decreases, then increases. In the experiment, the confining pressure of the 101 series and the 99 series cores was 5 MPa, while the confining pressure of the 78 series cores was 10 MPa. In this study, the core permeability variation with the pressure difference is divided into three sections. In section “ab”, the permeability gradually decreased with the increase in stress difference, where the rock was being compacted and rock particles were deformed, leading to the compression of pores and throats, and resulting in a decrease in permeability, which was especially impacted by the decrease in the volume of the throats. In section “bc”, the permeability gradually increased with the increase in stress difference, where microcracks began to occur when the radius of the stress circle was greater than a certain percentage of the shear strength, but the number and size of the microcracks were small, such that the permeability gradually increased while the rate of increase was low. In section “cd”, the permeability rapidly increased with the increasing stress difference, where a large number of microcracks began to occur as the radius of the rock stress circle approached and exceeded the shear strength, leading to a large increase in permeability.
Figure 9a shows that the permeability of the 101-core series reaches its lowest point after a 15% drop when the stress difference is approximately 16 MPa, after which the permeability starts to increase; when the stress difference is approximately 30 MPa, the permeability first increases gradually to the initial state, then increases rapidly, and the permeability growth rate reaches its highest point of 100% when the stress difference is approximately 40 MPa.
Figure 9b shows that the permeability of the 99-core series reaches its lowest point after a 10% drop when the stress concentration is approximately 20 MPa, then starts to increase; when the stress difference is approximately 34 MPa, the permeability first increases gradually to the initial state, then increases rapidly, and the permeability growth rate reaches its highest point of 80% when the stress difference is approximately 45 MPa.
Figure 9c shows that the permeability of the 78-core series reaches its lowest point after a 5% drop when the stress difference is approximately 16 MPa, then starts to increase; when the stress difference is approximately 30 MPa, the permeability first increases gradually to the initial state, then increases rapidly, and the permeability growth rate reaches its highest point of 33% when the stress difference is approximately 45 MPa.
In summary, as the confining pressure increased, the strength of the rock and the differences in the crack pressure increased. When the stress difference was small, the permeability decreased with the increase in the stress difference, but the reduction was limited, generally not exceeding 15%. We can use the permeability growth rate after point c to express the degree of microcrack development. When the permeability curve is at “ab”, there are no microcracks in the rock sample; when the permeability curve is at “bc”, the degree of microcrack development is small, and the greater the permeability growth rate, the more microcracks develop; when the permeability curve is at “cd”, the degree of development of microcracks is large, and the greater the rate of permeability growth, the more developed the microcracks.
Figure 10 shows that the fitting curve to evaluate the result of the cracks takes the following form:
y = y 0 + A * e x x 0 2 2 w 2
where x0 is the stress difference at the lowest point of the permeability, and both w and A are functions of the elastic modulus E and Poisson’s ratio μ. By fitting the evaluation results, it is possible to find values that the experiment could not.

3.4. Case Application

Through the above experimental methods, cores with different degrees of microcrack development can be produced for experiments. In this paper, the same batch of outcrop cores was made using the above-mentioned crack-making method in order to manufacture cores with permeability growth rates of 20–90% in 10% increments. Table 3 shows the core data of the target microcracks that developed according to the above method.
The study of the influence of microcracks on the seepage law is inseparable from the use of cores with different degrees of microcrack development. However, the cores obtained through field coring obviously cannot meet the requirements for the degree of microcrack development. Therefore, the method of making microcracks proposed in this paper can provide a monitoring basis for the study of microcracks.

4. Conclusions

This paper combines theory and practice in order to systematically study the method of making microcracks in the laboratory. Using the microcrack production method in this article, arbitrary microcracks can be produced, laying an experimental foundation for the research of microcracks in the laboratory. See the experimental process for the specific method.
(1)
A complete crack-making and evaluation method was established. This method can produce cores with any degree of microcrack development for the seepage experiments. According to theoretical calculations and experimental results, the resulting crack angle was 20–27.5° with the axis, and visible cracks appeared on the surface when the fracture permeability increased by more than 90%, where the visible cracks had a width of 60–100 μm. Furthermore, this method is highly reproducible and low in cost.
(2)
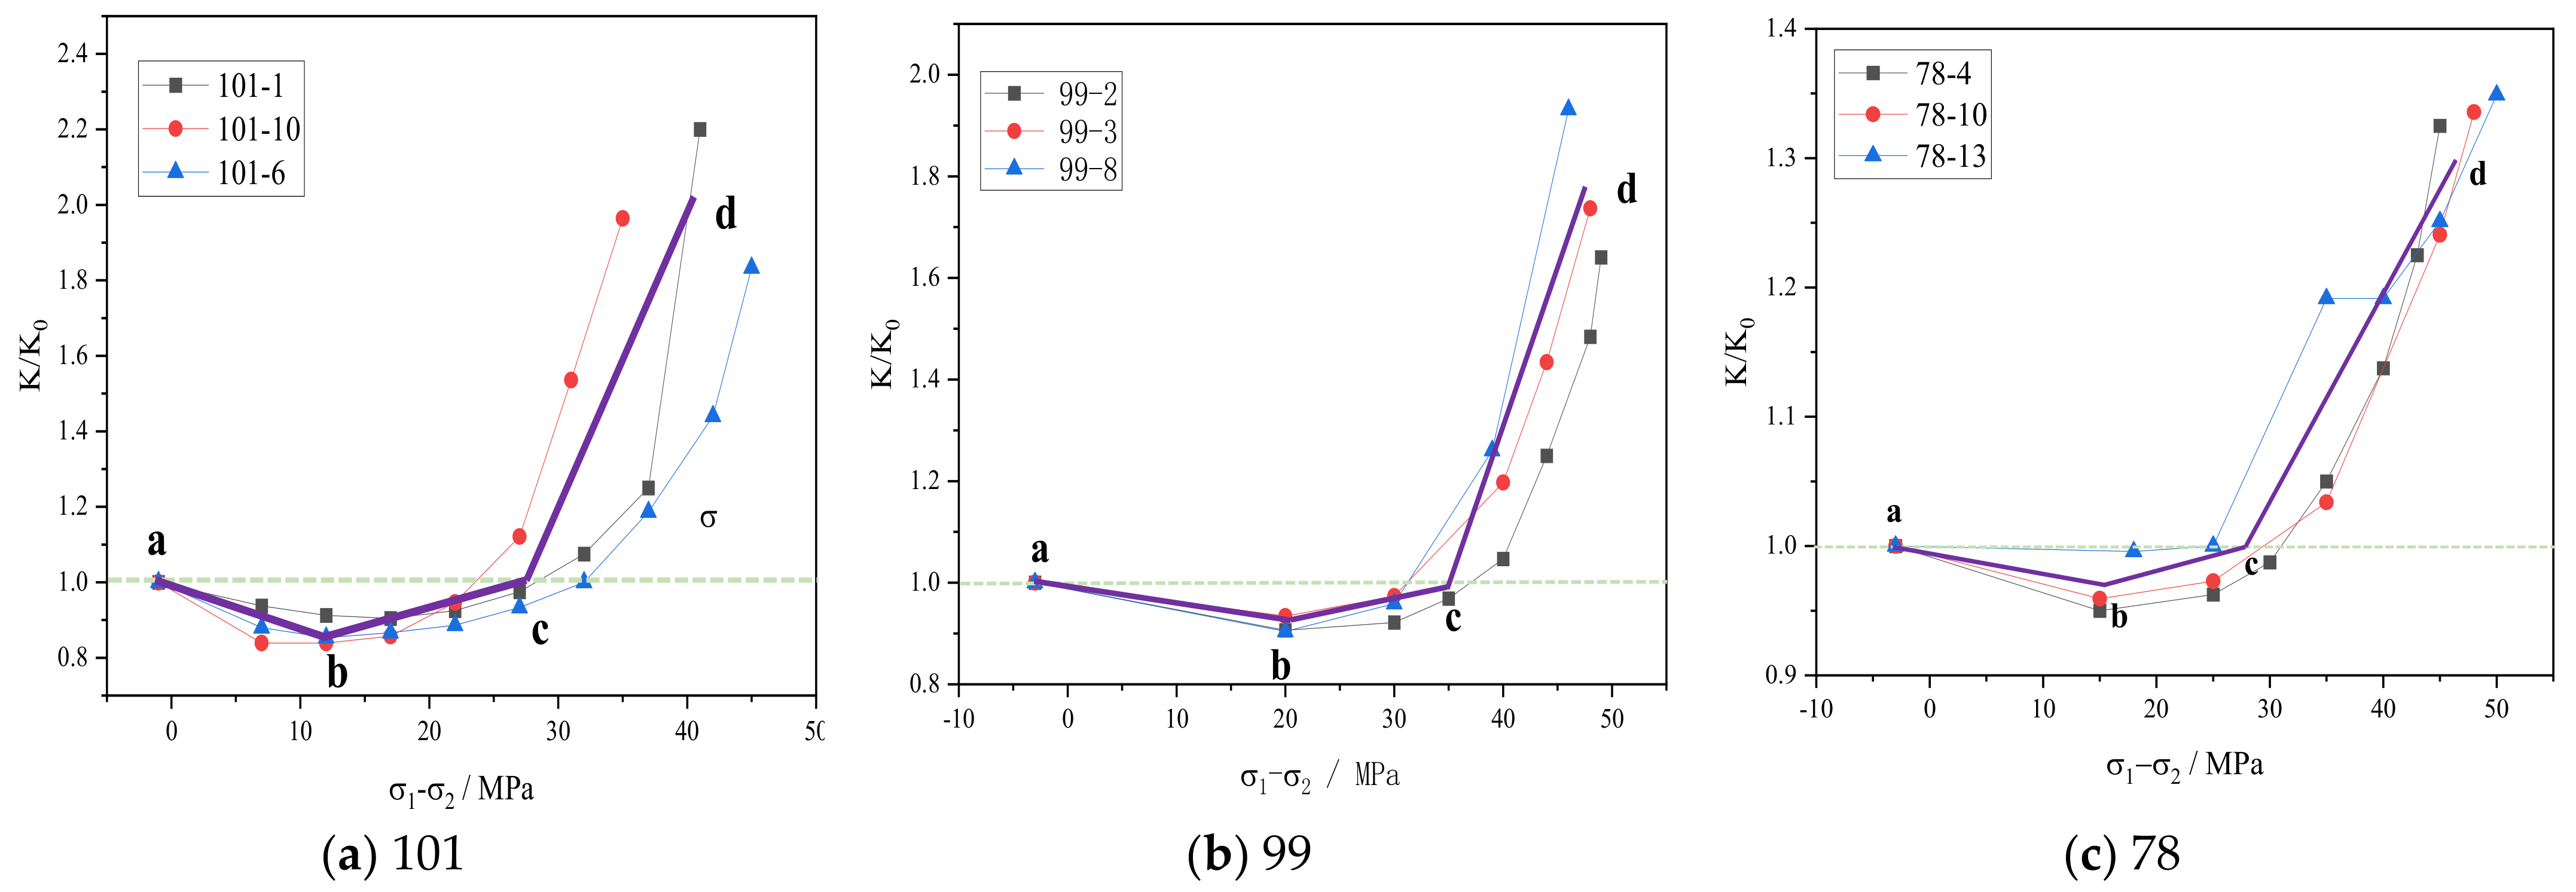
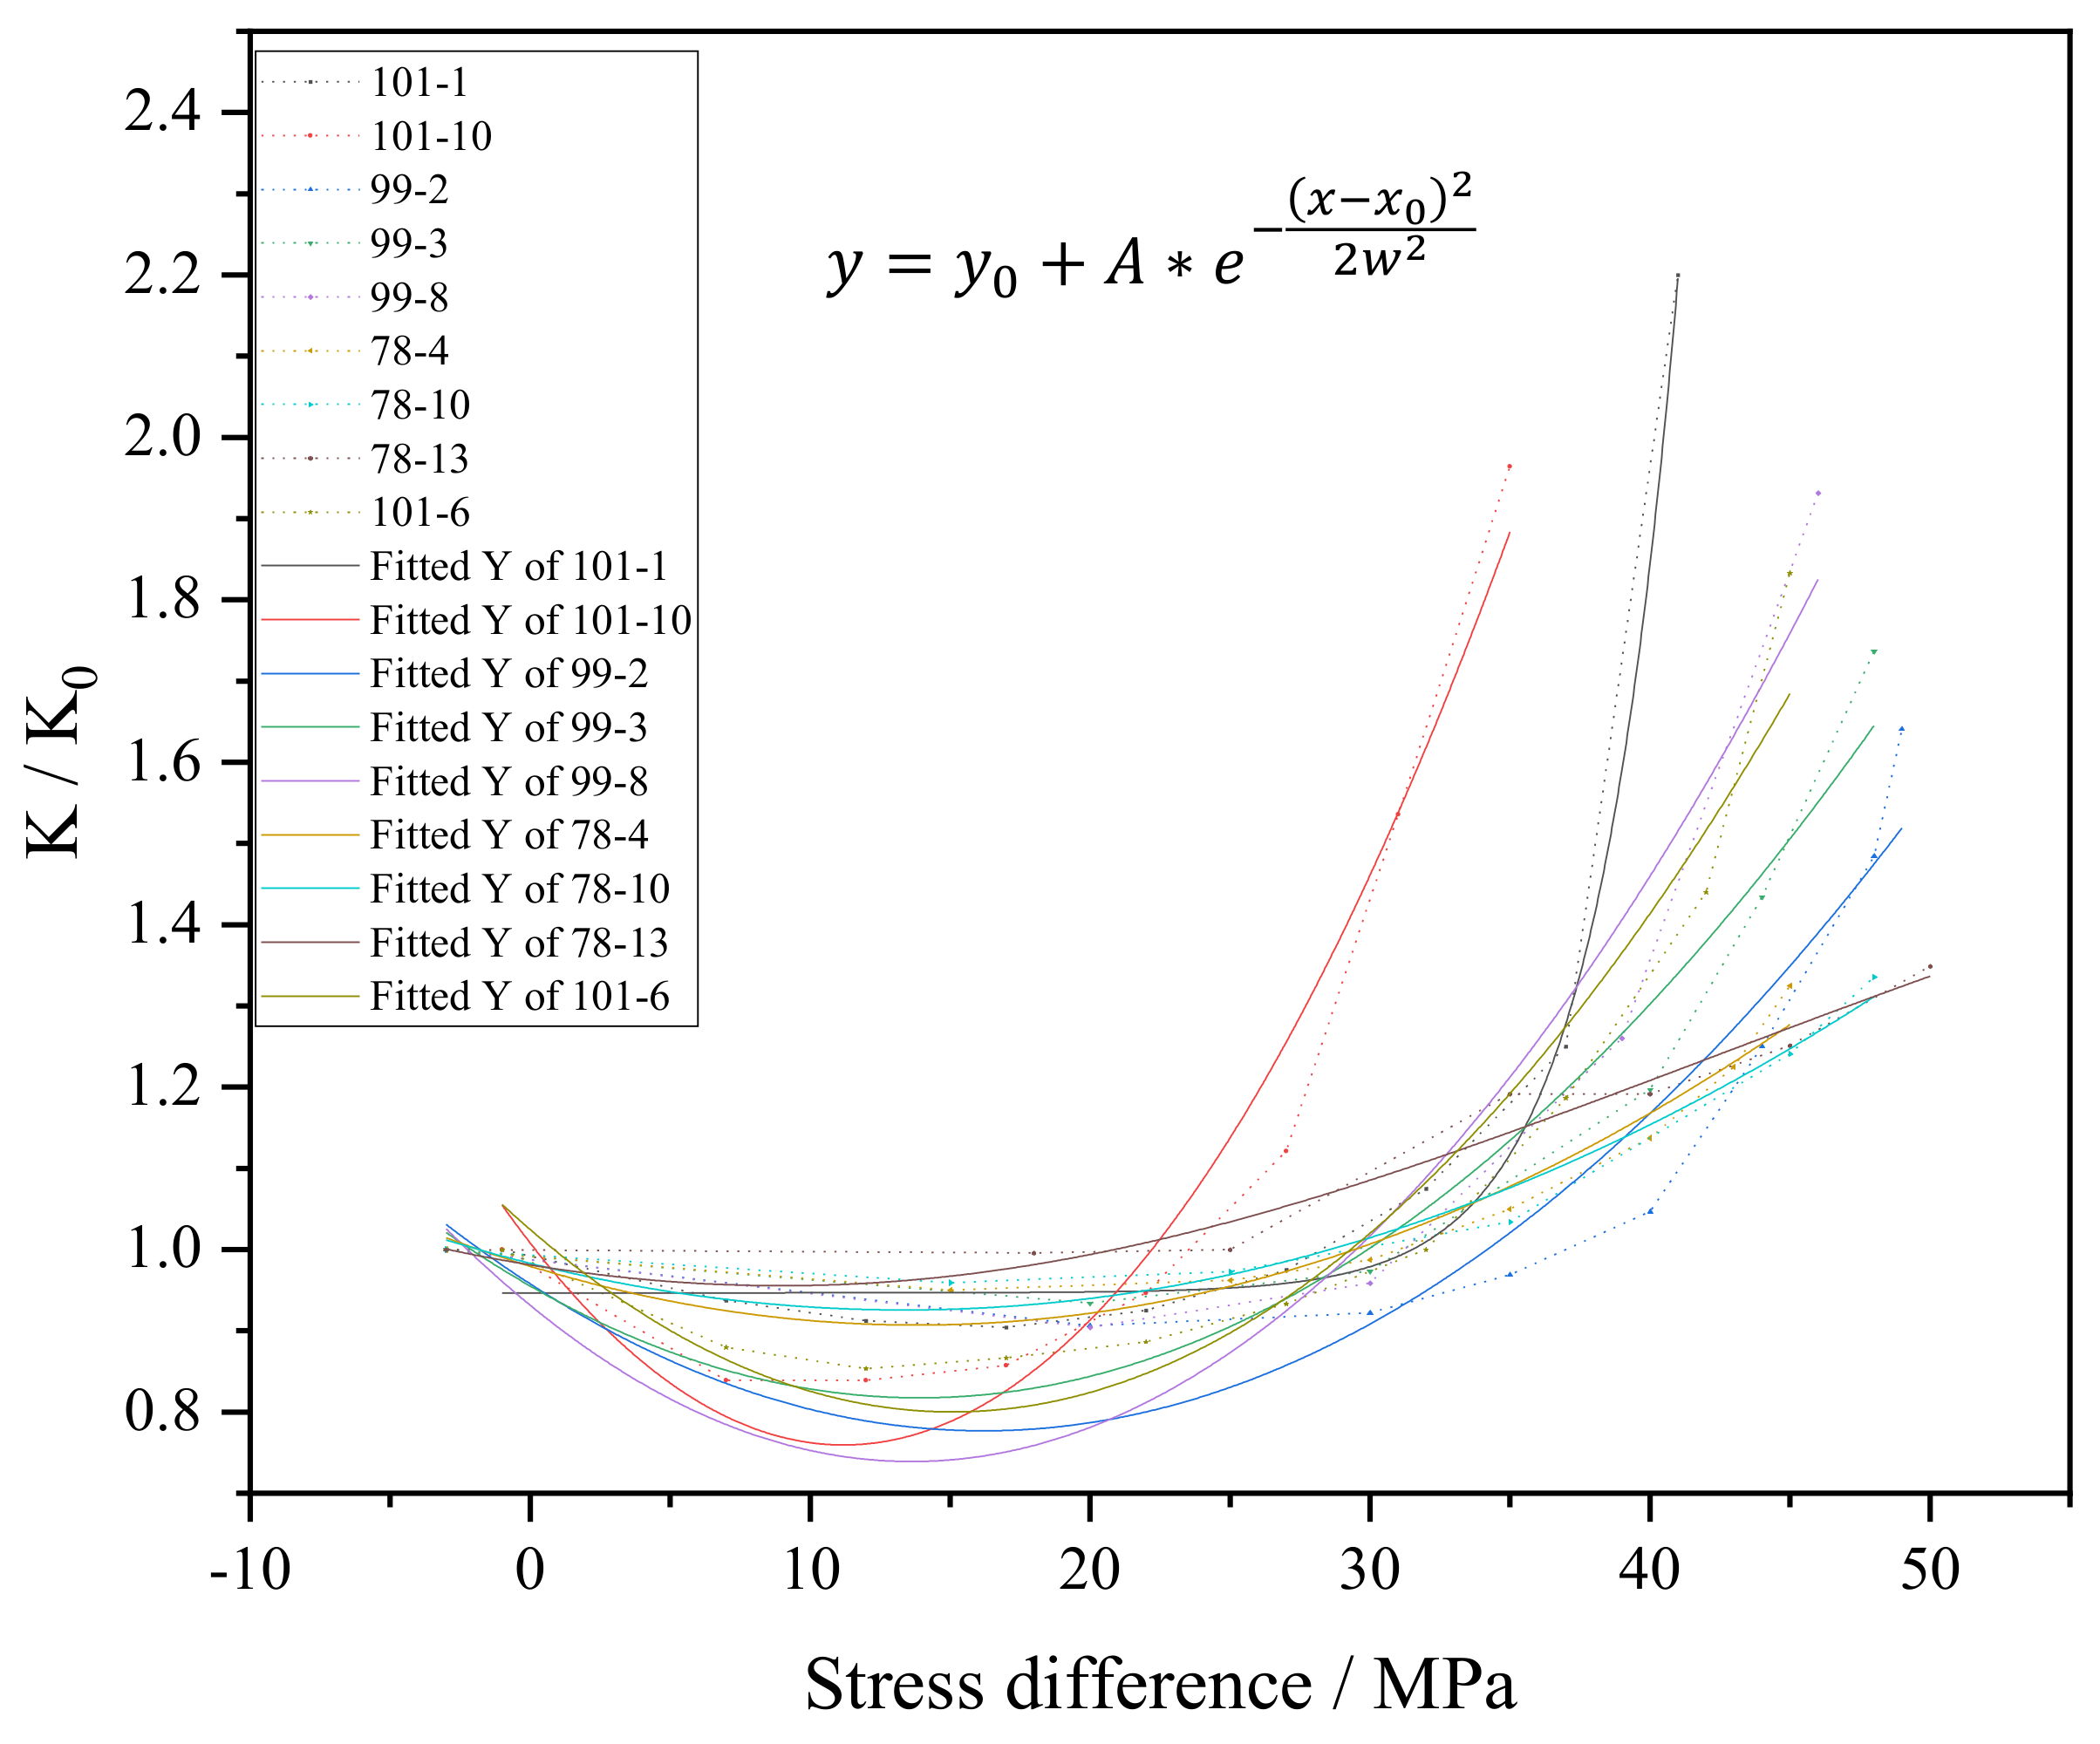
The greater the confining pressure, the less prone to microcracks. It is easier to form microcracks when considering deformation than without considering deformation. The permeability variation curve shows two obvious turning points, which divide the whole zone into a reduction zone, a slow increase zone, and a rapid increase zone. The drop in permeability in the rock compaction stage generally does not exceed 15%, and the greater the initial rock permeability, the smaller the impact of the compaction stage on the permeability.
(3)
The smaller the initial permeability of the rock, the higher the contribution rate of the microcracks to the seepage capacity, because the microcracks become the main channel of porous media, as shown by the T2 curve of the cracked core shifting to the right, the storage space somewhat increasing, and the enhanced signal volume.

Author Contributions

Writing—original draft preparation, Z.W.; resources, X.L. (Xizhe Li); funding acquisition, H.X.; methodology, X.L. (Xuewei Liu); software, Y.R.; investigation, W.L.; formal analysis, Y.L.; writing—review and editing, J.Z. All authors have read and agreed to the published version of the manuscript.

Funding

This research was funded by the CNPC basic advanced reserve technology (2018A-0908).

Institutional Review Board Statement

Not applicable.

Informed Consent Statement

Not applicable.

Data Availability Statement

The data presented in this study are available in this article.

Conflicts of Interest

The authors declare no conflict of interest.

References

  1. Zhou, X.; Yuan, Q.; Zhang, Y.; Wang, H.; Zeng, F.; Zhang, L. Performance evaluation of CO2 flooding process in tight oil reservoir via experimental and numerical simulation studies. Fuel 2019, 236, 730–746. [Google Scholar] [CrossRef]
  2. Wang, X.; Hou, J.; Song, S.; Wang, D.; Gong, L.; Ma, K.; Liu, Y.; Li, Y.; Yan, L. Combining pressure-controlled porosimetry and rate-controlled porosimetry to investigate the fractal characteristics of full-range pores in tight oil reservoirs. J. Pet. Sci. Eng. 2018, 171, 353–361. [Google Scholar] [CrossRef]
  3. Zhao, P.; Wang, Z.; Sun, Z.; Cai, J.; Wang, L. Investigation on the pore structure and multifractal characteristics of tight oil reservoirs using NMR measurements: Permian Lucaogou Formation in Jimusaer Sag, Junggar Basin. Mar. Pet. Geol. 2017, 86, 1067–1081. [Google Scholar] [CrossRef]
  4. Wang, G.; Chang, X.; Yin, W.; Li, Y.; Song, T. Impact of diagenesis on reservoir quality and heterogeneity of the Upper Triassic Chang 8 tight oil sandstones in the Zhenjing area, Ordos Basin, China. Mar. Pet. Geol. 2017, 83, 84–96. [Google Scholar] [CrossRef]
  5. Li, P.; Zheng, M.; Bi, H.; Wu, S.; Wang, X. Pore throat structure and fractal characteristics of tight oil sandstone: A case study in the Ordos Basin, China. J. Pet. Sci. Eng. 2017, 149, 665–674. [Google Scholar] [CrossRef]
  6. Bai, R.; Li, Z.; Wang, H.; Liu, X.; Wei, Q.; Li, H. Fractal nature of microscopic pore throat structure in Chang 7 tight oil reservoir of Longdong area. Sci. Technol. Eng. 2016, 16, 54–59. [Google Scholar]
  7. Giri, A.; Tarafdar, S.; Gouze, P.; Dutta, T. Fractal pore structure of sedimentary rocks: Simulation in 2-d using a relaxed bidisperse ballistic deposition model. J. Appl. Geophys. 2012, 87, 40–45. [Google Scholar] [CrossRef]
  8. Kaiming, W. The prospect of exploration and development for unconventional hydrocarbon resources in China. World Well Logging Technol. 2009, 3, 8. [Google Scholar]
  9. Du, S. Characteristics and the formation mechanism of the heterogeneous microfractures in the tight oil reservoir of Ordos Basin, China. J. Pet. Sci. Eng. 2020, 191, 107176. [Google Scholar] [CrossRef]
  10. Yang, B.; Qu, H.; Pu, R.; Tian, X.; Yang, H.; Dong, W.; Chen, Y. Controlling Effects of Tight Reservoir Micropore Structures on Seepage Ability: A Case Study of the Upper Paleozoic of the Eastern Ordos Basin, China. Acta Geol. Sin. 2019, 94, 322–336. [Google Scholar] [CrossRef]
  11. Du, S.; Zhao, Y.; Yuan, Q. Prediction of permeability and its anisotropy of tight oil reservoir via precise pore-throat tortuosity characterization and “umbrella deconstruction” method. J. Pet. Sci. Eng. 2019, 178, 1018–1028. [Google Scholar] [CrossRef] [Green Version]
  12. Shedid, S. Influences of fracture orientation on oil recovery by water and polymer flooding processes: An experimental approach. J. Pet. Sci. Eng. 2006, 50, 285–292. [Google Scholar] [CrossRef]
  13. Eoff, L.S.; Dalrymple, E.D.; Everett, D.M.; Vasquez, J.E. Worldwide Field Applications of a Polymeric Gel System for Conformance Applications. SPE Prod. Oper. 2007, 22, 231–235. [Google Scholar] [CrossRef]
  14. Simjoo, M.; Koohi, A.D.; Seftie, M.V.; Zitha, P.L.J. Water Shut-Off in a Fractured System Using a Robust Polymer Gel. In Proceedings of the Society of Petroleum Engineers 8th European Formation Damage Conference, Scheveningen, The Netherlands, 27–29 May 2009. [Google Scholar] [CrossRef]
  15. Lian, P.; Cheng, L. The Characteristics of Relative Permeability Curves in Naturally Fractured Carbonate Reservoirs. J. Can. Pet. Technol. 2012, 51, 137–142. [Google Scholar] [CrossRef]
  16. Katsuki, D.; Gutierrez, M.; Almrabat, A. Stress-dependent shear wave splitting and permeability in fractured porous rock. J. Rock Mech. Geotech. Eng. 2019, 11, 1–11. [Google Scholar] [CrossRef]
  17. Chitrala, Y.; Moreno, C.; Sondergeld, C.H.; Rai, C.S. An experimental investigation into hydraulic fracture propagation under different applied stresses in tight sands using acoustic emissions. J. Pet. Sci. Eng. 2013, 108, 151–161. [Google Scholar] [CrossRef]
  18. Martin, C.; Chandler, N. The progressive fracture of Lac du Bonnet granite. Int. J. Rock Mech. Min. Sci. Geomech. Abstr. 1994, 31, 643–659. [Google Scholar] [CrossRef]
  19. Fonseka, G.; Murrell, S.; Barnes, P. Scanning electron microscope and acoustic emission studies of crack development in rocks. Int. J. Rock Mech. Min. Sci. Geomech. Abstr. 1985, 22, 273–289. [Google Scholar] [CrossRef]
  20. Yang, S.-Q.; Yin, P.-F.; Huang, Y.-H.; Cheng, J.-L. Strength, deformability and X-ray micro-CT observations of transversely isotropic composite rock under different confining pressures. Eng. Fract. Mech. 2019, 214, 1–20. [Google Scholar] [CrossRef]
  21. Zhang, Y.; Niu, S.; Du, Z.; Hao, J.; Yang, J. Dynamic fracture evolution of tight sandstone under uniaxial compression in high resolution 3D X-ray microscopy. J. Pet. Sci. Eng. 2020, 195, 107585. [Google Scholar] [CrossRef]
  22. Torsaeter, O.; Kleppe, J.; Van Golf-Racht, T. Multiphase Flow in Fractured Reservoirs. Advances in Transport Phenomena in Porous Media; Springer: Dordrecht, The Netherlands, 1987; pp. 551–629. [Google Scholar]
  23. Liu, B.; Yang, Y.; Li, J.; Chi, Y.; Li, J.; Fu, X. Stress sensitivity of tight reservoirs and its effect on oil saturation: A case study of Lower Cretaceous tight clastic reservoirs in the Hailar Basin, Northeast China. J. Pet. Sci. Eng. 2020, 184, 106484. [Google Scholar] [CrossRef]
  24. Liu, B.; Song, Y.; Zhu, K.; Su, P.; Ye, X.; Zhao, W. Mineralogy and element geochemistry of salinized lacustrine organic-rich shale in the Middle Permian Santanghu Basin: Implications for paleoenvironment, provenance, tectonic setting and shale oil potential. Mar. Pet. Geol. 2020, 120, 104569. [Google Scholar] [CrossRef]
  25. Hudson, J.; Popescu, M.; Harrison, J. Engineering Rock Mechanics: An Introduction to the Principles. Appl. Mech. Rev. 2002, 55, B30. [Google Scholar] [CrossRef]
  26. Shen, B.; Shi, J.; Barton, N. An approximate nonlinear modified Mohr-Coulomb shear strength criterion with critical state for intact rocks. J. Rock Mech. Geotech. Eng. 2018, 10, 645–652. [Google Scholar] [CrossRef]
  27. Gu, J.; Li, K.; Su, L. Modified nonlinear Mohr–Coulomb fracture criteria for isotropic materials and transversely isotropic UD composites. Mech. Mater. 2020, 151, 103649. [Google Scholar] [CrossRef]
  28. Abbo, A.; Lyamin, A.; Sloan, S.; Hambleton, J. A C2 continuous approximation to the Mohr-Coulomb yield surface. Int. J. Solids Struct. 2011, 48, 3001–3010. [Google Scholar] [CrossRef] [Green Version]
  29. Wan, Y.; Zhang, H.; Liu, X.; Yin, G.; Xiong, J.; Liang, L. Prediction of mechanical parameters for low-permeability gas reservoirs in the Tazhong Block and its applications. Adv. Geo Energy Res. 2020, 4, 219–228. [Google Scholar] [CrossRef]
  30. Barton, N. The shear strength of rock and rock joints. Int. J. Rock Mech. Min. Sci. Geomech. Abstr. 1976, 13, 255–279. [Google Scholar] [CrossRef]
  31. Barton, N. Shear strength criteria for rock, rock joints, rockfill and rock masses: Problems and some solutions. J. Rock Mech. Geotech. Eng. 2013, 5, 249–261. [Google Scholar] [CrossRef] [Green Version]
  32. Li, X.; Lu, D.; Luo, R.; Sun, Y.; Shen, W.; Hu, Y.; Liu, X.; Qi, Y.; Guan, C.; Guo, H. Quantitative criteria for identifying main flow channels in complex porous media. Pet. Explor. Dev. 2019, 46, 998–1005. [Google Scholar] [CrossRef]
  33. Li, X.; Luo, R.; Xu, X.; Xu, X.; Jiao, C.; Guo, Z.; Wan, Y.; Liu, X.; Li, Y. Main flow channel index in porous sand reservoirs and its application. Pet. Explor. Dev. 2020, 47, 1055–1061. [Google Scholar] [CrossRef]
  34. Lyu, C.; Wang, Q.; Ning, Z.; Chen, M.; Li, M.; Chen, Z.; Xia, Y. Investigation on the application of NMR to spontaneous imbibition recovery of tight sandstones: An experimental study. Energies 2018, 11, 2359. [Google Scholar] [CrossRef] [Green Version]
  35. Lai, F.; Li, Z.; Wei, Q.; Zhang, T.; Zhao, Q. Experimental investigation of spontaneous imbibition in a tight reservoir with nuclear magnetic resonance testing. Energy Fuels 2016, 30, 8932–8940. [Google Scholar] [CrossRef]
  36. Lei, G.; Liao, Q.; Patil, S.; Zhao, Y. Effect of clay content on permeability behavior of argillaceous porous media under stress dependence: A theoretical and experimental work. J. Pet. Sci. Eng. 2019, 179, 787–795. [Google Scholar] [CrossRef]
  37. Lei, G.; Dong, P.; Wu, Z.; Mo, S.; Gai, S.; Zhao, C.; Liu, Z. A Fractal Model for the Stress-Dependent Permeability and Relative Permeability in Tight Sandstones. J. Can. Pet. Technol. 2015, 54, 36–48. [Google Scholar] [CrossRef]
  38. Zhang, T.; Li, Z.; Adenutsi, C.D.; Lai, F. A new model for calculating permeability of natural fractures in dual-porosity reservoir. Adv. Geo-Energy Res. 2017, 1, 86–92. [Google Scholar] [CrossRef] [Green Version]
  39. Luo, Y.; Xia, B.; Li, H.; Hu, H.; Wu, M.; Ji, K. Fractal permeability model for dual-porosity media embedded with natural tortuous fractures. Fuel 2021, 295, 120610. [Google Scholar] [CrossRef]
Figure 1. Principal plane stress state [25].
Energies 14 02780 g001
Figure 2. The planar stress decomposition. (The black solid frame in (a) indicates the state of the object before the stress, and the red dotted frame indicates the state of the object after the stress; the black solid line box in (b) represents the result of not considering the deformation of the object in the vertical direction of the stress; and the red dotted frame in (c) indicates that the object only considers the result of deformation in the vertical direction due to the stress).
Energies 14 02780 g002
Figure 3. Mohr’s circle during a shear rupture [25].
Energies 14 02780 g003
Figure 4. Mohr circle of stress.
Energies 14 02780 g004
Figure 5. Flowchart of the experimental design of crack creation.
Energies 14 02780 g005
Figure 6. NMR experiment results from the core samples.
Energies 14 02780 g006
Figure 7. Comparison of the volume ratios of different pores in the cracked cores.
Energies 14 02780 g007
Figure 8. Observations under a microscope of three cores with cracks on the surface.
Energies 14 02780 g008
Figure 9. Plots of the relative permeability changing with the stress difference (the 101-core series has a fixed confining pressure of 3 MPa, while the 99-core and 78-core series have a fixed confining pressure of 5 MPa).
Energies 14 02780 g009
Figure 10. Fitting of the relative permeability with the stress difference.
Energies 14 02780 g010
Table 1. Simulation parameter table.
Whether to Consider the DeformationConfining Pressure (MPa)Whether Damage OccurredPoisson’s Ratio υ
aN5N0.3
bY5Y0.3
cY10N0.3
Table 2. Basic data of the cores.
Core NumberLength
(cm)
Diameter
(cm)
Porosity
(%)
Permeability (10−3 μm2)
(before Crack Creation)
Permeability (10−3 μm2)
(after Crack Creation)
The Growth Rate of Permeability (%)
101–16.0432.50113.170.14590.3210120
101–66.082.47612.580.09370.171883
101–106.0372.48511.230.17230.338596
99–26.072.46513.230.40250.660364
99–36.032.46912.620.47330.822093
99–86.0172.47612.560.45100.871274
78–46.0212.45511.461.50311.999133
78–106.1192.46611.981.56872.102134
78–136.032.45512.151.48021.998335
Table 3. Core data from the cracks with different degrees of development (confining pressure was 3 MPa and axial pressure was 0.7 MPa).
Core NumberDiameter (cm)Length (cm)Permeability (10−3 μm2)The Growth Rate of Permeability (%)
112–12.508.020.287822.56%
112–22.518.060.282135.04%
112–32.497.550.236045.33%
112–42.507.970.272752.89%
112–52.527.960.253363.14%
112–62.507.890.260676.40%
112–72.538.080.203986.33%
112–82.547.790.186993.99%
(Visible cracks)
Publisher’s Note: MDPI stays neutral with regard to jurisdictional claims in published maps and institutional affiliations.

