
Investigating the Effects of the United States’ Economic Slowdown Related to the COVID-19 Pandemic on Energy Consumption in Other Countries—A Global Vector Autoregressive Model


Abstract
1. Introduction
1.1. Conclusions of the Causality between Energy Consumption and Economic Growth
1.2. Methods in Studying the Causality between Economic Growth and Energy Consumption
2. Materials and Methods
2.1. Methodology
2.2. Data Sources
2.3. Model Settings
3. Empirical Results and Analysis
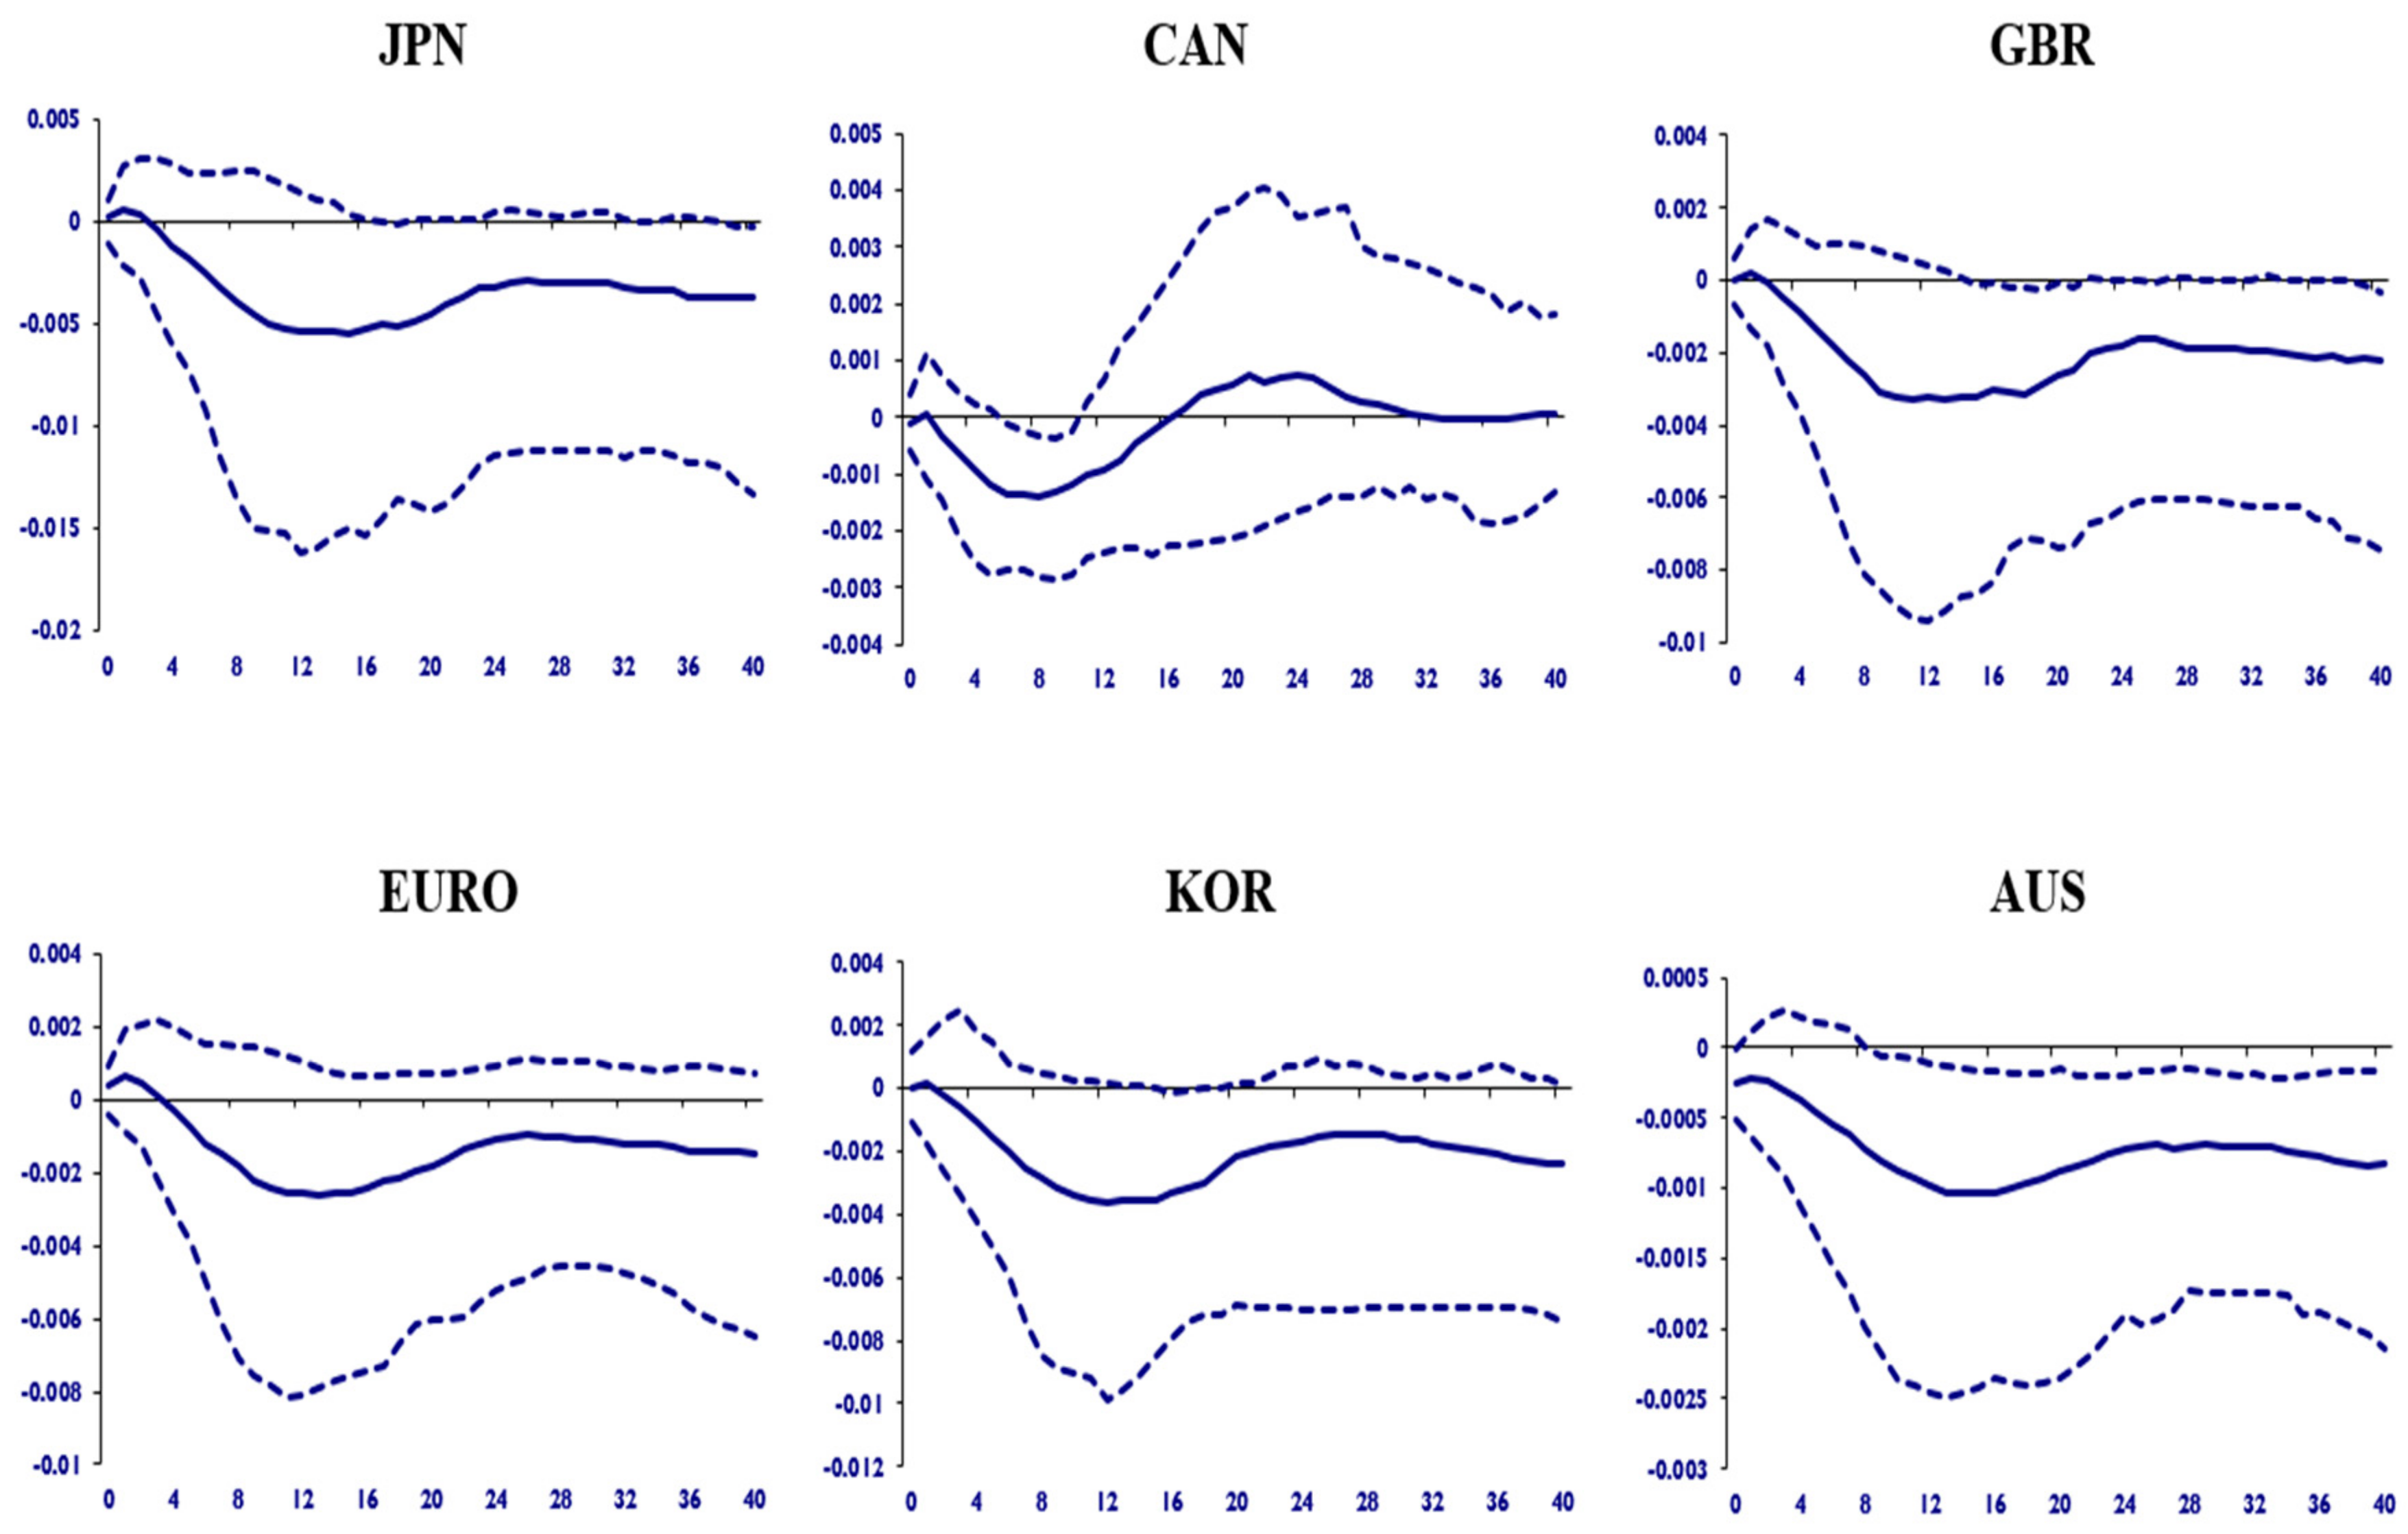
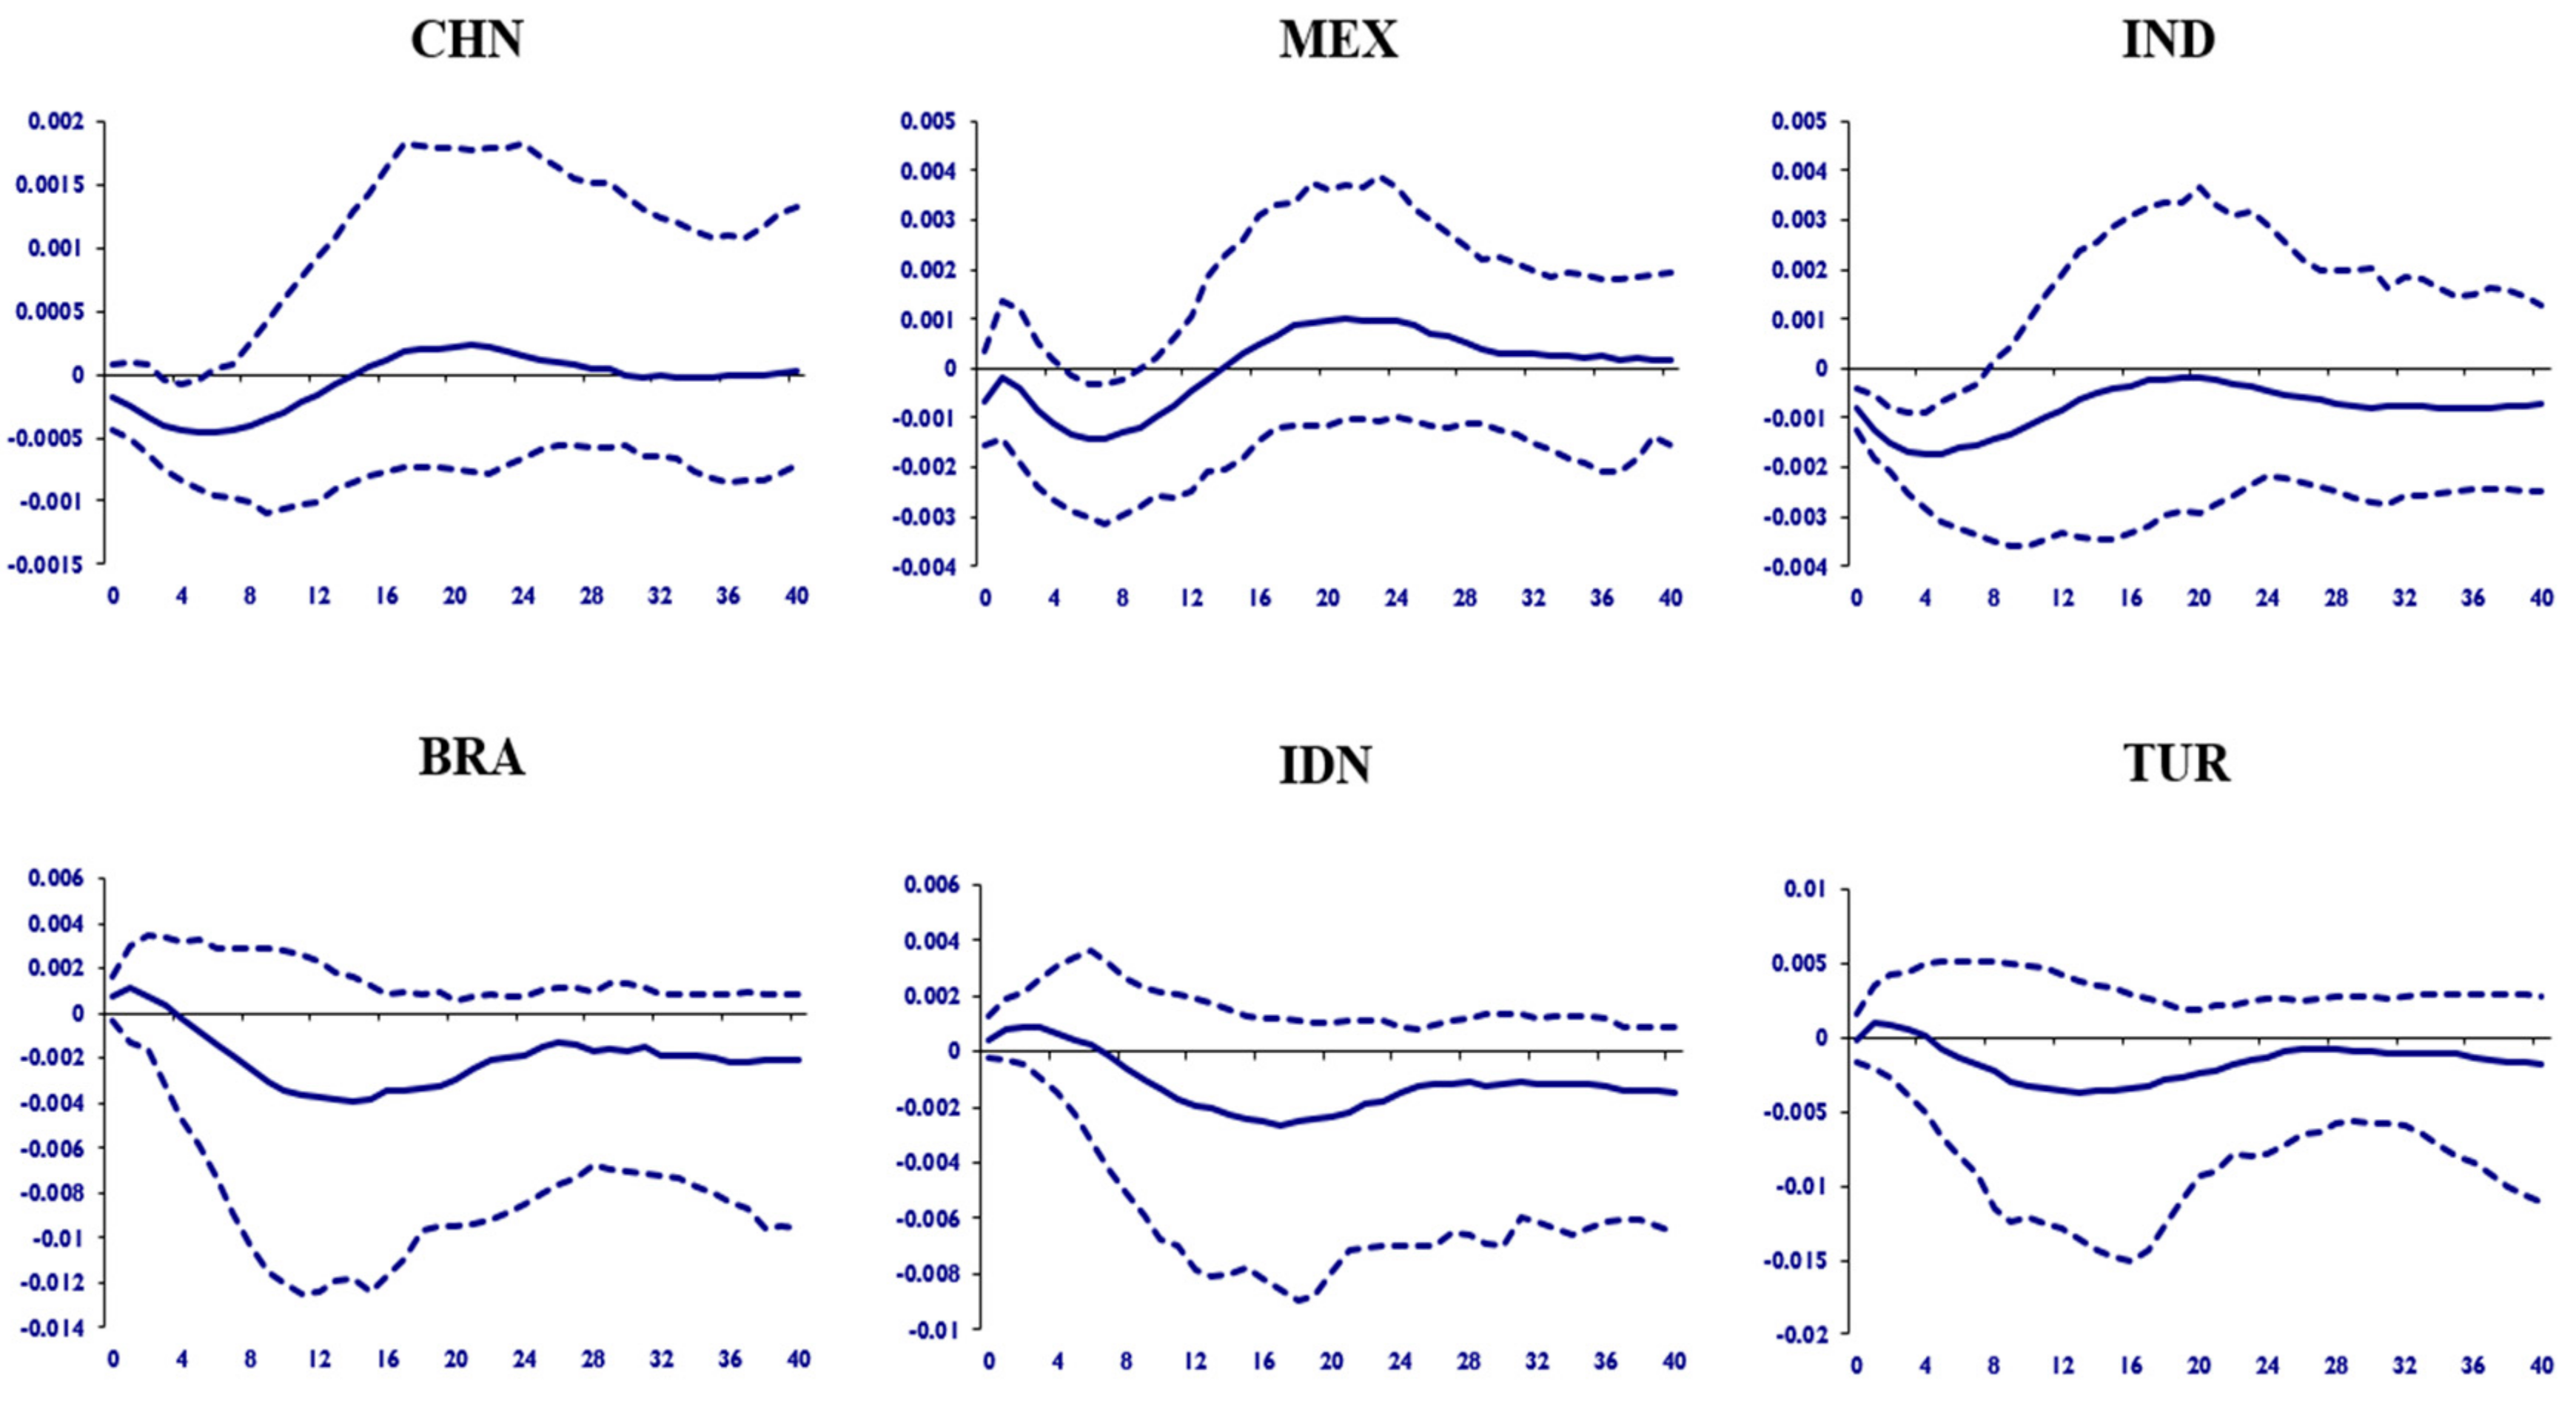
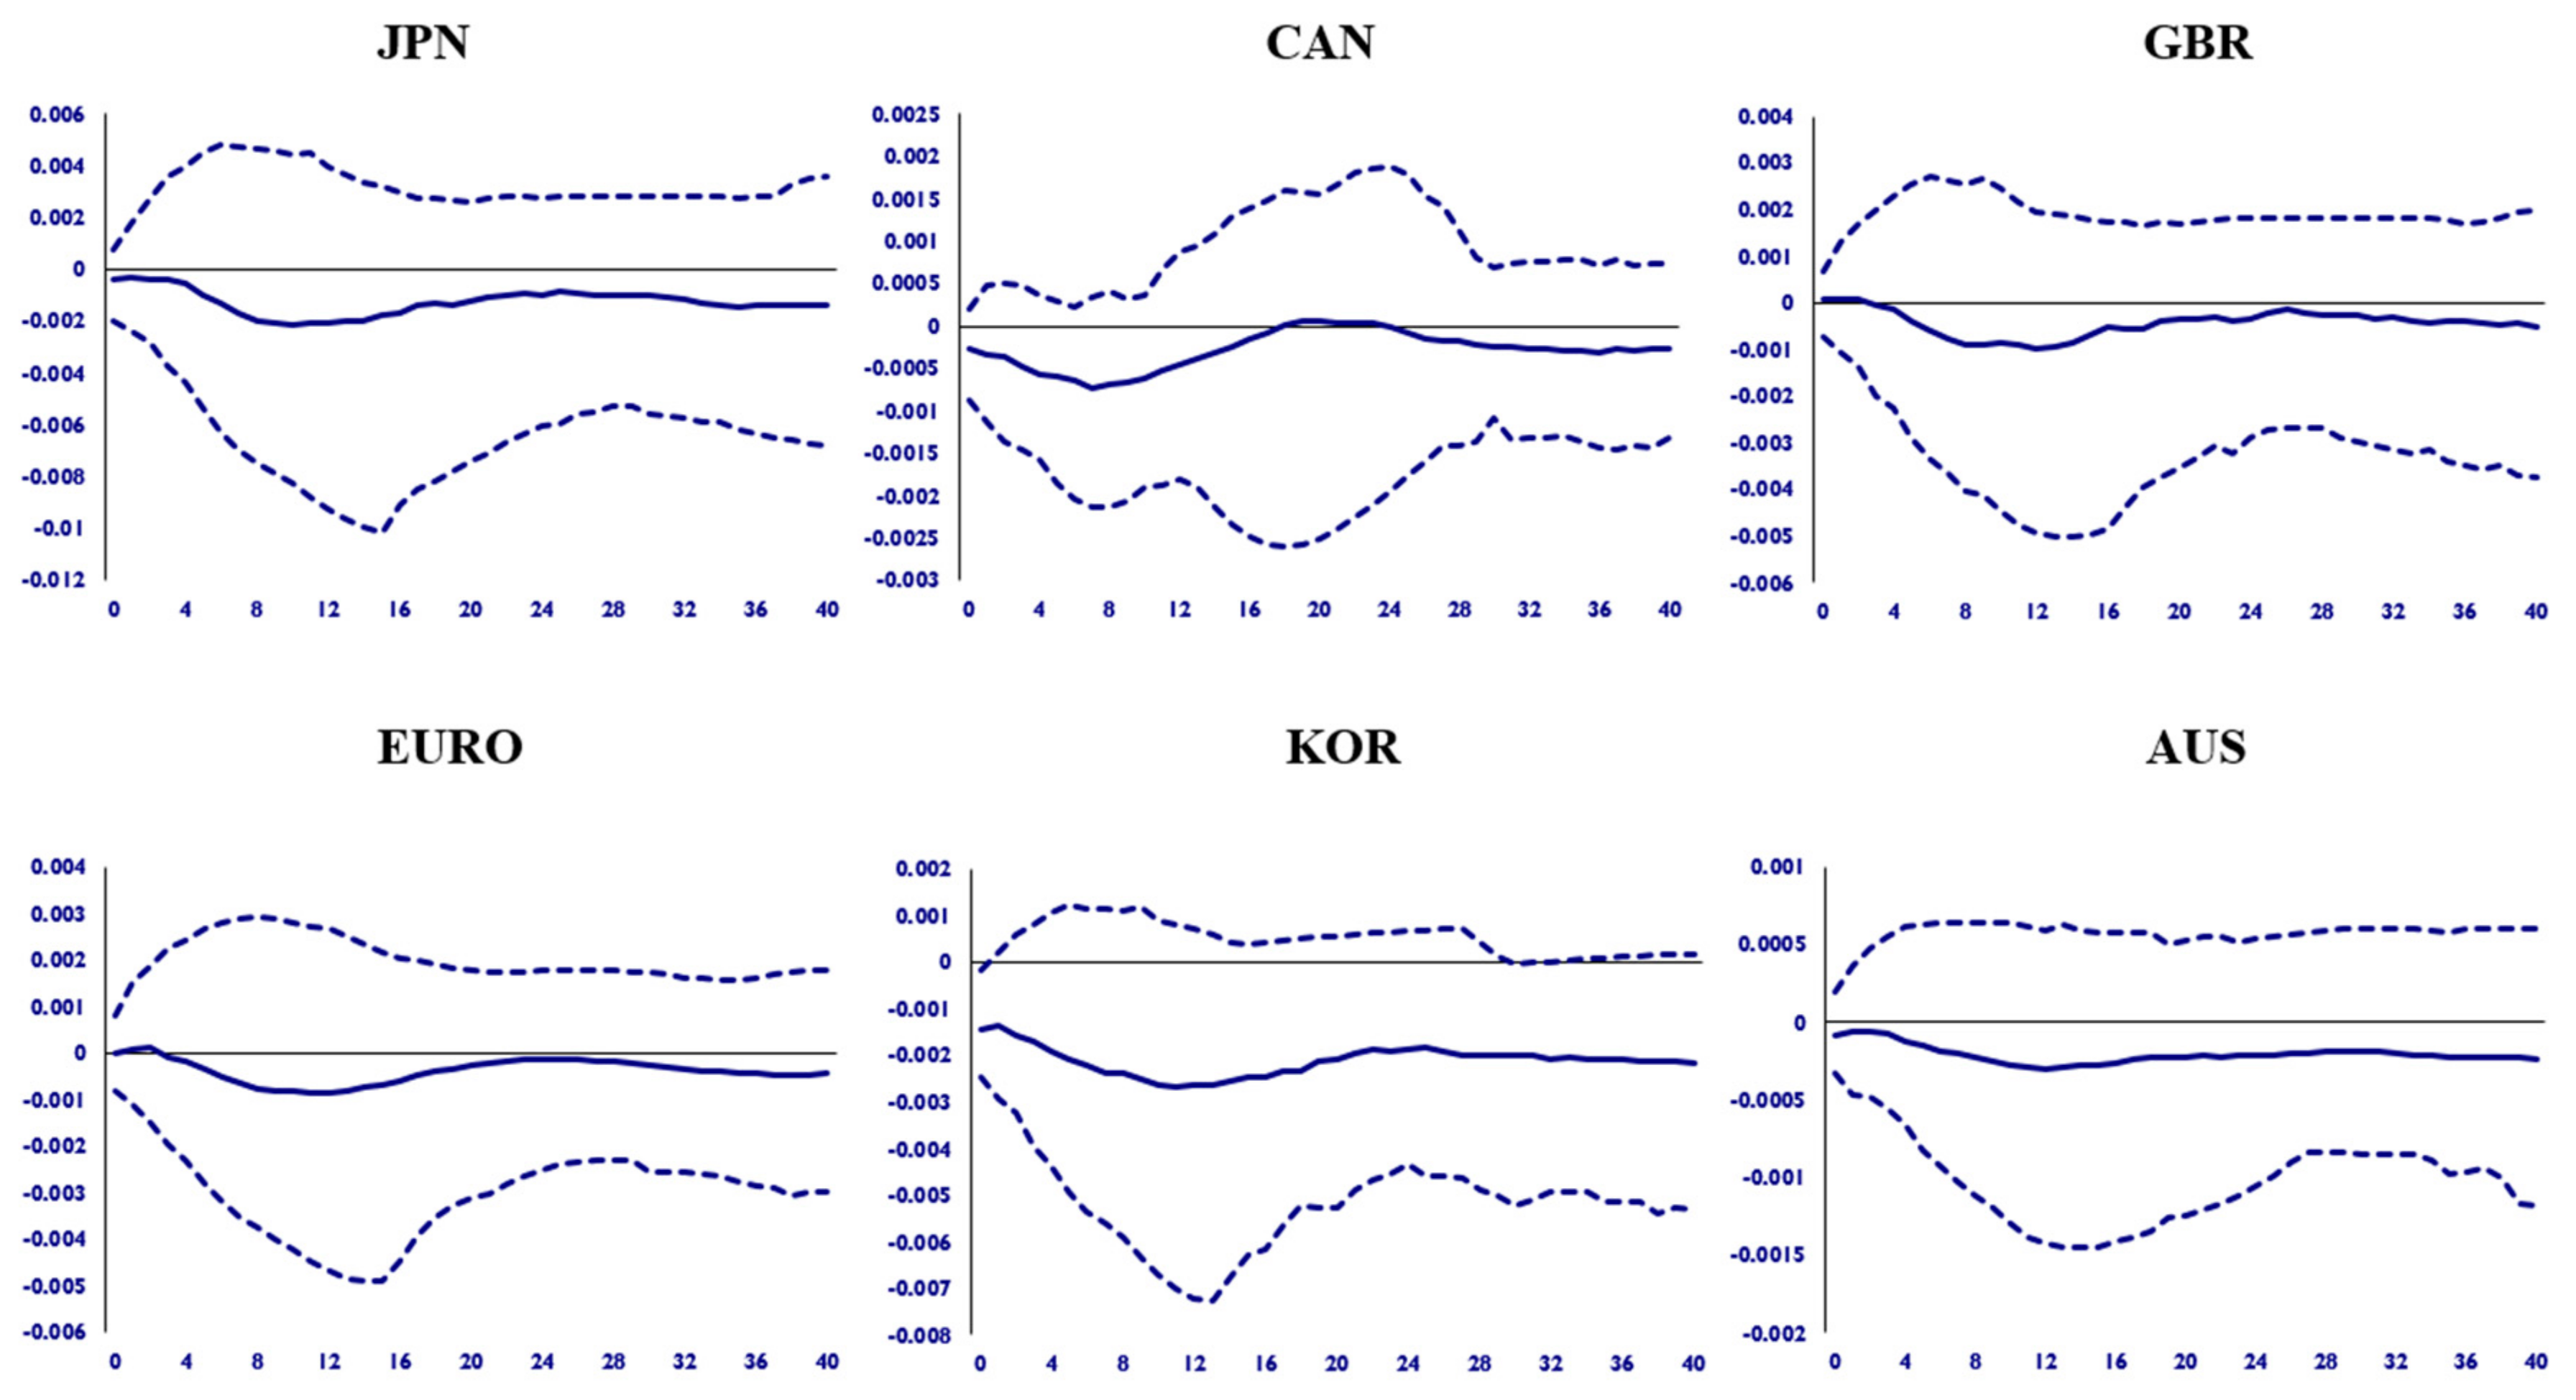
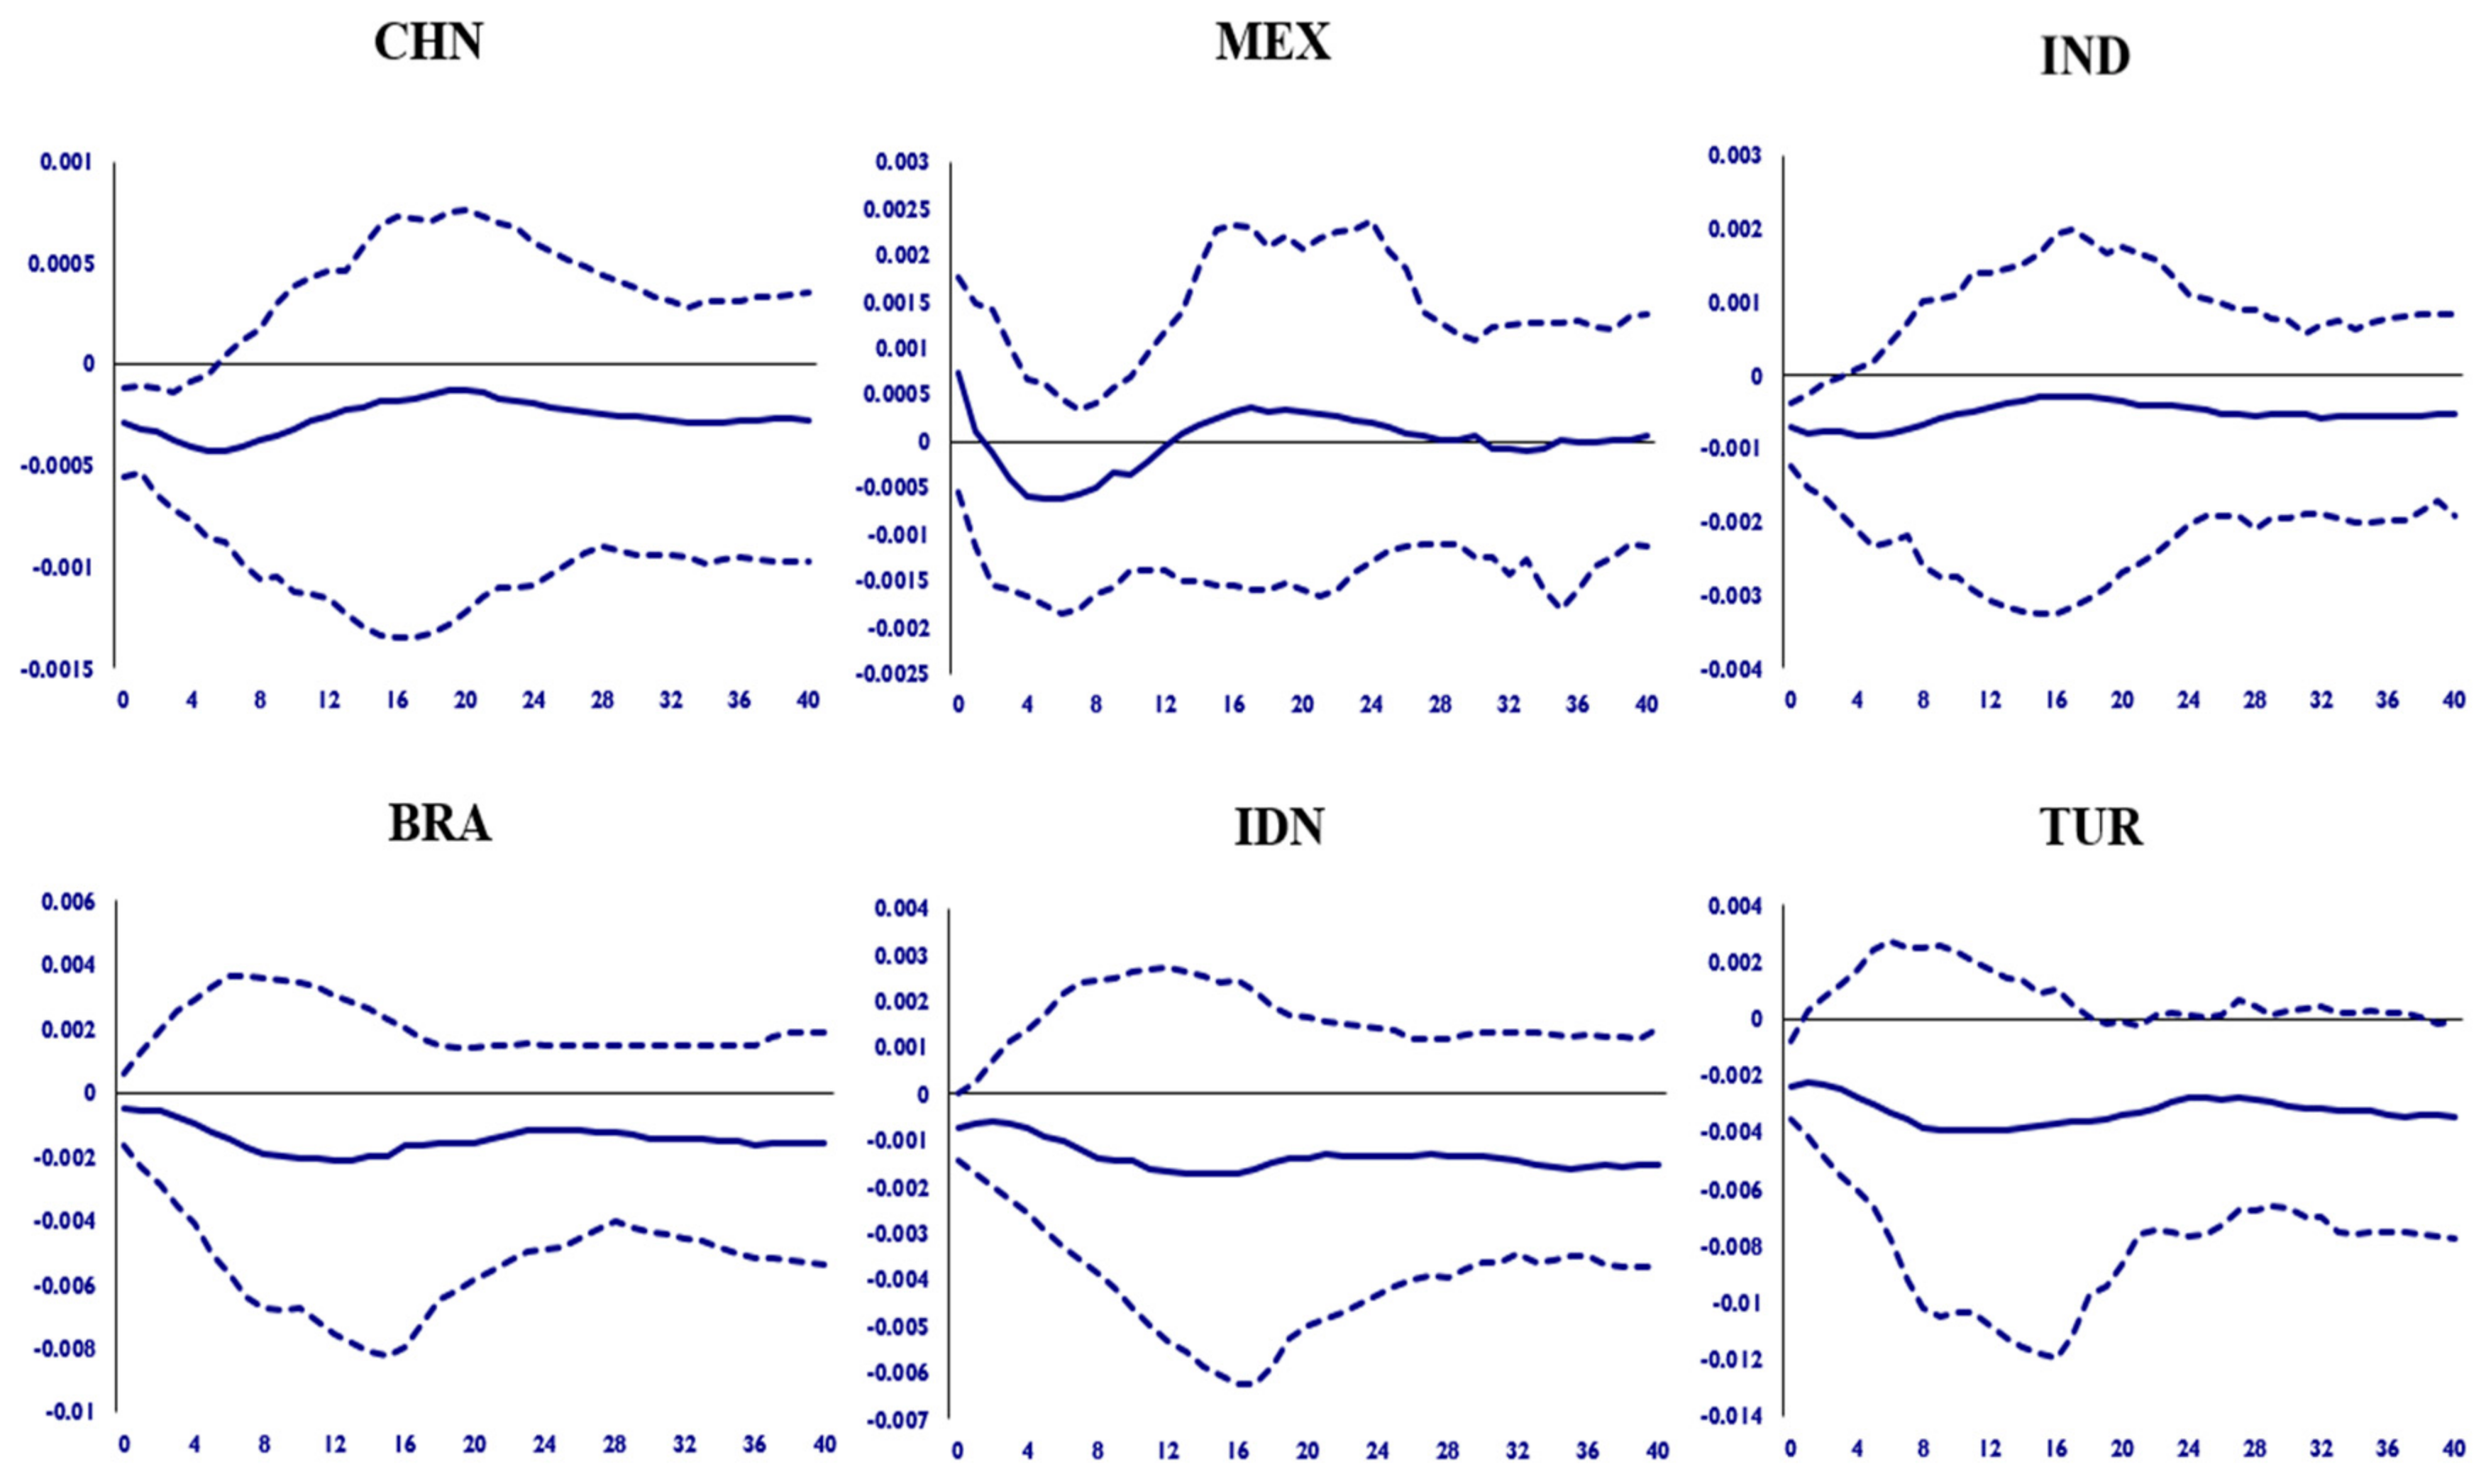
3.1. The Spillover Effect of the Negative Shock of US Economic Growth
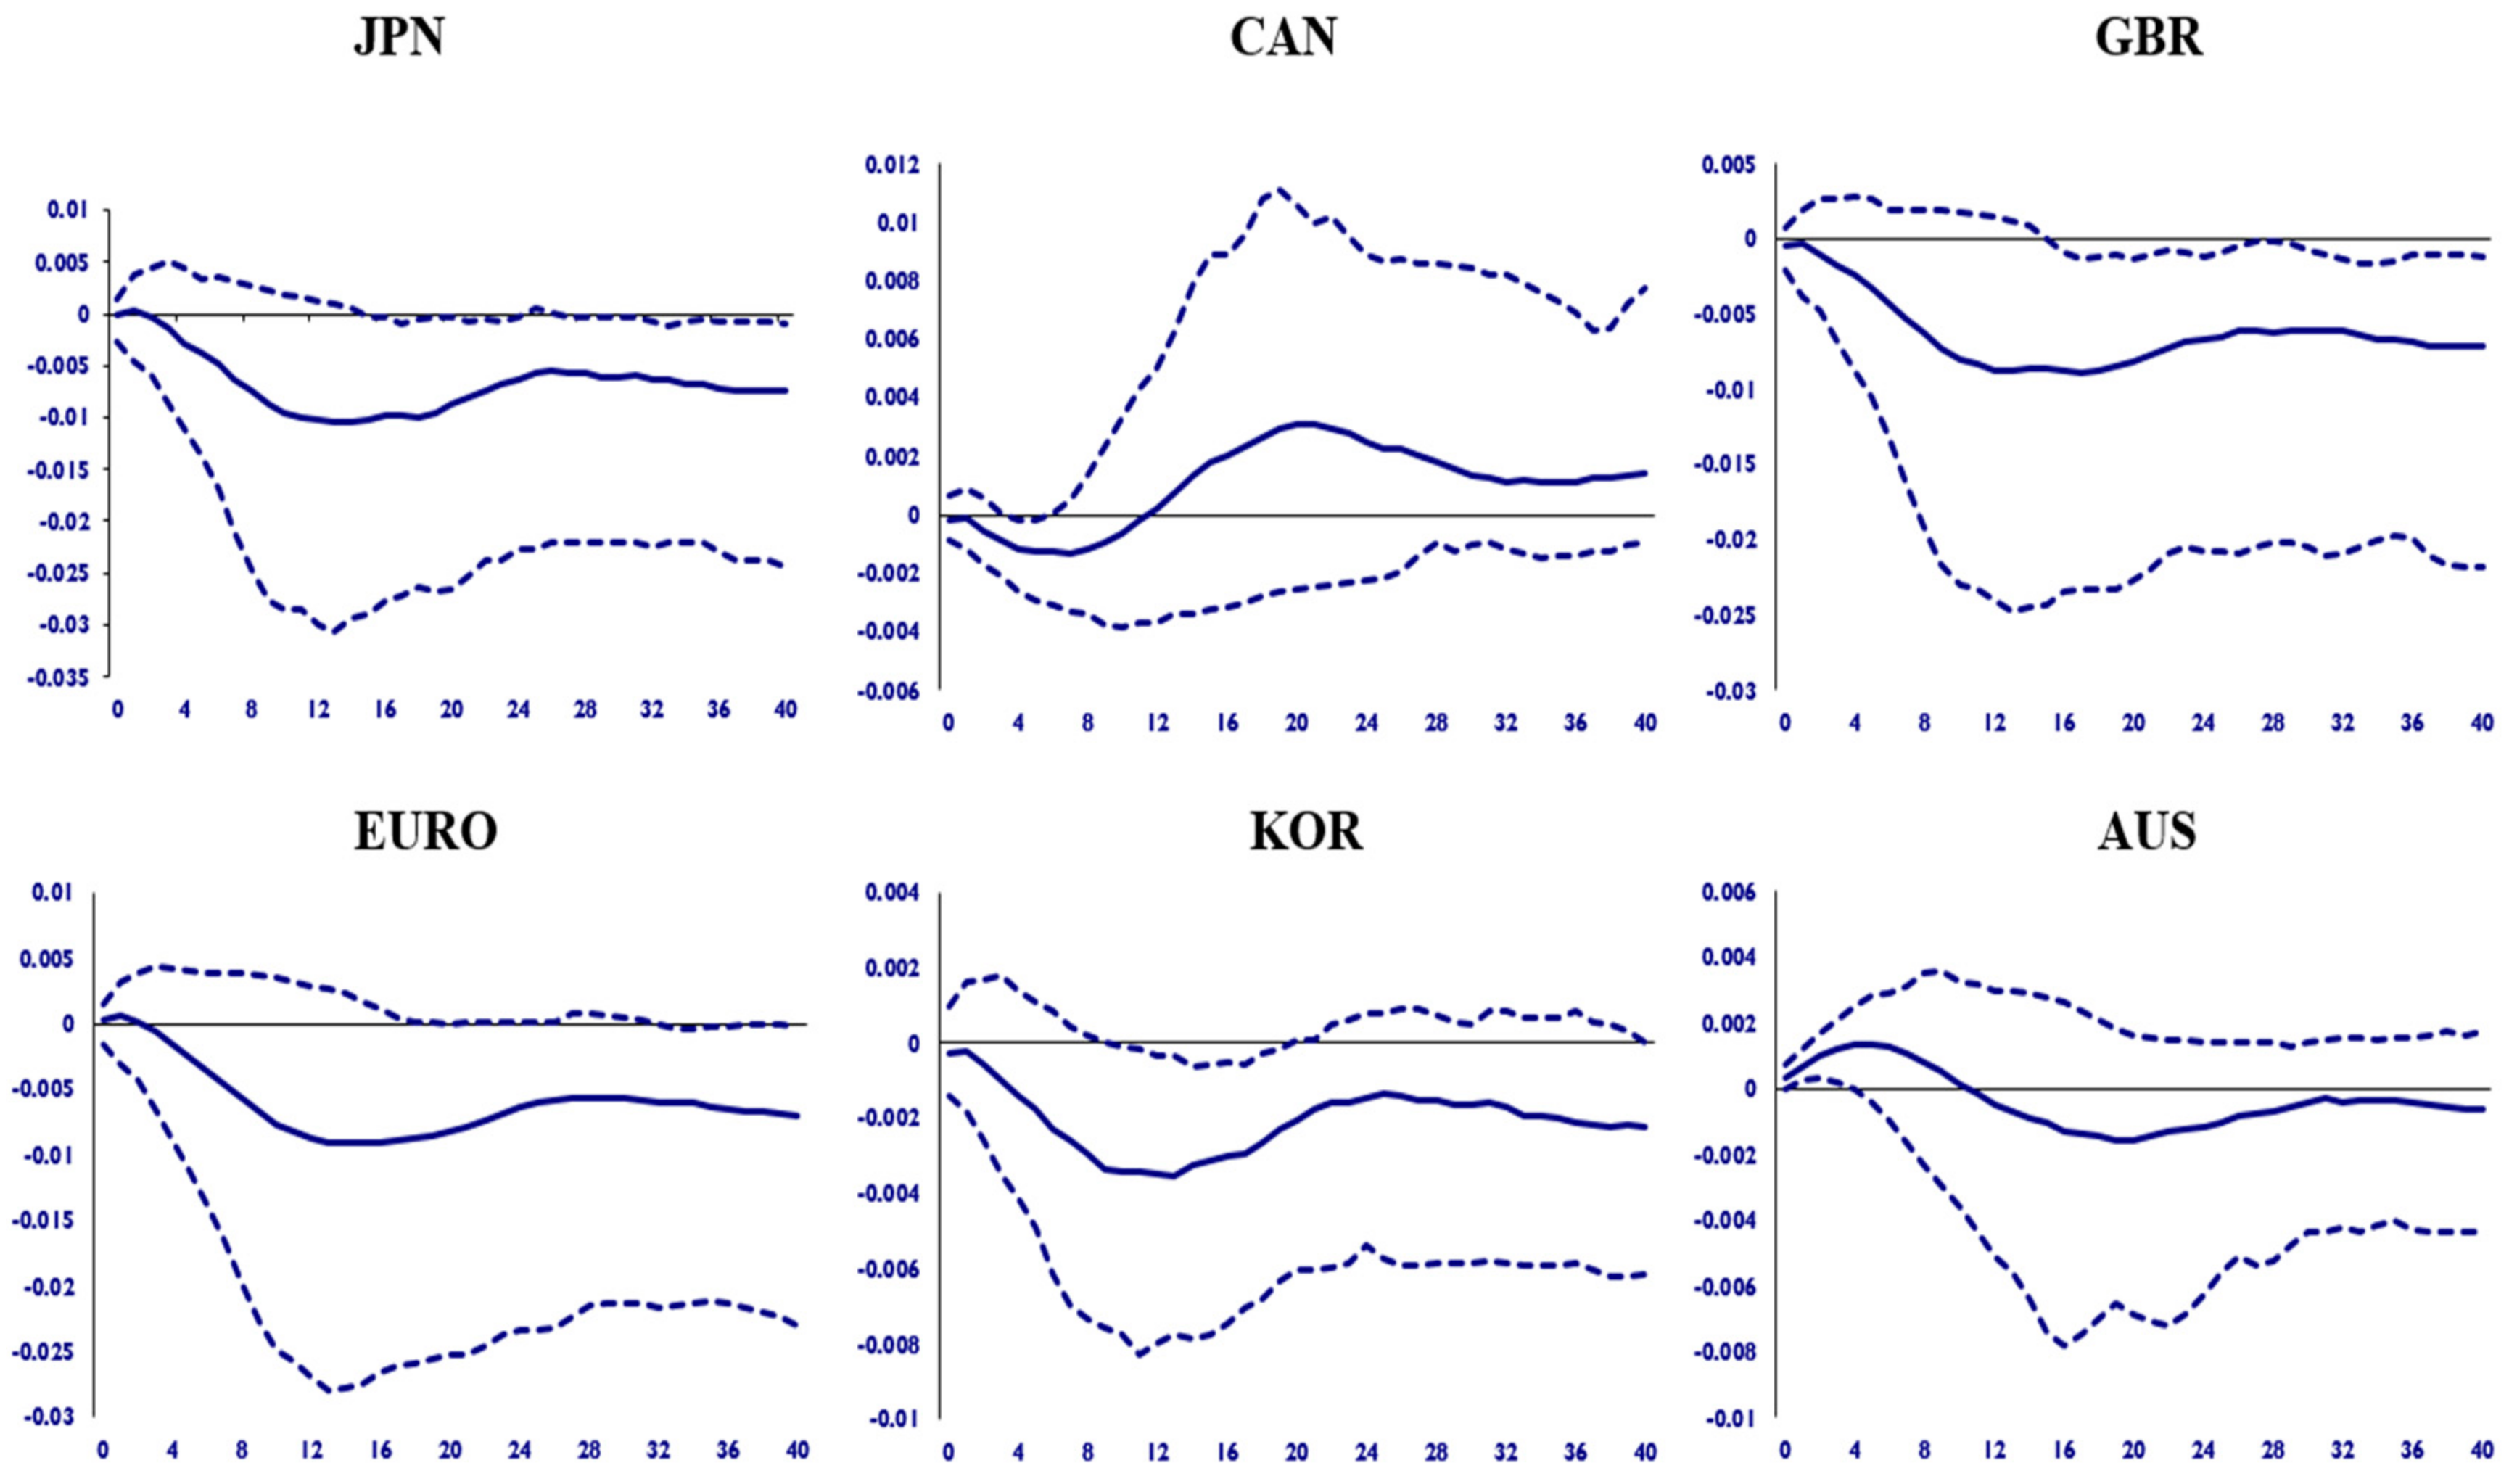
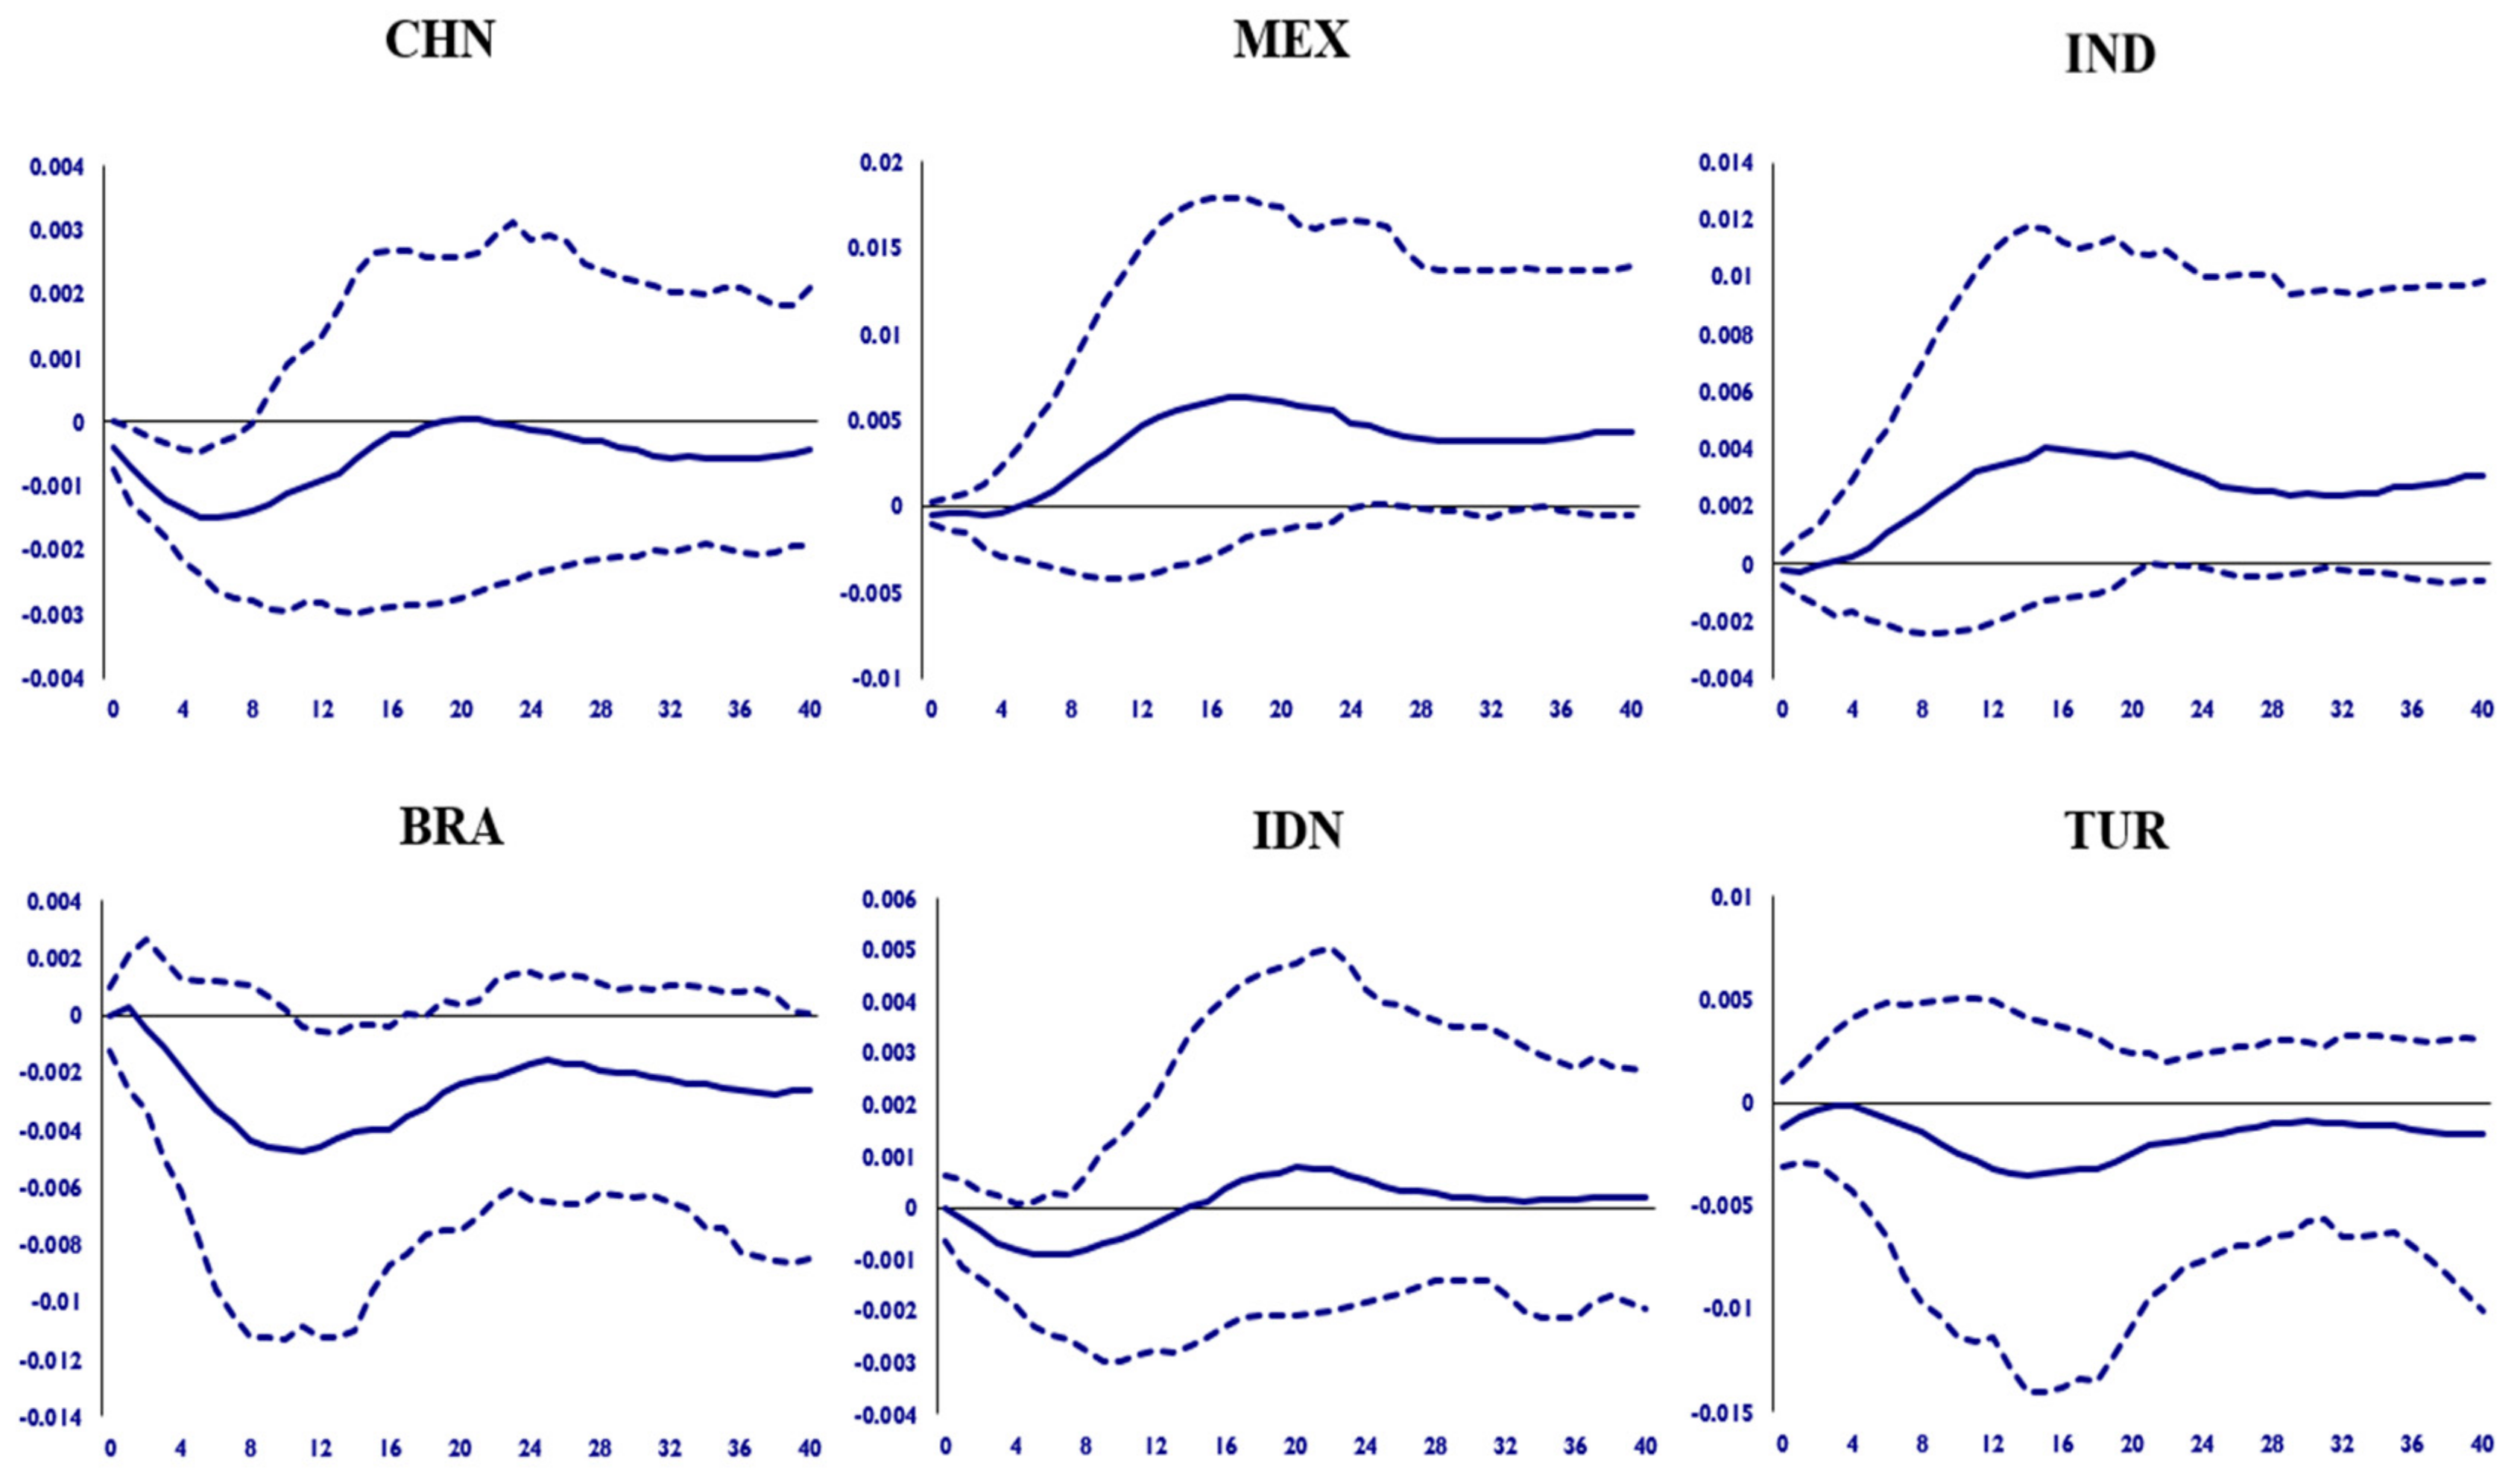
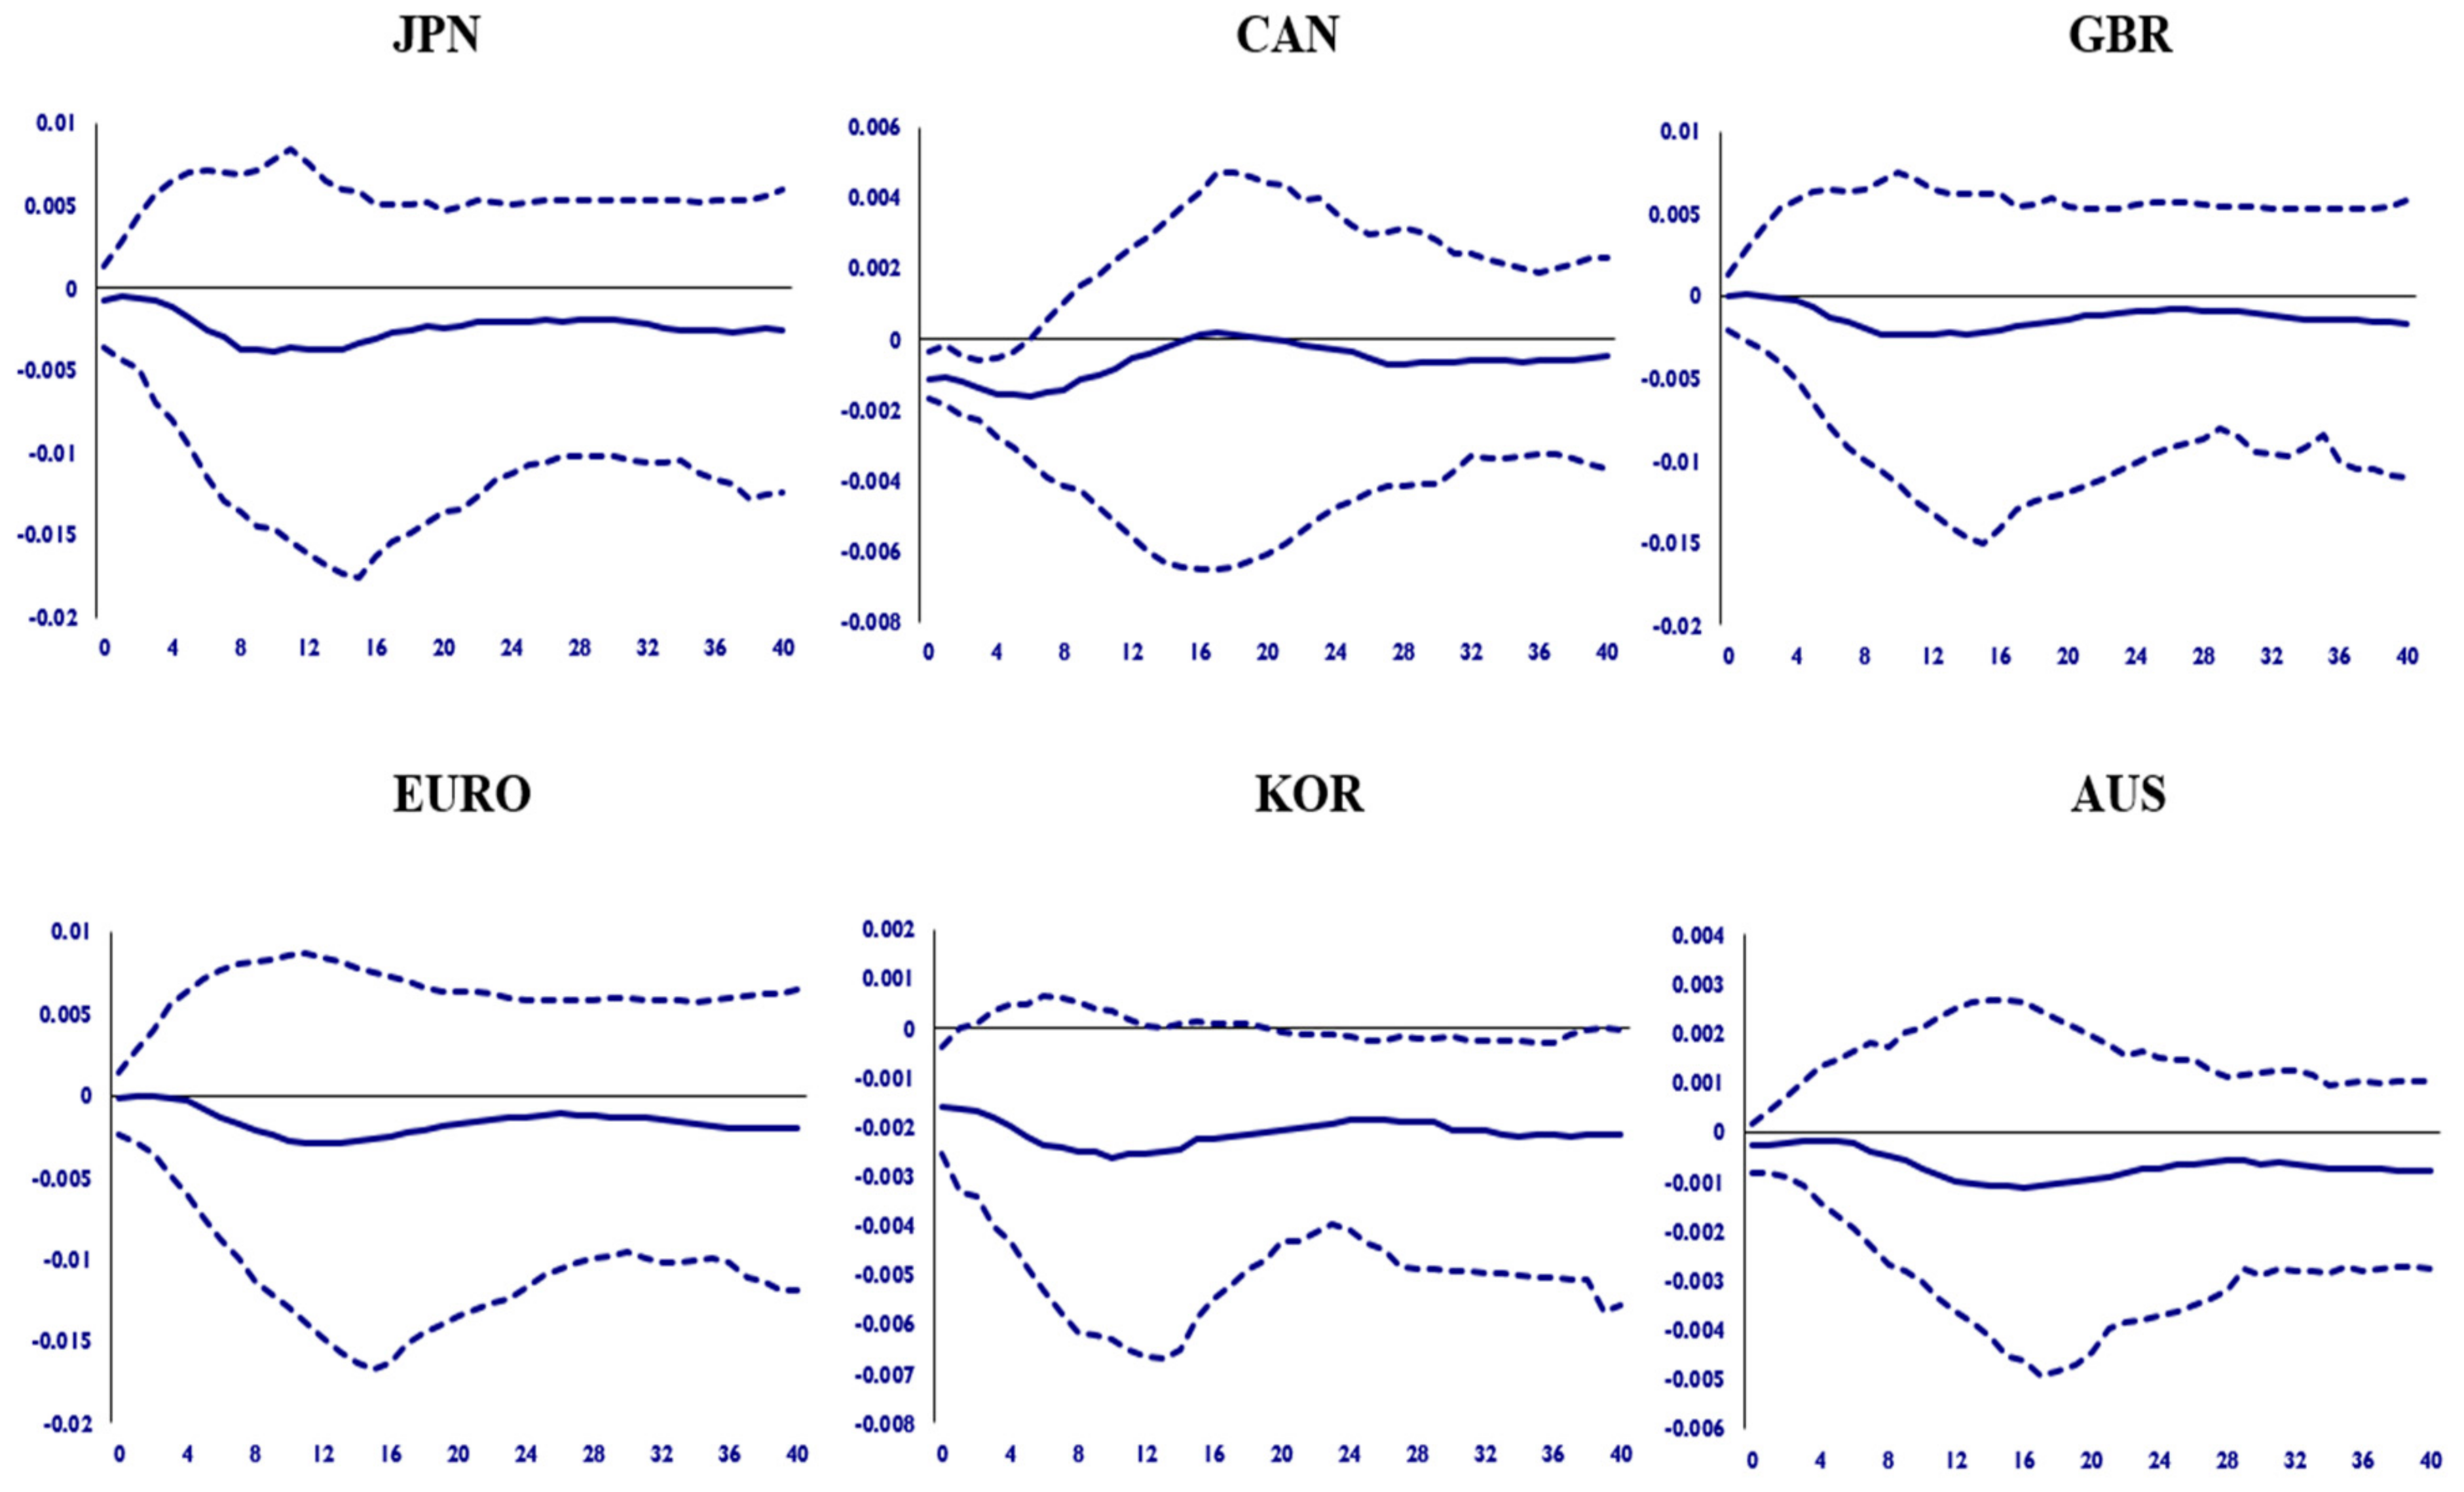
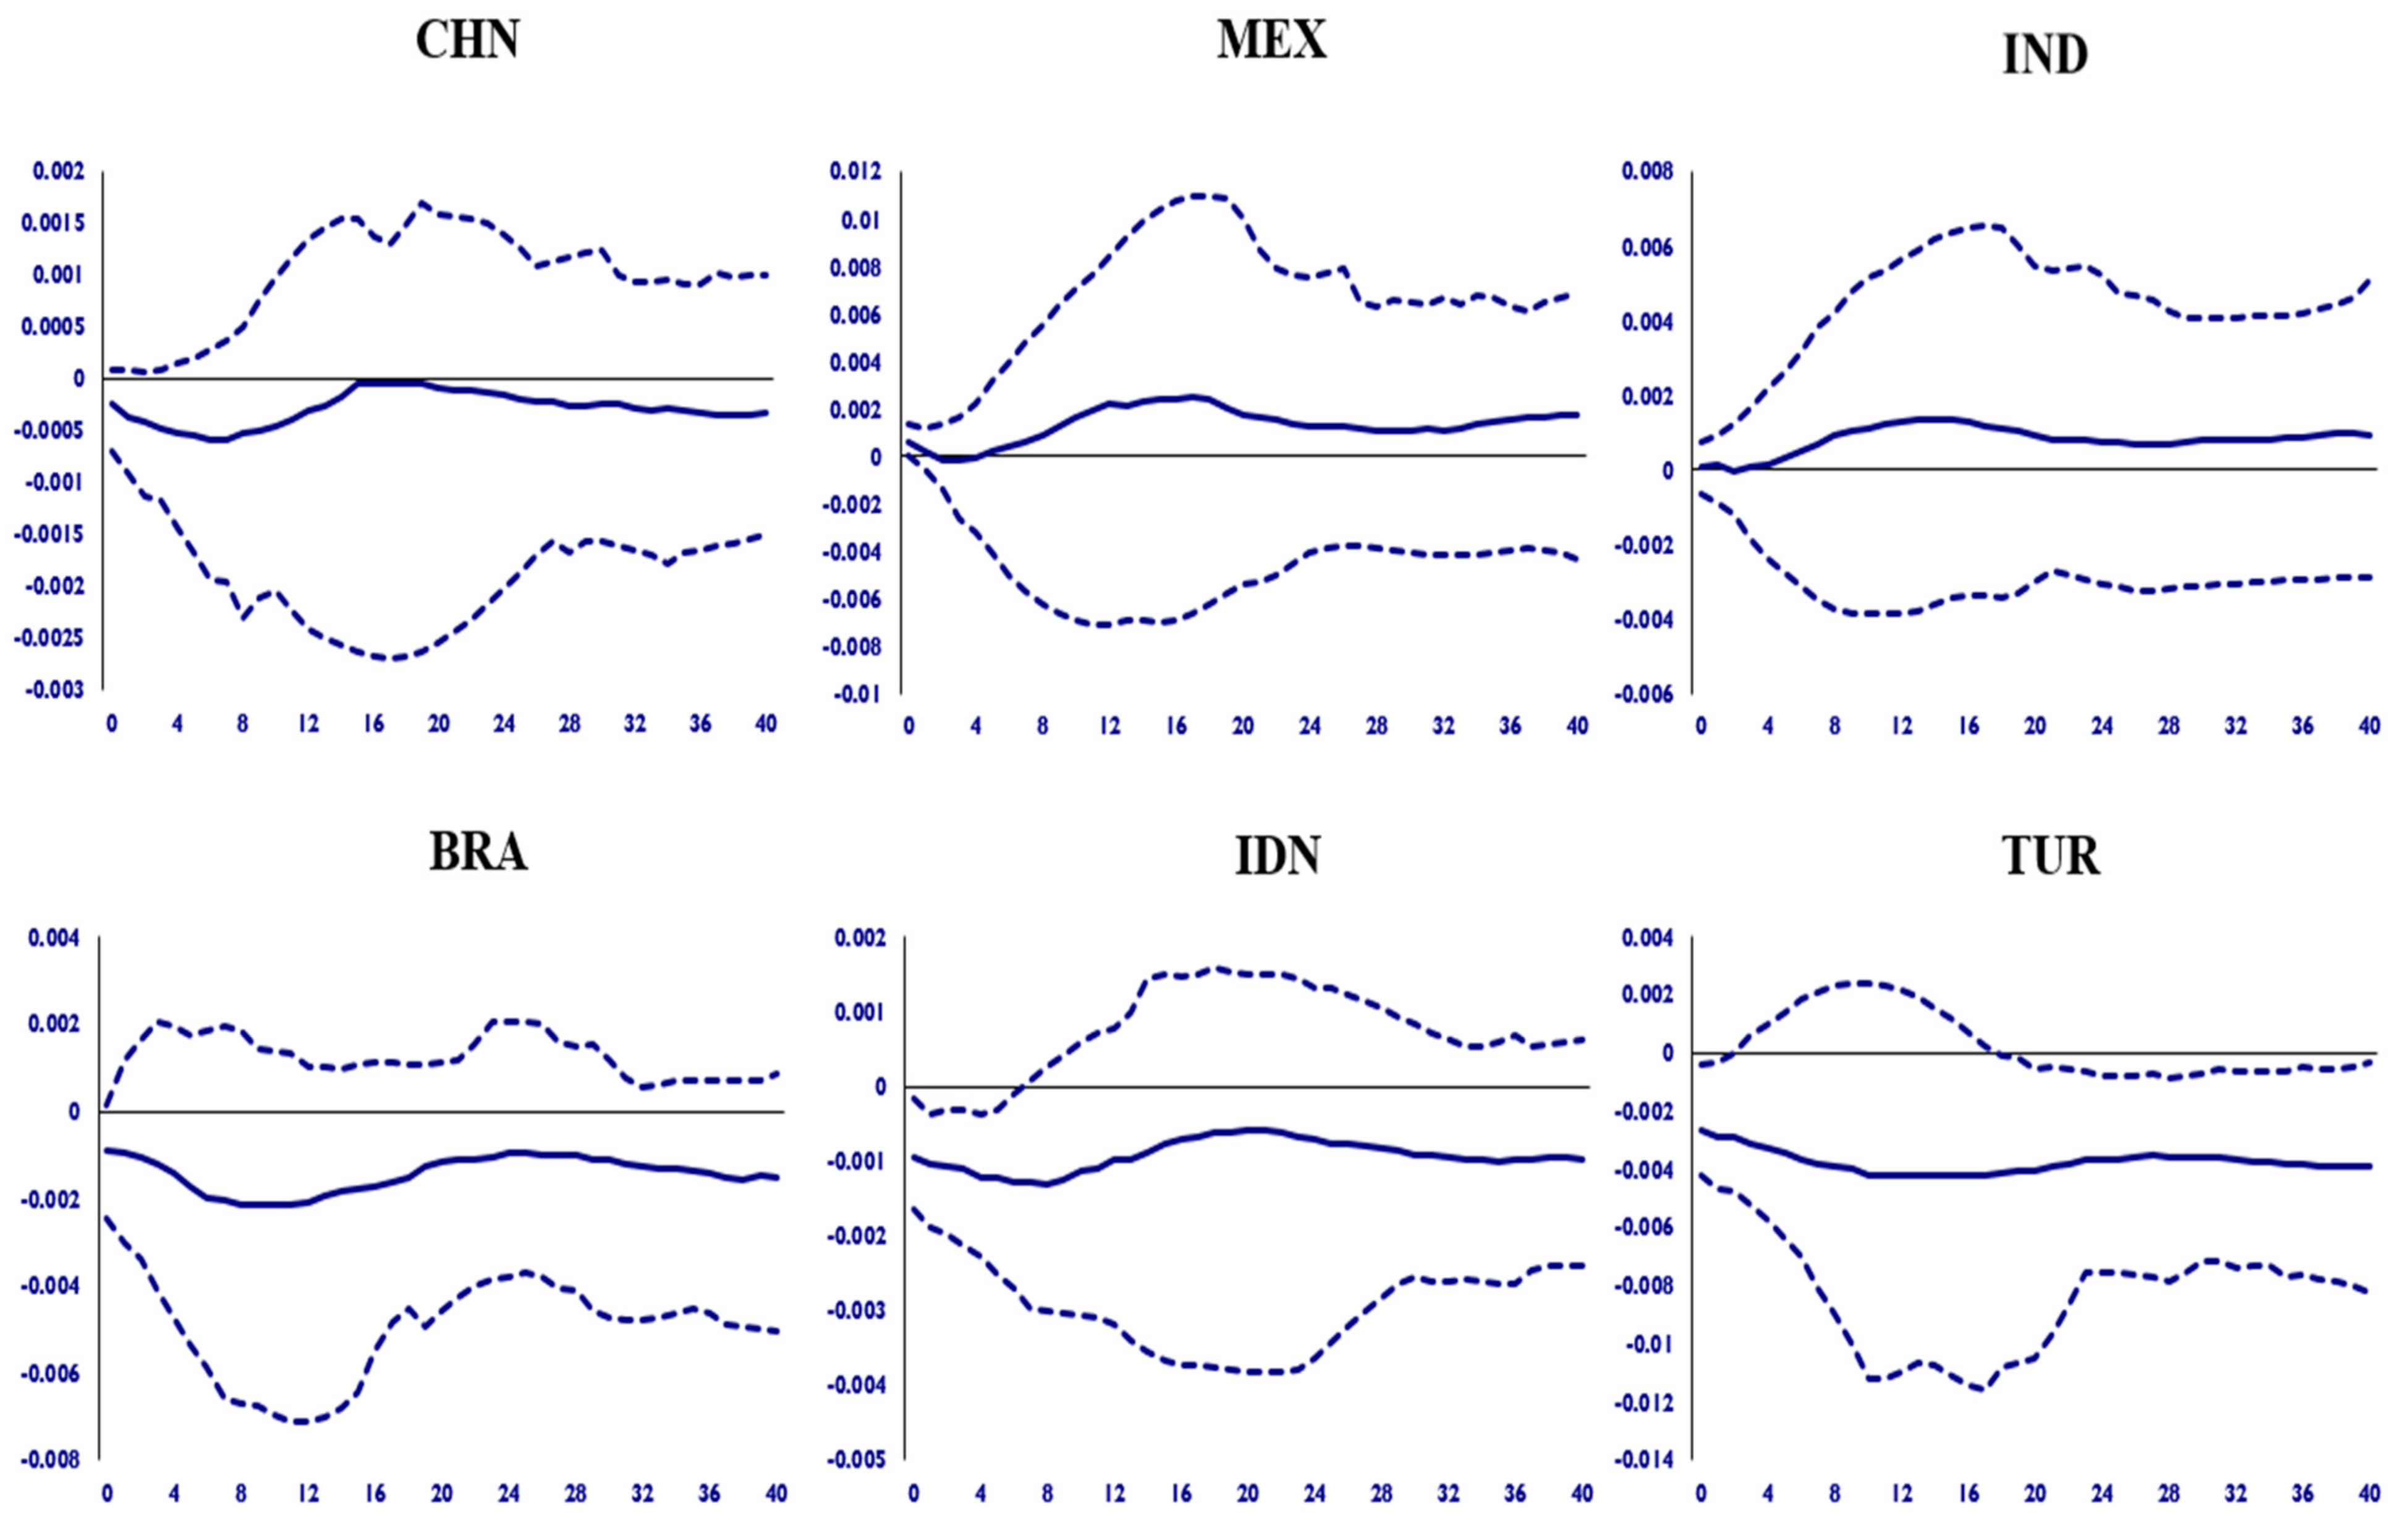
3.2. The Spillover Effect of the Negative Shock of US Energy Consumption
4. Conclusions
Author Contributions
Funding
Institutional Review Board Statement
Informed Consent Statement
Data Availability Statement
Conflicts of Interest
Appendix A

| Symbol | Definition | Source | The Unit of Measurement of Each Variable |
|---|---|---|---|
| y | GDP in purchasing power parity terms | International Monetary Fund (IMF) database | USD 100,000,000 |
| ee | energy efficiency | World Development Indicators (WDI) database | MJ/USD 2011 PPP GDP |
| tro | proportion of total import and export to GDP | World Development Indicators (WDI) database | % |
| enc | primary energy consumption | BP Statistical Review of World | Million tons |
| ins | the proportion of industrial added value to GDP | World Development Indicators (WDI) database | % |
| poil | nominal price of Brent crude oil price in USD | BP Statistical Review of World | USD |
| Country | Abbreviation | Country | Abbreviation |
|---|---|---|---|
| Australia | AU | India | IN |
| Austria | AT | Ireland | IE |
| Belgium | BE | Italy | IT |
| Bulgaria | BG | Japan | JP |
| Brazil | BR | Korea | KR |
| Canada | CA | Lithuania | LT |
| Switzerland | CH | Luxembourg | LU |
| China | CN | Latvia | LV |
| Cyprus | CY | Mexico | MX |
| Czech | CS | Netherlands | NL |
| Germany | DE | Norway | NO |
| Dennmark | DK | Poland | PL |
| Spain | ES | Portugal | PT |
| Estonia | EE | Romania | RO |
| Finland | FI | Russia | RU |
| France | FR | Slovak | SK |
| United Kingdom | GB | Slovenia | SI |
| Greece | GR | Sweden | SE |
| Croatia | HR | Turkey | TR |
| Hungary | HU | United States | US |
| Indonesia | ID |
| Country | y | ee | tro | enc | ins |
|---|---|---|---|---|---|
| AU | 0.020299 | 0.020299 | 0.020299 | 0.020299 | 0.020299 |
| AT | 0.006733 | 0.006733 | 0.006733 | 0.006733 | 0.006733 |
| BE | 0.008221 | 0.008221 | 0.008221 | 0.008221 | 0.008221 |
| BG | 0.000875 | 0.000875 | 0.000875 | 0.000875 | 0.000875 |
| BR | 0.037761 | 0.037761 | 0.037761 | 0.037761 | 0.037761 |
| CA | 0.028282 | 0.028282 | 0.028282 | 0.028282 | 0.028282 |
| CH | 0.010073 | 0.010073 | 0.010073 | 0.010073 | 0.010073 |
| CN | 0.120369 | 0.120369 | 0.120369 | 0.120369 | 0.120369 |
| CY | 0.000412 | 0.000412 | 0.000412 | 0.000412 | 0.000412 |
| CS | 0.003562 | 0.003562 | 0.003562 | 0.003562 | 0.003562 |
| DE | 0.059028 | 0.059028 | 0.059028 | 0.059028 | 0.059028 |
| DK | 0.005532 | 0.005532 | 0.005532 | 0.005532 | 0.005532 |
| ES | 0.023492 | 0.023492 | 0.023492 | 0.023492 | 0.023492 |
| EE | 0.000363 | 0.000363 | 0.000363 | 0.000363 | 0.000363 |
| FI | 0.004197 | 0.004197 | 0.004197 | 0.004197 | 0.004197 |
| FR | 0.045153 | 0.045153 | 0.045153 | 0.045153 | 0.045153 |
| GB | 0.043161 | 0.043161 | 0.043161 | 0.043161 | 0.043161 |
| GR | 0.004537 | 0.004537 | 0.004537 | 0.004537 | 0.004537 |
| HR | 0.001001 | 0.001001 | 0.001001 | 0.001001 | 0.001001 |
| HU | 0.002284 | 0.002284 | 0.002284 | 0.002284 | 0.002284 |
| ID | 0.014191 | 0.014191 | 0.014191 | 0.014191 | 0.014191 |
| IN | 0.031776 | 0.031776 | 0.031776 | 0.031776 | 0.031776 |
| IE | 0.004103 | 0.004103 | 0.004103 | 0.004103 | 0.004103 |
| IT | 0.035051 | 0.035051 | 0.035051 | 0.035051 | 0.035051 |
| JP | 0.096758 | 0.096758 | 0.096758 | 0.096758 | 0.096758 |
| KR | 0.020231 | 0.020231 | 0.020231 | 0.020231 | 0.020231 |
| LT | 0.00069 | 0.00069 | 0.00069 | 0.00069 | 0.00069 |
| LU | 0.000938 | 0.000938 | 0.000938 | 0.000938 | 0.000938 |
| LV | 0.000447 | 0.000447 | 0.000447 | 0.000447 | 0.000447 |
| MX | 0.018848 | 0.018848 | 0.018848 | 0.018848 | 0.018848 |
| NL | 0.014349 | 0.014349 | 0.014349 | 0.014349 | 0.014349 |
| NO | 0.00743 | 0.00743 | 0.00743 | 0.00743 | 0.00743 |
| PL | 0.008502 | 0.008502 | 0.008502 | 0.008502 | 0.008502 |
| PT | 0.003849 | 0.003849 | 0.003849 | 0.003849 | 0.003849 |
| RO | 0.003007 | 0.003007 | 0.003007 | 0.003007 | 0.003007 |
| RU | 0.02689 | 0.02689 | 0.02689 | 0.02689 | 0.02689 |
| SK | 0.00158 | 0.00158 | 0.00158 | 0.00158 | 0.00158 |
| SI | 0.000811 | 0.000811 | 0.000811 | 0.000811 | 0.000811 |
| SE | 0.008578 | 0.008578 | 0.008578 | 0.008578 | 0.008578 |
| TR | 0.015181 | 0.015181 | 0.015181 | 0.015181 | 0.015181 |
| US | 0.261457 | 0.261457 | 0.261457 | 0.261457 | 0.261457 |
| Domestic Variables | y | y | ee | ee | tro | tro | enc | enc | ins | ins |
| Statistic | ADF | WS | ADF | WS | ADF | WS | ADF | WS | ADF | WS |
| critical value | −3.4500 | −3.2400 | −3.4500 | −3.2400 | −3.4500 | −3.2400 | −3.4500 | −3.2400 | −3.4500 | −3.2400 |
| AU | −1.5107 | −1.2549 | −1.8191 | −1.4503 | −1.8652 | −1.4065 | 0.3227 | −0.4620 | −1.9110 | −0.3609 |
| AT | −0.6790 | −1.0600 | −1.7295 | −2.0358 | −2.4456 | −1.7102 | 0.0396 | −0.1766 | −2.2476 | −2.5066 |
| BE | −0.5584 | −1.0556 | −2.2086 | −0.1377 | −2.9678 | −2.2798 | 0.7815 | 0.5822 | −2.1472 | −0.3584 |
| BG | −2.7832 | 0.0926 | −1.5204 | −1.4940 | −1.7196 | −2.0380 | −2.8109 | −1.6896 | −2.5888 | −0.4095 |
| BR | −1.4980 | −1.2991 | −1.2848 | −1.3895 | −1.1762 | −1.4221 | −1.4780 | −1.4302 | −1.7711 | −1.8554 |
| CA | −1.9924 | −1.2416 | −3.1290 | −0.4694 | −2.3659 | −0.7494 | −2.0241 | −1.6002 | −2.0290 | −2.2784 |
| CH | −2.9200 | −0.7042 | −2.3883 | −1.2700 | −2.7827 | −1.4777 | −2.1946 | −1.9150 | −1.5794 | −0.9791 |
| CN | −3.9271 | −3.7522 | −2.3625 | −0.8450 | −1.0111 | −1.1470 | −2.7419 | −2.7256 | −2.3189 | −0.6442 |
| CY | 2.9302 | 0.1610 | −2.7200 | −0.8625 | −1.8340 | −1.9448 | 1.4477 | 0.6937 | −0.5002 | −1.0934 |
| CS | −2.2740 | −1.2755 | −2.2357 | −2.3819 | −2.8803 | −2.9549 | −2.4629 | −0.6704 | −2.3603 | −2.5372 |
| DE | −3.1067 | −2.6397 | −2.5110 | −2.1704 | −2.6312 | −1.8191 | −1.5595 | −1.5915 | −1.0879 | −0.6258 |
| DK | −0.4142 | −0.7074 | −2.3070 | −1.8105 | −2.5516 | −2.3370 | −2.2762 | −0.1560 | −1.1349 | −1.5037 |
| ES | −1.1523 | −1.6286 | −1.0058 | −0.5242 | −1.6884 | −1.5627 | 1.5430 | 0.1102 | 0.6093 | −0.5884 |
| EE | −2.4889 | −2.5700 | −0.2608 | −0.8421 | −1.3910 | −1.7679 | −4.1438 | −0.2219 | −2.2364 | −2.5172 |
| FI | −0.9463 | −0.9646 | −3.0411 | −1.5389 | −2.2110 | −1.1107 | −0.4127 | −0.6750 | −0.3528 | −0.9509 |
| FR | −0.5330 | −1.0840 | −2.6377 | −1.3695 | −1.8274 | −2.1052 | −0.8169 | 0.4724 | −1.6266 | −1.6018 |
| GB | −0.8791 | −1.3686 | −4.5314 | 0.1218 | −1.7522 | −1.9722 | −0.0444 | 0.1870 | 0.3538 | −0.4013 |
| GR | −1.9983 | −2.2965 | −1.1160 | −1.4716 | −2.2780 | −2.3063 | 3.5434 | 0.5424 | −1.1933 | −1.1897 |
| HR | −1.4826 | −1.5736 | −1.8559 | −0.7311 | −2.1410 | −2.3928 | −1.1583 | −1.1059 | −1.3500 | −1.0924 |
| HU | −1.0455 | −1.2328 | −1.7616 | −1.2653 | −1.0343 | −1.4193 | −0.9338 | −0.7008 | −1.4482 | −1.4988 |
| ID | −1.3852 | −1.6345 | −0.3339 | −0.9185 | −1.6253 | −1.6926 | −2.0765 | −0.6407 | −1.5259 | −1.6901 |
| IN | −2.7306 | −0.7552 | −0.9790 | −1.0468 | −0.6617 | −1.1593 | −0.6244 | −0.9916 | −0.1491 | −0.5395 |
| IE | −1.3622 | −1.8359 | −1.3305 | −1.7125 | −1.7970 | −1.6548 | 0.7557 | −0.1393 | −1.0701 | −1.1401 |
| IT | 0.5635 | −0.3343 | 0.5923 | −0.0921 | −2.1011 | −2.1951 | 1.8946 | 0.4884 | −2.3519 | −2.3596 |
| JP | −1.9979 | −1.7672 | −0.5206 | −0.2074 | −2.5774 | −1.3275 | −0.7908 | 0.6570 | −2.2454 | −0.8355 |
| KR | −1.3581 | 0.2484 | −2.8651 | −1.7440 | −2.2444 | −1.7189 | −3.6067 | 0.8546 | −1.3299 | −1.7148 |
| LT | −2.4062 | −2.1506 | −2.3731 | −1.2898 | −1.8517 | −1.5263 | −3.5694 | −2.1988 | −2.0392 | −2.3381 |
| LU | −0.9294 | −1.1663 | −1.6369 | −1.5073 | −1.7563 | −1.8219 | −1.1643 | −1.4375 | −1.7561 | −0.8821 |
| LV | −2.6529 | −2.6445 | −1.3718 | −1.4774 | −1.3322 | −1.4020 | −4.4942 | −0.0499 | −1.2926 | −1.3745 |
| MX | −1.7574 | −1.7809 | −1.4577 | −1.4584 | −3.8556 | −4.0204 | −1.2858 | −1.6183 | −2.1445 | −0.6492 |
| NL | −0.1737 | −0.7973 | −2.2244 | −2.2661 | −1.5443 | −1.7469 | 1.2016 | 0.3106 | −2.2290 | −1.7118 |
| NO | −0.9976 | −0.5302 | −1.5636 | −1.7168 | −2.3160 | −2.4098 | −2.3728 | −2.5536 | −2.1387 | −2.2834 |
| PL | −2.6526 | −2.5549 | −0.9160 | −1.3203 | −2.5050 | −2.6632 | −1.7495 | −1.0140 | −1.1547 | −1.5815 |
| PT | 0.3293 | −0.4775 | −0.9826 | −0.3869 | −2.2121 | −1.7105 | −0.3215 | −0.1253 | −2.2423 | −0.3883 |
| RO | −2.6282 | −0.5609 | −2.6125 | −2.6278 | −2.5766 | −1.3555 | −2.8437 | −0.8427 | −1.6186 | −0.7887 |
| RU | −3.8236 | −0.4930 | −2.8734 | −0.3960 | −2.2420 | −2.0743 | −2.5317 | −0.6829 | −1.9168 | −1.4249 |
| SK | −2.4120 | −1.9915 | −2.0105 | −1.7024 | -5.6220 | −2.7736 | −2.1535 | −0.5376 | −0.7496 | −1.2466 |
| SI | −1.4176 | −1.1512 | −2.5235 | −0.3896 | −3.8527 | −2.0900 | −0.2962 | −0.9350 | −2.8364 | −2.8527 |
| SE | −2.0781 | −1.3686 | −2.3795 | −0.7914 | −3.8941 | −0.3977 | −2.6379 | −2.7758 | −1.4946 | −1.8365 |
| TR | −1.3757 | −1.5700 | −1.2827 | −1.6859 | −1.1006 | −1.3732 | −1.5680 | −1.9091 | −0.7828 | −1.2722 |
| US | −0.7125 | −1.2446 | −3.8330 | −0.7147 | −2.3717 | −2.0958 | −0.7762 | −0.5058 | −2.3701 | −2.1356 |
| Foreign Variables | ys | ys | ees | ees | tros | tros | encs | encs | inss | inss |
| Statistic | ADF | WS | ADF | WS | ADF | WS | ADF | WS | ADF | WS |
| critical value | −3.4500 | −3.2400 | −3.4500 | −3.2400 | −3.4500 | −3.2400 | −3.4500 | −3.2400 | −3.4500 | −3.2400 |
| AU | −1.1286 | −1.4215 | −2.4172 | −0.9579 | −2.0084 | −2.2580 | 0.4851 | −0.3152 | −1.3644 | −1.6893 |
| AT | −1.6499 | −0.9647 | −2.5396 | −0.8259 | −3.3835 | −2.9153 | −1.4586 | −0.4339 | −2.0881 | −1.8194 |
| BE | −1.2938 | −1.1017 | −2.4188 | −1.5074 | −2.6472 | −2.8705 | −0.9140 | −0.4500 | −2.1493 | −1.8234 |
| BG | −1.1811 | −1.0741 | −2.2474 | −0.9773 | −2.0902 | −2.3748 | −0.4321 | −0.6213 | −0.9368 | −1.4088 |
| BR | −0.8934 | −1.1683 | −2.5914 | −0.7793 | −2.1840 | −2.4570 | 0.7552 | −0.1927 | −1.4962 | −1.8117 |
| CA | −0.8455 | −1.2182 | −2.7366 | −1.0653 | −2.1262 | −2.1945 | 0.2563 | −0.5132 | −2.1343 | −2.2992 |
| CH | −1.3735 | −1.3379 | −2.2718 | −1.2439 | −2.6985 | −2.9531 | −2.2646 | −0.4027 | −2.3948 | −2.6784 |
| CN | −1.1912 | −1.2734 | −2.8958 | −0.1823 | −2.2760 | −2.5518 | 0.7630 | 0.0411 | −1.9741 | −2.1157 |
| CY | −1.8403 | −2.0846 | −1.6537 | −1.0830 | −2.4254 | −2.5231 | 0.5139 | −0.0684 | −1.0340 | −1.4099 |
| CS | −1.7235 | −1.0989 | −2.7141 | −0.8125 | −3.3561 | −2.5065 | −1.2053 | −0.2047 | −1.9639 | −1.6647 |
| DE | −1.3839 | −1.1156 | −2.6466 | −1.0283 | −2.6244 | −2.7579 | −0.6602 | −0.3986 | −1.9228 | −2.1149 |
| DK | −1.1702 | −1.1787 | −2.3791 | −0.9439 | −2.7169 | −2.6571 | −2.1700 | −0.4514 | −1.3894 | −1.7118 |
| ES | −0.7476 | −1.0445 | −2.4611 | −0.6461 | −2.3950 | −2.6013 | 0.5814 | −0.3095 | −2.1517 | −2.4537 |
| EE | −2.0703 | −1.8765 | −2.0689 | −1.3748 | −1.9839 | −2.1225 | −4.0179 | −0.7990 | −1.9266 | −2.1140 |
| FI | −2.3123 | −2.3425 | −0.9950 | −1.1449 | −2.1544 | −1.8571 | −4.2349 | −0.3107 | −2.1359 | −2.4312 |
| FR | −1.0310 | −1.1701 | −2.5806 | −0.9675 | −2.4440 | −2.6958 | 0.1398 | −0.2800 | −1.6381 | −2.0050 |
| GB | −0.7992 | −1.2056 | −2.4628 | −1.1547 | −2.2196 | −2.4306 | 0.6423 | −0.1751 | −1.2097 | −1.6252 |
| GR | −1.0055 | −0.5963 | −2.4716 | −0.3260 | −2.4527 | −2.6222 | 0.4824 | −0.4051 | −1.9343 | −0.9858 |
| HR | −1.4265 | −1.0225 | −2.5602 | −0.4685 | −4.3366 | −2.5359 | 0.0730 | −0.5143 | −2.1138 | −2.4047 |
| HU | −1.6607 | −0.9601 | −2.4489 | −0.9684 | −3.2854 | −2.9088 | −1.0980 | −0.4162 | −1.7675 | −1.4587 |
| ID | −1.1395 | −1.1642 | −2.6726 | −0.9241 | −2.0913 | −2.3805 | 0.2374 | −0.4386 | −1.7559 | −1.9473 |
| IN | −1.2881 | −1.3189 | −2.6011 | −0.5080 | −2.1437 | −2.4001 | 0.2880 | −0.4316 | −1.8876 | −2.1559 |
| IE | −0.9959 | −1.1781 | −2.9698 | −0.7296 | −2.5216 | −2.7633 | 0.6463 | −0.1714 | −1.9925 | −2.2734 |
| IT | −1.3009 | −1.0466 | −2.5122 | −0.7291 | −2.6365 | −2.7785 | −0.1780 | −0.3169 | −1.6941 | −1.7593 |
| JP | −1.5724 | −1.4174 | −2.5700 | −0.7735 | −1.8261 | −1.7495 | −0.0130 | −0.6329 | −1.7378 | −2.0000 |
| KR | −1.5396 | −1.4132 | −2.3475 | −0.9142 | −1.9392 | −2.2082 | −0.0744 | −0.6446 | −1.4755 | −1.8551 |
| LT | −2.4705 | −2.3405 | −1.2928 | −1.2374 | −1.6840 | −1.9654 | −4.6822 | 0.0441 | −2.2616 | −2.5174 |
| LU | −1.0403 | −1.1036 | −2.7031 | −0.5273 | −2.5858 | −2.8325 | 0.7876 | −0.1292 | −2.1800 | −2.3632 |
| LV | −2.1742 | −1.8904 | −1.6890 | −1.2008 | −1.6091 | −1.8505 | −4.6283 | −1.8803 | −1.9801 | −2.2770 |
| MX | −0.6151 | −1.0923 | −2.8535 | −0.5511 | −2.0936 | −1.9263 | 0.3298 | −0.2883 | −1.7843 | −2.0807 |
| NL | −1.2130 | −1.1970 | −2.6845 | −0.9817 | −2.4100 | −2.6775 | −0.2783 | −0.4053 | −1.7695 | −2.0861 |
| NO | −1.3668 | −1.3249 | −2.1435 | −0.9881 | −2.7923 | −2.1474 | −2.8708 | −1.0031 | −1.6619 | −2.0144 |
| PL | −1.7183 | −1.1139 | −2.6487 | −0.8009 | −3.0913 | −3.0383 | −1.9164 | −0.7081 | −1.8230 | −1.9246 |
| PT | −0.6929 | −1.0481 | −2.4900 | 0.1314 | −1.9225 | −2.0571 | 1.0393 | −0.0900 | −0.2092 | −0.8971 |
| RO | −1.5394 | −0.7822 | −2.2989 | −0.4663 | −2.4657 | −2.4499 | −0.7221 | −0.5890 | −2.3537 | −1.2358 |
| RU | −0.8727 | −1.1022 | −2.6669 | −0.8004 | −2.3434 | −2.5826 | −1.5581 | −0.7874 | −1.0874 | −1.4988 |
| SK | −1.6478 | −0.8348 | −2.5356 | −1.3525 | −2.7639 | −2.9886 | −1.5749 | −0.4967 | −2.1972 | −2.3656 |
| SI | −1.4783 | −1.3974 | −2.0867 | −0.8077 | −2.0615 | −2.3533 | −0.6029 | −0.5035 | −1.1925 | −1.6086 |
| SE | −1.2354 | −1.3436 | −1.9159 | −1.2750 | −2.5776 | −2.7894 | −2.8704 | −0.8282 | −1.2265 | −1.6422 |
| TR | −1.0435 | −1.1636 | −2.2112 | −0.8677 | −2.4822 | −2.7407 | 0.6414 | −0.2269 | −1.1370 | −1.2702 |
| US | −1.2098 | −1.3408 | −2.6864 | −0.9748 | −1.5528 | −1.7958 | 0.2022 | −0.5340 | −1.7983 | −1.9286 |
| Country | F Test | Fcrit_0.05 | ys | ees | tros | encs | inss | poil |
|---|---|---|---|---|---|---|---|---|
| FR | F(1.79) | 3.961892 | 0.009678 | 0.003936 | 0.231023 | 0.06085 | 0.084665 | 5.753764 |
| MX | F(1.79) | 3.961892 | 0.195472 | 0.880341 | 1.078184 | 0.008847 | 0.696638 | 9.806077 |
| SK | F(2.78) | 3.113792 | 0.947624 | 0.15655 | 1.225315 | 0.339064 | 1.360141 | 6.579848 |
| SE | F(1.79) | 3.961892 | 1.074382 | 0.005338 | 0.724602 | 0.701016 | 0.799591 | 0.981701 |
| TR | F(1.79) | 3.961892 | 0.054658 | 0.000559 | 0.223045 | 0.103181 | 0.552213 | 5.263006 |
| y | ee | tro | enc | ins | |||||||||||
|---|---|---|---|---|---|---|---|---|---|---|---|---|---|---|---|
| Levels | First Differences | VECMX* Residuals | Levels | First Differences | VECMX* Residuals | Levels | First Differences | VECMX* Residuals | Levels | First Differences | VECMX* Residuals | Levels | First Differences | VECMX* Residuals | |
| AU | 0.2345 | 0.1107 | −0.0656 | 0.0196 | −0.0198 | −0.0002 | −0.2307 | −0.3558 | 0.0259 | 0.0374 | −0.0445 | 0.0054 | −0.0973 | −0.1075 | 0.0239 |
| AT | 0.5353 | 0.5852 | 0.0632 | 0.2971 | 0.3162 | −0.0095 | 0.5535 | 0.6109 | 0.1499 | 0.2038 | 0.2308 | −0.0367 | 0.1568 | 0.0753 | 0.0108 |
| BE | 0.5223 | 0.5334 | 0.0881 | 0.2385 | 0.2193 | −0.0215 | 0.5739 | 0.6235 | 0.1885 | 0.3229 | 0.3528 | 0.006 | 0.1977 | 0.1496 | −0.0217 |
| BG | 0.1421 | 0.0746 | −0.0478 | −0.0155 | 0.0057 | −0.0423 | 0.1178 | 0.0931 | −0.1470 | 0.1878 | 0.196 | −0.0550 | −0.0765 | −0.0758 | −0.0124 |
| BR | 0.3618 | 0.4916 | −0.0532 | 0.121 | 0.1737 | −0.0406 | 0.2011 | 0.2881 | −0.1453 | 0.2455 | 0.3302 | 0.0114 | −0.0172 | −0.0075 | −0.0863 |
| CA | 0.5341 | 0.525 | 0.0311 | 0.1636 | 0.0624 | −0.0301 | 0.4182 | 0.5632 | 0.0799 | 0.1358 | 0.1292 | 0.0277 | 0.1882 | 0.1519 | −0.0039 |
| CH | 0.5101 | 0.5949 | −0.0083 | 0.1437 | 0.1117 | −0.0388 | 0.4386 | 0.4685 | 0.0499 | −0.0780 | −0.0263 | −0.0549 | 0.0472 | 0.048 | −0.0045 |
| CN | 0.1305 | 0.2736 | −0.0310 | 0.0031 | 0.1489 | 0.0188 | 0.3362 | 0.4923 | 0.0516 | 0.0859 | 0.0555 | −0.0247 | 0.1128 | 0.0652 | 0.0399 |
| CY | 0.3219 | 0.3255 | 0.0684 | 0.0205 | 0.0042 | −0.0417 | 0.2553 | 0.3115 | −0.0247 | 0.0285 | −0.0191 | −0.0316 | 0.0565 | −0.0257 | −0.0651 |
| CS | 0.426 | 0.4435 | −0.0180 | 0.1685 | 0.1453 | 0.0015 | 0.3823 | 0.4192 | 0.0831 | 0.2573 | 0.2837 | −0.0303 | 0.1224 | 0.0666 | −0.0065 |
| DE | 0.4602 | 0.5922 | 0.0714 | 0.2472 | 0.2986 | −0.0070 | 0.5231 | 0.6022 | 0.154 | 0.2934 | 0.3407 | −0.0007 | 0.1441 | 0.1495 | −0.0486 |
| DK | 0.5289 | 0.555 | 0.0942 | 0.2581 | 0.2543 | 0.0077 | 0.5244 | 0.5854 | 0.1188 | 0.1593 | 0.1813 | −0.0145 | 0.2264 | 0.1829 | 0.0089 |
| ES | 0.5047 | 0.566 | 0.0833 | −0.0684 | −0.1121 | −0.0300 | 0.529 | 0.5927 | 0.1346 | 0.2464 | 0.2139 | −0.0391 | 0.154 | 0.0835 | 0.0523 |
| EE | 0.499 | 0.5099 | −0.0027 | 0.1896 | 0.1695 | 0.0012 | 0.369 | 0.442 | 0.0122 | 0.2208 | 0.2985 | 0.0109 | 0.185 | 0.1317 | 0.0562 |
| FI | 0.5848 | 0.6293 | 0.0456 | 0.1853 | 0.1463 | −0.0141 | 0.4893 | 0.5838 | 0.0799 | 0.2348 | 0.2711 | −0.0379 | 0.2058 | 0.1556 | 0.0069 |
| FR | 0.5422 | 0.5733 | 0.0868 | 0.2977 | 0.2962 | 0.0073 | 0.564 | 0.6168 | 0.18 | 0.3142 | 0.3835 | 0.0558 | 0.0555 | 0.095 | 0.0278 |
| GB | 0.5339 | 0.545 | 0.0035 | 0.304 | 0.2951 | −0.0074 | 0.321 | 0.3769 | −0.0084 | 0.2976 | 0.3322 | −0.0061 | 0.0442 | 0.0347 | −0.0778 |
| GR | 0.3007 | 0.2407 | 0.0216 | −0.0383 | −0.0805 | −0.0436 | 0.5108 | 0.5956 | 0.1372 | 0.0902 | −0.0536 | −0.0094 | −0.0315 | −0.0640 | 0.0896 |
| HR | 0.3664 | 0.354 | −0.1041 | 0.1266 | 0.0464 | −0.0386 | 0.3364 | 0.3656 | −0.0048 | 0.1438 | 0.178 | 0.0388 | 0.0824 | 0.0689 | 0.065 |
| HU | 0.4757 | 0.4821 | 0.0021 | 0.2475 | 0.2339 | −0.0207 | 0.3512 | 0.3729 | 0.1336 | 0.2803 | 0.2702 | 0.0029 | 0.1127 | 0.0959 | −0.0184 |
| ID | −0.0074 | 0.1032 | −0.0376 | 0.07 | 0.1073 | 0.0196 | 0.2636 | 0.2942 | 0.0065 | 0.0044 | −0.0238 | −0.0114 | 0.0185 | −0.0380 | 0.0224 |
| IN | 0.0202 | −0.1224 | 0.0442 | −0.0901 | −0.2039 | −0.0085 | 0.368 | 0.439 | 0.0197 | −0.1363 | −0.1823 | −0.0348 | 0.1118 | 0.09 | 0.0025 |
| IE | 0.4468 | 0.3889 | 0.0515 | 0.1911 | 0.203 | −0.0564 | 0.117 | 0.179 | 0.0527 | 0.2685 | 0.3273 | −0.0404 | −0.0172 | −0.0632 | 0.0413 |
| IT | 0.5426 | 0.5941 | 0.089 | 0.177 | 0.1806 | −0.0031 | 0.5071 | 0.5566 | 0.1574 | 0.3254 | 0.3453 | 0.0147 | 0.223 | 0.1779 | −0.0229 |
| JP | 0.4282 | 0.5282 | −0.0094 | 0.0745 | 0.026 | −0.0211 | 0.5024 | 0.5888 | −0.0510 | 0.3362 | 0.3556 | 0.0061 | 0.0855 | 0.0429 | −0.1076 |
| KR | 0.2037 | 0.2443 | 0.0228 | 0.079 | 0.0146 | −0.0168 | 0.3768 | 0.4563 | 0.0573 | 0.0512 | 0.028 | 0.012 | 0.0003 | 0.0456 | 0.0325 |
| LT | 0.3663 | 0.4002 | −0.0506 | 0.0328 | −0.0456 | −0.0422 | 0.4355 | 0.5394 | 0.1026 | −0.0253 | −0.1052 | −0.0487 | 0.2178 | 0.1854 | 0.0699 |
| LU | 0.4271 | 0.465 | −0.0267 | 0.1461 | 0.1572 | −0.0311 | 0.5098 | 0.5765 | 0.0734 | 0.136 | 0.182 | −0.0287 | 0.1239 | 0.0718 | −0.0108 |
| LV | 0.3747 | 0.3322 | −0.0725 | 0.2915 | 0.2696 | −0.0072 | 0.2369 | 0.25 | −0.0070 | 0.1821 | 0.2413 | −0.0205 | 0.1397 | 0.1262 | 0.0594 |
| MX | 0.3309 | 0.3907 | −0.0208 | −0.0033 | −0.0304 | −0.0268 | 0.1686 | 0.2061 | 0.0053 | 0.085 | 0.0587 | −0.0179 | 0.1194 | 0.0869 | 0.084 |
| NL | 0.5183 | 0.5803 | 0.0354 | 0.308 | 0.292 | 0.0151 | 0.1845 | 0.2231 | 0.0891 | 0.2884 | 0.3117 | 0.0255 | 0.1491 | 0.1188 | 0.0633 |
| NO | 0.3913 | 0.4293 | −0.0118 | 0.199 | 0.2622 | 0 | 0.5476 | 0.6009 | 0.1214 | −0.0264 | −0.0340 | −0.0225 | 0.1659 | 0.1451 | 0.0058 |
| PL | 0.2895 | 0.2458 | −0.0376 | 0.2283 | 0.2481 | 0.0147 | 0.504 | 0.5416 | 0.0854 | 0.2362 | 0.2785 | 0.042 | −0.0004 | 0.0117 | 0.0594 |
| PT | 0.4059 | 0.5067 | 0.0588 | −0.1107 | −0.1963 | −0.0184 | 0.2363 | 0.3047 | 0.0293 | 0.1056 | 0.1191 | 0.0476 | 0.0631 | −0.0090 | −0.0707 |
| RO | 0.255 | 0.2014 | −0.0579 | 0.0935 | 0.0665 | −0.0335 | 0.5334 | 0.6074 | 0.1474 | 0.2052 | 0.2005 | −0.0325 | 0.0231 | 0.0054 | −0.0176 |
| RU | 0.2808 | 0.3345 | −0.0145 | 0.2034 | 0.1548 | −0.0056 | 0.1359 | 0.1643 | −0.1894 | 0.1399 | 0.3109 | 0.0141 | 0.1133 | 0.027 | 0.0037 |
| SK | 0.4761 | 0.5032 | 0.0148 | 0.1557 | 0.1322 | −0.0083 | 0.0561 | 0.1098 | −0.1054 | 0.2625 | 0.3165 | 0.0267 | −0.0793 | −0.0118 | 0.0098 |
| SI | 0.5144 | 0.5333 | 0.0381 | 0.2467 | 0.1897 | −0.0034 | 0.2629 | 0.3948 | −0.1174 | 0.2401 | 0.256 | −0.0424 | 0.0676 | −0.0187 | −0.0252 |
| SE | 0.547 | 0.5925 | 0.1041 | 0.2285 | 0.2025 | −0.0199 | 0.3399 | 0.374 | 0.0474 | 0.1576 | 0.1838 | −0.0216 | 0.1009 | −0.0430 | 0.0041 |
| TR | 0.2285 | 0.2624 | −0.0943 | 0.0216 | 0.0181 | −0.0356 | 0.4216 | 0.5003 | 0.1504 | 0.039 | −0.0042 | −0.0431 | 0.0735 | −0.0294 | −0.0174 |
| US | 0.4893 | 0.5392 | −0.0464 | 0.0311 | −0.0511 | 0.019 | 0.2192 | 0.2176 | −0.0562 | 0.275 | 0.29 | 0.0478 | 0.1268 | −0.0162 | −0.0303 |
References
- Heymann, D.L.; Shindo, N. COVID-19: What is next for public health? Lancet 2020, 395, 542–545. [Google Scholar] [CrossRef]
- Pfefferbaum, B.; North, C.S. Mental health and the Covid-19 pandemic. N. Engl. J. Med. 2020, 383, 510–512. [Google Scholar] [CrossRef] [PubMed]
- Graff, M.; Carley, S. COVID-19 assistance needs to target energy insecurity. Nat. Energy 2020, 5, 352–354. [Google Scholar] [CrossRef]
- Fernandes, N. Economic effects of coronavirus outbreak (COVID-19) on the world economy. IESE Bus. Sch. 2020. [Google Scholar] [CrossRef]
- Wang, Q.; Su, M. A preliminary assessment of the impact of COVID-19 on environment–A case study of China. Sci. Total Environ. 2020, 728, 138915. [Google Scholar] [CrossRef] [PubMed]
- CDC. COVID Data Tracker. Available online: https://covid.cdc.gov/covid-data-tracker/#datatracker-home (accessed on 30 April 2021).
- EIA. Short-Term Energy Outlook. Available online: https://www.eia.gov/outlooks/steo/report/ (accessed on 1 August 2020).
- Ozili, P.K.; Arun, T. Spillover of COVID-19: Impact on the Global Economy. SSRN 2020. [Google Scholar] [CrossRef]
- Goodell, J.W. COVID-19 and finance: Agendas for future research. Financ. Res. Lett. 2020, 35, 101512. [Google Scholar] [CrossRef]
- Ozturk, I. A literature survey on energy–growth nexus. Energy Policy 2010, 38, 340–349. [Google Scholar] [CrossRef]
- Shahbaz, M.; Hoang, T.H.V.; Mahalik, M.K.; Roubaud, D. Energy consumption, financial development and economic growth in India: New evidence from a nonlinear and asymmetric analysis. Energy Econ. 2017, 63, 199–212. [Google Scholar] [CrossRef]
- Apergis, N.; Payne, J.E. Energy consumption and economic growth in Central America: Evidence from a panel cointegration and error correction model. Energy Econ. 2009, 31, 211–216. [Google Scholar] [CrossRef]
- Zhang, X.-P.; Cheng, X.-M. Energy consumption, carbon emissions, and economic growth in China. Ecol. Econ. 2009, 68, 2706–2712. [Google Scholar] [CrossRef]
- Ozturk, I.; Acaravci, A. CO2 emissions, energy consumption and economic growth in Turkey. Renew. Sustain. Energy Rev. 2010, 14, 3220–3225. [Google Scholar] [CrossRef]
- Odugbesan, J.A.; Rjoub, H. Relationship among economic growth, energy consumption, CO2 emission, and urbanization: Evidence from MINT countries. SAGE Open 2020, 10. [Google Scholar] [CrossRef]
- Kahouli, B. The short and long run causality relationship among economic growth, energy consumption and financial development: Evidence from South Mediterranean Countries (SMCs). Energy Econ. 2017, 68, 19–30. [Google Scholar] [CrossRef]
- Belloumi, M. Energy consumption and GDP in Tunisia: Cointegration and causality analysis. Energy Policy 2009, 37, 2745–2753. [Google Scholar] [CrossRef]
- Chen, P.-Y.; Chen, S.-T.; Hsu, C.-S.; Chen, C.-C. Modeling the global relationships among economic growth, energy consumption and CO2 emissions. Renew. Sustain. Energy Rev. 2016, 65, 420–431. [Google Scholar] [CrossRef]
- Belke, A.; Dobnik, F.; Dreger, C. Energy consumption and economic growth: New insights into the cointegration relationship. Energy Econ. 2011, 33, 782–789. [Google Scholar] [CrossRef]
- Esseghir, A.; Haouaoui Khouni, L. Economic growth, energy consumption and sustainable development: The case of the Union for the Mediterranean countries. Energy 2014, 71, 218–225. [Google Scholar] [CrossRef]
- Saboori, B.; Sapri, M.; bin Baba, M. Economic growth, energy consumption and CO2 emissions in OECD (Organization for Economic Co-operation and Development)’s transport sector: A fully modified bi-directional relationship approach. Energy 2014, 66, 150–161. [Google Scholar] [CrossRef]
- Salahuddin, M.; Gow, J. Effects of energy consumption and economic growth on environmental quality: Evidence from Qatar. Environ. Sci. Pollut. Res. 2019, 26, 18124–18142. [Google Scholar] [CrossRef] [PubMed]
- Saidi, K.; Hammami, S. Economic growth, energy consumption and carbone dioxide emissions: Recent evidence from panel data analysis for 58 countries. Qual. Quant. 2016, 50, 361–383. [Google Scholar] [CrossRef]
- Wang, Q.; Wang, S. Preventing carbon emission retaliatory rebound post-COVID-19 requires expanding free trade and improving energy efficiency. Sci. Total Environ. 2020, 746, 141158. [Google Scholar] [CrossRef] [PubMed]
- Kasman, A.; Duman, Y.S. CO2 emissions, economic growth, energy consumption, trade and urbanization in new EU member and candidate countries: A panel data analysis. Econ. Model. 2015, 44, 97–103. [Google Scholar] [CrossRef]
- Cetin, M.; Ecevit, E.; Yucel, A.G. The impact of economic growth, energy consumption, trade openness, and financial development on carbon emissions: Empirical evidence from Turkey. Environ. Sci. Pollut. Res. 2018, 25, 36589–36603. [Google Scholar] [CrossRef]
- Salahuddin, M.; Gow, J. Economic growth, energy consumption and CO2 emissions in Gulf Cooperation Council countries. Energy 2014, 73, 44–58. [Google Scholar] [CrossRef]
- Carmona, M.; Congregado, E.; Feria, J.; Iglesias, J. The energy-growth nexus reconsidered: Persistence and causality. Renew. Sustain. Energy Rev. 2017, 71, 342–347. [Google Scholar] [CrossRef]
- Lin, B.; Benjamin, I.N. Causal relationships between energy consumption, foreign direct investment and economic growth for MINT: Evidence from panel dynamic ordinary least square models. J. Clean. Prod. 2018, 197, 708–720. [Google Scholar] [CrossRef]
- Shahbaz, M.; Zakaria, M.; Shahzad, S.J.H.; Mahalik, M.K. The energy consumption and economic growth nexus in top ten energy-consuming countries: Fresh evidence from using the quantile-on-quantile approach. Energy Econ. 2018, 71, 282–301. [Google Scholar] [CrossRef]
- Karanfil, F. How many times again will we examine the energy-income nexus using a limited range of traditional econometric tools? Energy Policy 2009, 37, 1191–1194. [Google Scholar] [CrossRef]
- Wang, Q.; Wang, S.; Jiang, X.-T. Preventing a rebound in Carbon intensity post-COVID-19–Lessons learned from the change in Carbon intensity before and after the 2008 financial crisis. Sustain. Prod. Consum. 2021. [Google Scholar] [CrossRef]
- Salahuddin, M.; Khan, S. Empirical link between economic growth, energy consumption and CO2 emission in Australia. J. Dev. Areas 2013, 47, 81–92. [Google Scholar] [CrossRef]
- Asafu-Adjaye, J. The relationship between energy consumption, energy prices and economic growth: Time series evidence from Asian developing countries. Energy Econ. 2000, 22, 615–625. [Google Scholar] [CrossRef]
- Wang, Q.; Wang, L. Renewable energy consumption and economic growth in OECD countries: A nonlinear panel data analysis. Energy 2020, 207, 118200. [Google Scholar] [CrossRef]
- Hondroyiannis, G.; Lolos, S.; Papapetrou, E. Energy consumption and economic growth: Assessing the evidence from Greece. Energy Econ. 2002, 24, 319–336. [Google Scholar] [CrossRef]
- Bernard, J.-T.; Bolduc, D.; Yameogo, N.-D. A pseudo-panel data model of household electricity demand. Resour. Energy Econ. 2011, 33, 315–325. [Google Scholar] [CrossRef]
- Wang, Q.; Su, M.; Li, R. Toward to economic growth without emission growth: The role of urbanization and industrialization in China and India. J. Clean. Prod. 2018, 205, 499–511. [Google Scholar] [CrossRef]
- Peng, Z.; Wu, Q. Evaluation of the relationship between energy consumption, economic growth, and CO2 emissions in China’ transport sector: The FMOLS and VECM approaches. Environ. Dev. Sustain. 2020, 22, 6537–6561. [Google Scholar] [CrossRef]
- Khan, M.W.; Panigrahi, S.K.; Almuniri, K.S.; Soomro, M.I.; Mirjat, N.H.; Alqaydi, E.S. Investigating the dynamic impact of CO2 emissions and economic growth on renewable energy production: Evidence from FMOLS and DOLS tests. Processes 2019, 7, 496. [Google Scholar] [CrossRef]
- Streimikiene, D.; Kasperowicz, R. Review of economic growth and energy consumption: A panel cointegration analysis for EU countries. Renew. Sustain. Energy Rev. 2016, 59, 1545–1549. [Google Scholar] [CrossRef]
- Maji, I.K.; Sulaiman, C.; Abdul-Rahim, A.S. Renewable energy consumption and economic growth nexus: A fresh evidence from West Africa. Energy Rep. 2019, 5, 384–392. [Google Scholar] [CrossRef]
- Mohammadi, H.; Parvaresh, S. Energy consumption and output: Evidence from a panel of 14 oil-exporting countries. Energy Econ. 2014, 41, 41–46. [Google Scholar] [CrossRef]
- Lee, C.-C.; Chien, M.-S. Dynamic modelling of energy consumption, capital stock, and real income in G-7 countries. Energy Econ. 2010, 32, 564–581. [Google Scholar] [CrossRef]
- Ndlovu, V.; Inglesi-Lotz, R. The causal relationship between energy and economic growth through research and development (R&D): The case of BRICS and lessons for South Africa. Energy 2020, 199, 117428. [Google Scholar] [CrossRef]
- Saidi, K.; Rahman, M.M.; Amamri, M. The causal nexus between economic growth and energy consumption: New evidence from global panel of 53 countries. Sustain. Cities Soc. 2017, 33, 45–56. [Google Scholar] [CrossRef]
- Konstantakis, K.N.; Michaelides, P.G.; Tsionas, E.G.; Minou, C. System estimation of GVAR with two dominants and network theory: Evidence for BRICs. Econ. Model. 2015, 51, 604–616. [Google Scholar] [CrossRef]
- Tsionas, E.G.; Konstantakis, K.N.; Michaelides, P.G. Bayesian GVAR with k-endogenous dominants & input–output weights: Financial and trade channels in crisis transmission for BRICs. J. Int. Financ. Mark. Inst. Money 2016, 42, 1–26. [Google Scholar] [CrossRef]
- Wang, Q.; Han, X. Is decoupling embodied carbon emissions from economic output in Sino-US trade possible? Technol. Forecast. Soc. Chang. 2021, 169, 120805. [Google Scholar] [CrossRef]
- Zhou, Y.; Liu, W.; Lv, X.; Chen, X.; Shen, M. Investigating interior driving factors and cross-industrial linkages of carbon emission efficiency in China’s construction industry: Based on Super-SBM DEA and GVAR model. J. Clean. Prod. 2019, 241, 118322. [Google Scholar] [CrossRef]
- Wang, Q.; Zhang, F. What does the China’s economic recovery after COVID-19 pandemic mean for the economic growth and energy consumption of other countries? J. Clean. Prod. 2021, 295, 126265. [Google Scholar] [CrossRef]
- Zhang, Y. Theory, method and application of global vector autoregressive model. Quant. Econ. Tech. Econ. Res. 2012, 29, 136–149. [Google Scholar]
- Garratt, A.; Lee, K.; Pesaran, H.; Shin, Y. Global and National Macroeconometric Modelling: A Long-Run Structural Approach; Oxford University Press: Oxford, UK, 2006. [Google Scholar]
- Montresor, S.; Marzetti, G.V. Applying social network analysis to input–output based innovation matrices: An illustrative application to six OECD technological systems for the middle 1990s. Econ. Syst. Res. 2009, 21, 129–149. [Google Scholar] [CrossRef]
- Park, H.J.; Fuller, W.A. Alternative estimators and unit root tests for the autoregressive process. J. Time Ser. Anal. 1995, 16, 415–429. [Google Scholar] [CrossRef]
- Pesaran, M.H.; Schuermann, T.; Weiner, S.M. Modeling regional interdependencies using a global error–correcting macroeconometric model. J. Bus. Econ. Stat. 2004, 22, 129–162. [Google Scholar] [CrossRef]
- Johansen, S. Cointegration in partial systems and the efficiency of single-equation analysis. J. Econom. 1992, 52, 231–254. [Google Scholar] [CrossRef]
- Granger, C.W.J.; Lin, J.L. Causality in the long run. Econom. Theory 1995, 11, 530–536. [Google Scholar]
- Pesaran, M.H.; Shin, Y. Cointegration and the speed of convergence to equilibrium. J. Econom. 1996, 71, 117–143. [Google Scholar] [CrossRef]
- Pesaran, M.H.; Shin, Y. Generalized impulse response analysis in linear multivariate models. Econ. Lett. 1998, 58, 17–29. [Google Scholar] [CrossRef]


Publisher’s Note: MDPI stays neutral with regard to jurisdictional claims in published maps and institutional affiliations. |
© 2021 by the authors. Licensee MDPI, Basel, Switzerland. This article is an open access article distributed under the terms and conditions of the Creative Commons Attribution (CC BY) license (https://creativecommons.org/licenses/by/4.0/).
Share and Cite
Hu, S.; Li, R. Investigating the Effects of the United States’ Economic Slowdown Related to the COVID-19 Pandemic on Energy Consumption in Other Countries—A Global Vector Autoregressive Model. Energies 2021, 14, 2984. https://doi.org/10.3390/en14112984
Hu S, Li R. Investigating the Effects of the United States’ Economic Slowdown Related to the COVID-19 Pandemic on Energy Consumption in Other Countries—A Global Vector Autoregressive Model. Energies. 2021; 14(11):2984. https://doi.org/10.3390/en14112984
Chicago/Turabian StyleHu, Sailan, and Rongrong Li. 2021. "Investigating the Effects of the United States’ Economic Slowdown Related to the COVID-19 Pandemic on Energy Consumption in Other Countries—A Global Vector Autoregressive Model" Energies 14, no. 11: 2984. https://doi.org/10.3390/en14112984
APA StyleHu, S., & Li, R. (2021). Investigating the Effects of the United States’ Economic Slowdown Related to the COVID-19 Pandemic on Energy Consumption in Other Countries—A Global Vector Autoregressive Model. Energies, 14(11), 2984. https://doi.org/10.3390/en14112984