
Remote Sensing for Monitoring Photovoltaic Solar Plants in Brazil Using Deep Semantic Segmentation

 ,
,  , , and
Abstract
1. Introduction
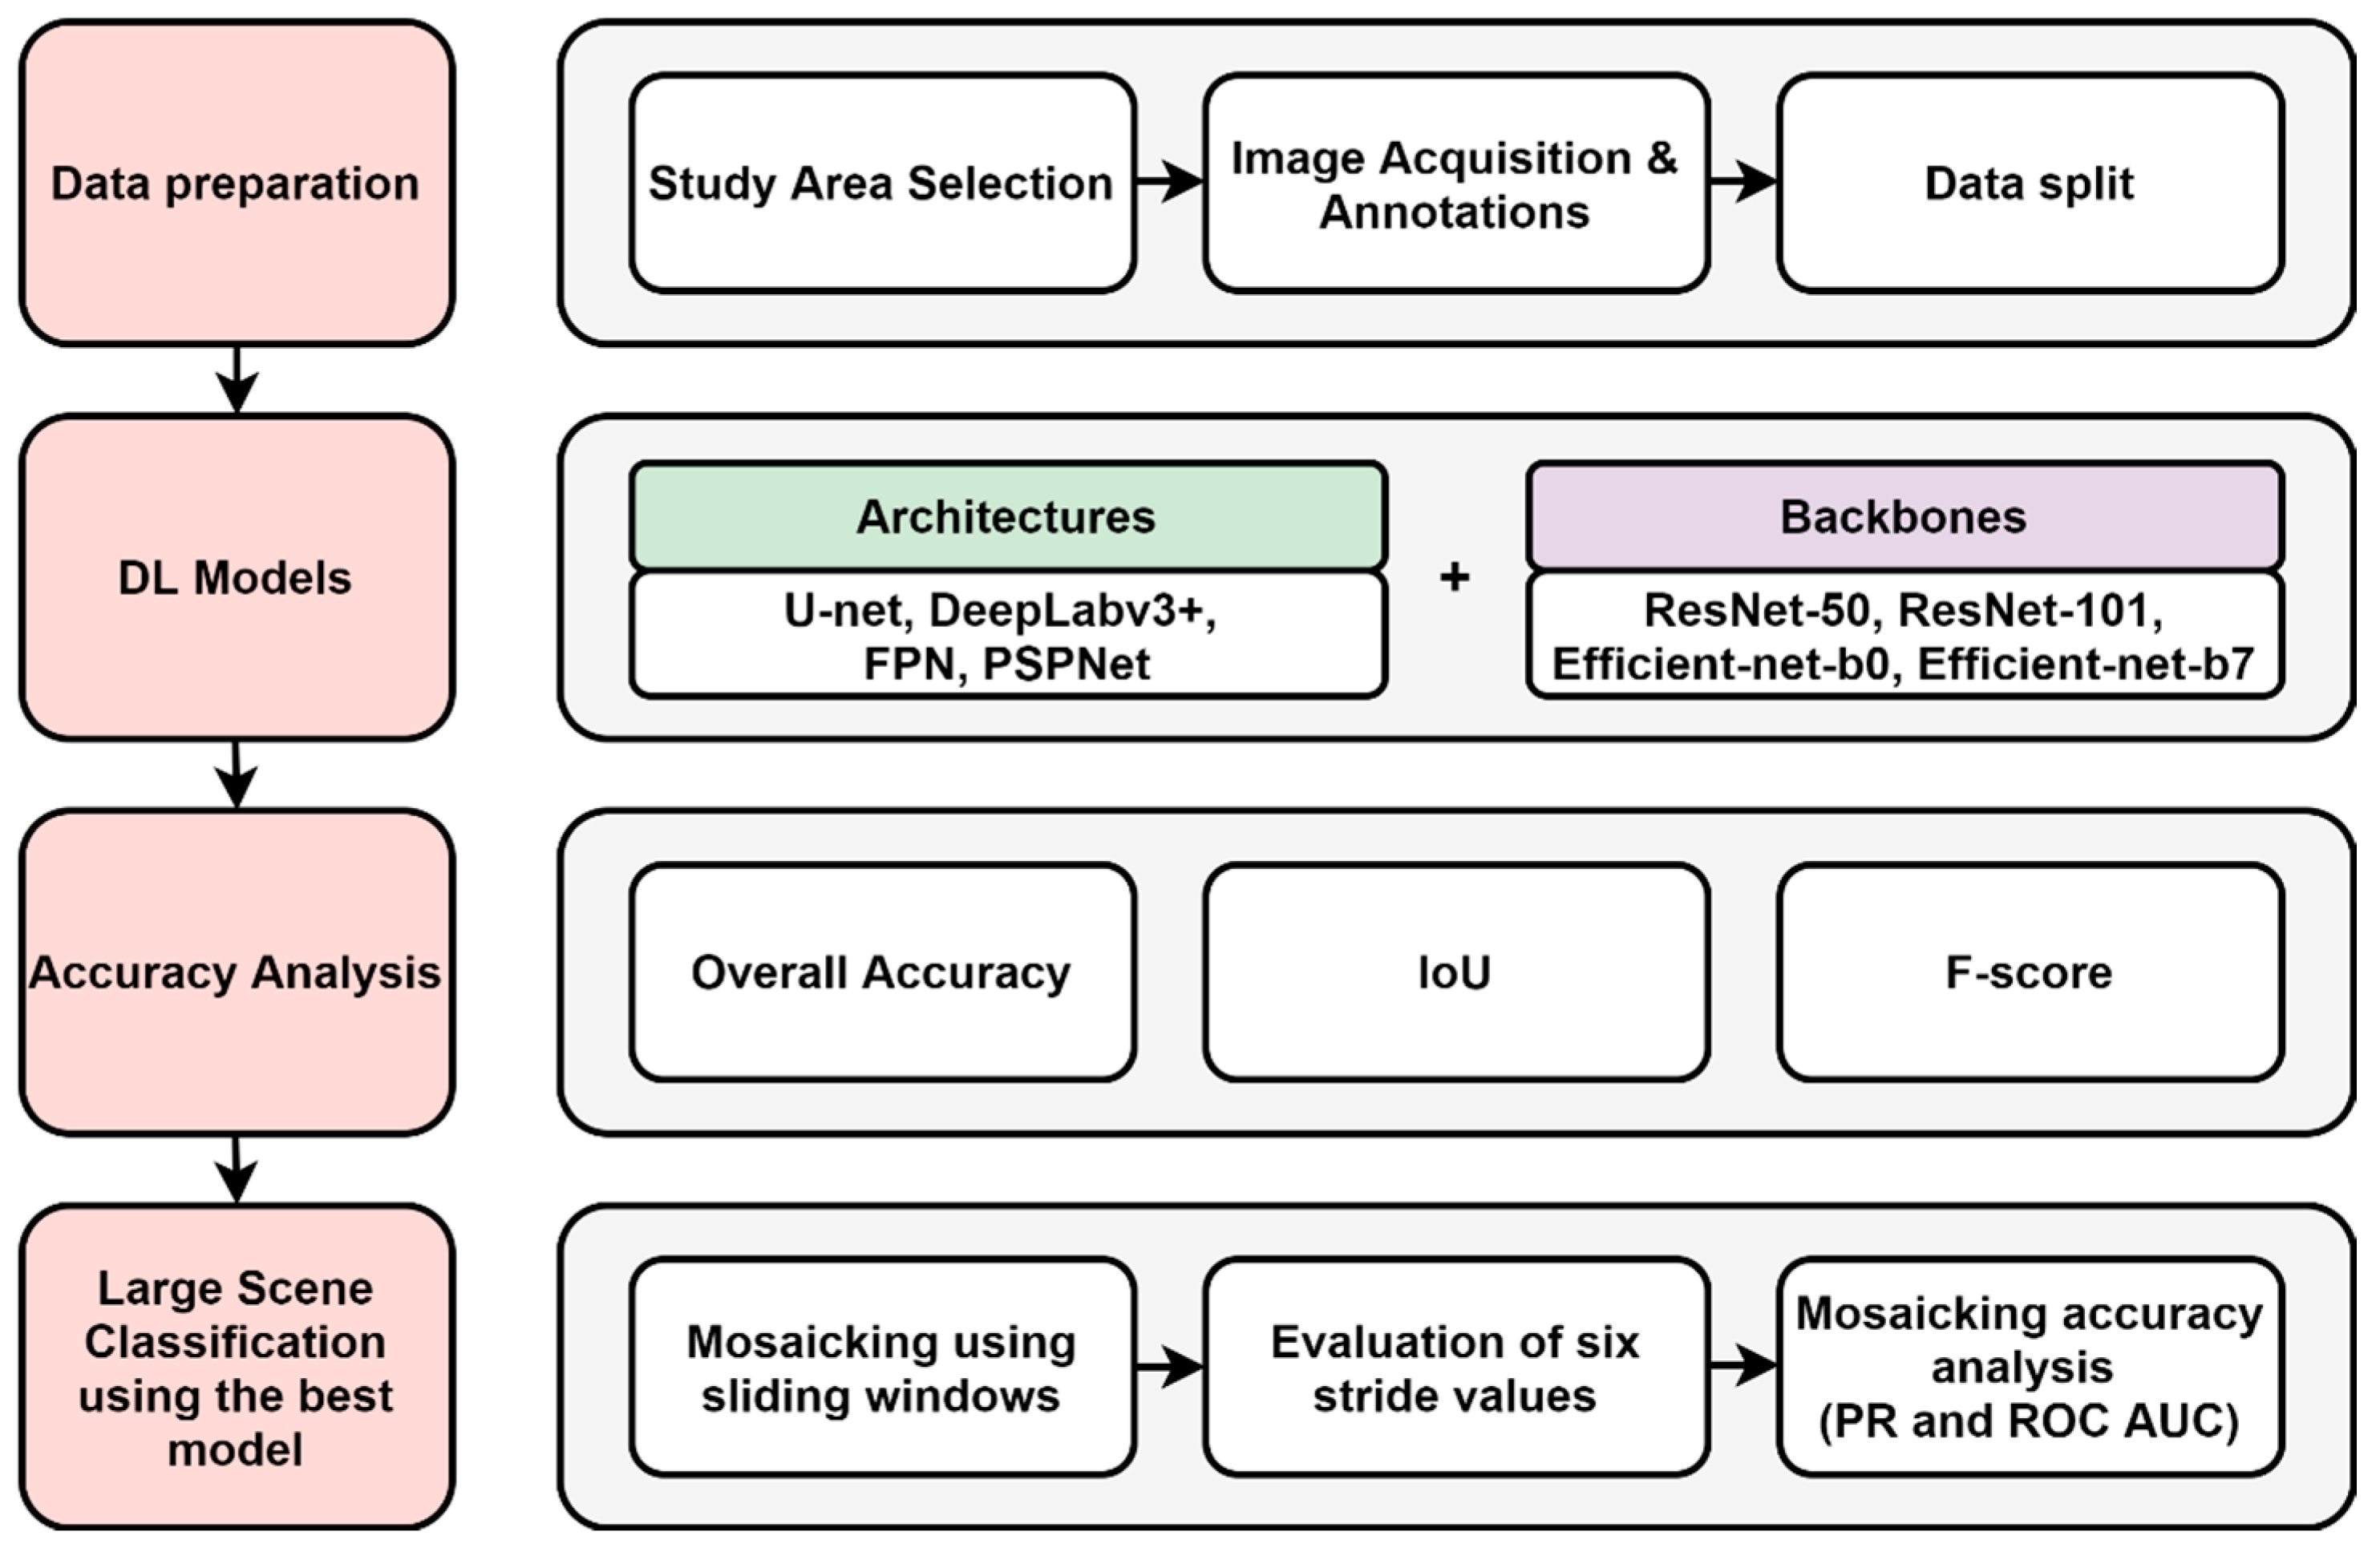
2. Materials and Methods
2.1. Data Preparation
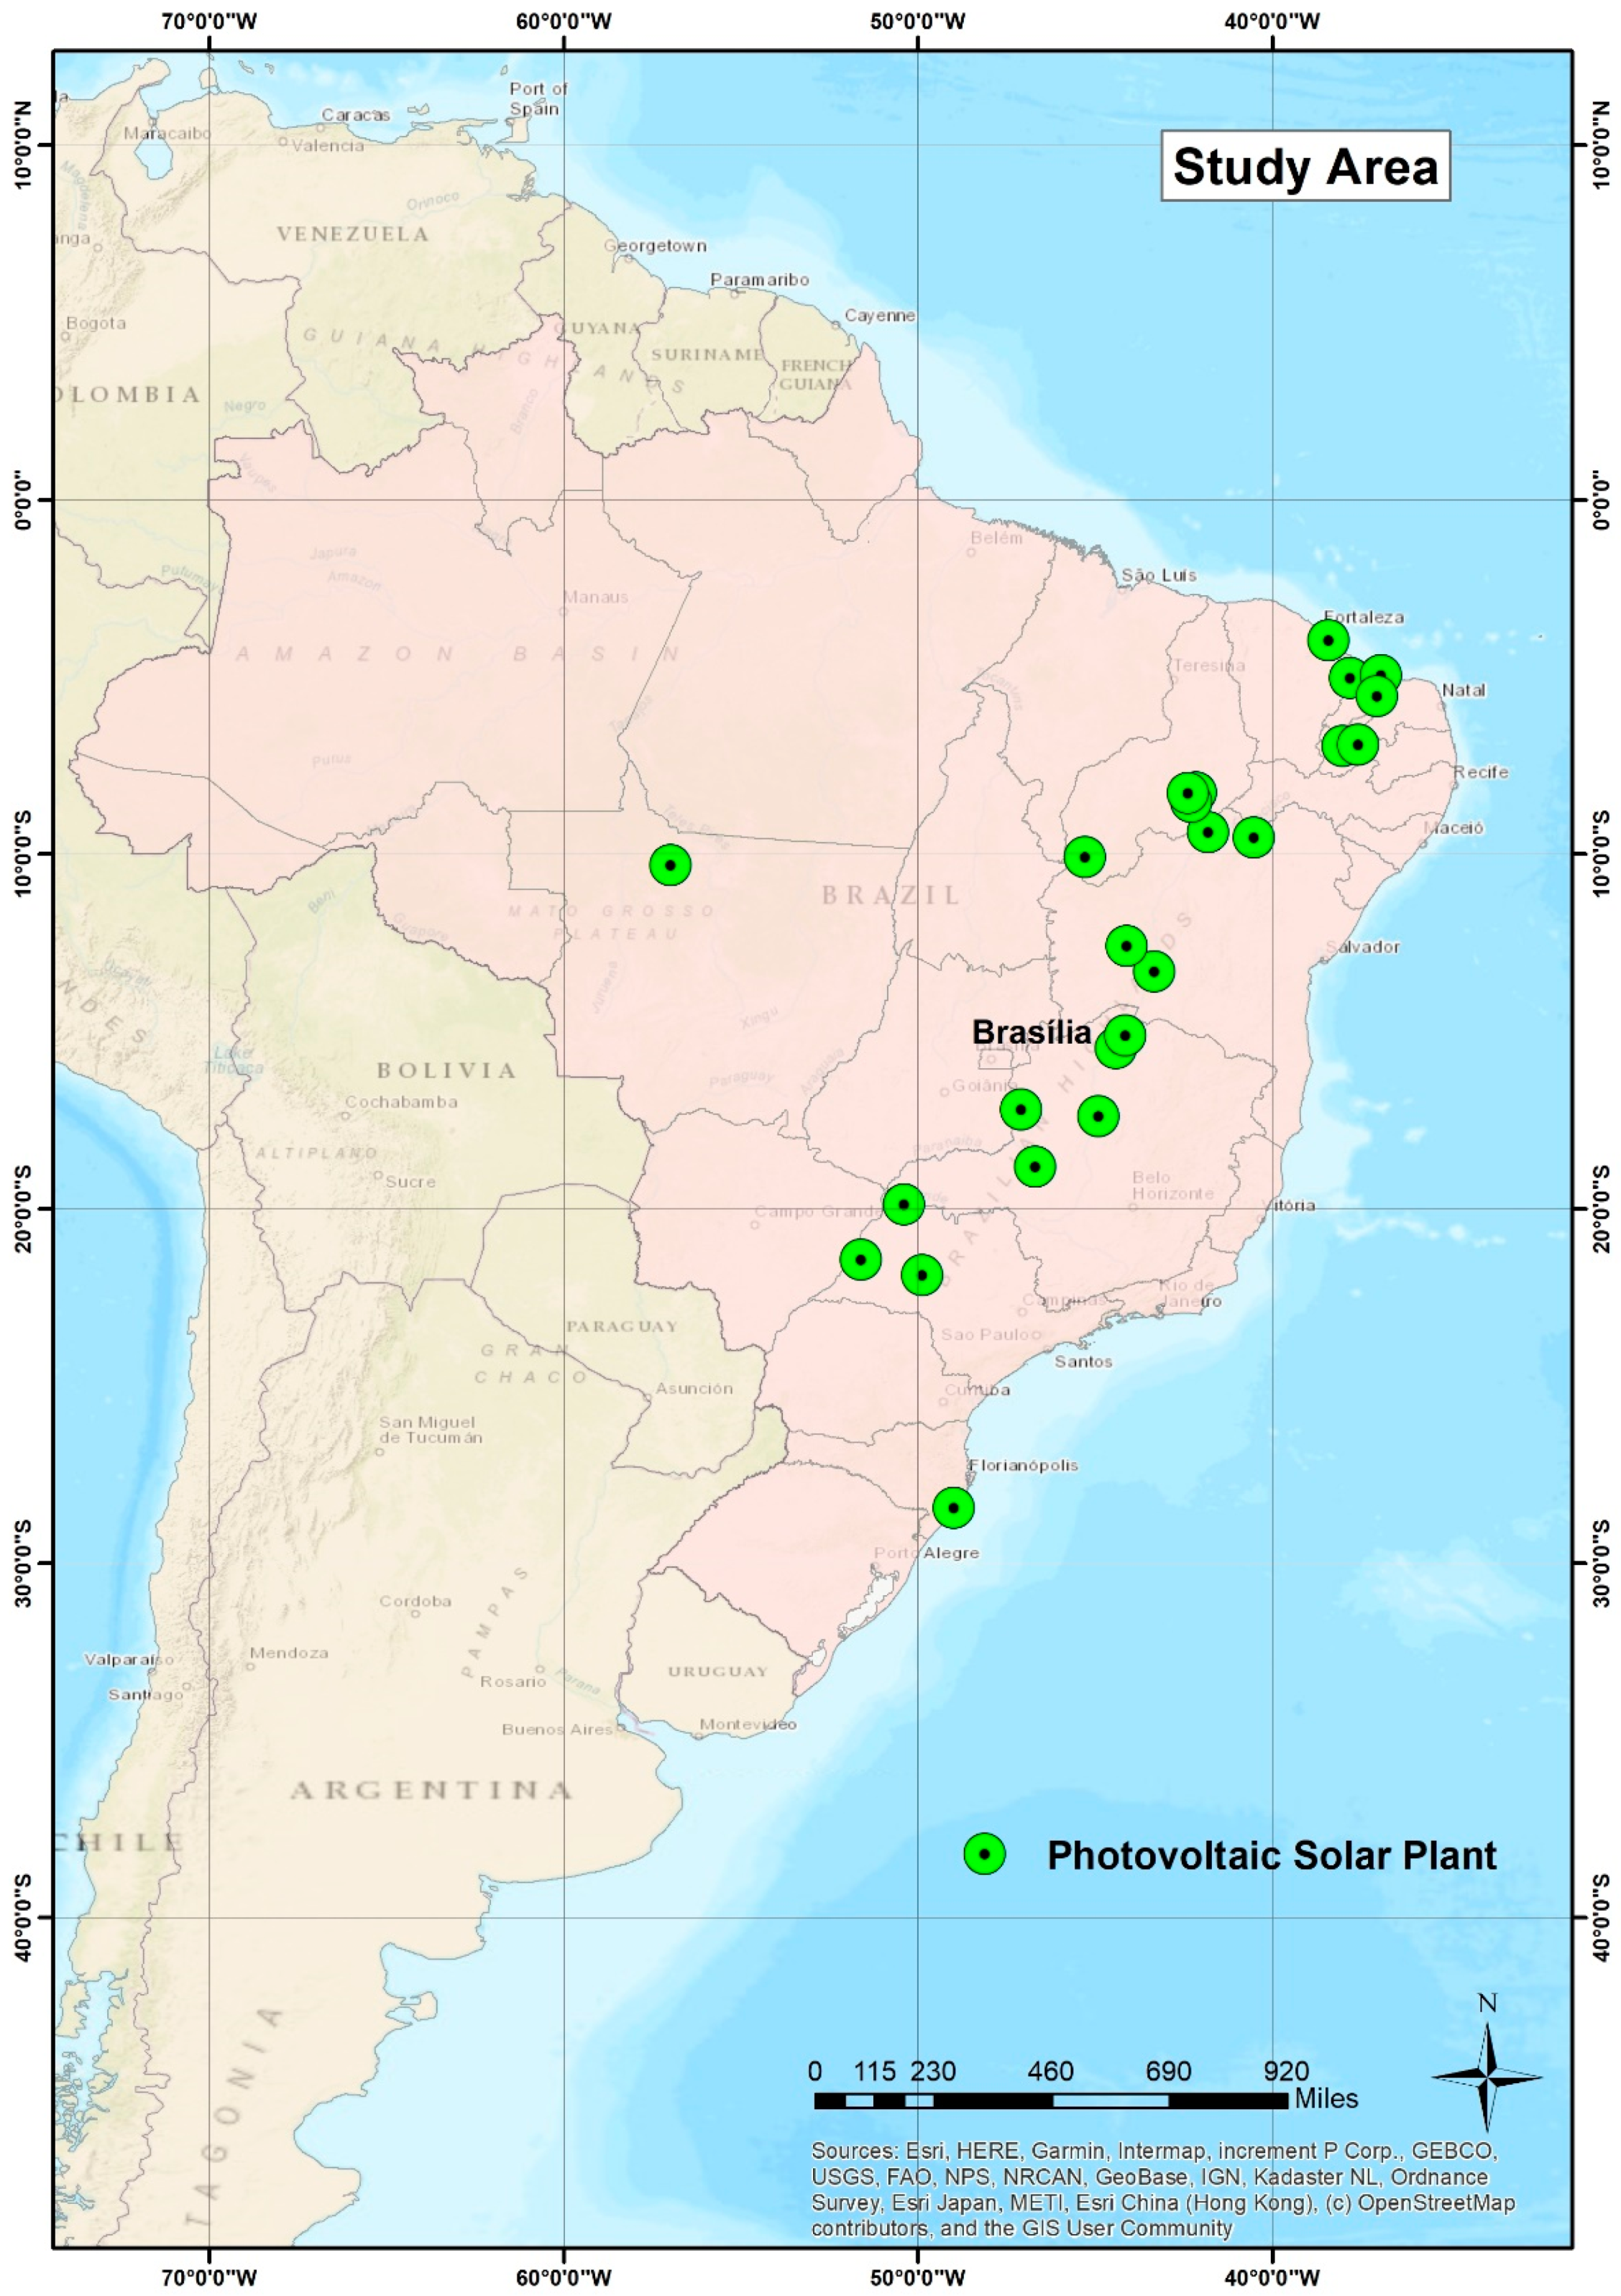
2.1.1. Study Area
2.1.2. Image Acquisition and Annotations
2.1.3. Data Split
2.2. DL Models
2.2.1. Architectures and Backbones
2.2.2. Model Configurations
2.3. DL Accuracy Analysis
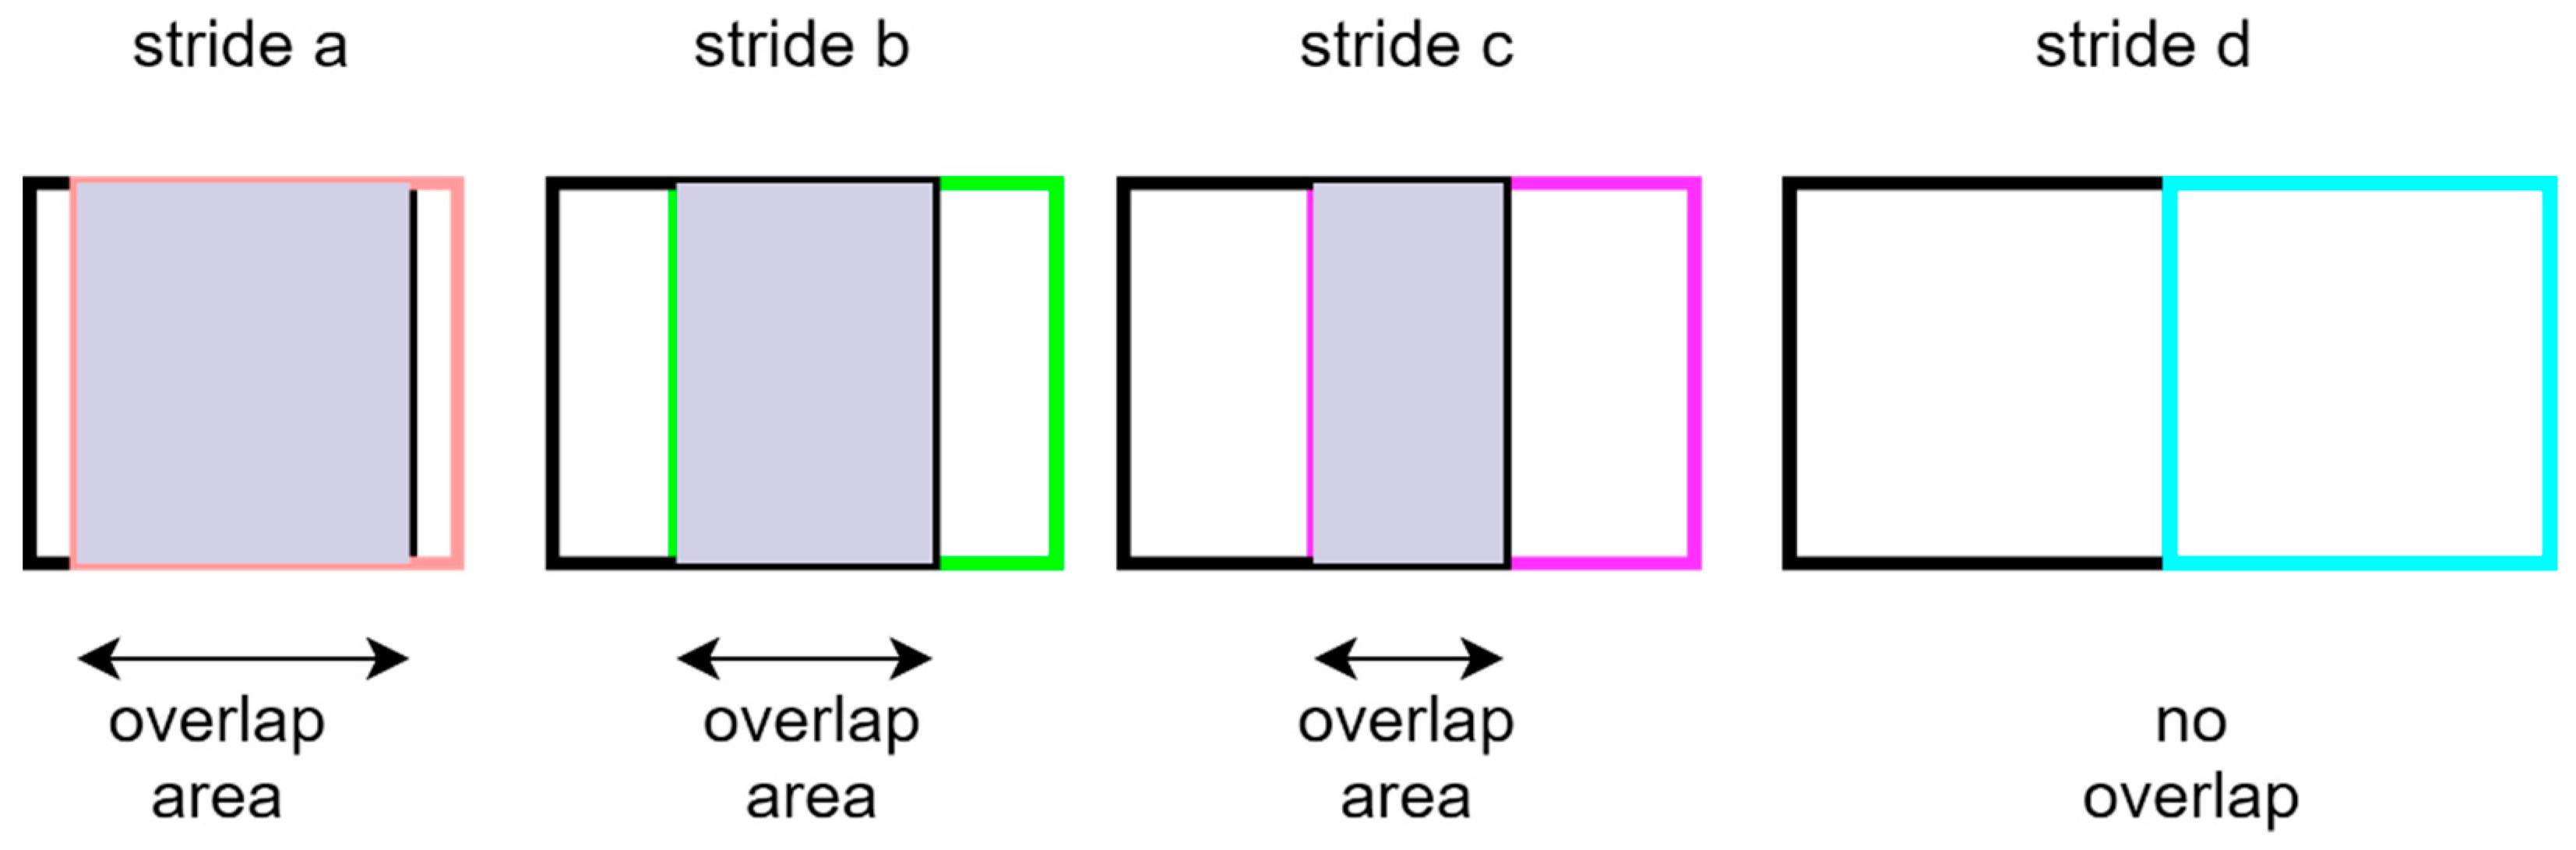
2.4. Mosaicking
2.5. Mosaicking Accuracy Analysis
3. Results
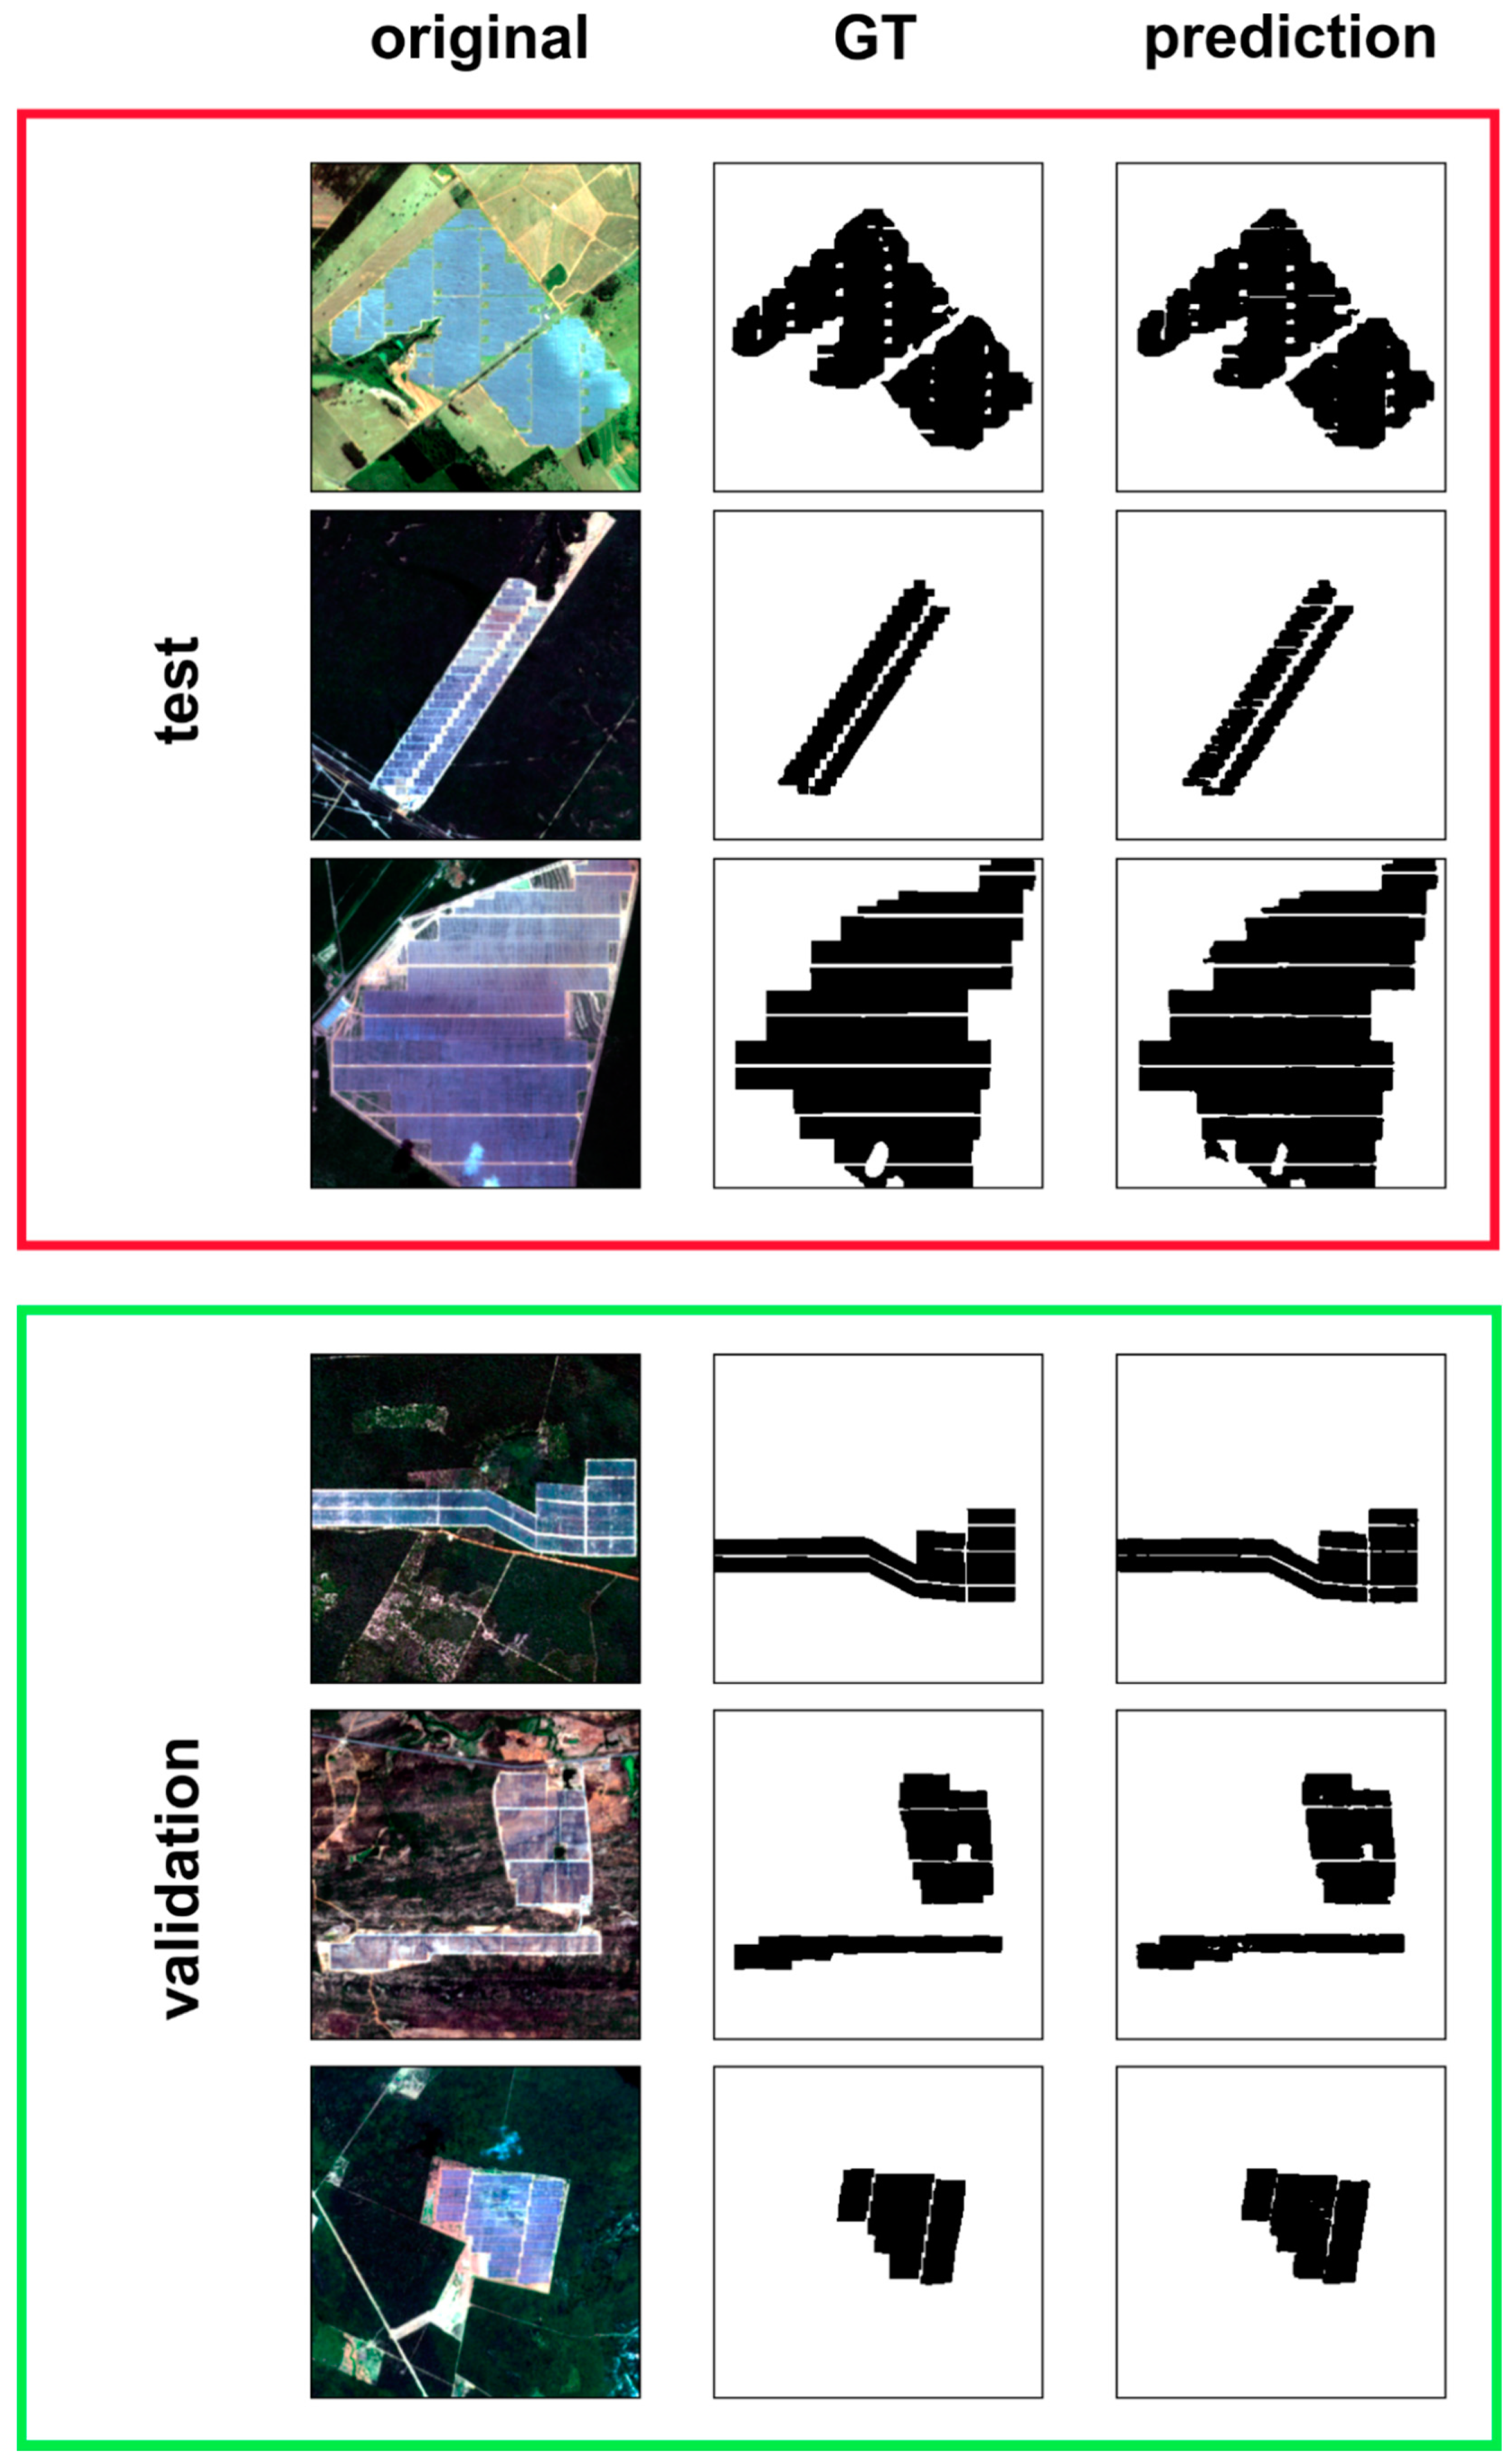
3.1. DL Metrics Results
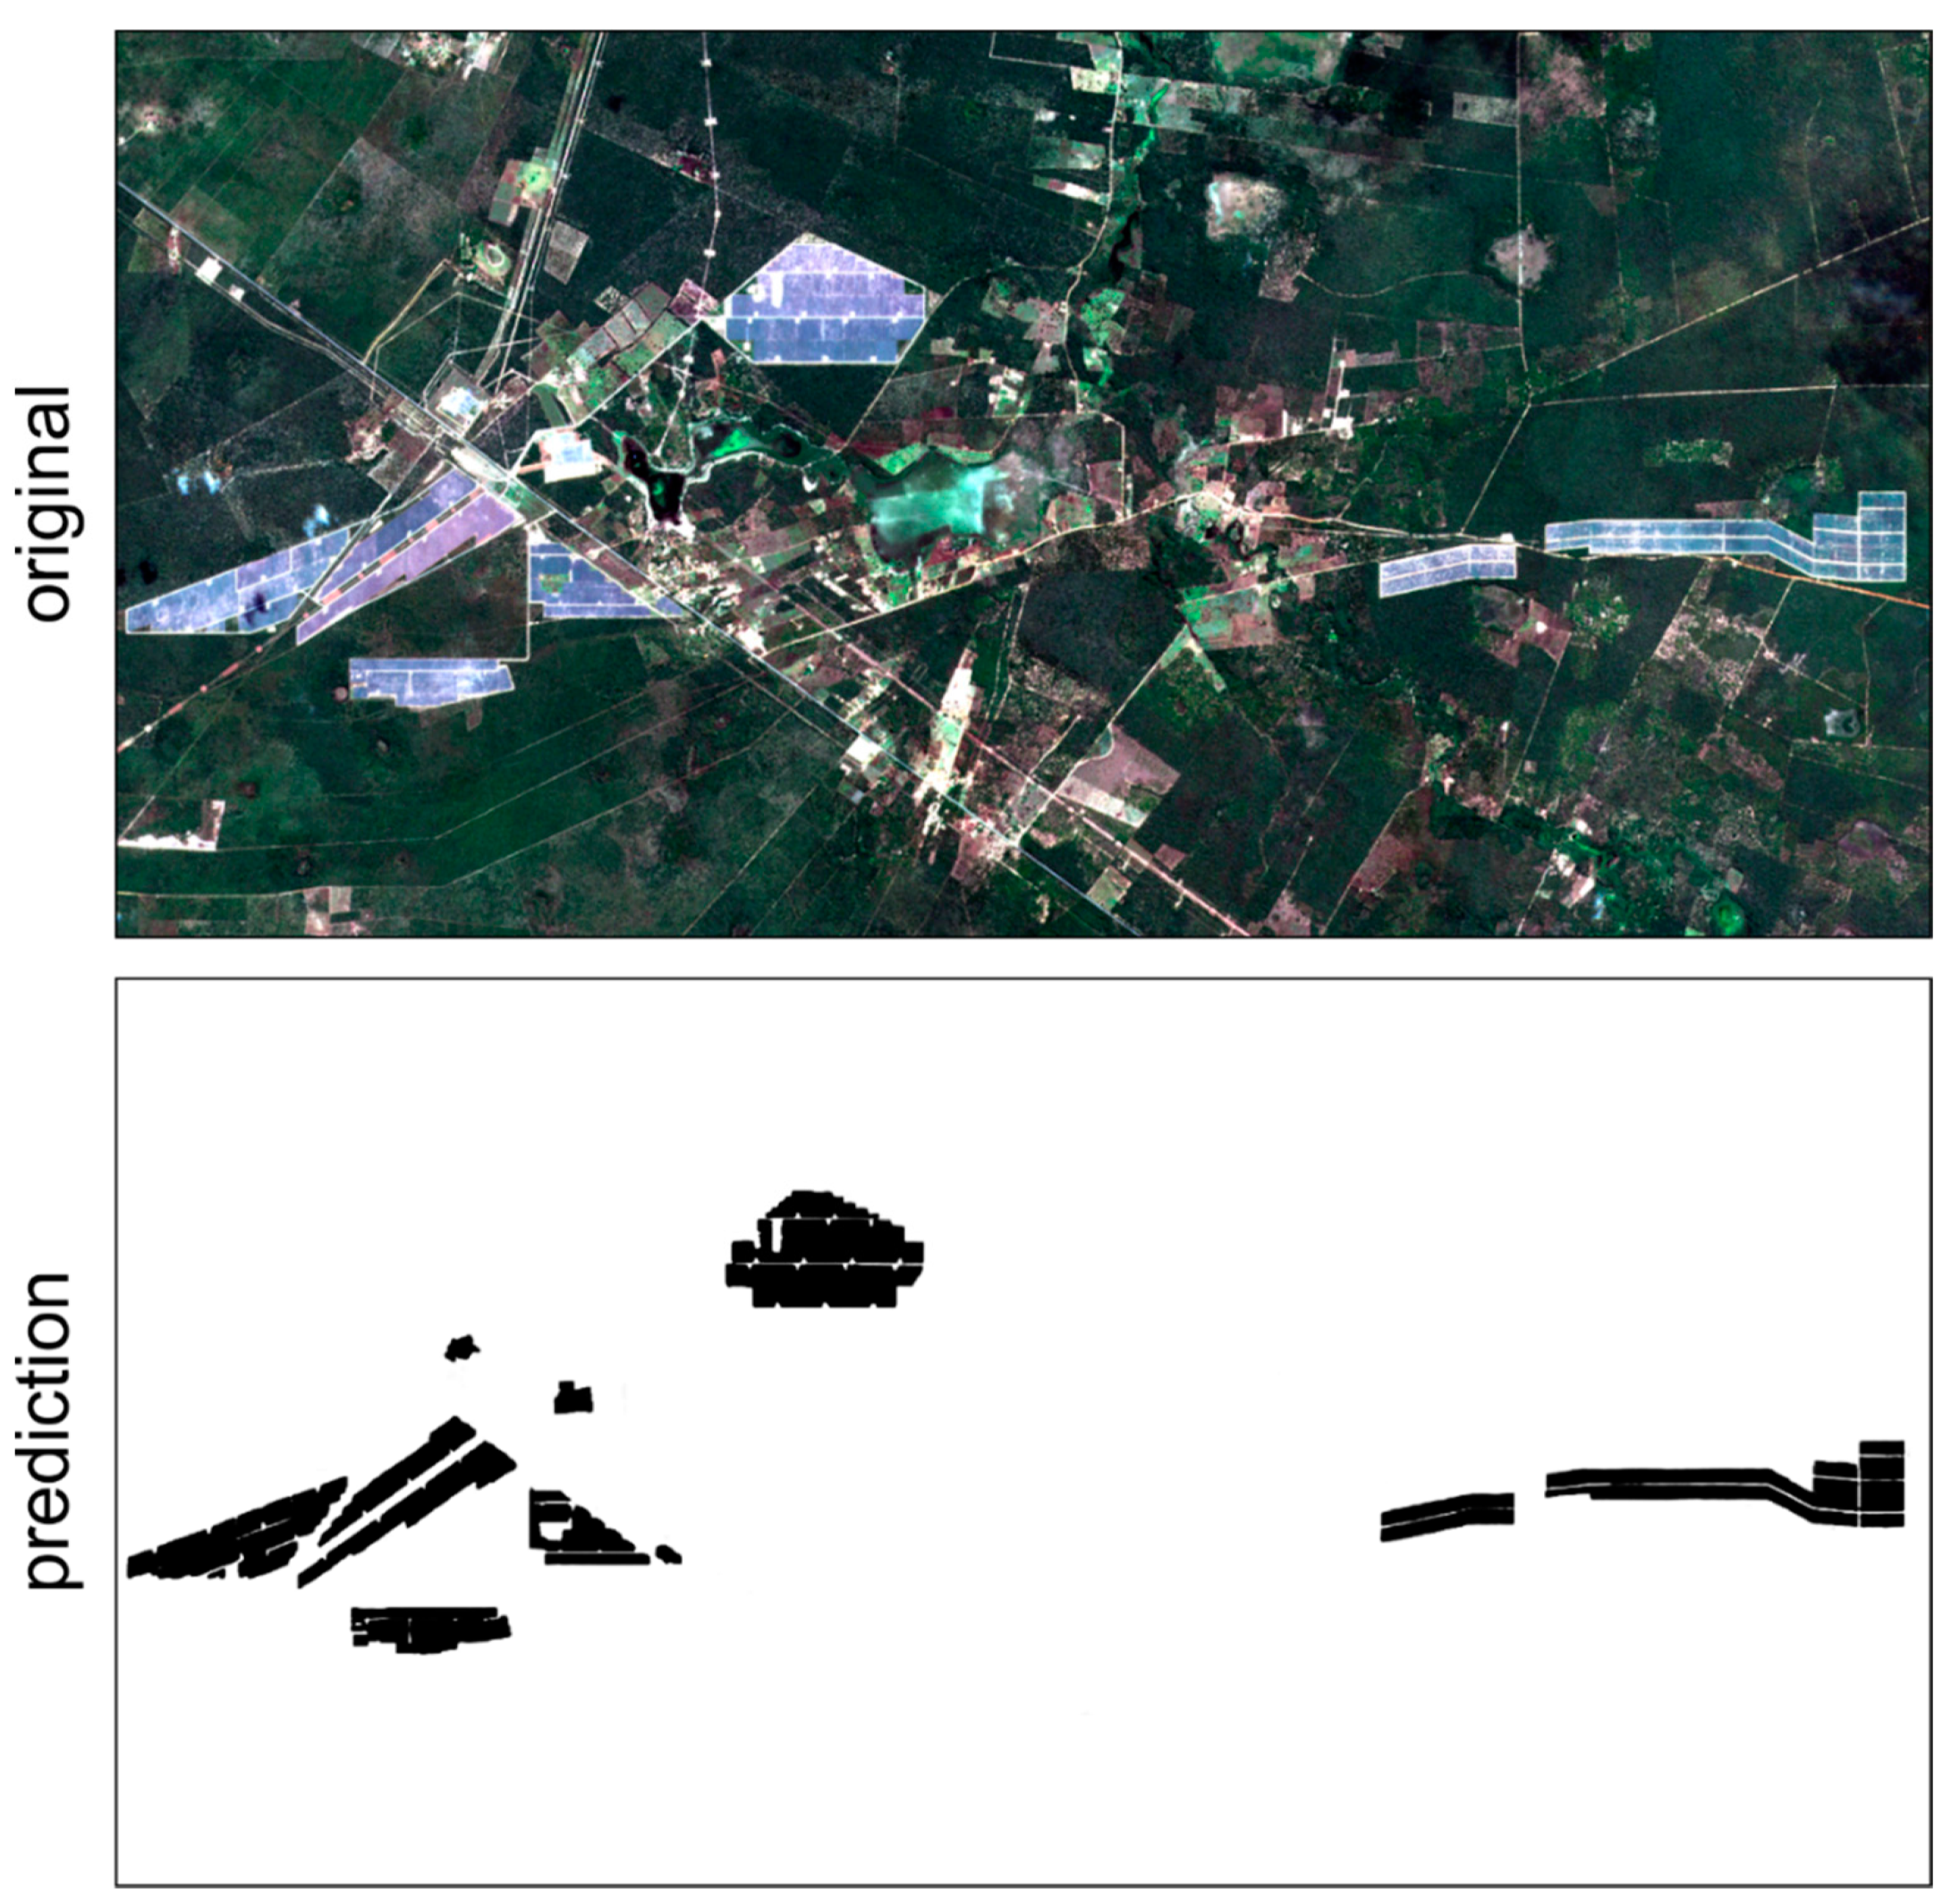
3.2. Mosaicking Results
4. Discussion
5. Conclusions
Author Contributions
Funding
Institutional Review Board Statement
Informed Consent Statement
Data Availability Statement
Acknowledgments
Conflicts of Interest
References
- Kabir, E.; Kumar, P.; Kumar, S.; Adelodun, A.A.; Kim, K.H. Solar energy: Potential and future prospects. Renew. Sustain. Energy Rev. 2018, 82, 894–900. [Google Scholar] [CrossRef]
- Subtil Lacerda, J.; Van Den Bergh, J.C.J.M. Diversity in solar photovoltaic energy: Implications for innovation and policy. Renew. Sustain. Energy Rev. 2016, 54, 331–340. [Google Scholar] [CrossRef]
- Sampaio, P.G.V.; González, M.O.A. Photovoltaic solar energy: Conceptual framework. Renew. Sustain. Energy Rev. 2017, 74, 590–601. [Google Scholar] [CrossRef]
- Jäger-Waldau, A. Snapshot of photovoltaics-February 2020. Energies 2020, 13, 930. [Google Scholar] [CrossRef]
- Rabaia, M.K.H.; Abdelkareem, M.A.; Sayed, E.T.; Elsaid, K.; Chae, K.J.; Wilberforce, T.; Olabi, A.G. Environmental impacts of solar energy systems: A review. Sci. Total Environ. 2021, 754, 141989. [Google Scholar] [CrossRef]
- IPCC Painel Intergovernamental onClimate Change. Climate Change 2014: Mitigation of Climate Change. Contribution of Working Group III to the Fifth Assessment Report of the Intergovernmental Panel on Climate Change; Edenhofer, O., Pichs-Madruga, R., Sokona, Y., Farahani, E., Kadner, S., Seyboth, K., Adler, A., Baum, I., Brunner, S., Eickemeier, P., et al., Eds.; Cambridge University Press: Cambridge, UK, 2014; ISBN 9781107654815. [Google Scholar] [CrossRef]
- Creutzig, F.; Agoston, P.; Goldschmidt, J.C.; Luderer, G.; Nemet, G.; Pietzcker, R.C. The underestimated potential of solar energy to mitigate climate change. Nat. Energy 2017, 2. [Google Scholar] [CrossRef]
- Gils, H.C.; Simon, S.; Soria, R. 100% Renewable energy supply for Brazil-The role of sector coupling and regional development. Energies 2017, 10, 1859. [Google Scholar] [CrossRef]
- Mendes, L.F.R.; Sthel, M.S. Analysis of the hydrological cycle and its impacts on the sustainability of the electric matrix in the state of Rio de Janeiro/Brazil. Energy Strateg. Rev. 2018, 22, 119–126. [Google Scholar] [CrossRef]
- Mendes, L.F.R.; Sthel, M.S. Thermoelectric Power Plant for Compensation of Hydrological Cycle Change: Environmental Impacts in Brazil. Case Stud. Environ. 2017, 1, 1–7. [Google Scholar] [CrossRef]
- Melo, L.B.; Estanislau, F.B.G.L.E.; Costa, A.L.; Fortini, Â. Impacts of the hydrological potential change on the energy matrix of the Brazilian State of Minas Gerais: A case study. Renew. Sustain. Energy Rev. 2019, 110, 415–422. [Google Scholar] [CrossRef]
- Reichert, B.; Souza, A.M. Interrelationship simulations among Brazilian electric matrix sources. Electr. Power Syst. Res. 2021, 193, 107019. [Google Scholar] [CrossRef]
- Athayde, S.; Mathews, M.; Bohlman, S.; Brasil, W.; Doria, C.R.; Dutka-Gianelli, J.; Fearnside, P.M.; Loiselle, B.; Marques, E.E.; Melis, T.S.; et al. Mapping research on hydropower and sustainability in the Brazilian Amazon: Advances, gaps in knowledge and future directions. Curr. Opin. Environ. Sustain. 2019, 37, 50–69. [Google Scholar] [CrossRef]
- Manyari, W.V.; de Carvalho, O.A. Environmental considerations in energy planning for the Amazon region: Downstream effects of dams. Energy Policy 2007, 35, 6526–6534. [Google Scholar] [CrossRef]
- Latrubesse, E.M.; Arima, E.Y.; Dunne, T.; Park, E.; Baker, V.R.; D’Horta, F.M.; Wight, C.; Wittmann, F.; Zuanon, J.; Baker, P.A.; et al. Damming the rivers of the Amazon basin. Nature 2017, 546, 363–369. [Google Scholar] [CrossRef] [PubMed]
- De Faria, F.A.M.; Jaramillo, P. The future of power generation in Brazil: An analysis of alternatives to Amazonian hydropower development. Energy Sustain. Dev. 2017, 41, 24–35. [Google Scholar] [CrossRef]
- De Jong, P.; Barreto, T.B.; Tanajura, C.A.S.; Kouloukoui, D.; Oliveira-Esquerre, K.P.; Kiperstok, A.; Torres, E.A. Estimating the impact of climate change on wind and solar energy in Brazil using a South American regional climate model. Renew. Energy 2019, 141, 390–401. [Google Scholar] [CrossRef]
- Ferraz de Andrade Santos, J.A.; de Jong, P.; Alves da Costa, C.; Torres, E.A. Combining wind and solar energy sources: Potential for hybrid power generation in Brazil. Util. Policy 2020, 67. [Google Scholar] [CrossRef]
- Ferreira, A.; Kunh, S.S.; Fagnani, K.C.; De Souza, T.A.; Tonezer, C.; Dos Santos, G.R.; Coimbra-Araújo, C.H. Economic overview of the use and production of photovoltaic solar energy in brazil. Renew. Sustain. Energy Rev. 2018, 81, 181–191. [Google Scholar] [CrossRef]
- Martins, F.R.; Abreu, S.L.; Pereira, E.B. Scenarios for solar thermal energy applications in Brazil. Energy Policy 2012, 48, 640–649. [Google Scholar] [CrossRef]
- Martins, F.R.; Rüther, R.; Pereira, E.B.; Abreu, S.L. Solar energy scenarios in Brazil. Part two: Photovoltaics applications. Energy Policy 2008, 36, 2865–2877. [Google Scholar] [CrossRef]
- Martins, F.R.; Pereira, E.B.; Silva, S.A.B.; Abreu, S.L.; Colle, S. Solar energy scenarios in Brazil, Part one: Resource assessment. Energy Policy 2008, 36, 2853–2864. [Google Scholar] [CrossRef]
- De Lima, F.J.L.; Martins, F.R.; Costa, R.S.; Gonçalves, A.R.; dos Santos, A.P.P.; Pereira, E.B. The seasonal variability and trends for the surface solar irradiation in northeastern region of Brazil. Sustain. Energy Technol. Assess. 2019, 35, 335–346. [Google Scholar] [CrossRef]
- Azevêdo, V.W.B.; Candeias, L.B.; Tiba, C. Location study of solar thermal power plant in the state of Pernambuco using geoprocessing technologies and Multiple-Criteria analysis. Energies 2017, 10, 1042. [Google Scholar] [CrossRef]
- Medeiros, S.E.L.; Nilo, P.F.; Silva, L.P.; Santos, C.A.C.; Carvalho, M.; Abrahão, R. Influence of climatic variability on the electricity generation potential by renewable sources in the Brazilian semi-arid region. J. Arid Environ. 2021, 184, 104331. [Google Scholar] [CrossRef]
- Vieira de Souza, L.E.; Gilmanova Cavalcante, A.M. Concentrated Solar Power deployment in emerging economies: The cases of China and Brazil. Renew. Sustain. Energy Rev. 2017, 72, 1094–1103. [Google Scholar] [CrossRef]
- De Faria, H.; Trigoso, F.B.M.; Cavalcanti, J.A.M. Review of distributed generation with photovoltaic grid connected systems in Brazil: Challenges and prospects. Renew. Sustain. Energy Rev. 2017, 75, 469–475. [Google Scholar] [CrossRef]
- Amaral, A.B.A.; Mendonca, A.L.Z.L.G.; Resende, A.A.M.; Rego, E.E. Solar energy and distributed generation: 2015, a year of inflection in Brazil? IEEE Lat. Am. Trans. 2016, 14, 3731–3737. [Google Scholar] [CrossRef]
- Elgamal, G.N.G.; Demajorovic, J. Barriers and perspectives for electric power generation out of photovoltaic solar panels in the brazilian energy matrix. Rev. Gest. Ambient. Sustent. 2020, 9, 1–26. [Google Scholar] [CrossRef]
- Garlet, T.B.; Ribeiro, J.L.D.; de Souza Savian, F.; Mairesse Siluk, J.C. Paths and barriers to the diffusion of distributed generation of photovoltaic energy in southern Brazil. Renew. Sustain. Energy Rev. 2019, 111, 157–169. [Google Scholar] [CrossRef]
- Vilaça Gomes, P.; Knak Neto, N.; Carvalho, L.; Sumaili, J.; Saraiva, J.T.; Dias, B.H.; Miranda, V.; Souza, S.M. Technical-economic analysis for the integration of PV systems in Brazil considering policy and regulatory issues. Energy Policy 2018, 115, 199–206. [Google Scholar] [CrossRef]
- Hoffmann, A.S.; de Carvalho, G.H.; Cardoso, R.A.F. Environmental licensing challenges for the implementation of photovoltaic solar energy projects in Brazil. Energy Policy 2019, 132, 1143–1154. [Google Scholar] [CrossRef]
- Queiroz, J.V.; Borges, K.K.; Queiroz, F.C.B.P.; Lima, N.C.; Da Silva, C.L.; de Souza Morais, L. Barriers to expand solar photovoltaic energy in Brazil. Indep. J. Manag. Prod. 2020, 11, 2733–2754. [Google Scholar] [CrossRef]
- Denes_Santos, D.; da Cunha, S.K. Transformative innovation policy for solar energy: Particularities of a developing country. Clean Technol. Environ. Policy 2020, 22, 43–57. [Google Scholar] [CrossRef]
- Barbosa, J.; Dias, L.P.; Simoes, S.G.; Seixas, J. When is the sun going to shine for the Brazilian energy sector? A story of how modelling affects solar electricity. Renew. Energy 2020, 162, 1684–1702. [Google Scholar] [CrossRef]
- Viana, A.G.; Ramos, D.S. Outcomes from the first large-scale solar PV auction in Brazil. Renew. Sustain. Energy Rev. 2018, 91, 219–228. [Google Scholar] [CrossRef]
- Echegaray, F. Understanding stakeholders’ views and support for solar energy in Brazil. J. Clean. Prod. 2014, 63, 125–133. [Google Scholar] [CrossRef]
- Orlandi, A.G.; Farias, R.A.N.; de Carvalho Junior, O.A.; Guimarães, R.F.; Gomes, R.A.T. Controle gerencial na administração pública e transformação digital: Sensoriamento remoto. Cad. Gestão Pública Cid. 2021, 26, 1–24. [Google Scholar] [CrossRef]
- Deng, C.; Wang, S.; Huang, Z.; Tan, Z.; Liu, J. Unmanned aerial vehicles for power line inspection: A cooperative way in platforms and communications. J. Commun. 2014, 9, 687–692. [Google Scholar] [CrossRef]
- Matikainen, L.; Lehtomäki, M.; Ahokas, E.; Hyyppä, J.; Karjalainen, M.; Jaakkola, A.; Kukko, A.; Heinonen, T. Remote sensing methods for power line corridor surveys. ISPRS J. Photogramm. Remote Sens. 2016, 119, 10–31. [Google Scholar] [CrossRef]
- Ahmad, J.; Malik, A.S.; Xia, L.; Ashikin, N. Vegetation encroachment monitoring for transmission lines right-of-ways: A survey. Electr. Power Syst. Res. 2013, 95, 339–352. [Google Scholar] [CrossRef]
- Bonansea, M.; Ferrero, S.; Ferral, A.; Ledesma, M.; German, A.; Carreño, J.; Rodriguez, C.; Pinotti, L. Assessing water surface temperature from Landsat imagery and its relationship with a nuclear power plant. Hydrol. Sci. J. 2021, 66, 50–58. [Google Scholar] [CrossRef]
- Ma, P.; Dai, X.; Guo, Z.; Wei, C.; Ma, W. Detection of thermal pollution from power plants on China’s eastern coast using remote sensing data. Stoch. Environ. Res. Risk Assess. 2017, 31, 1957–1975. [Google Scholar] [CrossRef]
- Ahn, Y.H.; Shanmugam, P.; Lee, J.H.; Kang, Y.Q. Application of satellite infrared data for mapping of thermal plume contamination in coastal ecosystem of Korea. Mar. Environ. Res. 2006, 61, 186–201. [Google Scholar] [CrossRef] [PubMed]
- Chen, C.; Shi, P.; Mao, Q. Application of remote sensing techniques for monitoring the thermal pollution of cooling-water discharge from nuclear power plant. J. Environ. Sci. Health Part A Toxic Hazard. Subst. Environ. Eng. 2003, 38, 1659–1668. [Google Scholar] [CrossRef] [PubMed]
- Bauni, V.; Schivo, F.; Capmourteres, V.; Homberg, M. Ecosystem loss assessment following hydroelectric dam flooding: The case of Yacyretá, Argentina. Remote Sens. Appl. Soc. Environ. 2015, 1, 50–60. [Google Scholar] [CrossRef]
- Chen, G.; Powers, R.P.; de Carvalho, L.M.T.; Mora, B. Spatiotemporal patterns of tropical deforestation and forest degradation in response to the operation of the Tucuruí hydroelectricdam in the Amazon basin. Appl. Geogr. 2015, 63, 1–8. [Google Scholar] [CrossRef]
- Jiang, X.; Lu, D.; Moran, E.; Calvi, M.F.; Dutra, L.V.; Li, G. Examining impacts of the Belo Monte hydroelectric dam construction on land-cover changes using multitemporal Landsat imagery. Appl. Geogr. 2018, 97, 35–47. [Google Scholar] [CrossRef]
- Feng, L.; Hu, C.; Chen, X.; Zhao, X. Dramatic inundation changes of China’s two largest freshwater lakes linked to the Three Gorges Dam. Environ. Sci. Technol. 2013, 47, 9628–9634. [Google Scholar] [CrossRef] [PubMed]
- Beyer, R.C.M.; Franco-Bedoya, S.; Galdo, V. Examining the economic impact of COVID-19 in India through daily electricity consumption and nighttime light intensity. World Dev. 2021, 140, 105287. [Google Scholar] [CrossRef]
- Dugoua, E.; Kennedy, R.; Urpelainen, J. Satellite data for the social sciences: Measuring rural electrification with night-time lights. Int. J. Remote Sens. 2018, 39, 2690–2701. [Google Scholar] [CrossRef]
- Min, B.; Gaba, K.M. Tracking electrification in Vietnam using nighttime lights. Remote Sens. 2014, 6, 9511–9529. [Google Scholar] [CrossRef]
- Hammer, A.; Heinemann, D.; Hoyer, C.; Kuhlemann, R.; Lorenz, E.; Müller, R.; Beyer, H.G. Solar energy assessment using remote sensing technologies. Remote Sens. Environ. 2003, 86, 423–432. [Google Scholar] [CrossRef]
- Yang, D.; Kleissl, J.; Gueymard, C.A.; Pedro, H.T.C.; Coimbra, C.F.M. History and trends in solar irradiance and PV power forecasting: A preliminary assessment and review using text mining. Sol. Energy 2018, 168, 60–101. [Google Scholar] [CrossRef]
- Masoom, A.; Kosmopoulos, P.; Bansal, A.; Kazadzis, S. Solar energy estimations in india using remote sensing technologies and validation with sun photometers in urban areas. Remote Sens. 2020, 12, 254. [Google Scholar] [CrossRef]
- Kausika, B.; van Sark, W. Calibration and Validation of ArcGIS Solar Radiation Tool for Photovoltaic Potential Determination in the Netherlands. Energies 2021, 14, 1865. [Google Scholar] [CrossRef]
- Al Garni, H.Z.; Awasthi, A. Solar PV Power Plants Site Selection: A Review. In Advances in Renewable Energies and Power Technologies; Yahyaoui, I., Ed.; Elsevier Inc.: Amsterdam, The Netherlands, 2018; Volume 1, pp. 57–75. ISBN 9780128132173. [Google Scholar]
- Gherboudj, I.; Ghedira, H. Assessment of solar energy potential over the United Arab Emirates using remote sensing and weather forecast data. Renew. Sustain. Energy Rev. 2016, 55, 1210–1224. [Google Scholar] [CrossRef]
- Mahtta, R.; Joshi, P.K.; Jindal, A.K. Solar power potential mapping in India using remote sensing inputs and environmental parameters. Renew. Energy 2014, 71, 255–262. [Google Scholar] [CrossRef]
- Polo, J.; Bernardos, A.; Navarro, A.A.; Fernandez-Peruchena, C.M.; Ramírez, L.; Guisado, M.V.; Martínez, S. Solar resources and power potential mapping in Vietnam using satellite-derived and GIS-based information. Energy Convers. Manag. 2015, 98, 348–358. [Google Scholar] [CrossRef]
- Wang, S.; Zhang, L.; Fu, D.; Lu, X.; Wu, T.; Tong, Q. Selecting photovoltaic generation sites in Tibet using remote sensing and geographic analysis. Sol. Energy 2016, 133, 85–93. [Google Scholar] [CrossRef]
- Spyridonidou, S.; Sismani, G.; Loukogeorgaki, E.; Vagiona, D.G.; Ulanovsky, H.; Madar, D. Sustainable Spatial Energy Planning of Large-Scale Wind and PV Farms in Israel: A Collaborative and Participatory Planning Approach. Energies 2021, 14, 551. [Google Scholar] [CrossRef]
- Sánchez-Aparicio, M.; Del Pozo, S.; Martín-Jiménez, J.A.; González-González, E.; Andrés-Anaya, P.; Lagüela, S. Influence of lidar point cloud density in the geometric characterization of rooftops for solar photovoltaic studies in cities. Remote Sens. 2020, 12, 3726. [Google Scholar] [CrossRef]
- Tiwari, A.; Meir, I.A.; Karnieli, A. Object-based image procedures for assessing the solar energy photovoltaic potential of heterogeneous rooftops using airborne LiDAR and orthophoto. Remote Sens. 2020, 12, 223. [Google Scholar] [CrossRef]
- Prieto, I.; Izkara, J.L.; Usobiaga, E. The application of LiDAR data for the solar potential analysis based on urban 3D model. Remote Sens. 2019, 11, 2348. [Google Scholar] [CrossRef]
- Li, Y.; Liu, C. Estimating solar energy potentials on pitched roofs. Energy Build. 2017, 139, 101–107. [Google Scholar] [CrossRef]
- Karoui, M.S.; Benhalouche, F.Z.; Deville, Y.; Djerriri, K.; Briottet, X.; Houet, T.; Le Bris, A.; Weber, C. Partial linear NMF-based unmixing methods for detection and area estimation of photovoltaic panels in urban hyperspectral remote sensing data. Remote Sens. 2019, 11, 2164. [Google Scholar] [CrossRef]
- Malof, J.M.; Bradbury, K.; Collins, L.M.; Newell, R.G. Automatic detection of solar photovoltaic arrays in high resolution aerial imagery. Appl. Energy 2016, 183, 229–240. [Google Scholar] [CrossRef]
- Lecun, Y.; Bengio, Y.; Hinton, G. Deep learning. Nature 2015, 521, 436–444. [Google Scholar] [CrossRef]
- Ball, J.E.; Anderson, D.T.; Chan, C.S. Special Section Guest Editorial: Feature and Deep Learning in Remote Sensing Applications. J. Appl. Remote Sens. 2018, 11, 1. [Google Scholar] [CrossRef]
- Maxwell, A.E.; Warner, T.A.; Fang, F. Implementation of machine-learning classification in remote sensing: An applied review. Int. J. Remote Sens. 2018, 39, 2784–2817. [Google Scholar] [CrossRef]
- Yuan, Q.; Shen, H.; Li, T.; Li, Z.; Li, S.; Jiang, Y.; Xu, H.; Tan, W.; Yang, Q.; Wang, J.; et al. Deep learning in environmental remote sensing: Achievements and challenges. Remote Sens. Environ. 2020, 241, 111716. [Google Scholar] [CrossRef]
- Zhang, L.; Zhang, L.; Du, B. Deep Learning for Remote Sensing Data: A Technical Tutorial on the State of the Art. IEEE Geosci. Remote Sens. Mag. 2016, 4, 22–40. [Google Scholar] [CrossRef]
- Ma, L.; Liu, Y.; Zhang, X.; Ye, Y.; Yin, G.; Johnson, B.A. Deep learning in remote sensing applications: A meta-analysis and review. ISPRS J. Photogramm. Remote Sens. 2019, 152, 166–177. [Google Scholar] [CrossRef]
- Zhu, X.X.; Tuia, D.; Mou, L.; Xia, G.; Zhang, L.; Xu, F.; Fraundorfer, F. Deep Learning in Remote Sensing: A Comprehensive Review and List of Resources. IEEE Geosci. Remote Sens. Mag. 2017, 5, 8–36. [Google Scholar] [CrossRef]
- Garcia-Garcia, A.; Orts-Escolano, S.; Oprea, S.; Villena-Martinez, V.; Martinez-Gonzalez, P.; Garcia-Rodriguez, J. A survey on deep learning techniques for image and video semantic segmentation. Appl. Soft Comput. 2018, 70, 41–65. [Google Scholar] [CrossRef]
- Guo, Y.; Liu, Y.; Oerlemans, A.; Lao, S.; Wu, S.; Lew, M.S. Deep learning for visual understanding: A review. Neurocomputing 2016, 187, 27–48. [Google Scholar] [CrossRef]
- Liu, L.; Ouyang, W.; Wang, X.; Fieguth, P.; Chen, J.; Liu, X.; Pietikäinen, M. Deep learning for generic object detection: A survey. Int. J. Comput. Vis. 2020, 128, 261–318. [Google Scholar] [CrossRef]
- Yu, H.; Yang, Z.; Tan, L.; Wang, Y.; Sun, W.; Sun, M.; Tang, Y. Methods and datasets on semantic segmentation: A review. Neurocomputing 2018, 304, 82–103. [Google Scholar] [CrossRef]
- Lateef, F.; Ruichek, Y. Survey on semantic segmentation using deep learning techniques. Neurocomputing 2019, 338, 321–348. [Google Scholar] [CrossRef]
- Bradbury, K.; Saboo, R.; Johnson, T.L.; Malof, J.M.; Devarajan, A.; Zhang, W.; Collins, L.M.; Newell, R.G. Distributed solar photovoltaic array location and extent dataset for remote sensing object identification. Sci. Data 2016, 3, 1–9. [Google Scholar] [CrossRef]
- Jie, Y.; Ji, X.; Yue, A.; Chen, J.; Deng, Y.; Chen, J.; Zhang, Y. Combined Multi-Layer Feature Fusion and Edge Detection Method for Distributed Photovoltaic Power Station Identification. Energies 2020, 13, 6742. [Google Scholar] [CrossRef]
- Zhuang, L.; Zhang, Z.; Wang, L. The automatic segmentation of residential solar panels based on satellite images: A cross learning driven U-Net method. Appl. Soft Comput. J. 2020, 92, 106283. [Google Scholar] [CrossRef]
- Hou, X.; Wang, B.; Hu, W.; Yin, L.; Wu, H. SolarNet: A Deep Learning Framework to Map Solar Power Plants In China From Satellite Imagery. arXiv 2019, arXiv:1912.03685. [Google Scholar]
- Audebert, N.; Boulch, A.; Randrianarivo, H.; Le, B.; Ferecatu, M.; Lefèvre, S.; Marlet, R.; Audebert, N.; Boulch, A.; Randrianarivo, H.; et al. Deep learning for urban remote sensing. In Proceedings of the Joint Urban Remote Sensing Event (JURSE), Dubai, United Arab Emirates, 6–8 March 2017; p. Hal-01672854. [Google Scholar] [CrossRef]
- De Albuquerque, A.O.; de Carvalho Júnior, O.A.A.; de Carvalho, O.L.F.; de Bem, P.P.; Ferreira, P.H.G.; dos Santos de Moura, R.; Silva, C.R.; Trancoso Gomes, R.A.; Fontes Guimarães, R. Deep Semantic Segmentation of Center Pivot Irrigation Systems from Remotely Sensed Data. Remote Sens. 2020, 12, 2159. [Google Scholar] [CrossRef]
- De Carvalho, O.L.F.; de Carvalho Júnior, O.A.A.; de Albuquerque, A.O.; de Bem, P.P.; Silva, C.R.; Ferreira, P.H.G.; dos Santos de Moura, R.; Gomes, R.A.T.; Guimarães, R.F.; Borges, D.L.D.L. Instance Segmentation for Large, Multi-Channel Remote Sensing Imagery Using Mask-RCNN and a Mosaicking Approach. Remote Sens. 2021, 13, 39. [Google Scholar] [CrossRef]
- Drusch, M.; Del Bello, U.; Carlier, S.; Colin, O.; Fernandez, V.; Gascon, F.; Hoersch, B.; Isola, C.; Laberinti, P.; Martimort, P.; et al. Sentinel-2: ESA’s Optical High-Resolution Mission for GMES Operational Services. Remote Sens. Environ. 2012, 120, 25–36. [Google Scholar] [CrossRef]
- Ronneberger, O.; Fischer, P.; Brox, T. U-Net: Convolutional Networks for Biomedical Image Segmentation. In Lecture Notes in Computer Science; Including subseries Lecture Notes in Artificial Intelligence and Lecture Notes in Bioinformatics; Navab, N., Hornegger, J., Wells, W., Frangi, A., Eds.; Springer: Cham, Switzerland, 2015; Volume 9351, pp. 234–241. ISBN 9783319245737. [Google Scholar]
- Badrinarayanan, V.; Kendall, A.; Cipolla, R. SegNet: A Deep Convolutional Encoder-Decoder Architecture for Image Segmentation. IEEE Trans. Pattern Anal. Mach. Intell. 2017, 39, 2481–2495. [Google Scholar] [CrossRef]
- Lin, T.-Y.; Dollar, P.; Girshick, R.; He, K.; Hariharan, B.; Belongie, S. Feature Pyramid Networks for Object Detection. In Proceedings of the 2017 IEEE Conference on Computer Vision and Pattern Recognition (CVPR), Honolulu, HI, USA, 21–26 July 2017; pp. 936–944. [Google Scholar]
- Chen, L.-C.; Papandreou, G.; Kokkinos, I.; Murphy, K.; Yuille, A.L. DeepLab: Semantic Image Segmentation with Deep Convolutional Nets, Atrous Convolution, and Fully Connected CRFs. IEEE Trans. Pattern Anal. Mach. Intell. 2018, 40, 834–848. [Google Scholar] [CrossRef] [PubMed]
- Chen, L.-C.; Zhu, Y.; Papandreou, G.; Schroff, F.; Adam, H. Encoder-Decoder with Atrous Separable Convolution for Semantic Image Segmentation. Pertanika J. Trop. Agric. Sci. 2018, 34, 137–143. [Google Scholar]
- Zhao, H.; Shi, J.; Qi, X.; Wang, X.; Jia, J. Pyramid Scene Parsing Network. In Proceedings of the 2017 IEEE Conference on Computer Vision and Pattern Recognition (CVPR), Honolulu, HI, USA, 21–26 July 2017; pp. 6230–6239. [Google Scholar]
- He, K.; Zhang, X.; Ren, S.; Sun, J. Deep Residual Learning for Image Recognition. In Proceedings of the 2016 IEEE Conference on Computer Vision and Pattern Recognition (CVPR), Las Vegas, NV, USA, 27–30 June 2016; Volume 45, pp. 770–778. [Google Scholar]
- Xie, S.; Girshick, R.; Dollar, P.; Tu, Z.; He, K. Aggregated Residual Transformations for Deep Neural Networks. In Proceedings of the 2017 IEEE Conference on Computer Vision and Pattern Recognition (CVPR), Honolulu, HI, USA, 21–26 July 2017; pp. 5987–5995. [Google Scholar]
- Tan, M.; Le, Q.V. EfficientNet: Rethinking Model Scaling for Convolutional Neural Networks. arXiv 2019, arXiv:1905.11946. [Google Scholar]
- Yakubovskiy, P. Segmentation Models Pytorch. GitHub Repos. 2020. Available online: https://github.com/qubvel/segmentation_models.pytorch (accessed on 14 April 2021).
- Deng, J.; Dong, W.; Socher, R.; Li, L.-J.; Li, K.; Li, F.-F. ImageNet: A large-scale hierarchical image database. In Proceedings of the 2009 IEEE Conference on Computer Vision and Pattern Recognition, Miami, FL, USA, 20–25 June 2009; pp. 248–255. [Google Scholar]
- Yuan, J.; Yang, H.H.L.; Omitaomu, O.A.; Bhaduri, B.L. Large-scale solar panel mapping from aerial images using deep convolutional networks. In Proceedings of the 2016 International Conference on Big Data, Washington, DC, USA, 5–8 December 2016; pp. 2703–2708. [Google Scholar] [CrossRef]
- Yu, J.; Wang, Z.; Majumdar, A.; Rajagopal, R. DeepSolar: A Machine Learning Framework to Efficiently Construct a Solar Deployment Database in the United States. Joule 2018, 2, 2605–2617. [Google Scholar] [CrossRef]
- De Bem, P.P.; de Carvalho Júnior, O.A.; de Carvalho, O.L.F.; Gomes, R.A.T.; Fontes Guimarães, R.; Guimarães, R.F. Performance Analysis of Deep Convolutional Autoencoders with Different Patch Sizes for Change Detection from Burnt Areas. Remote Sens. 2020, 12, 2576. [Google Scholar] [CrossRef]


| Set | Number of Areas | Number of Images |
|---|---|---|
| Train | 15 | 210 (75%) |
| Validation | 5 | 40 (14.28%) |
| Test | 4 | 30 (10.71%) |
| Prediction | |||
| 0 | 1 | ||
| Ground truth | 0 | TN | FP |
| 1 | FN | TP | |
| Architecture | Backbone | Accuracy (%) | IoU (%) | F-Score (%) | Epoch Period (s) |
|---|---|---|---|---|---|
| U-net | Eff-b7 | 98.08 | 91.17 | 95.38 | 12 |
| Eff-b0 | 98.05 | 90.97 | 95.27 | 5 | |
| R-101 | 97.96 | 90.58 | 95.06 | 5 | |
| R-50 | 97.98 | 90.70 | 95.12 | 4 | |
| DeepLabv3+ | Eff-b7 | 97.83 | 89.98 | 94.73 | 26 |
| Eff-b0 | 97.77 | 89.82 | 94.64 | 5 | |
| R-101 | 97.46 | 88.47 | 93.88 | 7 | |
| R-50 | 97.02 | 86.63 | 92.84 | 6 | |
| PSPNet | Eff-b7 | 97.35 | 88.03 | 93.64 | 5 |
| Eff-b0 | 96.73 | 85.43 | 92.14 | 3 | |
| R-101 | 97.06 | 86.98 | 93.04 | 3 | |
| R-50 | 97.23 | 87.60 | 93.39 | 3 | |
| FPN | Eff-b7 | 97.38 | 87.99 | 93.61 | 12 |
| Eff-b0 | 97.45 | 88.21 | 93.73 | 5 | |
| R-101 | 97.58 | 89.21 | 94.30 | 6 | |
| R-50 | 97.25 | 87.74 | 93.47 | 5 |
| Stride | ROC AUC | PR AUC | Processing Time (s) |
|---|---|---|---|
| 8 | 99.42 | 97.85 | 2829 |
| 16 | 99.25 | 97.56 | 734 |
| 32 | 98.89 | 96.99 | 193 |
| 64 | 98.66 | 96.42 | 63 |
| 128 | 98.36 | 95.39 | 15 |
| 256 | 98.16 | 94.49 | 4 |
Publisher’s Note: MDPI stays neutral with regard to jurisdictional claims in published maps and institutional affiliations. |
© 2021 by the authors. Licensee MDPI, Basel, Switzerland. This article is an open access article distributed under the terms and conditions of the Creative Commons Attribution (CC BY) license (https://creativecommons.org/licenses/by/4.0/).
Share and Cite
Costa, M.V.C.V.d.; Carvalho, O.L.F.d.; Orlandi, A.G.; Hirata, I.; Albuquerque, A.O.d.; Silva, F.V.e.; Guimarães, R.F.; Gomes, R.A.T.; Júnior, O.A.d.C. Remote Sensing for Monitoring Photovoltaic Solar Plants in Brazil Using Deep Semantic Segmentation. Energies 2021, 14, 2960. https://doi.org/10.3390/en14102960
Costa MVCVd, Carvalho OLFd, Orlandi AG, Hirata I, Albuquerque AOd, Silva FVe, Guimarães RF, Gomes RAT, Júnior OAdC. Remote Sensing for Monitoring Photovoltaic Solar Plants in Brazil Using Deep Semantic Segmentation. Energies. 2021; 14(10):2960. https://doi.org/10.3390/en14102960
Chicago/Turabian StyleCosta, Marcus Vinícius Coelho Vieira da, Osmar Luiz Ferreira de Carvalho, Alex Gois Orlandi, Issao Hirata, Anesmar Olino de Albuquerque, Felipe Vilarinho e Silva, Renato Fontes Guimarães, Roberto Arnaldo Trancoso Gomes, and Osmar Abílio de Carvalho Júnior. 2021. "Remote Sensing for Monitoring Photovoltaic Solar Plants in Brazil Using Deep Semantic Segmentation" Energies 14, no. 10: 2960. https://doi.org/10.3390/en14102960
APA StyleCosta, M. V. C. V. d., Carvalho, O. L. F. d., Orlandi, A. G., Hirata, I., Albuquerque, A. O. d., Silva, F. V. e., Guimarães, R. F., Gomes, R. A. T., & Júnior, O. A. d. C. (2021). Remote Sensing for Monitoring Photovoltaic Solar Plants in Brazil Using Deep Semantic Segmentation. Energies, 14(10), 2960. https://doi.org/10.3390/en14102960