Abstract
Energy poverty is a problem that affects all member states of the European Union to a varying degree, including Poland, where about 9% of the population is at risk of energy poverty. The article aims to show the changes in energy poverty in Poland in 2010–2018. The specific goal, however, is to evaluate government measures aimed at reducing energy poverty through investments based on renewable energy sources. To present changes in the level of energy poverty in 2010–2018, the authors proposed a new synthetic measure that unifies several different measures used by researchers and allows for a comprehensive assessment of this phenomenon. The conducted research showed that in 2010–2018 there was a slow but visible decrease in the level of energy poverty in Poland. In addition, the article indicates investments in renewable energy sources that may have a positive impact on reducing the scale of energy poverty in Poland. The programs implemented with national and EU public funds, which finance investments in renewable energy sources in Poland, are also presented.
1. Introduction
Research on energy poverty conducted in the region of Central and Eastern Europe is an extremely important issue. The article is an important voice in the analysis of this phenomenon, because Poland, like other countries in this region, is characterized by frosty winters, which means that energy security related to heating the apartment at an appropriate level is of particular importance. In addition, in Poland, as in other countries of Central and Eastern Europe, the consequences of a centrally planned economy can also be observed, such as dependence on polluting energy sources, the dominance of coal in energy production, ineffective housing resources and heating systems, and a small share of RES in energy production [1]. In addition, the main goal of the EU climate policy is to achieve at least 32% share of energy from renewable sources in total energy consumption by 2030. Undertaking intensive activities in this area is the last moment that allows achieving or at least getting closer to this goal. The above premises make the importance of renewable energy sources in reducing energy poverty in Poland a particularly important issue.
Energy poverty is a problem that, to varying degrees, affects all member states of the European Union [2,3,4,5,6], including Poland, where, according to the “high costs–low income” indicator, popular in international practice, energy poverty affects about 9% of citizens. Most of the people affected by energy poverty live in rural areas and small towns, usually in single-family houses, and use a solid fuel boiler or stove as their primary heat source. The social group most exposed to energy poverty is Polish farmers. One in three of them is energy-poor and they make up almost a fifth of all those affected by the problem. Rural residents, including farmers, usually live in single-family houses, characterized by low energy performance (non-insulated walls and roofs, improperly sealed windows, old stoves) and large floor area, which contributes to energy poverty. Energy poverty also significantly affects Polish pensioners and disability pensioners (together they represent 25% of all people affected by energy poverty), namely the elderly [7].
The aim of the paper is to show the changes in the phenomenon of energy poverty in Poland over the period of 2010–2018. However, the specific objective is to assess the government’s efforts to reduce the phenomenon of energy poverty through investments based on renewable energy sources. The issues discussed in this paper are important for several reasons. Primarily, the problem of energy poverty is important in terms of economy, energy security and social security, as well as in terms of the health of those affected.
The added value of the article is the development of a synthetic indicator that unifies several different measures used by researchers and allows for a comprehensive assessment of the phenomenon of energy poverty. Based on the literature review and their research, the authors formulated the concept of energy poverty in terms of micro and macroeconomics. It can be used for research conducted in other countries. Another important issue raised in the article is air pollution and smog. The burning of low-quality fuels and municipal waste is the main factor responsible for air pollution in Poland. The Polish energy sector, based primarily on domestic hard coal and lignite deposits, is one of the most expensive ones and deviating from European trends. This can be attributed to the insufficient use of renewable energy sources and low social awareness of energy poverty prevention. Following the above, the direction of changes that should be taken by the authorities in order to reduce energy poverty in Poland was proposed.
1.1. Definition of the Energy Poverty Phenomenon and Methods of Its Measurement
The existence of worldwide energy poverty poses a major challenge to the global energy system [8]. Energy poverty is a problem related to income situation, inadequate house quality and energy prices. To date, no single definition or indicator to measure energy poverty has been developed. EU Energy Poverty Observatory [9] defines energy poverty as lacking the basic energy needs of households. Bouzarovski also (2013) stated that energy poverty should be understood as the inability of a household to provide the required level of energy services in the home [10]. Fuel poverty is the difficulty that households face in maintaining adequate temperature in the home, as well as in using other basic energy services in homes [11]. When defining the concept of energy poverty, it can be stated that it means the lack of sufficient choice in access to proper, cheap, reliable, high-quality, secure and environmentally friendly energy services [12,13]. The lack of access to energy may mean deprivation not only of basic household services, such as cooking and heating in the home but also other possibilities such as access to education, health or information. A vital element is the reliability of the technologies used, guaranteeing a continuous supply of electricity. Technologies should also be environmentally friendly and should not contribute to the excessive extraction of existing resources at the same time having a negative impact on the environment. In the context of increasing climate change and too extensive use of resources, the utilisation of renewable energy sources can prove to be extremely important. The causes of energy poverty vary depending on the level of development of a country. Namely, in developed countries, there is a situation characterised by high energy costs [14,15,16] while in developing countries, there is no access to modern energy [17,18]. Energy poverty, which is reflected, among others, in the inadequate heating of spaces and the consequent development of harmful microorganisms, etc., results in a greater likelihood of respiratory diseases, allergies (in the case of excessively humid and mouldy homes), hormonal disorders, cardiovascular disorders and deterioration of mental well-being [19,20,21,22]. Resolving the problem of energy poverty, or at least reducing it, would largely contribute to reducing expenditure on medical treatment for citizens, a better quality of life or increased economic activity. It is estimated that over 50 million households in the European Union are affected by energy poverty [14].
Interesting research is conducted on energy poverty and gender inequality. Women are more often concerned with the problem of energy poverty than men, but women are more often interested in modern energy [23,24,25]. Energy poverty is closely related to income poverty. The people most at risk of energy poverty are the poor and this problem is seen all over Europe. According to studies by Bouzarowski, 64.5% of Bulgarian households in 2010 were unable to keep their home “sufficiently warm”, while 32.1% said they had arrears in paying for utilities [1]. Energy poverty, and thus difficult housing conditions, insufficient heating of the apartment or the lack of access to electronic devices, may be one of the many reasons for the stigmatization of certain national and social groups, such as Romani people living in many countries, e.g., Hungary or Romania [26,27].
Energy poverty also affects life satisfaction and the environment [28]. Energy consumption in homes contributes to the quality of life of households through lighting, cooking, heating and cooling [29]. However, increasing energy consumption levels can be contrary to the need to reduce carbon dioxide levels, thus using renewable energy sources can be an ideal solution to this problem.
There are three types of causes of energy poverty that are being indicated [30]:
- Technical causes—they occur when a residence has a low level of energy efficiency, making it more expensive to maintain an optimal standard of heat. Another cause of a technical nature is the malfunctioning of heating systems, not allowing the home to be properly heated. Higher energy consumption for heating entails higher expenditure and thus reduced possibilities of financing other expenses, often of a living nature.
- Economic causes—they occur when financial resources are too low, which can lead to arrears on energy bills, cutting off energy supply or saving on heating to reduce the cost of energy bills.
- Causes related to attitudes towards efficient and proper use of energy—they occur when improper use of appliances leads to significant energy losses and consequently increased energy expenses, higher than what the household can afford.
Based on the literature review and their research, the authors formulated the concept of energy poverty in terms of micro and macroeconomics. In microeconomic terms, energy poverty can be defined as the failure to meet the energy needs of the household, which negatively affects the quality of family life. In macroeconomic terms, energy poverty contributes to environmental pollution, which causes negative social, economic, and health problems for citizens.
In addition to defining energy poverty, it is necessary to refer to the determinants and indicators measuring its level [31,32]. Studies showing levels of energy poverty regarded both individual countries [33] and the EU as a whole [34]. EU member states are required to assess the scale of energy poverty in their country. In 1991, B. Boardman [11] formulated the following definition: “energy poverty occurs when a household does not receive adequate energy services for 10% of its income”. The definition of B. Boardman is based on the definition adopted for national use by the UK, which is a precursor in research on energy poverty. The 10% measure was used in energy poverty research by Heindl and Schüssler [35], Phimister et al. [36], Okushima [37] and Pachauri et al. [38]. In Poland, the first nationwide research on energy poverty based on the British absolute definition of “10% of income” was carried out by Kurowski [39].
In 2012, a landmark report by J. Hills, commissioned by the UK Department of Energy and Climate Change (DECC), was published and has contributed to changing the definition and measures of energy poverty in the United Kingdom. The definition of energy poverty in the Hills report has been formulated as follows: “households are considered energy poor” if:
- their energy costs are above the median cost for all households and
- if they bore them at that level the rest of their disposable income would be below the official poverty line [40].
One measure of energy poverty is subjective indicators based on respondents’ personal opinions, interpretations, viewpoints and judgements. They are generally constructed on the basis of answers given by household members to questions included in a survey conducted by social researchers (e.g., is the home warm enough in winter?). Subjective variables were used, among others, by Gordon et al. [41], Healy and Clinch [16], Healy [42], Petrova et al. [43] or Thomson and Snell [34].
According to the European Energy Poverty Observatory, the main indicators of energy poverty are: low absolute energy consumption, arrears on utility bills, spending a high proportion of income on energy and the inability to maintain an adequate temperature in the home [44].
In recent publications on energy poverty, authors and researchers also present more complex measures of energy poverty, designed as a compromise between the simplicity of unidimensional indicators and the need to take account of the multidimensional nature of the energy poverty problem. They are an attempt to overcome the shortcomings of unidimensional indicators and at the same time, they produce a result that condenses the information into single values that are easy to interpret [45].
Energy poverty is also measured using Chakravarty and D’Ambrosio’s poverty measures [46]. It is this methodology that was the foundation for many studies measuring energy poverty according to a multidimensional framework. Nussbaumer et al. developed the Multidimensional Energy Poverty Index (MEPI) that takes into account both the occurrence and intensity of energy poverty and provides a new tool to support policy making [47]. Bouzarovski and Tirado Herrero [48] developed an energy poverty index that took into account the EU-SILC population percentages of people who have reported (i) being unable to keep their homes adequately warm (Inability); (ii) having arrears in utility bills (Arrears); and (iii) living in a home with a leaking roof, or the presence of damp and rot (Housing faults): Energy poverty index = (0.5 × % Inability + 0.25 × % Arrears + 0.25 × % Housing faults) × 100.
The energy poverty index proposed by Alkire and Foster [49] takes into consideration five dimensions of energy deprivation: two objective indicators “low income, high costs” and “high share of energy expenditure in income”, as well as three subjective indicators: “inability to keep the home adequately warm”, “presence of leaks, damp, or rot” and “difficulties paying utility bills”. Households that experience at least two forms of deprivation are considered energy-poor. Using the methodology proposed by Alkire and Foster, based on the Household Budget Survey, a multidimensional energy poverty index for Poland was developed [50]. Szamrej-Baran [51] also used a multidimensional approach in conducting her research on energy poverty in Poland.
1.2. Investment in Renewable Energy Sources in the Context of Caring for the Environment and Counteracting Energy Poverty
Studies on the relationship between energy poverty and renewable energy sources carried out by researchers from many countries indicate the great importance of renewable energy sources in combating energy poverty [52]. Even if it may seem expensive to some economic experts, access to energy sources of all kinds brings social benefits, improving the quality of life—which in this case is a real victory in the fight against energy poverty. Poles are already bearing enough costs by paying with their deteriorating health and feeling the effects of climate change. Renewable energy is one of the crucial elements of sustainable development, and in protecting and improving air quality [53,54,55].
Generation of energy from renewable sources is an important part of the efforts to lower carbon intensity as well as to diversify energy and meet the growing demand therefor. It is an expression of care for the natural environment and a response to the need to promote sustainable development and enhance the strength of regions and local communities in the European Union [56]. Sustainable energy is the golden thread that will wave environmental sustainability [57]. Investments in renewable energy sources can lower energy costs and thus reduce the scale of energy poverty [58]. Energy generated from renewable sources is called “fuel of the future”. Research shows that the production of renewable energy is associated with a positive and statistically significant impact on economic growth in both developed and developing countries [59]. As part of its climate policy until 2030, the European Union plans to achieve the following targets [60]:
- reducing greenhouse gas emissions by at least 40% with respect to 1990 (in the sectors covered by the EU ETS Directive (including energy and district heating sectors) the reduction is to be 43% compared to 2005);
- improving energy efficiency by 32.5% compared to the 2007 forecast;
- increasing the share of renewable energy in gross final energy consumption in the European Union to 32%.
This trend shows that Europe will seek to reduce the use of natural resources (including coal and oil) in favour of developing alternative sources. Failure to comply with EU requirements may lead to higher electricity and heat prices. Financial penalties imposed by the European Commission can be expected if EU member states fail to meet the targets of the climate and energy package. Within the framework of achieving the EU-wide target for 2030, Poland declares achieving 21–23% share of RES in gross final energy consumption (total consumption in electricity, district heating and cooling sectors, and for transport purposes) by 2030.
Eurostat data shows that in 2018 in Poland, the share of renewable energy in the consumption of electricity, heat and in transport was 11.3% (Figure 1). This was an increase of 2 p.p. compared to the index in 2010 (9.3%).
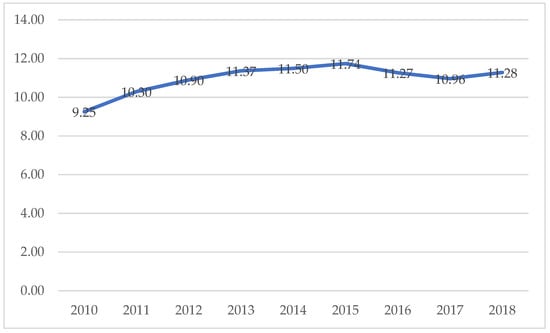
Figure 1.
Share of energy from renewable sources [%]. Source: Eurostat.
In the structure of energy consumption by households in Poland, solid fuels, mainly hard coal (which is an exception in the European Union) and firewood, are of the greatest importance. They were most often used for space heating (by 45.4% of households). Firewood was used by 29.9% of households—it was the only renewable energy carrier massively used in households. It was usually burnt in the same boilers and stoves as hard coal, either simultaneously with coal or alternatively. In addition to firewood, households also consumed other types of biomass, but the prevalence of their use was much lower than firewood [61].
In the case of renewable energy, households had a 52.8% share of domestic wood consumption, and geothermal energy, including heat from heat pumps—71.4%. In 2018, a small group of households was equipped with solar panels (1.77%), and the quantity of solar energy obtained in this way compared to the total national solar energy consumption accounted for 60.0%. Solar collectors were used by one household in 52 and heat pumps by only one in 200 [61].
The increase in solar and geothermal energy consumption shows that solar equipment and heat pumps are used more increasingly for space heating (Table 1).

Table 1.
Consumption of individual renewable energy carriers in households in Poland, in 2010–2018.
Only a small number of households, just 4.8%, install devices for their own energy production (solar collectors, heat pumps). Only 7.2% of households considered the issue of self-generation of energy for their own needs, where the following financial support opportunities were taken into account when deciding on such a solution: subsidies for the purchase or construction of generating plant, subsidised loan or attractive price at which generators will be able to sell electricity [61].
Renewable energy is becoming an increasingly competitive way to meet new power generation needs. Renewable power generation costs have fallen sharply over the past decade, driven by steadily improving technologies, economies of scale, competitive supply chains and growing developer experience. The International Renewable Energy Agency notes in its latest report titled “Renewable Power Generation Costs in 2019” another decrease in wind and solar energy generation costs. The costs of all commercially available renewable energy generation technologies have fallen in 2019. Solar and wind power costs have continued to fall, complementing the more mature bioenergy, geothermal and hydropower technologies. Solar photovoltaics (PV) shows the sharpest cost decline over 2010–2019 at 82%, followed by concentrating solar power (CSP) at 47%, onshore wind at 40% and offshore wind at 29%. Continuing cost declines confirm that competitive renewables are a low-cost climate and decarbonisation solution that aligns short-term economic needs with medium- and long-term sustainable development goals [62]. According to the International Renewable Energy Agency, the average energy production costs of more than half of the wind and solar plants built in 2019 are lower than the costs of energy generation of even the least expensive new coal-fired plants. As shown by the calculations of Mrowiec [63], in Poland, taking into account the LCOE (Levelized Cost of Electricity), the lowest energy production costs are achieved by onshore wind power plants. On the other hand, when analysing the years 2010–2018, there is a tendency to decrease the average unit cost of electricity obtained from renewable energy sources. This is particularly evident in photovoltaic investments, which are becoming increasingly cost-competitive.
2. Materials and Methods
The research material used as the basis for the calculation of the indicators was statistical data from GUS, from household budget surveys in 2010–2018. Statistical data analyses were carried out using Excel and Python.
In order to achieve the research objective and accomplish the tasks presented in the paper, the researchers had to apply a number of measures and statistical methods to calculate the synthetic measure of energy poverty, i.e., the synthetic indicator method, such as the Principal Components Analysis (PCA), which involves the reduction of a large number of variables to a few uncorrelated factors that retain as much as possible of the information about the phenomenon under study contained in the primary variables [64]. Poland was chosen as the research object, where studies on energy poverty in the EU measured using indirect measures confirm that Poland belongs to the group of countries affected by this problem to a greater extent than other countries [10,48]. This can be attributed not only to the socio-cultural environment but also to the spread of income poverty or the significant burden on household budgets with energy. Research shows that energy poverty in the Central and Eastern Europe region is widespread and depends on economic, socio-political and environmental issues [65,66].
Collecting information on energy poverty is part of the reporting obligations of European Union Member States resulting from the Regulation of the European Parliament and of the Council on the Governance of the Energy Union [67]. Energy poverty occurs when a household is unable to afford adequate heating, cooling, lighting and energy to run appliances as a result of a combination of low income, high energy expenditure and poor energy performance of the building.
The most commonly used indicators to measure the level of energy poverty include [51,61]:
- Low Income, High Cost (LIHC)—high required energy costs (i.e., above the national median level) and low income (i.e., disposable income below the officially defined poverty line).
- Double median energy expenditure (2M)—the share of actual energy expenditure in income is higher than the double median of this value in the population.
- Ability to pay bills on time (Bills)—Problems with arrears on energy bills or inability to pay them.
- A building with a leaking roof, damp walls, floors, foundations, rotting windows or floors (Leaks)—problems with the condition of the building.
- Inadequate thermal comfort (Thermal)—a declared inability to sufficiently heat the house/flat.
During the period analysed by the authors, all these five measures of energy poverty had a decreasing trend [61]. The highest value was taken by the double median energy expenditure, according to which in 2018, 17.2% of households were energy poor, which means a decrease of 2.3 percentage points from 2012. The second of the objective indicators—Low Income, High Costs—which includes both the technical condition of buildings by determining the required energy costs and the material status by including income, decreased from 11.1% in 2012 to 9.4% in 2018. The main reason for this state of affairs can be found in the improving material situation of society as a result of economic development and social policy. Subjective indicators that also relate to the quality (severity) of energy poverty include the ability to pay bills on time—only a small percentage (1.7% in 2018) of households were unable to pay bills on time. The two indicators relating to the technical and functional qualities of buildings (buildings with a leaking roof and insufficient thermal comfort), took a similar value, which in 2018 was 8.2% and 10.7%, respectively [61].
The choice of a set of indicators describing the level of energy poverty is a challenge similar to that of defining energy poverty: on the one hand, the indicators should take into account the multidimensional aspect of energy poverty and, on the other hand, they should allow for efficient and relatively simple planning and application of energy policies.
The authors of the paper decided to build a synthetic measure of energy poverty in order to show a comprehensive description of the energy poverty phenomenon. The differences between the levels of individual indicators are really big and there are even several percentage points of discrepancy between them. Composite measures are easier to assess the extent of energy poverty. Synthetic measures unify several different measures and allow for a full evaluation of the phenomenon. This is particularly important in the case of energy poverty, as many indicators are used that measure the scale of the phenomenon in different ways, some may show an increase and others a decrease, depending on the methodology used. The choice of indicators for constructing a synthetic measure of energy poverty was based on a review of scientific literature, a review of relevant methodologies and an assessment of data that is available in Polish and European datasets. On this basis, the authors chose the energy poverty indicator that took into account the EU-SILC population percentages of people who have reported:
- being unable to keep their homes adequately warm (Inability);
- having arrears in utility bills (Arrears);
- living in a home with a leaking roof, or the presence of damp and rot (Housing faults).
Figure 2 shows the changes in these three indicators in 2010–2018 for Poland. For the period under analysis, a decreasing trend can be seen for the Arrears indicator, while the other two have varied significantly over the period.
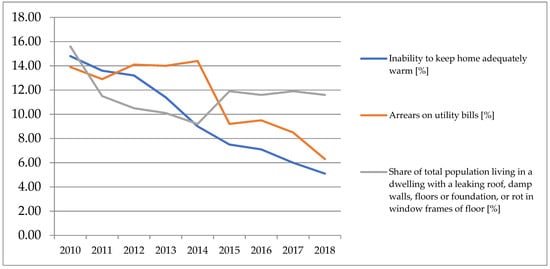
Figure 2.
Selected energy poverty indicators for Poland in 2010–2018. Source: Eurostat.
Poland pursues an active climate and energy policy and takes measures in all dimensions of the energy union. The Polish power system is one of the largest within the European Union (it ranks in the top ten in terms of the main macro-energy indicators.
The basis for the production of electricity in Poland is hard coal and lignite, which ensure an adequate level of energy security and stability of generation, but is one of the more expensive sources of energy and deviates from European trends. At present, about 77% of electricity in Poland is produced from hard coal and lignite. Due to the decommissioning of worn-out generating units, the need to meet restrictive environmental protection requirements and the deteriorating market situation (including, above all, an increase in CO2 emission allowance prices), the share of coal in the electricity generation structure will systematically decrease. The target assumes the reduction of the share of coal in electricity generation to 56–60% by 2030 [68].
Changes in the domestic power sector result in an increased share of renewable energy sources (RES) in the structure of capacities installed in the National Power System (NPS) and in electricity generation. In 2018, the share of RES in electricity generation was 12.7%. The installed capacity of renewable source-based generation in 2018 increased to about 8.5 GW of the total installed capacity in the NPS at a level of about 44.3 GW in 2018. Over the period 2010–2018, the installed RES capacity increased fourfold and the electricity generation from these sources doubled. In 2018, Poland surpassed 16 EU countries in the volume of installed capacity in RES. The main objective of the state energy policy is energy security, while ensuring competitiveness of the economy, energy efficiency and reducing the environmental impact of the energy sector, with the optimum use of own energy resources.
3. Results
3.1. The Level of Energy Poverty in Poland—A Synthetic Measure of Energy Poverty
Before proceeding to the calculation of the synthetic measure of energy poverty, a preliminary analysis of the descriptive statistics of the studied variables was carried out (Table 2). During the study period (2010–2018), the average percentage of people reporting an inability to adequately heat their home was 9.74%, the percentage of people in arrears on utility bills was 11.42%, and the percentage of the population living in homes with a leaking roof, damp walls, floors or foundations, or rot in window frames was 15.4%. Based on standard deviations, coefficients of variation (V) were calculated, ranging from 36.9% for the first indicator to 15.4% for the last indicator. This shows that the indicators are characterized by moderate or fairly low variability.
Table 2.
Descriptive statistics of the variables used to measure energy poverty levels.
Then, the linear correlation coefficients between the indicators were calculated. Based on the graph shown above, one would expect a fairly strong dependency between the first and second indicators, with a lower dependency with the third one. This is confirmed by the linear correlation coefficients (Table 3). For the first two indicators, the correlation is 0.85, which means that the indicators are highly correlated with each other and show similar directions of change. This is different for the third indicator, which is fairly low correlated with the other two. Therefore, it can be considered that it describes slightly different aspects of energy poverty (the first two are more strongly related to income and wealth levels, while the second indicator measures the quality of housing infrastructure, which is not subject to the same dynamics as income).
Table 3.
Correlation matrix between input indicators of energy poverty.
When constructing the synthetic indicator, the indicator proposed by Bouzarovski and Tirado Herrero [48] was adopted as a baseline version, which is a weighted average of three indices. As a result, this indicator (S1) is calculated as:
where I1, I2, I3 are the individual indicators from Table 4.
S1 = (I1 + I2 + I3)/3
This method can be modified by giving different weights to the different input indicators. There are various methods for calculating these weights. One is to relate the weights to the inverse of the multiple correlation coefficient. In this method, the weight of an individual indicator is inversely proportional to the indetermination coefficient in the models explaining that individual indicator with the other indicators. An approach similar to the VIF (Variance Inflation Factor) is used here. As a result, more weight is given here to the indicator that is less related to the others.
where
where R2 is the determination coefficient
S2 = a1I1 + a2I2 + a3I3
ai = (1 − R2i)/(3 − R21–R22–R23)
The following results were obtained in the case analysed here:
Table 4.
Determination and indetermination coefficients used to construct synthetic indicator S2.
Table 4.
Determination and indetermination coefficients used to construct synthetic indicator S2.
| I1 | I2 | I3 | |
|---|---|---|---|
| R2 | 0.863 | 0.855 | 0.522 |
| 1−R2 | 0.137 | 0.145 | 0.478 |
| waga | 0.180 | 0.190 | 0.630 |
Source: own calculations.
Another variant of the weighted average method is where the weight of a given indicator is related to the share of its variance in the total variance of the set. It is worth noting here that the variables should be expressed on the same scale (have the same range of variation, and thus similar variances). In the case analysed here, this requirement is met (the variables are percentages of the population), if it were not met, some type of scaling would be required. Thus, the indicator takes the form of:
where
S3 = a1I1 + a2I2 + a3I3
ai = var(Ii)/(var(I1) + var (I2) + var(I3))
The following results were obtained in the analysed case (Table 5):
Table 5.
Variances and weights used to construct synthetic indicator S3.
The third, and most advanced method, is to extract common information from all factors using the principal components approach (PCA). The method consists of linear transformation of the input variable matrix in such a way as to create synthetic indicators (components) of maximum variance of the input set and maximally uncorrelated with each other. First, the number of components to extract must be determined. It is determined by analysing the stock of extracted common variability. The results are shown in Table 6.
Table 6.
Extracted variance values for each component.
The first component (PC 1) explains 81.2% of the input set, which is a high indication, so it can be considered that one component is sufficient to capture most of the information of the set.
The calculation of the individual indicator weights in the formation of the component is shown in Table 7. There is a strong association with the first two indicators and a weaker association with the third one.
Table 7.
Charges for the PCA method.
In the next step, the comparison of all obtained energy poverty indicators can be carried out. In order to better compare them, they were all corrected by the mean (i.e., the mean values were subtracted), resulting in centering around zero. Table 8 presents the numerical values of the indicators, while their evolution is shown in Figure 3.
Table 8.
Synthetic poverty indicators S1–S4 and individual input indicators.
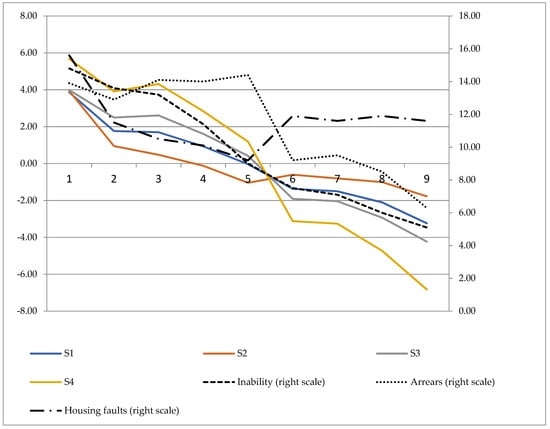
Figure 3.
Crude and synthetic indicators of energy poverty. Source: own calculations.
It can be observed that indicators S1 and S3 show a very similar pattern. Indicator S4 shows a more dynamic decline in energy poverty (it is more strongly related to indicators I2 and I1). Indicator S2, on the other hand, shows a weaker decline in poverty (through a stronger link with indicator I3). Thus, it seems that indicators S2 and S3 are the most balanced for the studied set.
Synthetic indicators S2 and S3 of energy poverty show a slow but visible decline in the level of energy poverty over the study period.
3.2. Methods for Reducing Energy Poverty in Poland
As part of the “Clean Energy for All Europeans” package, the European Commission has proposed a series of measures to combat energy poverty through energy efficiency, securing against disconnection and better definition and monitoring of the problem at a member state level through integrated national energy and climate plans [69].
Research has shown that in recent years there has been a decline in energy poverty indicators, which means a reduction in the number of households at risk of energy poverty in Poland. However, with the current situation resulting from the COVID-19 pandemic, the reduction or even loss of income, the loss of many jobs, it may turn out that the problems of energy poverty will continue to affect many households. Therefore, it should be emphasised that counteracting energy poverty in Poland requires actions on the part of the government administration, in particular by providing an institutional framework and financing allowing communes to assess the technical condition of flats and buildings, providing energy advice and planning and implementing thermal modernisation measures.
Measures to counteract energy poverty in Poland include the government’s “Czyste powietrze” Programme, implemented in 2017 and aimed directly at the group of energy-poor households (Table 9). Measures under the Programme include: stricter regulations concerning the quality of solid fuels, stricter regulations concerning the standards of boilers for solid fuels, a program for thermal modernisation of single-family houses, income tax relief for thermal modernisation investments. By 11 December 2020, a total of over 155 thousand agreements on investment co-financing were signed under the Programme, for the amount of PLN 2.7 billion [70]. Further support programmes are still under discussion in central public administration. They are aimed at reducing air pollution (popularly known as smog), which has been publicised by numerous non-governmental organizations, above all, including numerous local smog alerts. As Owczarek’s research has shown, smog is closely related to the phenomenon of energy poverty in Poland [71]. The link is that buildings with poor energy performance need more fuel to heat—mainly coal supplemented by firewood. Often, however, the problem lies in the fact that the energy-poor cannot afford to buy enough fuel, so they supplement (or even completely replace) the full-value fuel with rubbish or, e.g., wood waste collected in the immediate vicinity of the house.
Table 9.
Instruments for combating energy poverty used in Poland.
The objective of government action in the context of smog and energy poverty is to eliminate the burning of rubbish and reduce the burning of wood waste, as well as to improve the energy performance of buildings to keep fuel consumption as low as possible (which would generate fewer costs and thus reduce the scale of energy poverty) or to lead to a situation where the burning of fuel for heating is as little harmful to the environment as possible (e.g., by connecting to a district heating network powered by combined heat and power plants using advanced technologies allowing for a significant reduction of harmful substances when burning coal). Therefore, to a large extent, the fight against air pollution and energy poverty should be pursued through integrated public policy instruments [19].
The burning of low-quality fuels and municipal waste (even rubbish) and the use of low-quality boilers are the main factors responsible for air pollution in Poland [56,72]. The situation is aggravated by the low energy performance of buildings and efficiency of heating systems, which impose much higher fuel consumption (in Poland, it is mainly coal). This state of affairs can be attributed to the insufficient use of renewable energy sources and low social awareness of energy poverty prevention. Particulate matter, which is a measure of air pollution, is produced, among others, by the burning of solid fuels in households [73]. The complex interactions between residential energy consumption, climate change and thermal performance of buildings in Eastern Europe have been identified in studies by Urge-Vorsatz and Tirado-Herrero [74].
To significantly reduce the scale of energy poverty in Poland, and thus meet the limits resulting from air pollution, public policy instruments should be directed towards the diversification of energy sources and investments in renewable energy sources, especially generating electricity for own needs in its place. consumption, i.e., in households, which improves energy security.
Many factors contribute to the favorable conditions for the development of renewable energy sources. Some of them are various financial instruments such as loans, grants, and others. Until now, the most important source of financing for small-scale RES investments in Poland has been the EU structural funds managed at the level of individual regions. ROPs, or Regional Operational Programs, are co-financed from two funds: ERDF—European Regional Development Fund and ESF—European Social Fund and from national funds. ROPs are aimed at the development of, inter alia, energy that uses renewable energy sources (RES) in many dimensions, including energy production, effective distribution, support for enterprises operating in the field of servicing the renewable energy sector, and others. Photovoltaic prosumer installations are the most popular technology supported in Regional Operating Programs.
Taking into account the climatic conditions in Poland, the following can be used in single-family houses: solar collectors to heat utility water, photovoltaic cells or home wind farms generating electricity, biomass boilers or heat pumps used in the heating system, wastewater heat recovery system, ground heat exchangers and the so-called hybrid solutions, combining various RES [75]. Solar collectors recover heat energy by heating the medium (e.g., glycol) with sunlight. This energy is sufficient to heat domestic water. When designing an installation based on solar collectors, it is necessary to take into account the number of inhabitants and their need for hot water, as well as the level of sunlight and the possibility of properly positioning the collectors concerning the directions of the world, directing them to the south [75]. An interesting, although expensive solution is home wind farms. However, it should be remembered that the collectors, cells, or wind farms themselves will not fully cover the demand for heat and electricity in a single-family house. However, they are an important supplement, thanks to which it is possible to reduce electricity bills and thus reduce energy poverty [76,77].
Effective home heating is an activity that significantly influences the thermal comfort of residents. One possible solution is biomass heating boilers. The fuel can be used i.a. biomass in the form of briquettes, pellets, or wood chips. An argument that additionally supports the use of biomass boilers is the fact that the CO2 generated during its combustion is absorbed by vegetation and does not accumulate in the atmosphere [78]. Another solution for the heating system can be a heat pump [79,80]. It is a device that allows you to recover thermal energy from soil, air, or water. As with the use of other renewable energy sources, the pump selection should also be based on the actual needs of the household members and the specificity of the building. It is possible to combine more than one renewable energy source. The most popular solution is hybrid collectors using photovoltaic cells and solar collectors. At the same time, they heat water and generate electricity. Often, a combination of renewable and conventional sources is also used.
In existing multi-family buildings, it is impossible to meet all energy consumption needs by generating energy from renewable sources in installations located within the building or property. The obstacles are the current legal status, but also the technical possibilities. Renewable energy installations can be built on designated areas and the energy they generate can be purchased for buildings. For the production of energy in multi-family buildings, can be used [81]: wind farms, photovoltaic farms, biomass heating plants, biogas plants, etc. In Poland, solar collectors, photovoltaic panels, and air-to-water heat pumps can also be installed in already functioning multi-family buildings. In some cases, it is possible to use biomass boilers located in a building or a district heating plant (CHP). Heat and electricity can also be stored within the building. Unfortunately, storage technologies are still expensive, which often makes this process unprofitable [82].
The increase in the production of energy from renewable sources should be large enough to meet the growing demand and additionally allow to reduce production from conventional sources [83]. Thanks to the improvement of the income situation in Poland, households are replacing coal stoves with gas, biomass and other more expensive fuels, which is confirmed by the research results [84].
In Poland, at the end of 2020, the installed capacity of all renewable energy sources in the power system was almost 10 GW, of which over 183 MW in small RES installations [85].
Small installations include installations with a total installed electrical power greater than 50 kW and less than 500 kW, connected to a power grid with a rated voltage lower than 110 kV, or with a combined heat output greater than 150 kW and not greater than 900 kW with the total installed electrical capacity greater than 50 kW and less than 500 kW [85].
In 2020, energy was produced in a total of 898 small installations. Their total installed capacity was over 183 MW. The most numerous were small installations using water energy (343), with a total installed capacity of 51.96 MW. Next, in terms of the number of installations (328), but at the same time, the largest in terms of the total installed capacity (66.86 MW), were photovoltaic sources. The least frequent were small installations producing energy from biomass. At the end of 2020, there were only two such installations in Poland (Table 10).
Table 10.
RES installation entered in the register of energy producers in a small installation, by source type (as at the end of 2020).
In 2020, the most energy—over 146 GWh—was produced by small hydropower plants. The second-largest source in 2020 was biogas plants using non-agricultural biogas. They produced over 107 GWh of energy (Figure 4).
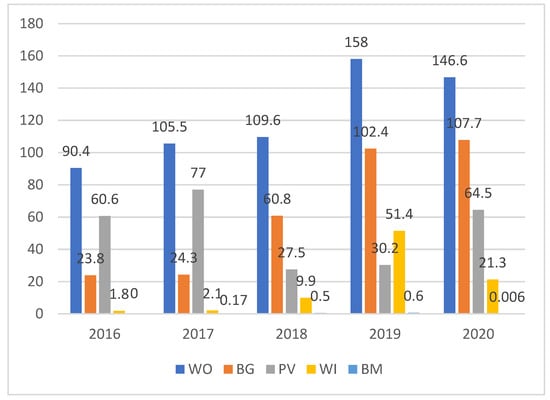
Figure 4.
Energy production in small RES installations in 2016–2020 by type of source (in GWh). Type of renewable energy installations: WO—hydropower, WI—wind energy, PV—solar radiation energy, BG—non-agricultural biogas, BM—biomass. Source: Energy Regulatory Office in Poland.
The photovoltaic (PV) market is the fastest growing of all renewable energy sectors in Poland [86]. Currently, the largest increase in new capacity is observed in the micro-installation segment, which means high activity of individual and business prosumers. In 2020, over 64 GWh of energy was generated in small photovoltaic installations—as much as 114% more than in the previous year. This source accounts for 19% of the total production.
4. Discussion
So far, many studies have been conducted on energy poverty in different countries. They indicate how important problems in the modern world are the access to energy and the appropriate level of its prices. Government policies position energy consumption as a basic need or right to be provided for citizens, and the lack of it as a form of deprivation to be dealt with [13]. This is an important problem that requires political action contributing to its reduction. Research on energy poverty has been undertaken in EU and non-EU countries e.g., Japan [87], Australia [88], India [18] and Brazil [89]. Many studies have been devoted to the impact of energy poverty on increased human mortality. For example, studies in the UK and Ireland have shown increased levels of death during the winter months and a link has been established between insufficiently heated homes and increased rates of morbidity and higher incidence of various cardiovascular and respiratory diseases [13,16]. Whereas, in developing countries (Ghana), studies indicated the high dependence of households on traditional biomass for cooking. Traditional biomass, which is usually burned in houses, exposes householders to indoor air pollution. The use of candles and kerosene lamps as light sources also pollutes indoor air, which contains high levels of particulate matter (PM) and toxins that are dangerous to the respiratory system. Inhalation of PM causes asthma, lung cancer, cardiovascular and respiratory diseases [17]. The importance of modern renewable sources (water, wind, sun) should also be stressed here, as they can contribute to limiting environmental pollution and reducing the number of serious diseases, thus reducing the costs of treating the sick or of their increased mortality. In the case of Poland, this is a huge problem, as our country has the most polluted air of all the member states of the European Union. It is therefore important to emphasise that renewable sources can help to reduce energy poverty and reduce many serious diseases resulting from air pollution. The World Health Organization (WHO) pays particular attention to the problems of environmental pollution. A WHO report showed that in 2010 air pollution contributed to the premature deaths of 48.5 thousand Poles. The burning of conventional fuels in households between 2010 and 2016 caused 19 to 22 thousand premature deaths annually [90]. Deaths related to air pollution in Poland generate costs of USD 101,826 million [91] or as much as 12.9% of gross domestic product (GDP). This amounts to over PLN 800 per month per Polish citizen. This data is also confirmed by Greenpeace, which estimates the costs of air pollution caused by fossil fuels at PLN 113 billion per year [92]. Many authors point to the importance of renewable energy sources in reducing energy poverty. Neacsa et al. showed the use of renewable energy in Romanian households [52]. Romania has adopted a solution consisting of government subsidies for the purchase of solar panel systems, geothermal energy as well as wind energy for households. This example shows support for investment from public funds, which, on the one hand, is seen as measures reducing energy poverty and, on the other hand, reducing pollution.
An interesting example of the use of renewable energy in district heating is the Organic Rankine Cycle (ORC) system powered by biomass used in Spain [93]. The CCHP configuration used in Spain is worth attention in regions with mild winters and medium-hot summers, as well as the availability of biomass, which could not be applicable in all regions in Poland.
The use of renewable energy as a solution to the problem of energy poverty is presented by researchers from South Korea [94]. They propose the use of solar PV systems for low-income families in social housing. This solution has several advantages: systems balance energy costs, reduce environmental impact and CO2 emissions, and contribute to energy independence.
In turn, Luderer et al. [95] have developed scenarios to assess the role of renewable energy in climate change mitigation and also in heat production. Almost all scenarios show strong possible growth in renewable energy production, with a significant increase in the use of wind and solar power. Wind power is competitive even without climate policy, while the prospects for photovoltaics (PV) are highly dependent on climate policy assumptions.
Many experts believe that the use of renewable energy is a solution that could help reduce the problem of energy poverty, despite the challenges and limitations associated with the use of this energy source. Even if the generation of such energy in some cases entails more costs than conventional energy generation, experts underline the short- and long-term benefits of its use [96]. The implementation of renewable energy projects generates not only disputes related to the costs and financing of investments, but also to their acceptance by local communities (due to the negative external effects generated in the form of aesthetics, noise, biodiversity degradation, etc.) [52,97]. However, investment in renewable energy production should become an “engine” for rural area development as, on the one hand, it provides required energy and contributes to reducing energy poverty and, on the other, it attracts local labour and creates new jobs [52,98].
5. Conclusions
Energy poverty is a dynamic and complex phenomenon, generated by a combination of factors such as low household incomes, high energy prices, and difficult access to the energy system.
To show the level of energy poverty in Poland, the authors developed a synthetic measure that unifies several different measures used by researchers and allows for a comprehensive assessment of the phenomenon. On its basis, it can be concluded that in 2010–2018 there was a slow but visible decrease in the level of energy poverty in Poland. Investments in renewable energy that can contribute to the greatest extent to reducing the energy poverty of households include solar collectors to heat utility water, photovoltaic cells or home wind farms generating electricity, biomass boilers or heat pumps used in the heating system, wastewater heat recovery system, ground heat exchangers and the so-called hybrid solutions, combining various RES. It should be remembered that the collectors, cells, or wind farms themselves will not fully cover the heat and electricity demand of a single-family house. However, they are an important supplement, thanks to which it is possible to reduce electricity bills and thus reduce energy poverty. It is possible to combine more than one renewable energy source. The most popular solution is hybrid collectors using photovoltaic cells and solar collectors. At the same time, they heat water and generate electricity. Often, a combination of renewable and conventional sources is also used. However, it should be remembered that all investments in renewable energy require appropriate financing. The problem of energy poverty often concerns poor people who are not able to generate funds for these purposes. Therefore, various types of publicly funded programs supporting such investments and alleviating the problem of energy poverty are an important activity. It must be remembered that renewable energy is a long-term solution that could solve the problem of energy poverty, despite the challenges associated with the difficulties of implementing these unconventional energy sources. Investments in renewable energy sources contribute to the fight against smog by reducing the emission of dust and other pollutants released into the atmosphere. Investing in renewable energy sources not only helps to protect the environment and combat smog but also allows you to increase your home budget. It is possible thanks to financial support for the purchase and installation of heat pumps and photovoltaics, as well as constant savings on energy costs. As the analyses show, newly installed renewable energy costs less and becomes more competitive compared to traditional methods of energy production. Therefore, investments in renewable energy sources are a legitimate measure contributing to reducing energy poverty in Poland. Public institutions should support investments in renewable energy sources for environmental reasons, limiting the processes of climate warming, health, as well as the slow depletion of fossil sources, which unfortunately will increase the cost of energy production in the future. The assumptions of the EU climate policy indicate that striving to increase the share of renewable energy sources in total consumption, reducing greenhouse gas emissions, and improving energy efficiency are goals that all member states must pursue.
The authors, however, encountered some limitations in carrying out the analyzes that were the basis for the preparation of the article. The limitation of this study was the range of available GUS statistical data as well as the selection of measures in the statistical analysis. A challenge for other researchers in the field of conducted research may be the application of the developed indicators in other countries at risk of energy poverty. In the current situation, further research should be undertaken to show the impact of the coronavirus pandemic on the level of energy poverty in various countries.
Author Contributions
Conceptualization, A.B.-J., P.T., S.J.; data curation, A.B.-J., P.T., S.J.; formal analysis, A.B.-J., P.T., S.J.; methodology, A.B.-J., P.T., S.J.; resources, A.B.-J., P.T., S.J.; visualization, A.B.-J., P.T., S.J.; writing—original draft, A.B.-J., P.T., S.J.; writing—review and editing, A.B.-J., P.T., S.J.; supervision, A.B.-J., P.T., S.J.; funding acquisition, A.B.-J., P.T., S.J. All authors have read and agreed to the published version of the manuscript.
Funding
This research received no external funding.
Institutional Review Board Statement
Not applicable.
Informed Consent Statement
Not applicable.
Data Availability Statement
The data presented in this study are available on request from the corresponding author.
Conflicts of Interest
The authors declare no conflict of interest.
References
- Bouzarovski, S.; Petrova, S.; Sarlamanov, R. Energy poverty policies in the EU: A critical perspective. Energy Policy 2012, 49, 76–82. [Google Scholar] [CrossRef]
- EEN. EnR Position Paper on Energy Poverty in the European Union; European Energy Network: Roma, Italy, 2019. [Google Scholar]
- Thomson, H.; Bouzarovski, S.; Snell, C. Rethinking the measurement of energy poverty in Europe: A critical analysis of indicators and data. Indoor Built Environ. 2017, 26, 879–901. [Google Scholar] [CrossRef] [PubMed]
- Thomson, H.; Snell, C.; Bouzarovski, S. Health, Well-Being and Energy Poverty in Europe: A Comparative Study of 32 European Countries. Int. J. Environ. Res. Public Health 2017, 14, 584. [Google Scholar] [CrossRef] [PubMed]
- Maxim, A.; Mihai, C.; Apostoaie, C.M.; Maxim, A. Energy poverty in Southern and Eastern Europe: Peculiar regional issues. Eur. J. Sustain. Dev. 2017, 6, 247. [Google Scholar] [CrossRef][Green Version]
- Maxim, A.; Mihai, C.; Apostoaie, C.-M.; Popescu, C.; Istrate, C.; Bostan, I. Implications and Measurement of Energy Poverty across the European Union. Sustainability 2016, 8, 483. [Google Scholar] [CrossRef]
- Sałach, K.; Lewandowski, P. Pomiar ubóstwa energetycznego na podstawie danych BBGD—Metodologia i zastosowanie (Measurement of energy poverty on the basis of BBGD data—Methodology and application). IBS Res. Rep. 2018, 1, 1–21. (In Polish) [Google Scholar]
- Che, X.; Zhu, B.; Wang, P. Assessing global energy poverty: An integrated approach. Energy Policy 2021, 149, 112099. [Google Scholar] [CrossRef]
- European Commission. Indicators and Data. EU Energy Poverty Observatory. Available online: https://www.energypoverty.eu/indicators-data (accessed on 20 January 2021).
- Bouzarovski, S. Energy poverty in the European Union: Landscapes of vulnerability. WIREs Energy Environ. 2014, 3, 276–289. [Google Scholar] [CrossRef]
- Boardman, B. Fuel Poverty: From Cold Homes to Affordable Warmth; Belhaven Press: London, UK, 1991. [Google Scholar]
- Reddy, A. Energy and social issues. In World Energy Council and UNEP; Energy and the challenge of sustainability: New York, NY, USA, 2000. [Google Scholar]
- Day, R.; Walker, G.; Simcock, N. Conceptualising energy use and energy poverty using a capabilities framework. Energy Policy 2016, 93, 255–264. [Google Scholar] [CrossRef]
- Charlier, D.; Kahouli, S. From Residential Energy Demand to Fuel Poverty: Income-induced Non-linearities in the Reactions of Households to Energy Price Fluctuations. Energy J. 2019, 40. [Google Scholar] [CrossRef]
- Curwen, M. Excess winter mortality: A British phenomenon? Health Trends 1991, 22, 169–175. [Google Scholar]
- Healy, J.D.; Clinch, J. Quantifying the severity of fuel poverty, its relationship with poor housing and reasons for non-investment in energy-saving measures in Ireland. Energy Policy 2004, 32, 207–220. [Google Scholar] [CrossRef]
- Adusah-Poku, F.; Takeuchi, K. Energy poverty in Ghana: Any progress so far? Renew. Sustain. Energy Rev. 2019, 112, 853–864. [Google Scholar] [CrossRef]
- Bhide, A.; Monroy, C.R. Energy poverty: A special focus on energy poverty in India and renewable energy technologies. Renew. Sustain. Energy Rev. 2011, 15, 1057–1066. [Google Scholar] [CrossRef]
- Boguszewski, R.; Herudziński, T. Ubóstwo Energetyczne w Polsce (Energy Poverty in Poland); Pracownia Badań Społecznych SGGW: Warsaw, Poland, 2018. (In Polish) [Google Scholar]
- Howden-Chapman, P.; Viggers, H.; Chapman, R.; O’Sullivan, K.; Barnard, L.T.; Lloyd, B. Tackling cold housing and fuel poverty in New Zealand: A review of policies, research, and health impacts. Energy Policy 2012, 49, 134–142. [Google Scholar] [CrossRef]
- Baudu, R.; Charlier, D.; Legendre, B. Fuel poverty and health: A panel data analysis. FAERE Work. Pap. 2020, 4, 2274–5556. [Google Scholar]
- Sagar, A.D. Alleviating energy poverty for the world’s poor. Energy Policy 2005, 33, 1367–1372. [Google Scholar] [CrossRef]
- Pachauri, S.; Rao, N.D. Gender impacts and determinants of energy poverty: Are we asking the right questions? Curr. Opin. Environ. Sustain. 2013, 5, 205–215. [Google Scholar] [CrossRef]
- Gonzalez Pijuan, I. Gender Inequality and Energy Poverty. A Forgotten Risk Factor; Engineering Without Borders: Geneva, Switzerland, 2018. [Google Scholar]
- Clancy, J.S.; Skutsch, M.; Batchelor, S. The Gender-Energy-Poverty Nexus. Finding the Energy to Address Gender Concerns in Development. DFID Project CNTR998521; UK Department for International Development (DFID): London, UK, 2002. [Google Scholar]
- Creţan, R.; Málovics, G.; Méreiné-Berki, B. On the perpetuation and contestation of racial stigma: Urban Roma in a disadvantaged neighbourhood of Szeged. Geogr. Pannonica 2020, 24, 294–310. [Google Scholar] [CrossRef]
- Creţan, R.; Turnock, D. Romania’s Roma Population: From Marginality to Social Integration. Scott. Geogr. J. 2008, 124, 274–299. [Google Scholar] [CrossRef]
- Special Report. Air Pollution: Our Health Still Insufficiently Protected; European Court of Auditors: Luxembourg, Luxembourg, 2018. [Google Scholar]
- Welsch, H.; Biermann, P. Energy Affordability and Subjective Well-Being: Evidence for European Countries. Energy J. 2017, 38, 159–176. [Google Scholar] [CrossRef]
- Węglarz, A.; Kubalski, G.; Owczarek, D. Propozycje Mechanizmów Wsparcia Procesu Przeciwdziałania Zjawisku Ubóstwa Energetycznego w Polsce (Proposed Mechanisms to Support the Process of Counteracting the Phenomenon of Energy Poverty in Poland); Instytut na Rzecz Ekorozwoju: Warszawa, Poland, 2014. (In Polish) [Google Scholar]
- Recalde, M.; Peralta, A.; Oliveras, L.; Herrero, S.T.; Borrell, C.; Palència, L.; Gotsens, M.; Artazcoz, L.; Marí-Dell’Olmo, M. Structural energy poverty vulnerability and excess winter mortality in the European Union: Exploring the association between structural determinants and health. Energy Policy 2019, 133, 110869. [Google Scholar] [CrossRef]
- Sareen, S.; Thomson, H.; Herrero, S.T.; Gouveia, J.P.; Lippert, I.; Lis, A. European energy poverty metrics: Scales, prospects and limits. Glob. Transit. 2020, 2, 26–36. [Google Scholar] [CrossRef]
- Papada, L.; Kaliampakos, D. Being forced to skimp on energy needs: A new look at energy poverty in Greece. Energy Res. Soc. Sci. 2020, 64, 101450. [Google Scholar] [CrossRef]
- Thomson, H.; Snell, C. Quantifying the prevalence of fuel poverty across the European Union. Energy Policy 2013, 52, 563–572. [Google Scholar] [CrossRef]
- Heindl, P.; Schüssler, R. Dynamic properties of energy affordability measures. Energy Policy 2015, 86, 123–132. [Google Scholar] [CrossRef]
- Phimister, E.; Vera-Toscano, E.; Roberts, D.J. The Dynamics of Energy Poverty: Evidence from Spain. Econ. Energy Environ. Policy 2015, 4, 153–166. [Google Scholar] [CrossRef]
- Okushima, S. Measuring energy poverty in Japan, 2004–2013. Energy Policy 2016, 98, 557–564. [Google Scholar] [CrossRef]
- Pachauri, S.; Mueller, A.; Kemmler, A.; Spreng, D. On Measuring Energy Poverty in Indian Households. World Dev. 2004, 32, 2083–2104. [Google Scholar] [CrossRef]
- Kurowski, P. Zagrożenie ubóstwem energetycznym. Próba ustalenia zjawiska (The threat of energy poverty. An attempt to determine the phenomenon). Bull. Energy Regul. Off. 2012, 79, 3–8. (In Polish) [Google Scholar]
- Hills, J. Getting the measure of fuel poverty. In Final Report of the Energy Poverty Review, Case Report No. 72, Commissioned by the UK Department of Energy and Climate Change; UK (DECC): London, UK, 2012. [Google Scholar]
- Gordon, D.; Adelman, L.; Ashworth, K.; Bradshaw, J.; Levitas, R.; Middleton, S.; Pantazis, C.; Patsios, D.; Payne, S.; Townsend, P.; et al. Poverty and Social Exclusion in Britain; Joseph Rowntree Foundation: York, UK, 2000. [Google Scholar]
- Healy, J. Housing, Fuel Poverty and Health: A Pan-European Analysis; Ashgate: Aldershot, UK, 2004. [Google Scholar]
- Petrova, S.; Gentile, M.; Mäkinen, I.H.; Bouzarovski, S. Perceptions of Thermal Comfort and Housing Quality: Exploring the Microgeographies of Energy Poverty in Stakhanov, Ukraine. Environ. Plan. A Econ. Space 2013, 45, 1240–1257. [Google Scholar] [CrossRef]
- Thema, J.; Vondung, F. EPOV Indicator Dashboard: Methodology Guidebook; Wuppertal Institut für Klima, Umwelt, Energie GmbH: Wuppertal, Germany, 2020. [Google Scholar]
- Piekut, M. Patterns of Energy Consumption in Polish One-Person Households. Energies 2020, 13, 5699. [Google Scholar] [CrossRef]
- Bossert, W.; Chakravarty, S.R.; D’Ambrosio, C. Measuring Multidimensional Poverty: The Generalized Counting Approach. In Analyzing Multidimensional Well-Being: A Quantitative Approach; John Wiley: New Jersey, NJ, USA, 2020. [Google Scholar]
- Nussbaumer, P.; Bazilian, M.; Modi, V. Measuring energy poverty: Focusing on what matters. Renew. Sustain. Energy Rev. 2012, 16, 231–243. [Google Scholar] [CrossRef]
- Bouzarovski, S.; Herrero, S.T. The energy divide: Integrating energy transitions, regional inequalities and poverty trends in the European Union. Eur. Urban Reg. Stud. 2017, 24, 69–86. [Google Scholar] [CrossRef]
- Alkire, S.; Foster, J. Counting and multidimensional poverty measurement. J. Public Econ. 2011, 95, 476–487. [Google Scholar] [CrossRef]
- Bouzarovski, S.; Kiełczewska, A.; Lewandowski, P.; Sokołowski, J. Measuring energy poverty in Poland with the Multidimensional Energy Poverty Index. Energy Sources Part B Econ. Plan. Policy 2020, 15, 2451–4373. [Google Scholar]
- Szamrej-Baran, I. Identyfikacja przyczyn ubóstwa energetycznego w Polsce przy wykorzystaniu modelowania miękkiego. (Identification of the causes of energy poverty in Poland using soft modeling). Sci. Pap. Wrocław Univ. Econ. 2014, 23, 343–352. (In Polish) [Google Scholar]
- Neacsa, A.; Panait, M.; Muresan, J.D.; Voica, M.C. Energy Poverty in European Union: Assessment Difficulties, Effects on the Quality of Life, Mitigation Measures. Some Evidences from Romania. Sustainability 2020, 12, 4036. [Google Scholar] [CrossRef]
- Kaya, O.; Klepacka, A.M.; Florkowski, W.J. Achieving renewable energy, climate, and air quality policy goals: Rural residential investment in solar panel. J. Environ. Manag. 2019, 248, 109309. [Google Scholar] [CrossRef]
- Edenhofer, O.; Seyboth, K.; Creutzig, F.; Schlömer, S. On the Sustainability of Renewable Energy Sources. Annu. Rev. Environ. Resour. 2013, 38, 169–200. [Google Scholar] [CrossRef]
- Piwowar, A.; Dzikuć, M. Development of Renewable Energy Sources in the Context of Threats Resulting from Low-Altitude Emissions in Rural Areas in Poland: A Review. Energies 2019, 12, 3558. [Google Scholar] [CrossRef]
- Gielen, D.; Boshell, F.; Saygin, D.; Bazilian, M.D.; Wagner, N.; Gorini, R. The role of renewable energy in the global energy transformation. Energy Strategy Rev. 2019, 24, 38–50. [Google Scholar] [CrossRef]
- Abu-Hamed, T.; Peric, K. The Role of Renewable Energy Resources in Alleviating Energy Poverty in Palestine. Renew. Energy Focus 2020, 35, 97–107. [Google Scholar] [CrossRef]
- Mshelia, H.I. Energy Access for All. The role of clean energy in alleviating energy poverty. Energy Access All 2012, 33, 43. [Google Scholar]
- Singh, N.; Nyuur, R.; Richmond, B. Renewable Energy Development as a Driver of Economic Growth: Evidence from Multivariate Panel Data Analysis. Sustainability 2019, 11, 2418. [Google Scholar] [CrossRef]
- Climate & Energy Framework. Available online: https://ec.europa.eu/clima/policies/strategies/2030_en (accessed on 20 October 2020).
- Walkowska, K. Energy Consumption in Households in 2018; Statistics Poland: Warsaw, Poland, 2019. [Google Scholar]
- IRENA. Renewable Power Generation Costs in 2019; International Renewable Energy Agency: Abu Dhabi, United Arab Emirates, 2020. [Google Scholar]
- Mrowiec, D. Jednostkowy koszt wytwarzania energii elektrycznej (LCOE) jako wskaźnik porównawczy kosztów produkcji różnych źródeł (Unit Cost of Electricity Generation (LCOE) as a benchmark for production costs of different sources). PSE Innowacje 2019, 2, 71–76. (In Polish) [Google Scholar]
- Jolliffe, I.T. Principal Component Analysis Series. In Springer Series in Statistics, 2nd ed.; Springer: New York, NY, USA, 2002. [Google Scholar]
- Bouzarovski, S. Energy Poverty (Dis)Assembling Europe’s Infrastructural Divide; Springer International Publishing AG: Cham, Switzerland, 2018. [Google Scholar]
- Dubois, U.; Meier, H. Energy affordability and energy inequality in Europe: Implications for policymaking. Energy Res. Soc. Sci. 2016, 18, 21–35. [Google Scholar] [CrossRef]
- Regulation (EU) 2018/1999 of the European Parliament and of the Council on Governance of the European Energy Union and Climate Action. Available online: https://ec.europa.eu/transparency/regdoc/rep/3/2020/PL/C-2020-9600-F1-PL-MAIN-PART-1.PDF (accessed on 15 February 2021).
- Ministry of State Assets. National Energy and Climate Plan 2021–2030. Assumptions and Objectives and Policies and Measures; Ministry of State Assets: Warsaw, Poland, 2019.
- European Committee of the Regions. Time to Eradicate Energy Poverty in Europe. Press Release 27/06/2019 | Energy Efficiency, Market and Technology. Available online: https://cor.europa.eu/pl/news/Pages/time-to-eradicate-energy-poverty-in-europe.aspx (accessed on 8 April 2021).
- Information from: Clean Air Department of the National Fund for Environmental Protection and Water Management, ul. Konstruktorska 3A, 02-673 Warsaw, Poland. Available online: www.nfosigw.gov.pl (accessed on 17 December 2020).
- Owczarek, D. Czyste Powietrze Dzięki Walce z Ubóstwem Energetycznym (Clean Air Thanks to Fighting Energy Poverty); Institute of Public Affairs: Warsaw, Poland, 2017. [Google Scholar]
- Dzikuć, M.; Kułyk, P.; Dzikuć, M.; Urban, S.; Piwowar, A. Outline of Ecological and Economic Problems Associated with Low Emission Reductions in Poland’s Lubuskie Voivodeship. Pol. J. Environ. Stud. 2018, 28, 65–72. [Google Scholar] [CrossRef]
- Karpinska, L.; Śmiech, S. Invisible energy poverty? Analysing housing costs in Central and Eastern Europe. Energy Res. Soc. Sci. 2020, 70, 101670. [Google Scholar] [CrossRef]
- Ürge-Vorsatz, D.; Herrero, S.T. Building synergies between climate change mitigation and energy poverty alleviation. Energy Policy 2012, 49, 83–90. [Google Scholar] [CrossRef]
- Graczyk, A.M. Wykorzystanie odnawialnych źródeł energii w gospodarstwach domowych na Dolnym Śląsku/The use of renewable energy sources in households in the Lower Silesia region. Pr. Nauk. Uniw. Ekon. Wrocławiu 2016, 453, 190–198. [Google Scholar] [CrossRef][Green Version]
- TPA Horwath. Wind Energy in Poland; TPA Horwath: Warsaw, Poland, 2014. [Google Scholar]
- Żabicki, D. Przydomowe elektrownie wiatrowe (Home wind farms). Czysta Energia 2013, 11, 1–4. (In Polish) [Google Scholar]
- Ślusarz, G.; Gołębiewska, B.; Cierpiał-Wolan, M.; Gołębiewski, J.; Twaróg, D.; Wójcik, S. Regional Diversification of Potential, Production and Efficiency of Use of Biogas and Biomass in Poland. Energies 2021, 14, 742. [Google Scholar] [CrossRef]
- Gromada, A.; Trębska, P. Acquisition and Consumption of Renewable Energy Used by Heat Pumps in 2010–2017 in Poland. Ann. Pol. Assoc. Agric. Agribus. Econ. 2019, XXI, 97–106. [Google Scholar] [CrossRef]
- Vanden Borre, A. Definition of heat pumps and their use of renewable energy sources. REHVA J. 2011, 4, 38–39. [Google Scholar]
- Wolańksa, K. Efektywność Energetyczna i Odnawialne źródła Energii (Energy Efficiency and Renewable Energy Sources). Fundacja Instytut NA Rzecz Ekorozwoju, “Eko-Lokator” 2017. Available online: https://www.pine.org.pl/wp-content/uploads/2019/11/3.-efektywnosc-energetyczna-i-odnawialne-zrodla-energii.pdf (accessed on 20 February 2021). (In Polish).
- Institute for Renewable Energy. RES and Heat Storage in the Polish Heating Sector; EC BREC: Warsaw, Poland, 2019. [Google Scholar]
- Brodny, J.; Tutak, M.; Saki, S.A. Forecasting the Structure of Energy Production from Renewable Energy Sources and Biofuels in Poland. Energies 2020, 13, 2539. [Google Scholar] [CrossRef]
- Lis, M.; Ramsza, M.; Miazga, A. Dynamiczne Własności Miar Ubóstwa Energetycznego. (Dynamic Properties of Energy Poverty Measures); IBS Research Report 01/2016; Institute for Structural Research: Warsaw, Poland, 2016. (In Polish) [Google Scholar]
- Energy Regulatory Office. Wytwarzanie Energii Elektrycznej w Polsce w MałYch Instalacjach Oze. Raport Prezesa Ure Za 2020 Rok; Energy Regulatory Office: Warsaw, Poland, 2021. (In Polish) [Google Scholar]
- Institute for Renewable Energy. Photovoltaics in Poland; EC BREC: Warsaw, Poland, 2020. [Google Scholar]
- Okushima, S. Gauging energy poverty: A multidimensional approach. Energy 2017, 137, 1159–1166. [Google Scholar] [CrossRef]
- Chester, L.; Morris, A. A new form of energy poverty is the hallmark of liberalised electricity sectors. Aust. J. Soc. Issues 2011, 46, 435–459. [Google Scholar] [CrossRef]
- Pereira, M.G.; Freitas, M.A.V.; da Silva, N.F. Rural electrification and energy poverty: Empirical evidences from Brazil. Renew. Sustain. Energy Rev. 2010, 14, 1229–1240. [Google Scholar] [CrossRef]
- Adamkiewicz, Ł. Zewnętrzne Koszty Zdrowotne Emisji Zanieczyszczeń Powietrza z Sektora Bytowo-Komunalnego. In Szacunki na Postawie Dostępnych Danych (External Health Costs of Air Pollutant Emissions from the Household and Municipal Sector. Estimates Based on Available Data); Ministerstwo Przedsiębiorczości i Technologii: Warszawa, Polska, 2018; pp. 1–13. (In Polish) [Google Scholar]
- WHO Regional Office for Europe, OECD. Economic Cost of the Health Impact of Air Pollution in Europe: Clean Air, Health and Wealth; WHO Regional Office for Europe: Copenhagen, Denmark, 2015. [Google Scholar]
- Wąsowski, M. Zanieczyszczenia Powietrza Kosztują Świat Miliardy Dolarów Dziennie. Polska Wśród Krajów Ponoszących Największe Koszty. Available online: https://businessinsider.com.pl/finanse/makroekonomia/koszty-zanieczyszczenia-powietrza-zwiazane-z-paliwami-kopalnymi-polska-i-swiat-raport/pwcs9bv (accessed on 20 February 2021).
- Uris, M.; Linares, J.I.; Arenas, E. Feasibility assessment of an Organic Rankine Cycle (ORC) cogeneration plant (CHP/CCHP) fueled by biomass for a district network in mainland Spain. Energy 2017, 133, 969–985. [Google Scholar] [CrossRef]
- Lee, J.; Shepley, M.M. Benefits of solar photovoltaic systems for low-income families in social housing of Korea: Renewable energy applications as solutions to energy poverty. J. Build. Eng. 2020, 28, 101016. [Google Scholar] [CrossRef]
- Luderer, G.; Krey, V.; Calvin, K.; Merrick, J.; Mima, S.; Pietzcker, R.; Van Vliet, J.; Wada, K. The role of renewable energy in climate stabilization: Results from the EMF27 scenarios. Clim. Chang. 2014, 123, 427–441. [Google Scholar] [CrossRef]
- Dusmanescu, D. Aspects Regarding Implementation of Renewable Energy Sources in Romania up to 2050. Int. J. Sustain. Econ. Manag. 2013, 2, 1–21. [Google Scholar] [CrossRef][Green Version]
- Llera-Sastresa, E.; Scarpellini, S.; Rivera-Torres, P.; Aranda, J.; Zabalza-Bribián, I.; Aranda-Usón, A. Energy Vulnerability Composite Index in Social Housing, from a Household Energy Poverty Perspective. Sustainability 2017, 9, 691. [Google Scholar] [CrossRef]
- Cebotari, S.; Benedek, J. Renewable Energy Project as a Source of Innovation in Rural Communities: Lessons from the Periphery. Sustainability 2017, 9, 509. [Google Scholar] [CrossRef]
Publisher’s Note: MDPI stays neutral with regard to jurisdictional claims in published maps and institutional affiliations. |
© 2021 by the authors. Licensee MDPI, Basel, Switzerland. This article is an open access article distributed under the terms and conditions of the Creative Commons Attribution (CC BY) license (https://creativecommons.org/licenses/by/4.0/).