Article

Sensitivity Study on the Correlation Level of Seismic Failures in Seismic Probabilistic Safety Assessments

Quantum and Nuclear Engineering, Sejong University, 209 Neungdong-ro, Gwangjin-gu, Seoul 05006, Korea
*
Author to whom correspondence should be addressed.
Energies 2021, 14(10), 2955; https://doi.org/10.3390/en14102955
Submission received: 7 March 2021 / Revised: 14 May 2021 / Accepted: 17 May 2021 / Published: 20 May 2021

Abstract

:
It is popular that correlated seismic failures spread over the fault tree of a seismic probabilistic safety assessment (PSA) for a nuclear power plant (NPP). To avoid the calculational difficulty of core damage frequency (CDF), the fault tree has been simplified by replacing correlated seismic failures with one typical seismic failure by assuming a full correlation among the correlated seismic failures. Then, the approximate seismic CDF of a seismic single-unit PSA (SUPSA) has been calculated for decades with this simplified SUPSA fault tree. Furthermore, current seismic multi-unit PSAs (MUPSAs) have been performed with imperfect seismic MUPSA models that were generated by combining such imperfect seismic SUPSA fault trees. The authors of this study recently developed a method that can calculate an accurate seismic CDF by converting correlated seismic failures into seismic common cause failures (CCFs). In this study, accurate and imperfect MUPSA models were created and their seismic CDFs were compared. The results of this study show that the seismic CDFs in SUPSA and MUPSA are drastically distorted and safety margins are accordingly distorted when the full correlation assumption is employed. Thus, this study shows that very careful attention should be paid to calculating and interpreting seismic CDFs for the single-unit and multi-unit NPP regulations.

1. Introduction

1.1. Background

For various regulation purposes of nuclear power plants (NPPs), many seismic single-unit probabilistic safety assessments (SUPSAs) have been performed since the first probabilistic safety assessment (PSA) of WASH-1400 [1]. The initial multi-unit risk study [2] was performed due to the gradually increasing concern regarding multi-unit nuclear accidents. After the Fukushima Daiichi NPP accident in 2011 [3], many studies for multi-unit probabilistic safety assessments (MUPSAs) have been conducted [4,5,6,7,8,9,10,11,12,13].
The typical safety goals for single-unit NPPs are specified in terms of early and latent cancer fatalities, which are usually expressed as quantitative health objectives (QHOs). However, since calculating the QHOs is difficult, surrogate safety goals such as core damage frequency (CDF) and large early release frequency (LERF) are being widely used in many countries. The CDF and LERF are calculated through probabilistic safety assessments (PSAs). It has been noted that the best-estimate risks should be modeled and calculated to show that they meet the safety goals. Furthermore, emergency operating procedures (EOPs) and accident management plans (AMPs) should be designed on the basis of the best-estimate risks.
The Korean AMP law that was enacted in 2016 after the Fukushima Daiichi NPP accident mandated that Korea Hydraulic and Nuclear Power (KHNP) develop an AMP and prove its efficiency through a PSA. Further, it specified an additional safety goal: the accident frequency for Cs-137 release exceeding 100 TBq must be less than 10 6 /year.
Many countries are attempting to develop safety goals to prevent multi-unit NPP accidents [4,10]. Although there are no established safety goals for multi-unit NPPs worldwide, the best-estimate risks should be calculated to design proper AMPs to cope with multi-unit accidents. A few important MUPSAs are currently underway to appropriately model and calculate the best-estimate risks for multi-unit NPPs [11,12,13].
In MUPSAs, the seismic risk dominates the other risks. However, seismic SUPSAs and MUPSAs have been performed with fault trees that were simplified by assuming the full correlation among seismic failures of redundant/identical components. In particular, no study has explained whether the full correlation assumption guarantees conservative seismic risks and described the level of conservatism in seismic risks. This was the motivation of this study.

1.2. Correlated Seismic Failures and Seismic Common Cause Failures

The seismic SUPSA method was initiated by the WASH-1400 study [1], and the procedure for the seismic SUPSA has been well established by the following studies [14,15,16,17]. The importance of the correlated seismic failures was addressed in the Seismic Safety Margins Research Program (SSMRP) study [18]. However, the correlation among the seismic failures has been assumed as a zero or full correlation to avoid the difficulties for determining the level of the correlation and calculating seismic CDF from the fault tree that has correlated seismic failures [19]. The following studies [20,21,22] were performed to determine the correlation level among correlated seismic failures.
Various methods that can calculate seismic CDF from the fault tree that has correlated seismic failures are summarized in the NUREG 7237 report [19]. However, these methods are limited to the case when the correlated seismic failures exist under the single logical gate. The COREX study [23] made it possible to calculate seismic CDF when the seismic failures spread over a fault tree.
When the full correlation assumption is not employed, the logical gate probability that has correlated seismic failures can be implicitly calculated by multivariate normal (MVN) integration [23]. However, it is impossible to calculate any specific gate probability by this method when the correlated seismic failures are separately located under many gates.
To calculate seismic risks with the real correlation level among seismic failures of redundant/identical components, a new method was developed to convert correlated seismic failures into seismic common cause failures (CCFs) [23]. This method can be used to calculate best-estimate seismic risks, such as the single-unit CDF (SUCDF), multi-unit CDF (MUCDF), and site (SCDF) (see Section 3.1).

1.3. Definitions of MUCDF and SCDF

In MUPSA, the multi-unit and site conditional core damage probabilities (CCDPs) for two-unit nuclear units are defined as [10]
CCDP multi unit = p ( U 1 U 2 ) ,
CCDP site = p ( U 1 + U 2 ) =   p ( U 1 / U 2 ) +   p ( / U 1 U 2 ) +   p ( U 1 U 2 ) .
Here, multi-unit CCDP is the conditional probability that at least two NPPs are in a core damage state after an initiating event. Site CCDP represents the conditional probability that at least one NPP is in a core damage state following an initiating event. The normal gates U1 and U2 represent NPPs in a core damage state, and the complemented gates /U1 and /U2 represent NPPs in a non-core damage state. The SCDF and MUCDF are calculated by multiplying the seismic initiating event frequency and CCDPs in Equations (1) and (2), respectively.
In a usual MUPSA [10], CCDP sin gle unit was defined as p ( U 1 / U 2 ) +   p ( / U 1 U 2 ) . However,   CCDP sin gle unit is defined as p ( U 1 ) =   p ( U 1 / U 2 ) +   p ( U 1 U 2 ) or p ( U 2 ) = p ( / U 1 U 2 ) +   p ( U 1 U 2 ) for the streamlined explanation of SUPSA in this study. That is, SUCDF denotes the multiplication of seismic initiating event frequency and p(U1) or p(U2) in this study.

1.4. Original Seismic MUPSA Model (Model A)

In this study, two seismic SUPSA fault trees are connected by an AND gate and an OR gate to calculate the MUCDF and SCDF, respectively. Each seismic SUPSA fault tree in Figure 1 has four correlated seismic failures of redundant/identical components (X1 to X4 for U1 and X5 to X8 for U2), which exist under the two AND gates. The seismic MUPSA fault tree in Figure 2 has eight correlated seismic failures (X1 to X8). Since there is no fault tree simplification in Figure 1 and Figure 2 by the assumption of the full correlation among seismic failures, best-estimate SUCDF and MUCDF are calculated by the fault trees in Figure 1 and Figure 2 following the calculation procedure in Section 3.

1.5. Simplified Seismic MUPSA Model (Model B)

The combination probabilities of correlated seismic failures such as P 1 n ( a ) and P 1 + + n ( a ) are calculated using MVN integration, as shown in Equations (3) and (4) [18,23]. If the correlated seismic failures of redundant/identical components are assumed to have a full correlation, the MVN integration is simplified to a single-variable normal (SVN) integration, as shown on the right-hand side of Equations (3) and (4).
P 1 n ( a ) = ln ( a / A 1 m ) β 1 ln ( a / A n m ) β n 1 | Σ ρ | ( 2 π ) 2 exp ( 1 2   z t Σ ρ 1 z ) d z 1 d z n ln ( a / A m ) β 1 2 π exp ( 1 2 z 2 ) d z
P 1 + + n ( a ) = 1 ln ( a / A 1 m ) β 1 ln ( a / A n m ) β n 1 | Σ ρ | ( 2 π ) 2 exp ( 1 2   z t Σ ρ 1 z ) d z 1 d z n ln ( a / A m ) β 1 2 π exp ( 1 2 z 2 ) d z
Here, A i m is the seismic capacity, β i is the composite beta of β i R 2 + β i U 2 , and z t is an integration vector that can be represented as [ z 1   z 2 z n ] . The matrix Σ ρ is a symmetric correlation matrix, and | Σ ρ | is the determinant of Σ ρ . The correlation matrix is given by Equation (5) below, where ρ i j is the correlation between the seismic failures i and j .
Σ ρ = [ 1 ρ 12 ρ 1 n ρ 21 1 ρ 2 n ρ n 1 ρ n 2 1 ]   ,   ρ i j = β i j 2 β i β j
Since the inverse matrix Σ ρ 1 does not exist for the full correlation ρ i j = 1 , the MVN integrations in Equations (3) and (4) are impossible. In this case, the SVN integrations on the right-hand should be employed. As an alternative approximation, ρ i j = 0.999 instead of 1 can be used for MVN integrations.
In Model B, all correlated seismic failures of redundant/identical components in a single nuclear unit are replaced with one typical seismic failure with the full correlation assumption. The four correlated seismic failures that are under the two AND gates in Figure 1 are simplified to one seismic failure in Figure 3 by applying the full correlation assumption. As shown in Equation (3), this simplification guarantees a conservative SUCDF.
Simplified fault trees such as that in Figure 3 are combined into SCDF and MUCDF fault trees in Figure 4. As shown in Equation (3), if the full correlation assumption is applied to correlated seismic failures that are under an AND gate, the AND gate probability is maximized. As shown in Figure 4, the seismic events X1 and X5 are combined with an AND gate at the top level for MUCDF. If the full correlation assumption is applied to X1 and X5, the conservative MUCDF can be calculated if the full correlation assumption is applied to X1 and X5.
As shown in Equation (4), if the full correlation assumption is applied to correlated seismic failures that are under an OR gate, the OR gate probability is minimized. As shown in Figure 4, the seismic events X1 and X5 are combined with an OR gate at the top level for SCDF. If the full correlation assumption is applied to X1 and X5, the SCDF will be non-conservative, and therefore, it will not be allowed in the NPP regulation.

1.6. Objectives of This Study

NPP regulation does not allow any non-conservative seismic risks for the SUCDF, MUCDF, or SCDF. Hence, the objective of this study was to perform a sensitivity calculation of these seismic CDFs by varying the seismic correlation level of redundant/identical component failures in seismic SUPSA and MUPSA in order to (1) investigate whether seismic risks can be conservatively calculated under the full correlation assumption, (2) determine the level of overestimation of seismic risks when this assumption is applied to redundant/identical components, and (3) identify the type of the seismic PSA model appropriate for NPP regulation for SUCDF, MUCDF, and SCDF.
The objectives were very difficult to achieve since the seismic MUPSA fault tree has both intra-unit and inter-unit correlated seismic failures of redundant/identical components. Furthermore, MVN integration is impossible when correlated seismic failures are located under different logical gates in the SUPSA or MUPSA fault tree. Therefore, the correlated seismic failures were converted into seismic CCFs using the COREX tool [23], as explained in Section 3.1. The correlated seismic failures in Figure 2 and Figure 4 were converted into seismic CCFs in Figure 5 and Figure 6, respectively. The SUCDF, SCDF, and MUCDF could then be easily calculated using the same techniques and tools used in the internal PSA.
Table 1 has a summary of Section 1. In the traditional seismic SUPSA, a seismic CDF calculation was impossible when correlated seismic failures spread over a fault tree. To avoid this problem, the correlated seismic failures were replaced with one seismic failure by assuming a full correlation among the seismic failures. Fortunately, the recent COREX method [23] made it possible to calculate accurate seismic CDF by converting correlated seismic failures into seismic CCFs. This study is the first application of the COREX method. Model A in Figure 5 is a complete COREX method application to seismic SUPSA and MUPSA, and Model B in Figure 6 is a hybrid of a full correlation assumption and the COREX method application.
Seismic SUPSAs have been performed for decades with simplified seismic SUPSA models assuming a full correlation among the correlated seismic failures. In recent seismic MUPSAs, these imperfect SUPSA models have been combined into a seismic MUPSA model that is similar to Model B. Current seismic MUPSAs have been performed with this imperfect seismic MUPSA model forgetting the full correlation assumption and without awareness of the possibility of the seismic CDF distortion that can result from the full correlation assumption. There has been no study to confirm the seismic CDF distortion from the full correlation assumption. In this study, an accurate seismic MUPSA model (Model A) and an imperfect seismic MUPSA model (Model B) were created and their seismic risks were compared to provide PSA industry and regulators with proper insights regarding this seismic CDF distortion.

2. Calculation Model

2.1. SUCDF Fault Trees

Figure 7 shows the event tree of OPR1000 NPPs used for the seismic SUPSA in this study. The event tree has four accident sequence headings that cause core damage. Loss of essential power system (LOEPS) denotes failure of the 480-V alternating current (AC) and 125-V direct current (DC), and small loss-of-coolant accident (SLOCA) causes core damage owing to the failure of instrument piping. Furthermore, large loss-of-coolant accident (LLOCA) indicates large coolant loss owing to the failure of safety injection tanks, and loss of process control system (LOPCS) implies the failure of power to operate the components used for safety functions. These accident sequence headings were separated into Trains A and B (see Figure 8). The numbers of basic events for the fault trees of the accident sequence headings are listed in Table 2.
Figure 8 and Figure 9 show SUPSA fault trees for the seismic event tree in Figure 7. The seismic failures of redundant/identical components can be simplified to one seismic failure by applying the full correlation assumption to the correlated seismic failures of redundant/identical components. For example, the four seismic failures SITSF_A, SITSF_B, SITSF_C, and SITSF_D in Figure 8 can be simplified to one seismic failure, namely SITSF, in Figure 9 by this full correlation assumption. As listed in Table 3, 11 groups of correlated seismic failures in Model A are simplified to 11 seismic failures in Model B using the full correlation assumption.

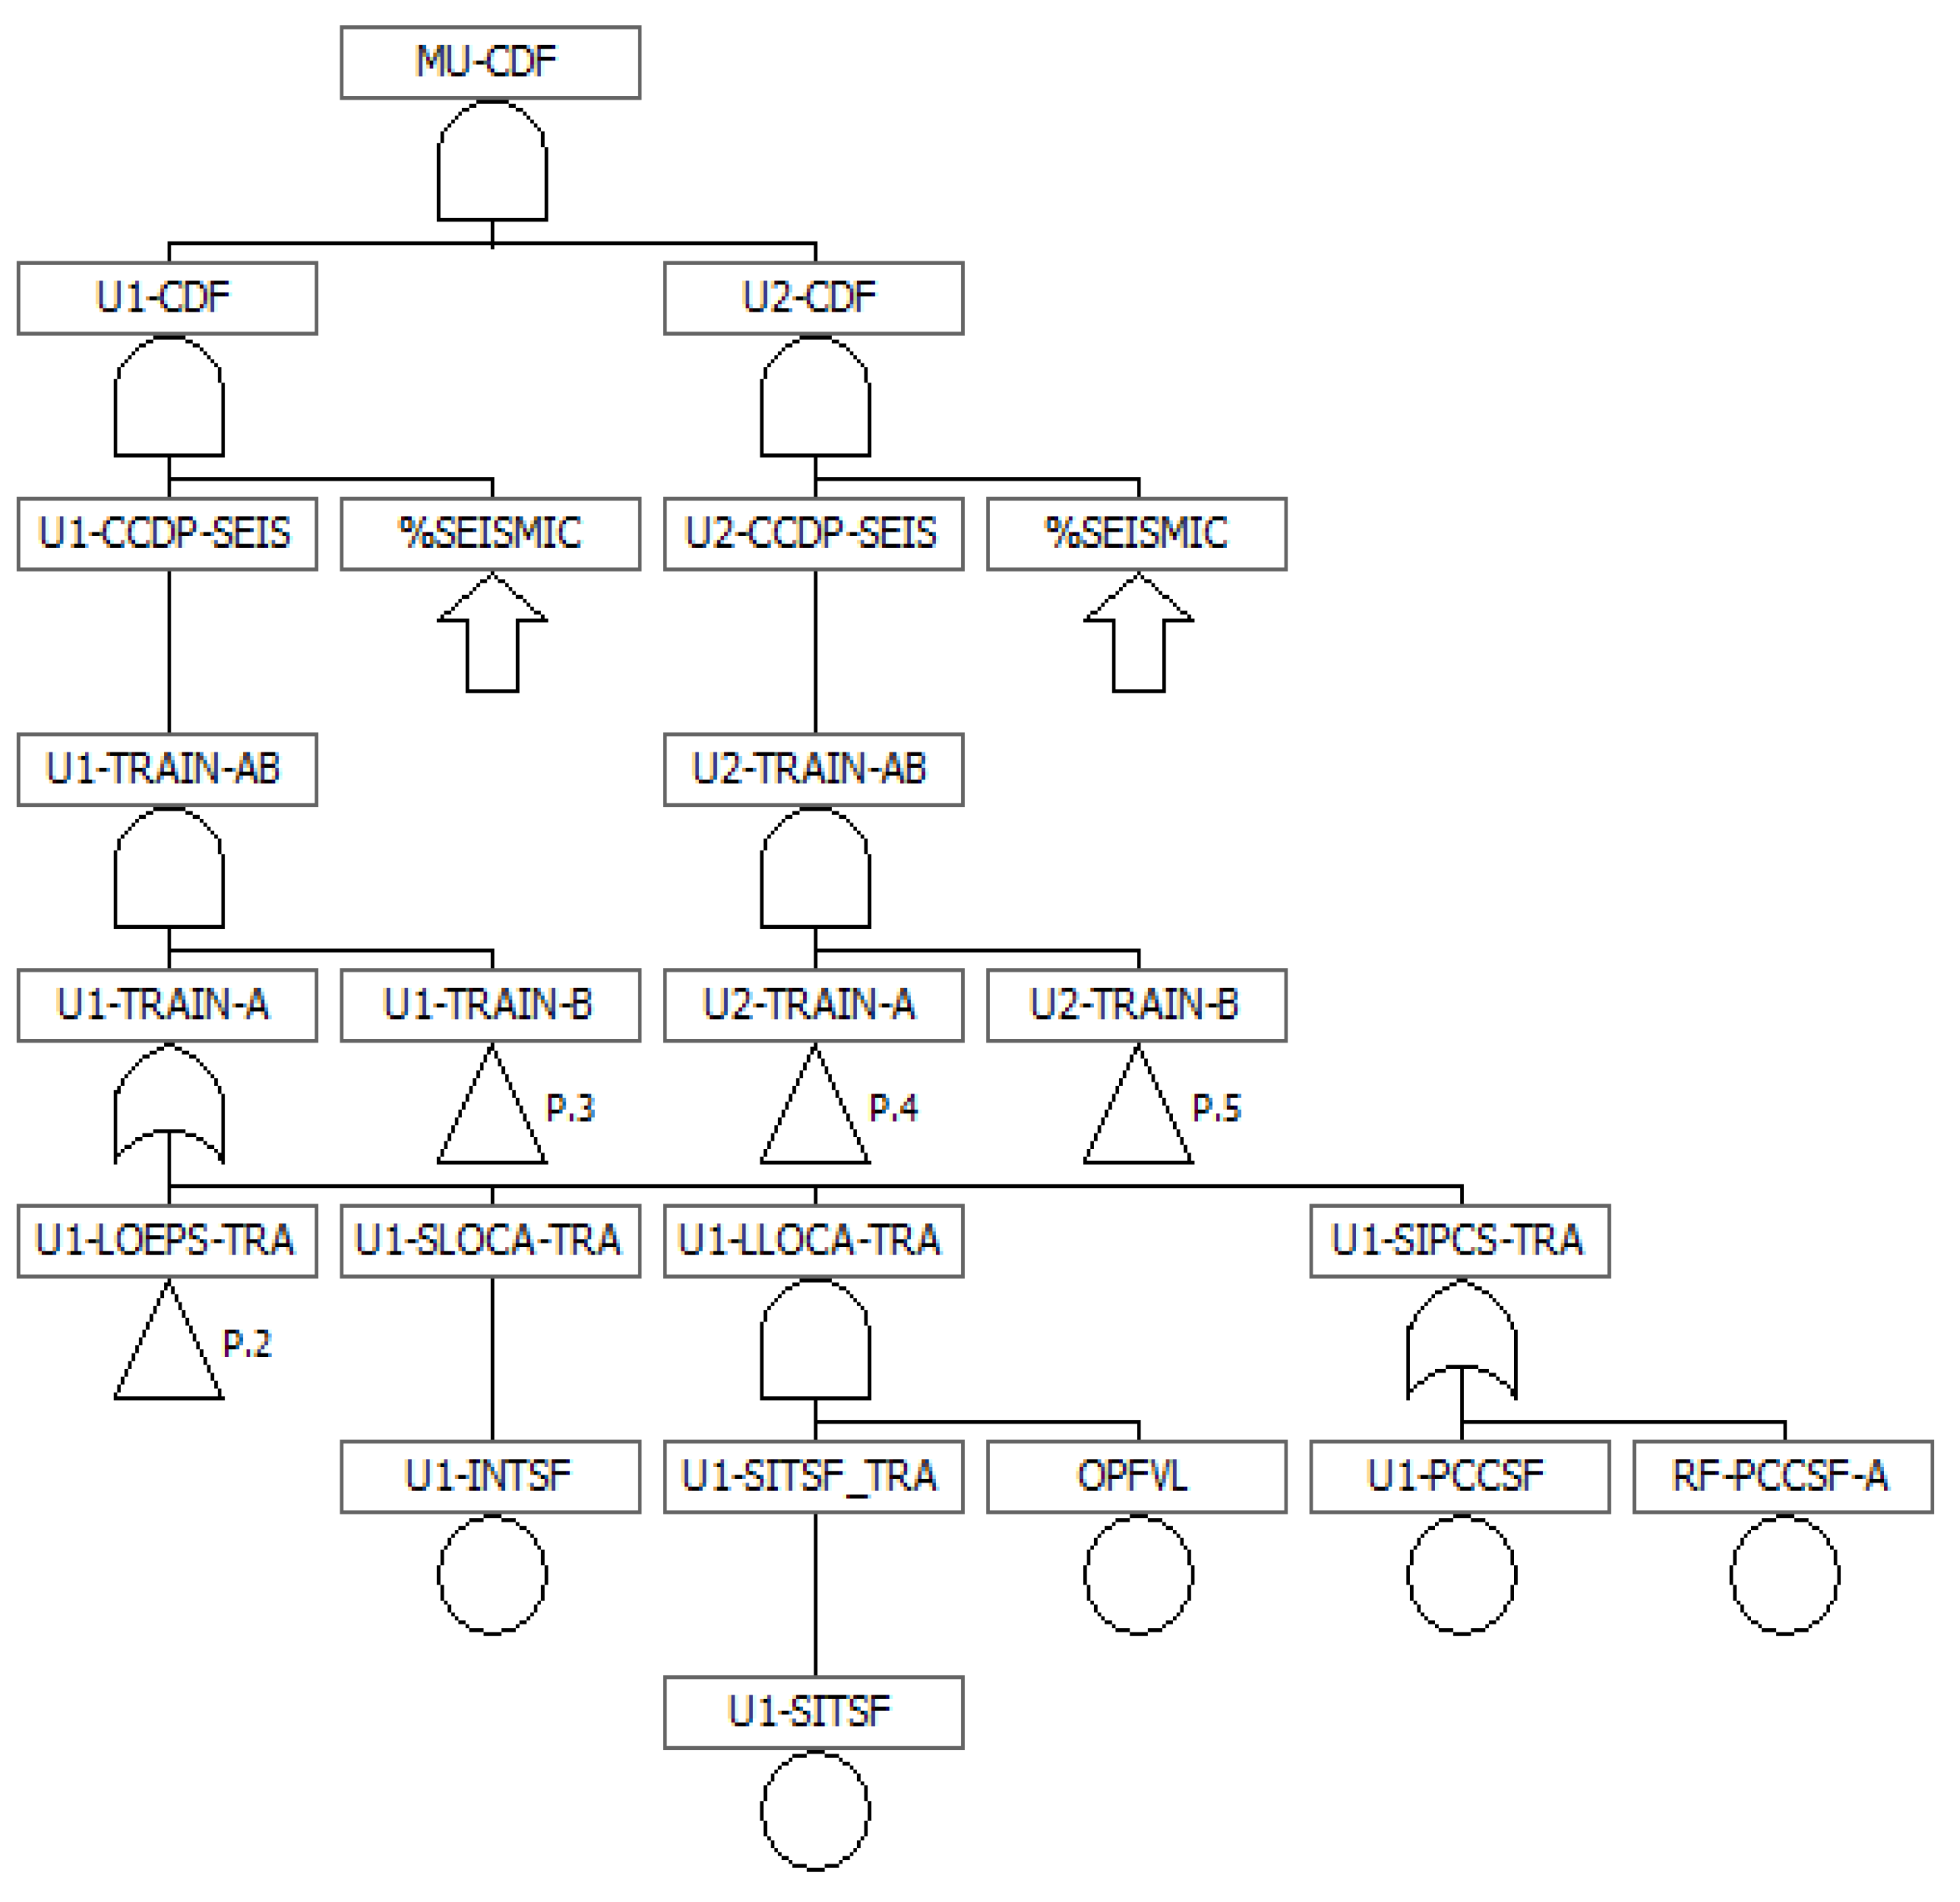
2.2. MUCDF Fault Trees

Figure 10 and Figure 11 show MUPSA fault trees for Models A and B, respectively. The intra-unit seismic failures of redundant/identical components in Figure 10 can be simplified to one seismic failure in Figure 11 by applying the full correlation assumption to correlated seismic failures of redundant/identical components. For example, the four seismic failures U1-SITSF_A, U1-SITSF_B, U1-SITSF_C, and U1-SITSF_D in Figure 10 can be simplified to one seismic failure, namely U1-SITSF, in Figure 11 by this full correlation assumption. Similarly, the four seismic failures U2-SITSF_A, U2-SITSF_B, U2-SITSF_C, and U2-SITSF_D can be simplified to one seismic failure, U2-SITSF. As listed in Table 4, 11 groups of correlated seismic failures in Model A were simplified to 11 seismic failures for each NPP in Model B.

2.3. SCDF Fault Trees

If the AND logic at the top level of the MUCDF fault trees in Figure 10 and Figure 11 is replaced with OR logic, the trees become SCDF fault trees for Models A and B, respectively.

2.4. Seismic Data

The ground acceleration was divided into seven intervals, as shown in Table 5, and the mean ground acceleration in each interval was used for calculating the seismic SUCDF, MUCDF, and SCDF. The seismic data in Table 5 was used for calculating the probability of seismic failures in Table 3 and Table 4.
In Table 6, all the event names are abbreviated from the names of components and failure mode. The seismic failure events used in this study are as follows: Emergency Diesel Generator Seismic Failure (EDGSF), Middle-Voltage (4.16 kV) Structural Seismic Failure (MVSSF), Middle-Voltage Functional Seismic Failure (MVFSF), Low-Voltage Structural Seismic Failure (LVSSF), Low-Voltage Functional Seismic Failure (LVFSF), Motor Control Center Seismic Failure (MCCSF), DC Control Center Seismic Failure (DCCSF), Battery Charger Seismic Failure (BCHSF), Safety Injection Tank Seismic Failure (SITSF), Inverter Feature Seismic Failure (INFSF), and Instrumentation Tube Seismic Failure (INTSF).

3. Seismic Risk Calculation Procedure

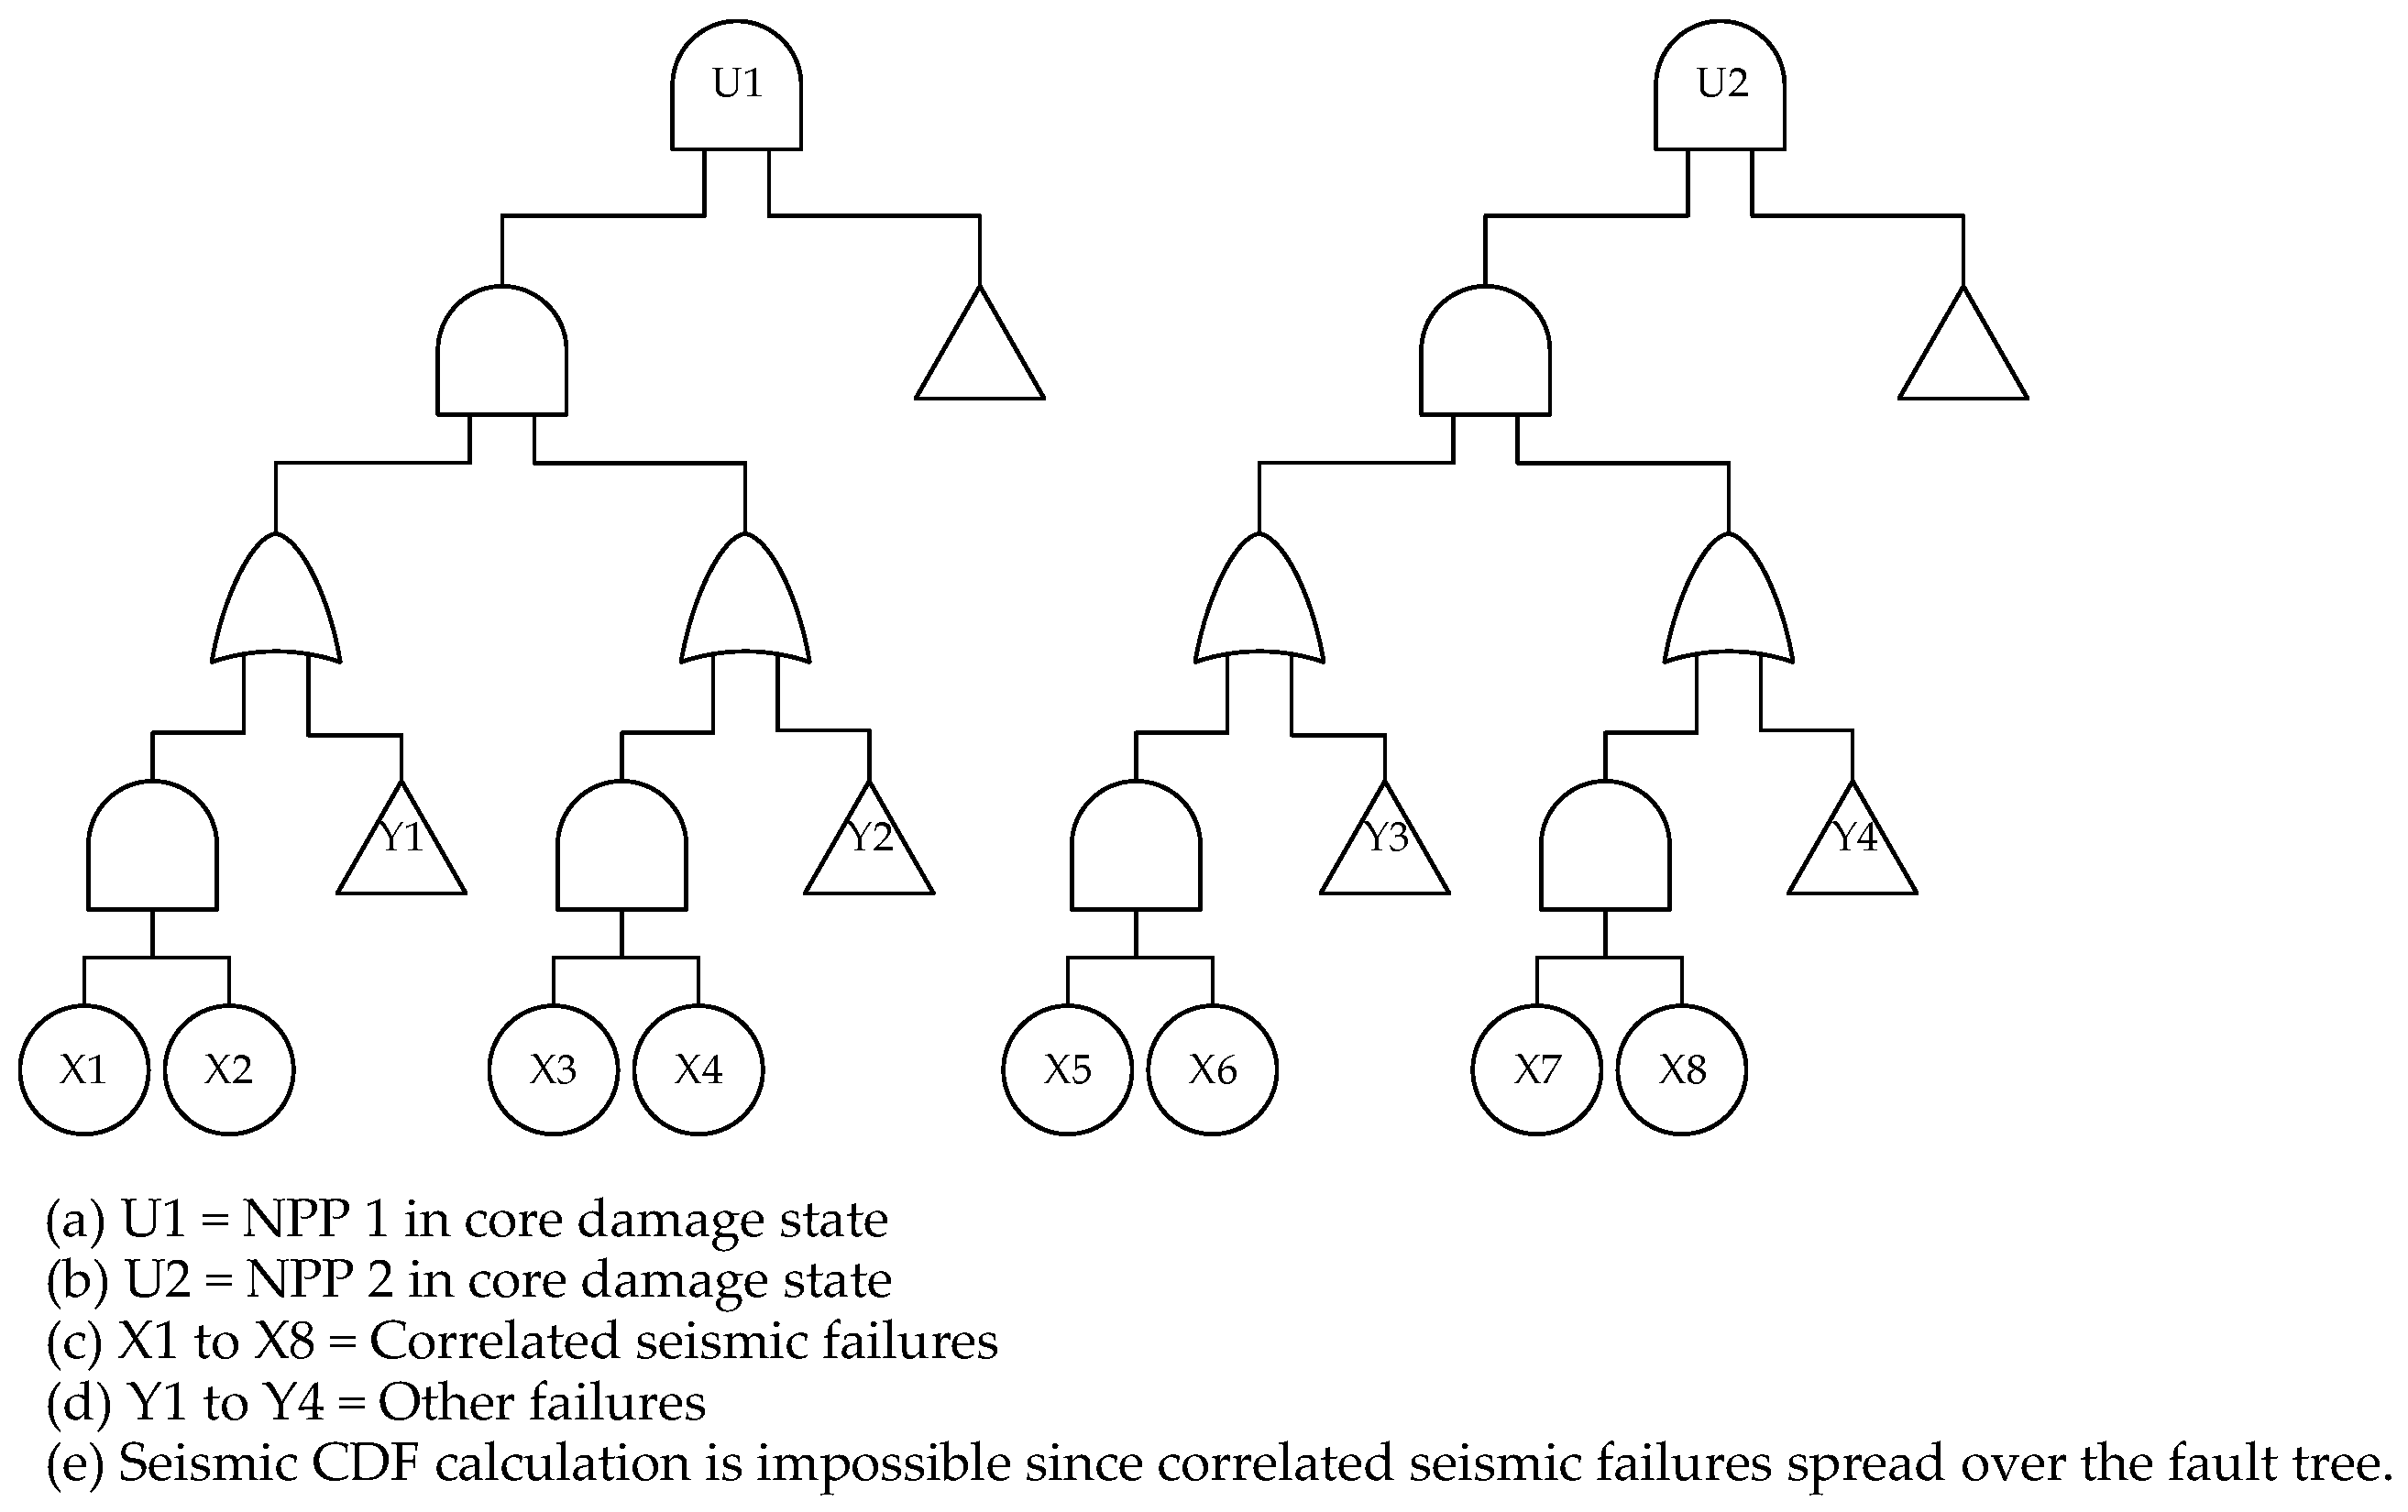
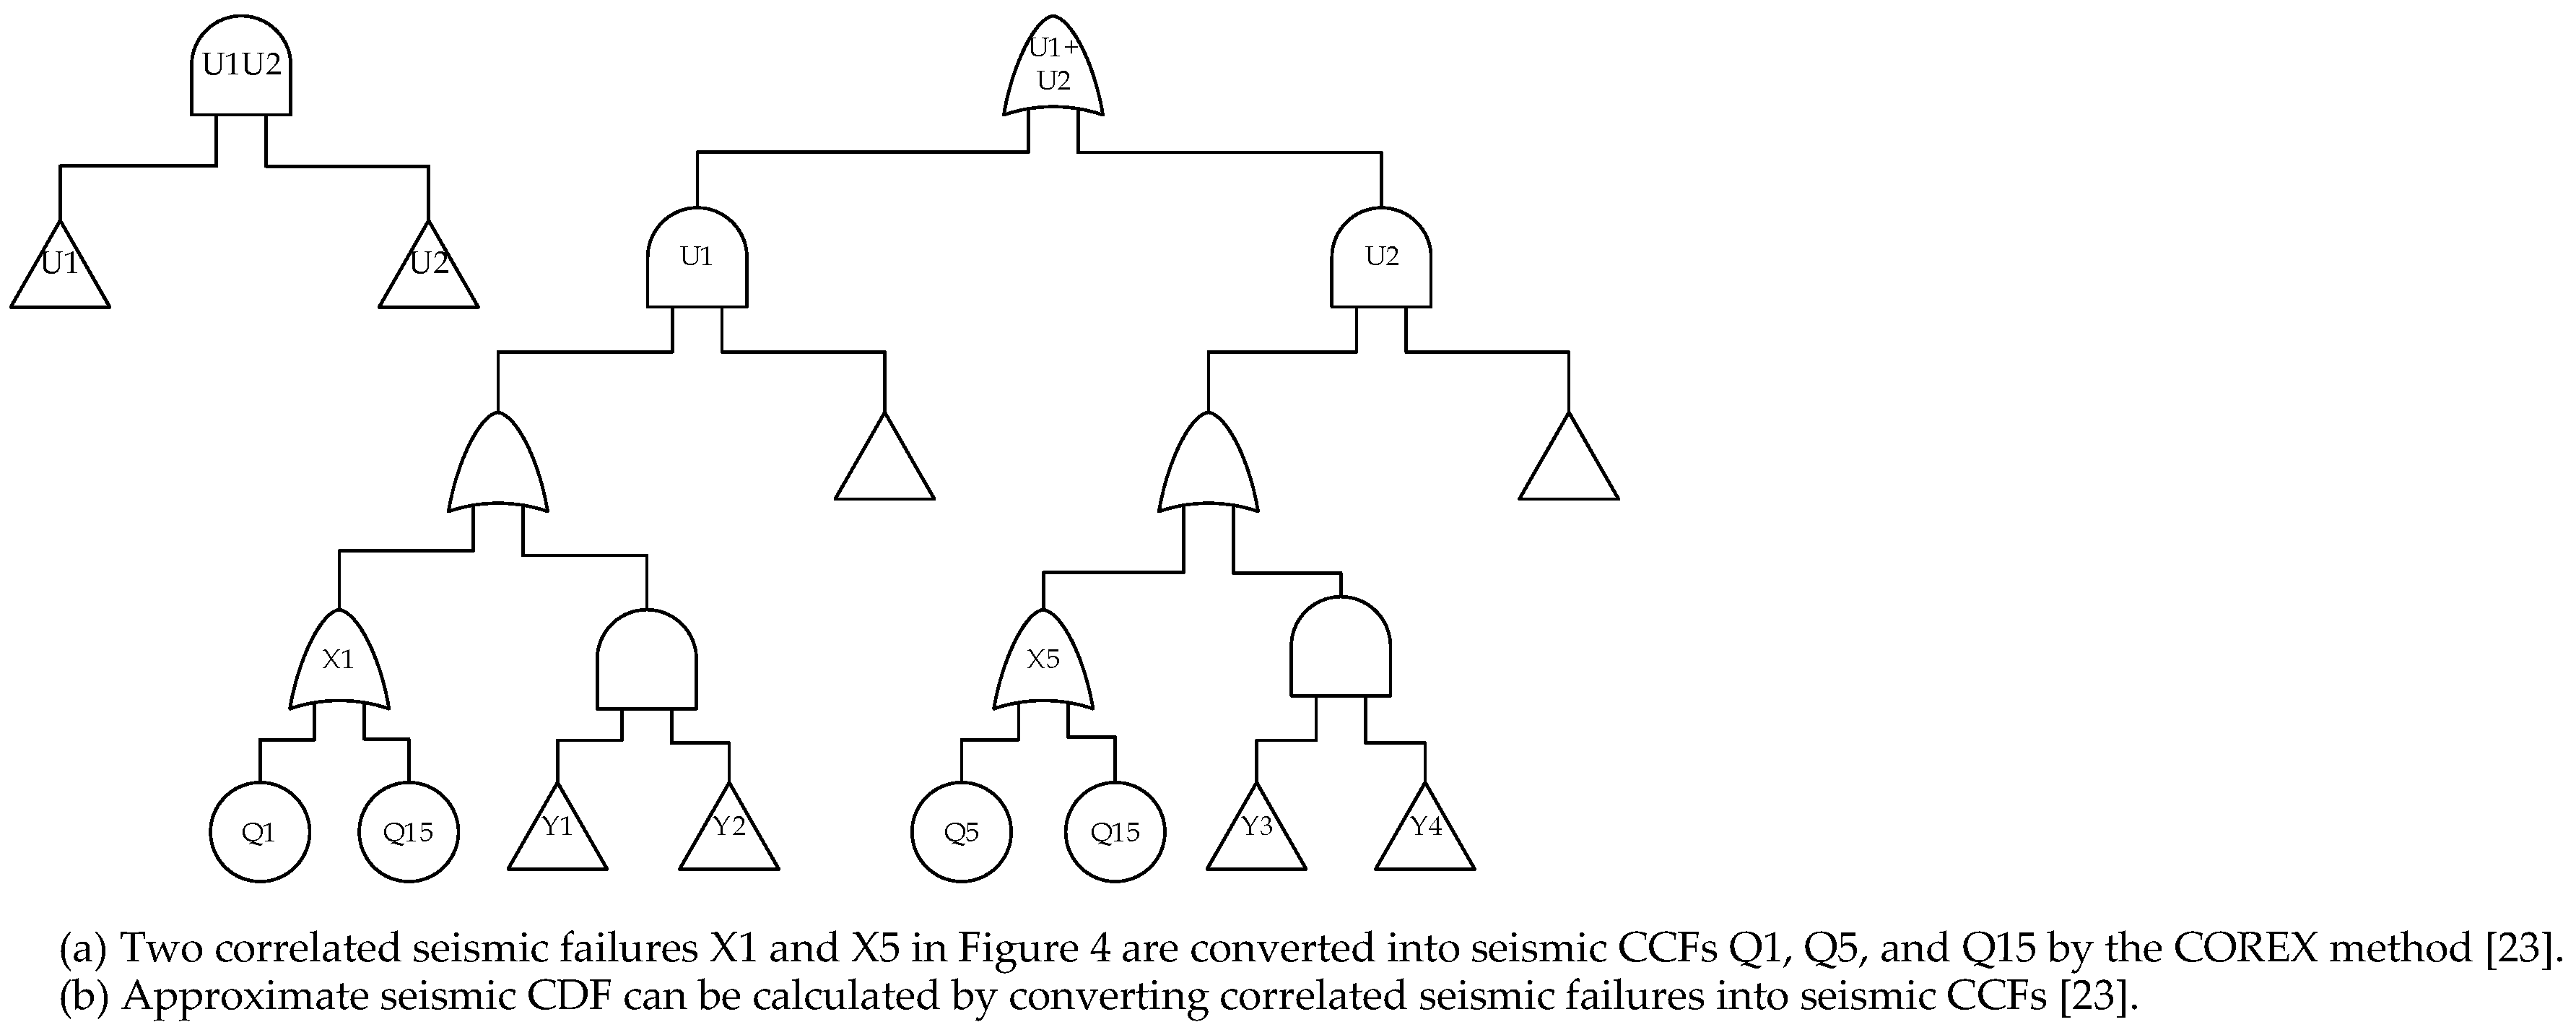
3.1. Conversion of Correlated Seismic Failures into Seismic CCFs

The combination probability of correlated seismic failures can be calculated through MVN integration using Equations (3) or (4) if they are located under the same logical gate in a fault tree. However, the correlated seismic failures of redundant/identical components are separately located under several logical gates in a fault tree that has correlated seismic failures. In short, the gate probability cannot be calculated by MVN integration.
In the previous study [23], a method to convert correlated seismic failures into seismic CCFs was developed to overcome this problem. If the correlated seismic failures of redundant/identical components that are separately located under several logical gates can be converted into seismic CCFs, the seismic SUCDF, MUCDF, and SCDF can be calculated with the same techniques and tools used for the internal PSA.
If a seismic fault tree has n seismic failures, the COREX tool [23] calculates 2 n 1 OR combination probabilities ( P i , P i + j , P i + j + k , …) on the left-hand side of Equation (6) using Equation (4), solves the 2 n 1 nonlinear simultaneous equations in Equation (6), and generates 2 n 1 seismic CCF probabilities ( Q i , Q i j , Q i j k , …).
P 1 = 1 ( 1 Q 1 ) ( 1 Q 12 ) ( 1 Q 13 ) ( 1 Q 123 n ) P 2 = 1 ( 1 Q 2 ) ( 1 Q 12 ) ( 1 Q 23 ) ( 1 Q 123 n )   P 3 = 1 ( 1 Q 3 ) ( 1 Q 13 ) ( 1 Q 23 ) ( 1 Q 123 n ) P 1 + 2 = 1 ( 1 Q 1 ) ( 1 Q 2 ) ( 1 Q 12 ) ( 1 Q 13 ) ( 1 Q 23 ) ( 1 Q 123 n ) P 1 + 3 = 1 ( 1 Q 1 ) ( 1 Q 3 ) ( 1 Q 12 ) ( 1 Q 13 ) ( 1 Q 23 ) ( 1 Q 123 n ) P 2 + 3 = 1 ( 1 Q 2 ) ( 1 Q 3 ) ( 1 Q 12 ) ( 1 Q 13 ) ( 1 Q 23 ) ( 1 Q 123 n ) P 1 + 2 + 3 = 1 ( 1 Q 1 ) ( 1 Q 2 ) ( 1 Q 3 ) ( 1 Q 12 ) ( 1 Q 13 ) ( 1 Q 23 ) ( 1 Q 123 n )
Then, as explained in Figure 5 and Figure 6, the n seismic failures ( X 1 , X 2 , …, X n ) are converted into OR gates that have corresponding seismic CCFs ( C i , C i j , C i j k , …), as shown in Equation (7). In other words, all the correlated seismic failures in the fault trees of Figure 8, Figure 9, Figure 10 and Figure 11 are converted into OR gates that have corresponding seismic CCFs.
X 1 = C 1 + C 12 + C 13 + + C 123 n X 2 = C 2 + C 12 + C 23 + + C 123 n   X 3 = C 3 + C 13 + C 23 + + C 123 n X n = C n + C 1 n + C 2 n + + C 123 n

3.2. Seismic Risk Calculation

As explained in Section 1.6 and Section 3.1, the correlated seismic failures were converted into seismic CCFs using the COREX tool [23]. Subsequently, minimal cut sets (MCSs) for single-unit conditional core damage probability (SUCCDP), multi-unit conditional core damage probability (MUCCDP), and site conditional core damage probability (SCCDP) were calculated using the same techniques and tools used in the internal PSA. Additionally, the MCSs were converted into a binary decision diagram (BDD) for calculating the SUCCDP, MUCCDP, and SCCDP more accurately. The SUCDF, MUCDF, or SCDF was then calculated using the following equation, which is similar to the equation used for the seismic PSA for the Surry NPP [17]:
C D F = i = 1 i = k C C D P ( a i ) H ( a i ) ,  
where a i is the ground acceleration at the center of the i th interval, C C D P ( a i ) is the seismic CCDP at a i , and H ( a i ) is the mean seismic frequency in Table 5.

4. Calculation Results

4.1. Calculation Results for SUCCDP and SUCDF

As shown in Figure 12 and Figure 13, SUCDF and SUCCDPs of Model A were calculated by varying both the ground acceleration in Table 5 and the correlation level of redundant/identical components in Table 3. The SUCCDPs of Model B could not be calculated for the partial correlation since one NPP had only one representative seismic failure of redundant/identical components.
In order to avoid singular Σ ρ for the full correlation calculation of Model A, MVN integration with ρ i j = 0.999 instead of 1.0 is used for calculating the OR combination probabilities, and then these OR combination probabilities are converted into seismic CCFs in Equation (6). On the other hand, SVN integration is employed for the full correlation calculation of Model B. So, there are minor differences in the SUCCDPs for the full correlation calculations between Models A and B.
Figure 12 was calculated by multiplying the SUCCDPs in Figure 13 and the mean seismic frequencies in Table 5 and summing the products. Since the AND combination probability increased with the correlation, as explained in Equation (3), the SUCDF of Model A increased with the correlation level. As shown in Figure 12, Models A and B yielded conservative SUCDFs for the full correlation assumption.
If there is no sufficient safety margin for the corresponding NPP safety goals, the SUCDF of Model A with the real correlation is recommended instead of SUCDF of Model B which is calculated under the full correlation assumption.

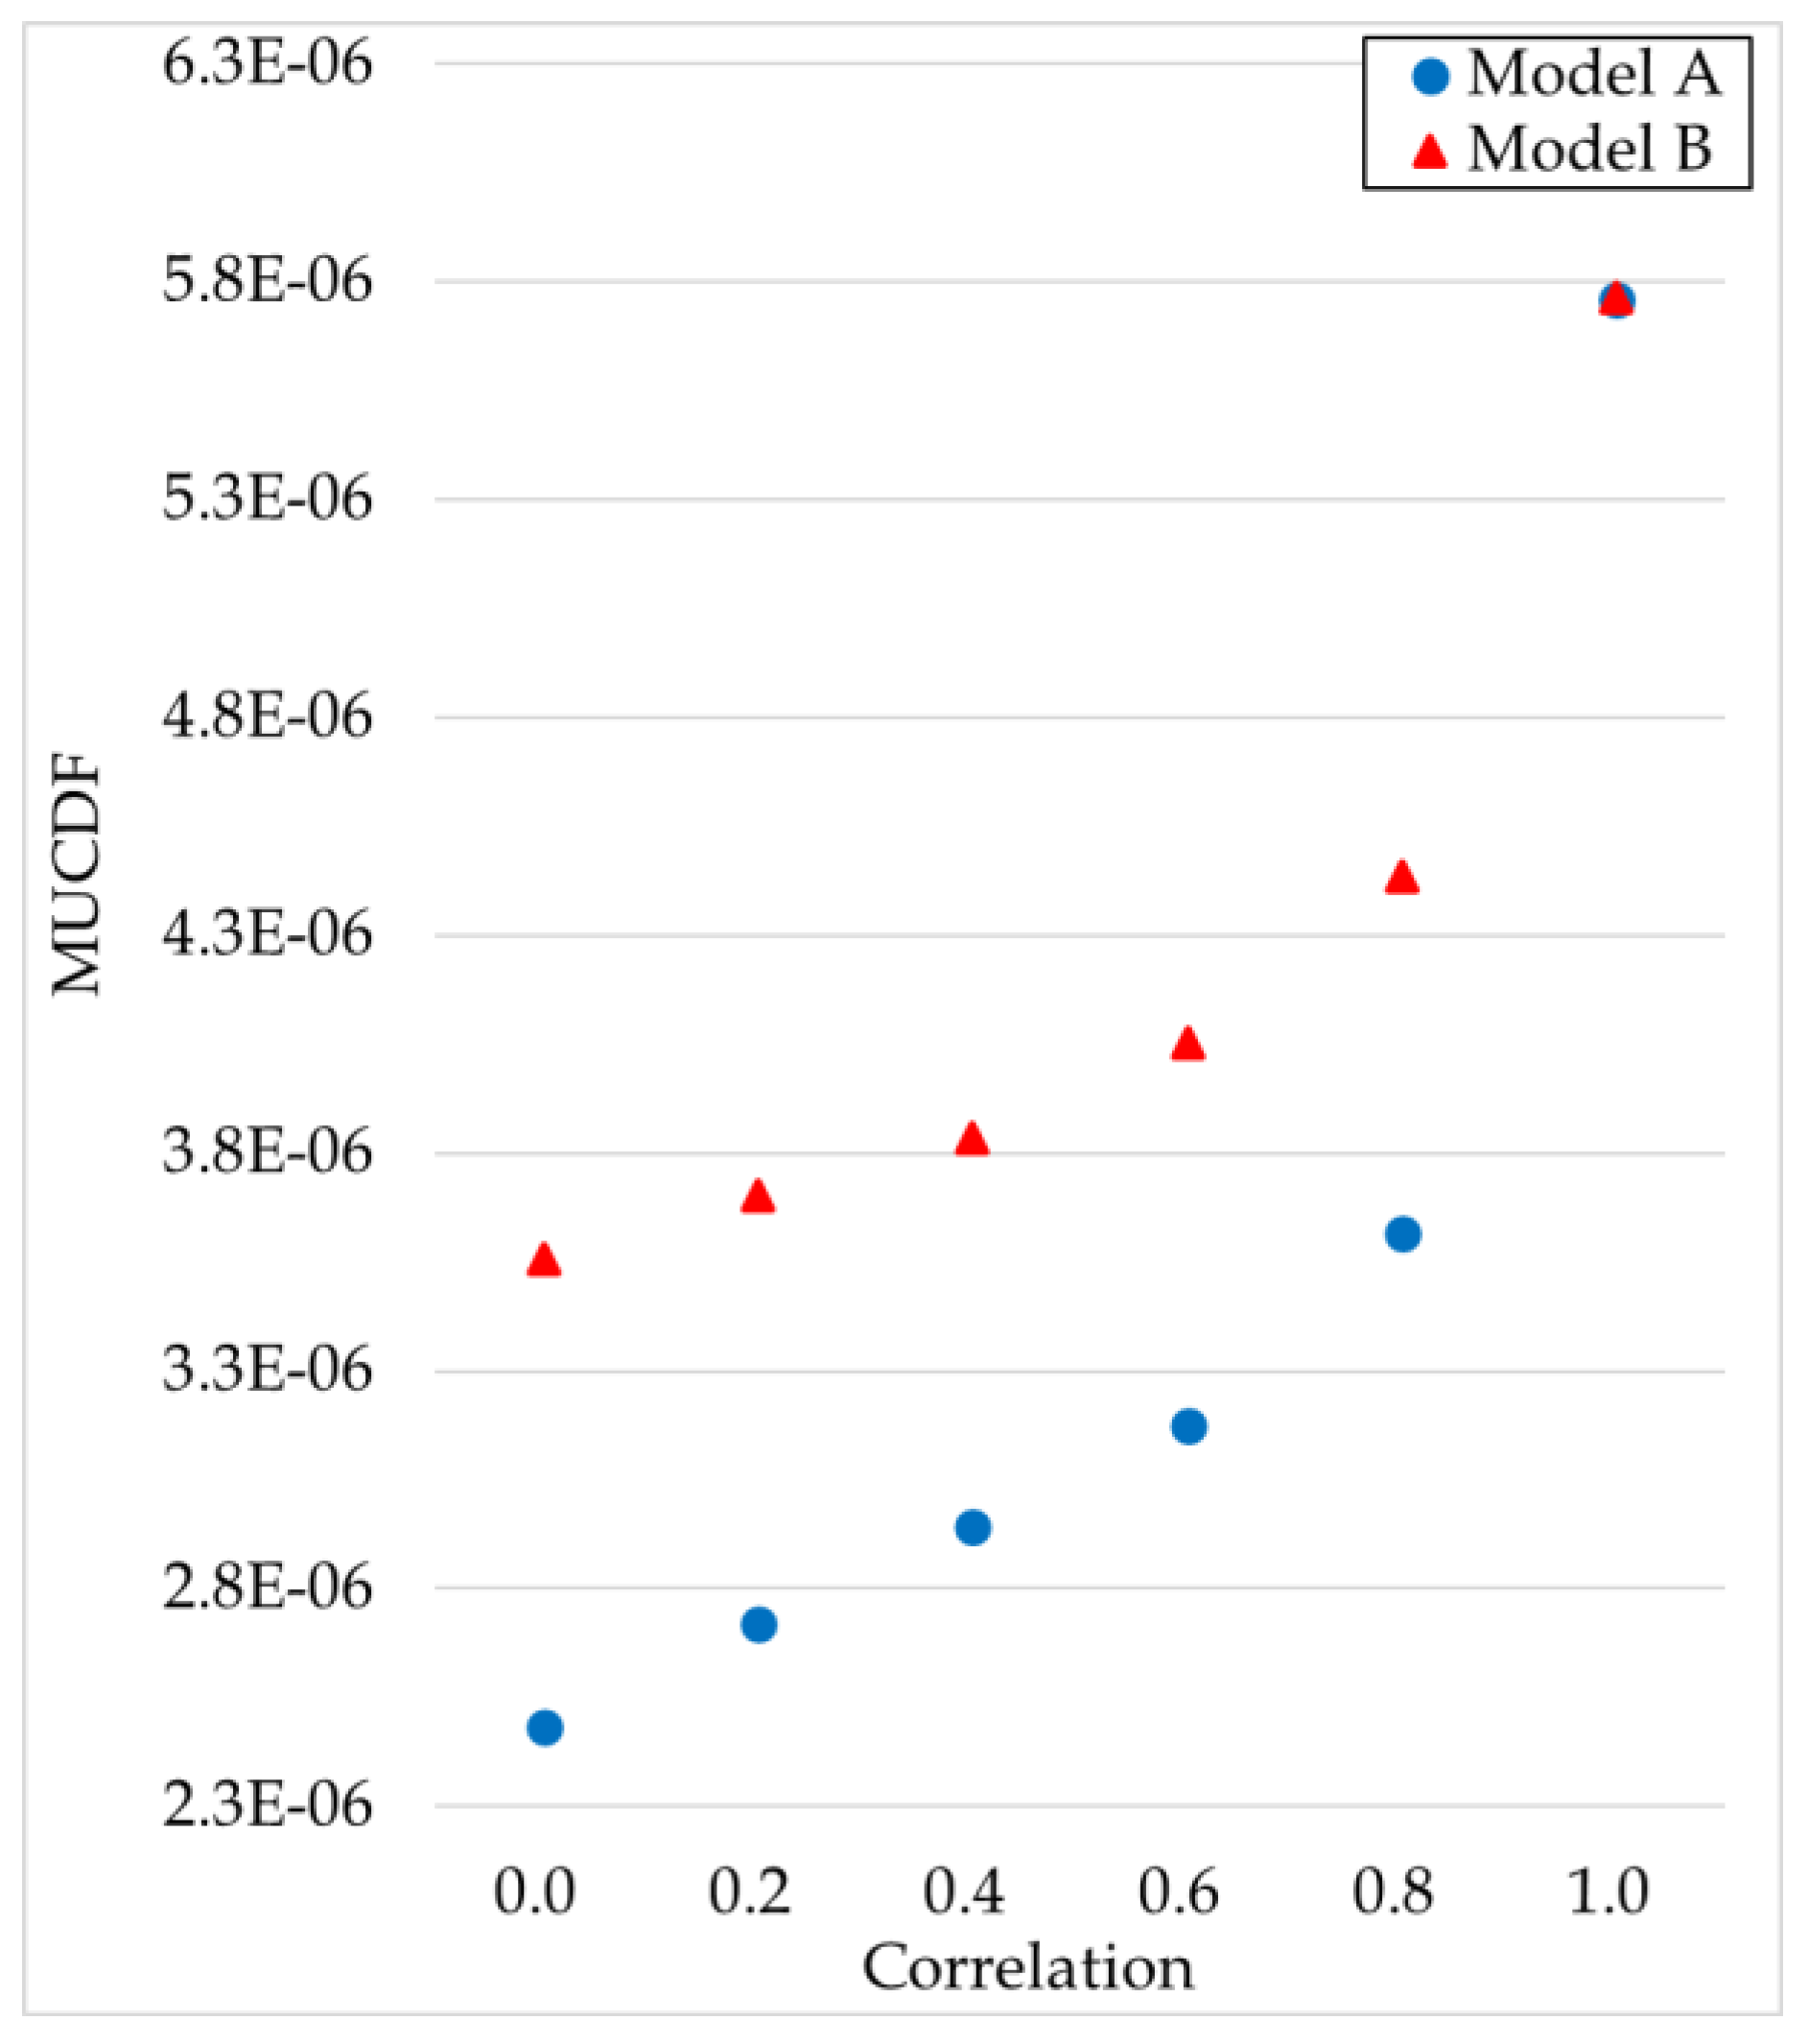
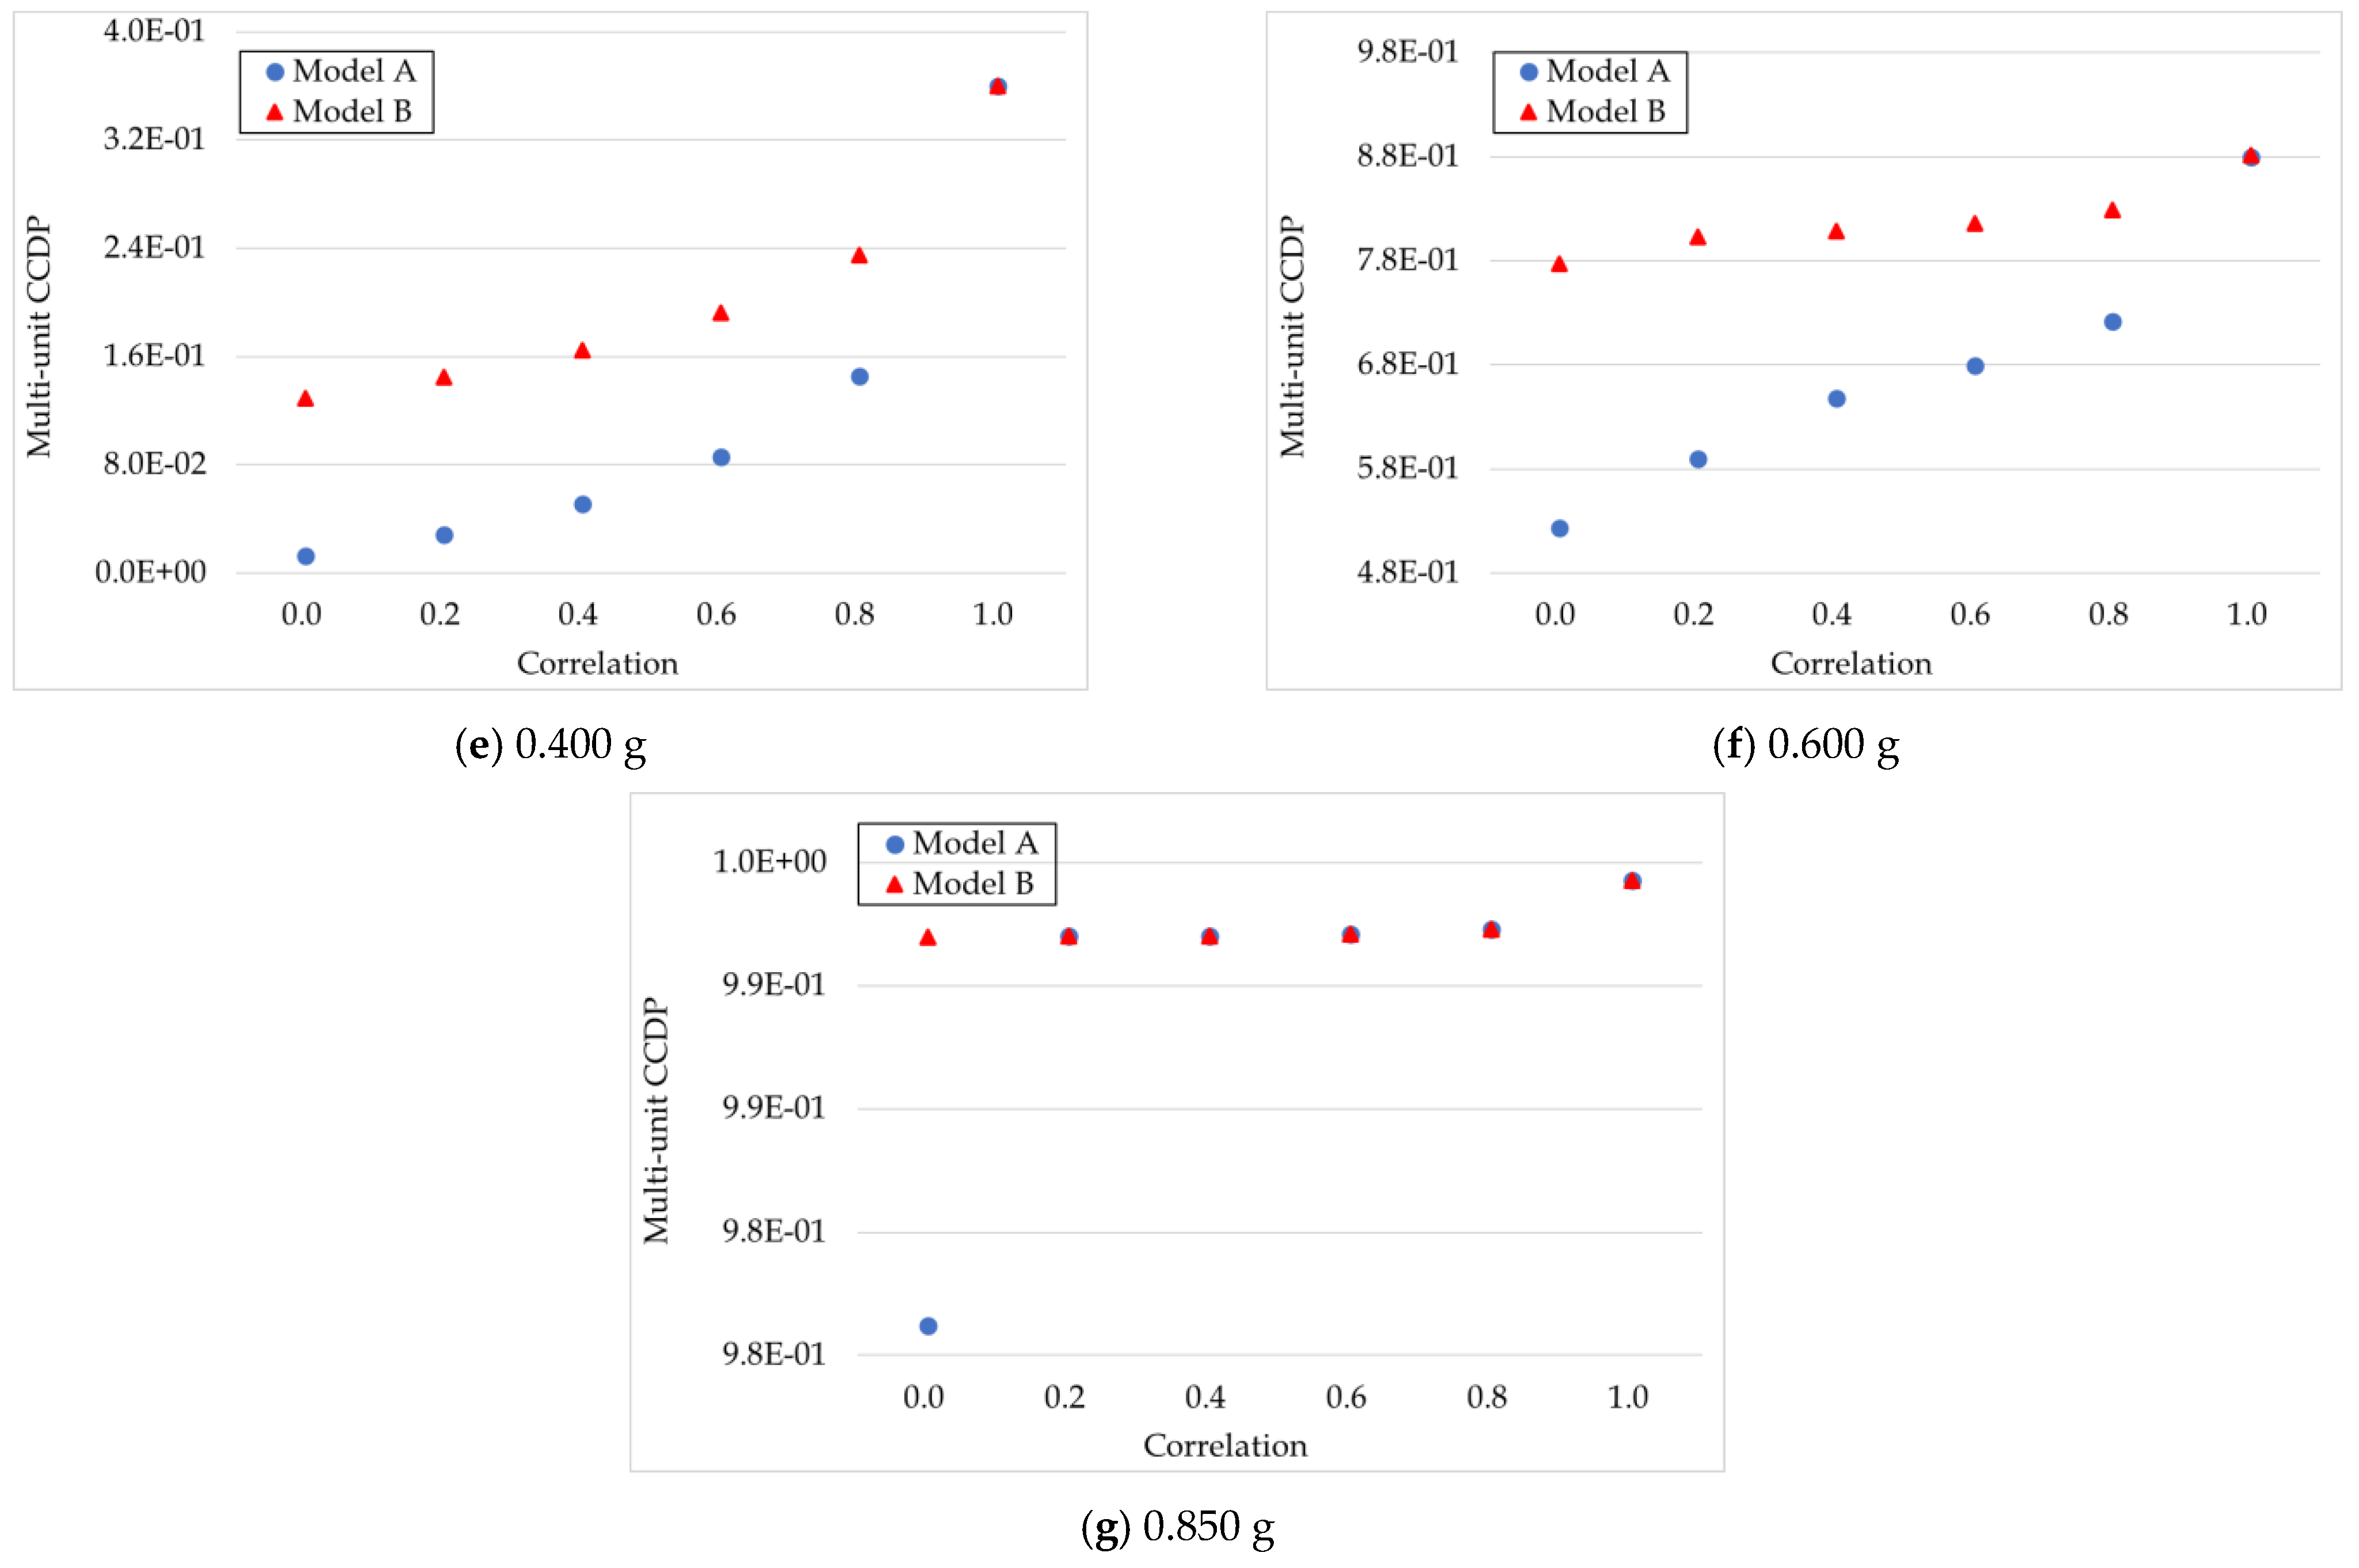
4.2. Calculation Results for MUCCDP and MUCDF

As shown in Figure 14 and Figure 15, MUCDF and MUCCDPs of Models A and B were compared by varying the ground acceleration in Table 5 and the correlation level of intra-unit and inter-unit redundant/identical components in Table 4.
In Model A, all correlated seismic failures of intra-unit and inter-unit redundant/identical components are converted into seismic failures. In Model B, all correlated seismic failures of intra-unit redundant/identical components are replaced with one typical seismic failure with the full correlation assumption, and then the correlated seismic failures of inter-unit redundant/identical components are converted into seismic CCFs.
The MUCDFs in Figure 14 were calculated by multiplying the MUCCDPs in Figure 15 and the mean seismic frequencies in Table 5 and summing the products. The MUCDFs of both Models A and B increased with the correlation level among the seismic failures of redundant/identical components, and the MUCDFs of both models were redundant/identical in the case of full correlation. The full correlation assumption resulted in conservative MUCDFs of Models A and B. However, Model A is recommended for the best-estimate calculation of MUCDF in all correlation ranges.
As shown in Figure 15, Models A and B had the highest MUCCDP at the full correlation. The MUCCDPs of both models increased with the ground acceleration. The MUCCDP of Model A for 0.85 g showed a rapid jump in correlation level from 0 to 0.2, and it was almost constant for the other correlation values. This means that all the components failed even at low correlation levels.

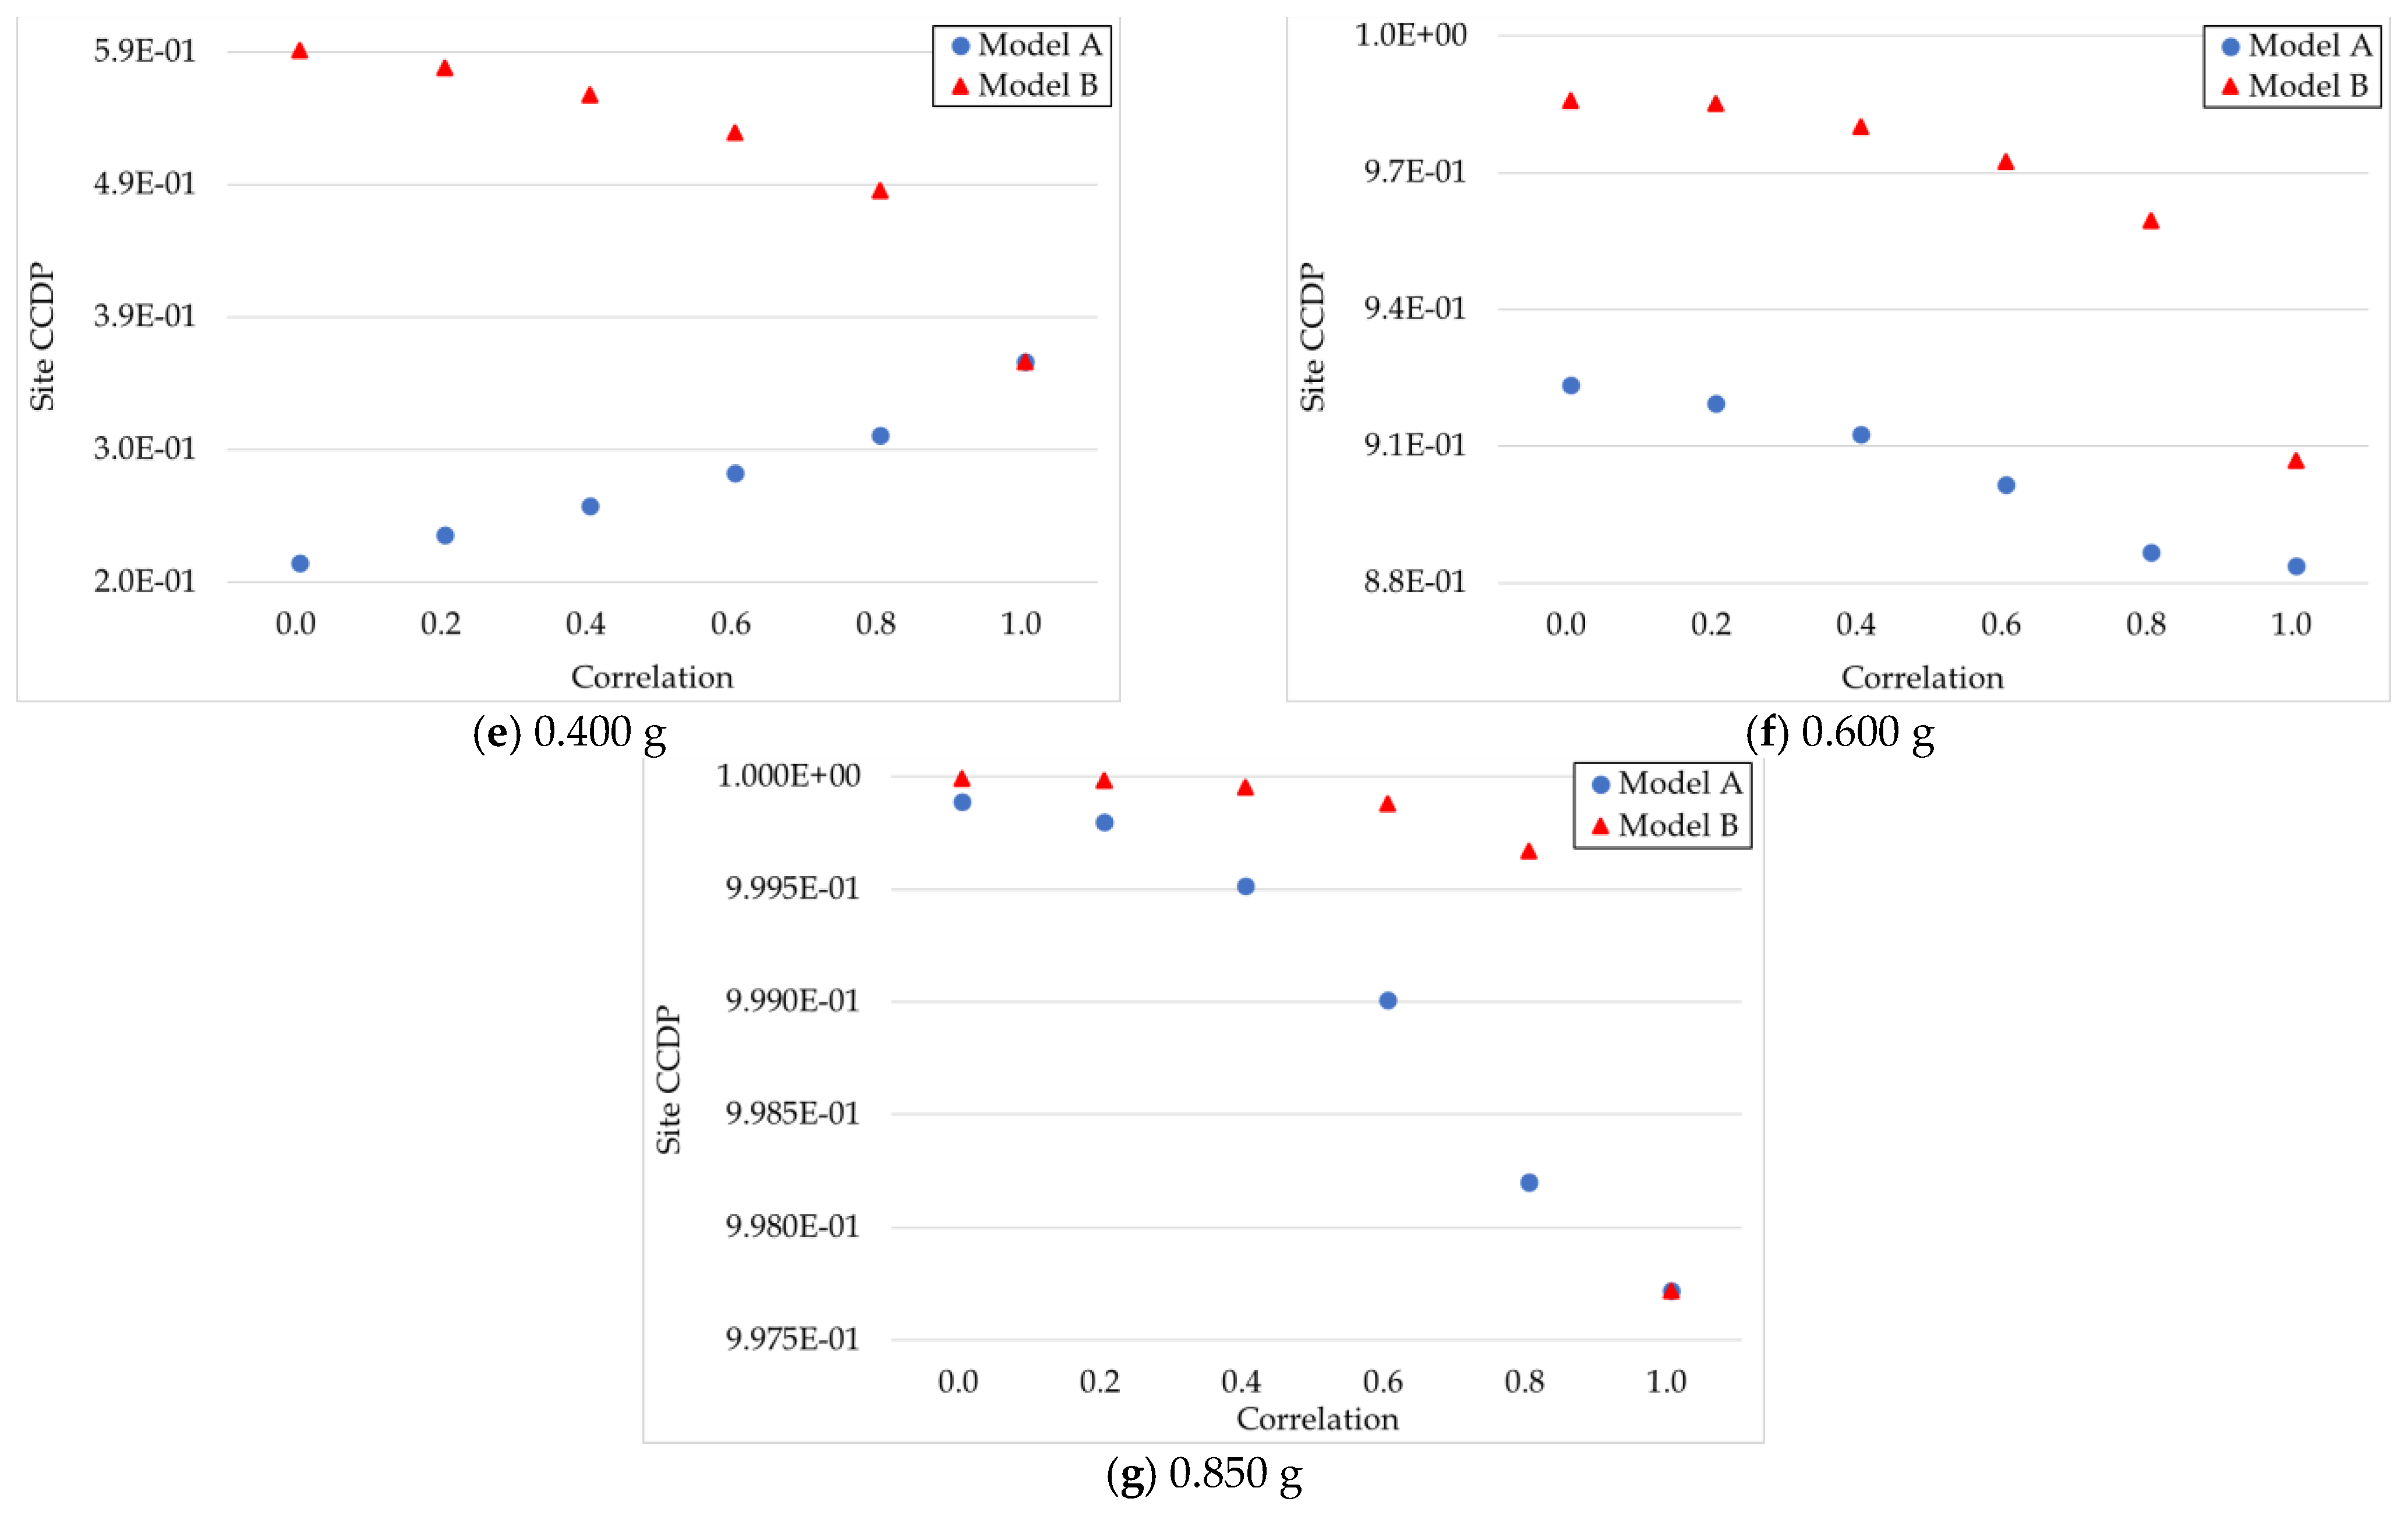
4.3. Calculation Results for SCCDP and SCDF

As shown in Figure 16 and Figure 17, the SCDF and SCCDPs of Models A and B for all ground accelerations in Table 5 are compared. The SCDF and SCCDPs are calculated by increasing the correlation level among intra-unit and inter-unit seismic failures of redundant/identical components in Table 4.
Figure 16 shows SCDFs of Models A and B that are calculated by multiplying the seismic initiator frequencies in Table 4 by the SCCDPs in Figure 17 and summing the products. It can be seen that the SCDF of Model B is unacceptably overestimated in all correlation ranges. The SCDFs of Models A and B are redundant/identical for the full correlation. The SCDF of Model B is so highly overestimated in the low correlation level that it cannot be used for NPP regulation purposes. It is recommended that the SCDF of Model A be used for NPP regulation purposes, since it is the best-estimate SCDF.
In Figure 17, the SCCDPs of Model B globally decrease over the seismic correlation level, although the SCCDPs of Model B below 0.225 g slightly increase and then decrease when the seismic correlation increases.
The SCCDP of Model A increases as the correlation level increases when the ground acceleration is less than 0.5 g. However, it decreases as the correlation level increases when the ground acceleration is greater than 0.5 g. This means that the SCCDP changes of Model A depend on the seismic model and seismic data. On the other hand, the SCCDP of Model B generally decreases as the correlation level increases for all ground accelerations.

5. Conclusions

A sensitivity study was performed by varying the correlation level and ground acceleration pertaining to seismic fault trees of OPR1000 NPPs to understand seismic risk changes. Furthermore, seismic risks calculated from the seismic fault trees of Models A and B were compared. The results of this sensitivity study can be summarized as follows:
  • As the correlation level increased, the seismic risks, i.e., SUCDF, MUCDF, and SCDF, increased for Model A. The seismic risks of Model A were always lower than those of Model B. Therefore, all the seismic risks of Model A can provide a sufficient safety margin for the corresponding safety goals.
  • As the correlation level increased, the seismic risks SUCDF and MUCDF of Models A and B increased. Arguably, Models A and B appeared to guarantee conservative seismic SUCDF and MUCDF.
  • The SCDF of Model B was strongly distorted in all correlation ranges compared with that of Model A. Therefore, one should be careful to utilize Model B.
In this paper, Model A is a complete COREX method [23] application to the seismic SUPSA and MUPSA, and Model B is a hybrid of a full correlation assumption and the COREX method application. Current seismic MUPSAs in Korea employ Model B, in which the full correlation assumption is applied to the correlated seismic failures of redundant/identical components in a single nuclear unit and then the remaining correlated seismic failures between nuclear units are converted into seismic CCFs. This resulted in distorted seismic risks. Therefore, one should be very careful to employ Model B if multi-unit safety goals are established and mandated in the future. Therefore, the use of Model A is recommended for calculating accurate seismic CDFs for seismic SUPSA and MUPSA.
Since there had been no method to calculate seismic CDF from the fault tree that has correlated seismic failures in the traditional seismic SUPSA, the fault tree has been simplified by replacing correlated seismic failures with one typical seismic failure by assuming a full correlation among the correlated seismic failures. Then, approximate seismic CDFs have been calculated. The results of this study showed that the seismic CDFs in SUPSA and MUPSA are distorted when the full correlation is employed. Fortunately, the authors of this study recently developed the COREX method [23] that can calculate accurate seismic CDFs by converting correlated seismic failures into seismic CCFs. Therefore, it is recommended that the COREX method to convert correlated seismic failures into seismic CCFs be employed in seismic SUPSA and MUPSA to avoid the distortion of seismic CDFs.
The results of this study show that the seismic CDFs in SUPSA and MUPSA are drastically distorted and safety margins are accordingly distorted when the full correlation assumption is employed. Thus, very careful attention should be paid to calculating and interpreting seismic CDFs for single-unit and multi-unit NPP regulations.

Author Contributions

Conceptualization/formal analysis/writing—original draft preparation, G.G.C.; methodology/software/supervision/funding acquisition/writing—review and editing, W.S.J.; validation, S.K.P. All authors have read and agreed to the published version of the manuscript.

Funding

This work was supported by a Korea Foundation of Nuclear Safety (KoFONS) grant funded by the Nuclear Safety and Security Commission (NSSC), Republic of Korea (No. 2101062), and was also supported by the National Research Foundation of Korea (NRF) funded by the Ministry of Science and ICT, Republic of Korea (No. 1711126864).

Institutional Review Board Statement

Not applicable.

Informed Consent Statement

Not applicable.

Data Availability Statement

Not applicable.

Conflicts of Interest

The authors declare no conflict of interest.

Nomenclature

CCFCommon cause failure
CCDPConditional core damage probability
SUCCDPSingle-unit CCDP
MUCCDPMulti-unit CCDP
SCCDPSite CCDP
CDFCore damage frequency (initiator frequency × CCDP)
SUCDFSingle-unit CDF (seismic initiator frequency × SUCCDP)
MUCDFMulti-unit CDF (seismic initiator frequency × MUCCDP)
SCDFSite CDF (seismic initiator frequency × SCCDP)

References

  1. U.S. NRC. Reactor Safety Study. In An Assessment of Accident Risks in U.S. Commercial Nuclear Power Plants; WASH-1400 (NUREG-75/014); US Nuclear Regulatory Commission: Rockville, MD, USA, 1975. [Google Scholar]
  2. Jung, W.S.; Yang, J.-E.; Ha, J. A new method to evaluate alternate AC power source effects in multi-unit nuclear power plants. Reliab. Eng. Syst. Saf. 2003, 82, 165–172. [Google Scholar] [CrossRef]
  3. IAEA. The Fukushima Daiichi Accident Report by the Director General; IAEA: Vienna, Austria, 2015. [Google Scholar]
  4. Fleming, K.; Chan, E.; Dermarkar, F.; Georgescu, G.; Gheorche, R.; Modarres, M.; Rowekamp, M.; Takada, T.; Yalaoui, S. Summary Report of the International Workshop on Multi-unit Probabilistic Safety Assessment; Canadian Nuclear Safety Commission: Ottawa, ON, Canada, 2014. [Google Scholar]
  5. Schroer, S.; Modarres, M. An event classification schema for evaluating site risk in a multi-unit nuclear power plant probabilistic risk assessment. Reliab. Eng. Syst. Saf. 2013, 117, 40–51. [Google Scholar] [CrossRef]
  6. Kumar, C.S.; Hassija, V.; Velusamy, K.; Balasubramaniyan, V. Integrated risk assessment for multi-unit NPP sitesda comparison. Nucl. Eng. Des. 2015, 293, 53–62. [Google Scholar] [CrossRef]
  7. Modarres, M.; Zhou, T.; Massoud, M. Advances in multi-unit nuclear power plant probabilistic risk assessment. Reliab. Eng. Syst. Saf. 2017, 157, 87–100. [Google Scholar] [CrossRef]
  8. Kim, D.S.; Han, S.H.; Park, J.H.; Lim, H.-G.; Kim, J.H. Multi-unit Level 1 probabilistic safety assessment: Approaches and their application to a six-unit nuclear power plant site. Nucl. Eng. Technol. 2018, 50, 1217–1233. [Google Scholar] [CrossRef]
  9. Yang, J.E. Multi-unit risk assessment of nuclear power plants: Current status and issues. Nucl. Eng. Technol. 2018, 50, 1199–1209. [Google Scholar] [CrossRef]
  10. IAEA. Technical Approach to Probabilistic Safety Assessment for Multiple Reactor Units; IAEA: Vienna, Austria, 2019. [Google Scholar]
  11. Kim, D.S.; Park, J.H.; Lim, H.G. A pragmatic approach to modeling common cause failures in multi-unit PSA for nuclear power plant sites with a large number of units. Reliab. Eng. Syst. Saf. 2020, 195, 106739. [Google Scholar] [CrossRef]
  12. Jang, S.H.; Jae, M.S. A development of methodology for assessing the inter-unit common cause failure in multi-unit PSA model. Reliab. Eng. Syst. Saf. 2020, 203, 107012. [Google Scholar] [CrossRef]
  13. Jung, W.S. A method to avoid underestimated risks in seismic SUPSA and MUPSA for nuclear power plants caused by partitioning events. Energies 2021, 14, 2150. [Google Scholar] [CrossRef]
  14. Kennedy, R.P.; Ravindra, M.K. Seismic fragilities for nuclear power plant risk studies. Nucl. Eng. Des. 1981, 79, 47–68. [Google Scholar] [CrossRef]
  15. Reed, J.W.; Kennedy, R.P.; Kassawara, R.P. Methodology for Developing Seismic Fragilities; TR-103959; Electric Power Research Institute: Washington, DC, USA, 1994. [Google Scholar]
  16. Wakefield, D.; Ravindra, M.K.; Merz, K.; Hardy, G.S. Seismic Probabilistic Risk Assessment Implementation Guide; 1002989; Electric Power Research Institute: Washington, DC, USA, 2003. [Google Scholar]
  17. Kassawara, R.P. Surry Seismic Probabilistic Risk Assessment Pilot Plant Review, 1020756; Electric Power Research Institute: Washington, DC, USA, 2010. [Google Scholar]
  18. Smith, P.D.; Dong, R.G.; Bernreuter, D.L.; Bohn, M.P.; Chuang, T.Y.; Cummings, G.E.; Johnson, J.J.; Mensing, R.W.; Wells, J.E. Seismic Safety Margins Research Program. Phase I Final Report-Overview; Lawrence Livermore Laboratory: Livermore, CA, USA, 1981.
  19. Budnitz, R.J.; Hardy, G.S.; Moore, D.L.; Ravindra, M.K. Correlation of Seismic Performance in Similar SSCs (Structures, Systems, and Components); NUREG/CR-7237; US Nuclear Regulatory Commission: Rockville, MA, USA, 2017.
  20. Bohn, M.P.; Lambright, J.A. Procedures for the External Event Core Damage Frequency Analyses for NUREG-1150; Nuclear Regulatory Commission: Washington, DC, USA, 1990.
  21. Ebisawa, K.; Teragaki, T.; Nomura, S.; Abe, H.; Shigemori, M.; Shimomoto, M. Concept and methodology for evaluating core damage frequency considering failure correlation at multi units and sites and its application. Nucl. Eng. Des. 2015, 288, 82–97. [Google Scholar] [CrossRef] [Green Version]
  22. Eum, S.H.; Choi, I.K.; Yang, B.J.; Kwnag, S.Y. Methodology of seismic-response-correlation-coefficient calculation for seismic probabilistic safety assessment of multi-unit nuclear power plants. Nucl. Eng. Technol. 2021, 53, 967–973. [Google Scholar] [CrossRef]
  23. Jung, W.S.; Hwang, K.; Park, S.K. A new methodology for modeling explicit seismic common cause failures for seismic multi-unit probabilistic safety assessment. Nucl. Eng. Technol. 2020, 52, 2238–2249. [Google Scholar] [CrossRef]
Figure 1. SUCDF fault tree with correlated seismic failures (Model A).
Energies 14 02955 g001
Figure 2. MUCDF and SCDF fault trees with correlated seismic failures (Model A).
Energies 14 02955 g002
Figure 3. SUCDF fault tree simplified by the full correlation assumption (Model B).
Energies 14 02955 g003
Figure 4. MUCDF and SDF fault trees simplified by the full correlation assumption (Model B).
Energies 14 02955 g004
Figure 5. SCDF fault tree with seismic CCFs (Model A).
Energies 14 02955 g005
Figure 6. SCDF fault tree with seismic CCFs (Model B).
Energies 14 02955 g006
Figure 7. Event tree used for seismic SUPSA.
Energies 14 02955 g007
Figure 8. SUCDF fault tree (Model A).
Energies 14 02955 g008
Figure 9. SUCDF fault tree simplified by the full correlation assumption (Model B).
Energies 14 02955 g009
Figure 10. MUCDF fault tree (Model A).
Energies 14 02955 g010
Figure 11. MUCDF fault tree simplified by the full correlation assumption (Model B).
Energies 14 02955 g011
Figure 12. Plots of SUCDF versus seismic correlation.
Energies 14 02955 g012
Figure 13. Plots of SUCCDP versus seismic correlation.
Energies 14 02955 g013aEnergies 14 02955 g013b
Figure 14. Plots of MUCDF versus seismic correlation.
Energies 14 02955 g014
Figure 15. Plots of MUCCDP versus seismic correlation.
Energies 14 02955 g015aEnergies 14 02955 g015b
Figure 16. Plots of SCDF versus seismic correlation.
Energies 14 02955 g016
Figure 17. Plots of SCCDP versus seismic correlation.
Energies 14 02955 g017aEnergies 14 02955 g017b
Table 1. Seismic CDF calculation when correlated seismic failures spread over a fault tree.
MethodApplicabilityAssumptionSeismic CDF
Traditional seismic SUPSAMVN integration [23] is possible only when all correlated seismic failures exist under the single gate.Correlated seismic failures are replaced with one seismic failure by assuming a full correlation among correlated seismic failures (see Figure 3).Approximate
COREX method [23]COREX method is always applicable even when correlated seismic failures spread over a fault tree.Correlated seismic failures are converted into seismic CCFs without any assumption.Best estimate
Table 2. Basic events in fault trees for different accident sequence headings.
Event Tree HeadingSeismic FailuresRandom FailuresHuman FailuresTotal Failures
LOEPS2420 (a)2 (b)46
SLOCA1N/A (c)N/A1
LLOCA4N/AN/A4
LOPCS4N/AN/A4
(a) Set them as FALSE. (b) Set them as TRUE. (c) Not applicable.
Table 3. Seismic failures of redundant/identical components in seismic SUPSA.
Model AModel BFailure ModeComponent
Train ATrain B
EDGSF_AEDGSF_BEDGSFConcrete coningEmergency diesel generator
MVSSF_AMVSSF_BMVSSFStructural4.16 kV switchgear
MVFSF_AMVFSF_BMVFSFFunctional
MCCSF_AMCCSF_BMCCSFStructural480 V AC load center
LVSSF_ALVSSF_BLVSSFStructural480 V AC motor control center
LVFSF_ALVFSF_BLVFSFFunctional
DCCSF_A
DCCSF_C
DCCSF_B
DCCSF_D
DCCSFStructural125 V DC control center
BCHSF_A
BCHSF_C
BCHSF_B
BCHSF_D
BCHSFStructuralBattery charger
SITSF_A
SITSF_C
SITSF_B
SITSF_D
SITSFConcrete coningSafety injection tank
INFSF_A
INFSF_C
INFSF_B
INFSF_D
INFSFStructuralInverter
PCCSF_APCCSF_BPCCSFStructuralPlant control cabinet
Table 4. Seismic failures of redundant/identical components in seismic MUPSA.
Model AModel B
Unit 1Unit 2Unit 1Unit 2
Train ATrain BTrain ATrain B
U1-EDGSF_AU1-EDGSF_BU2-EDGSF_AU2-EDGSF_BU1-EDGSFU2-EDGSF
U1-MVSSF_AU1-MVSSF_BU2-MVSSF_AU2-MVSSF_BU1-MVSSFU2-MVSSF
U1-MVFSF_AU1-MVFSF_BU2-MVFSF_AU2-MVFSF_BU1-MVFSFU2-MVFSF
U1-MCCSF_AU1-MCCSF_BU2-MCCSF_AU2-MCCSF_BU1-MCCSFU2-MCCSF
U1-LVSSF_AU1-LVSSF_BU2-LVSSF_AU2-LVSSF_BU1-LVSSFU2-LVSSF
U1-LVFSF_AU1-LVFSF_BU2-LVFSF_AU2-LVFSF_BU1-LVFSFU2-LVFSF
U1-DCCSF_A
U1-DCCSF_C
U1-DCCSF_B
U1-DCCSF_D
U2-DCCSF_A
U2-DCCSF_C
U2-DCCSF_B
U2-DCCSF_D
U1-DCCSFU2-DCCSF
U1-BCHSF_A
U1-BCHSF_C
U1-BCHSF_B
U1-BCHSF_D
U2-BCHSF_A
U2-BCHSF_C
U2-BCHSF_B
U2-BCHSF_D
U1-BCHSFU2-BCHSF
U1-SITSF_A
U1-SITSF_C
U1-SITSF_B
U1-SITSF_D
U2-SITSF_A
U2-SITSF_C
U2-SITSF_B
U2-SITSF_D
U1-SITSFU2-SITSF
U1-INFSF_A
U1-INFSF_C
U1-INFSF_B
U1-INFSF_D
U2-INFSF_A
U2-INFSF_C
U2-INFSF_B
U2-INFSF_D
U1-INFSFU2-INFSF
U1-PCCSF_AU1-PCCSF_BU2-PCCSF_AU2-PCCSF_BU1-PCCSFU2-PCCSF
Table 5. Ground acceleration intervals.
No.Intervals
( m / s 2 )
Ground Acceleration
( m / s 2 )
Mean Seismic Frequency
( / y r )
10.10–0.150.1253.770 × 10−4
20.15–0.200.1756.910 × 10−5
30.20–0.250.2252.100 × 10−5
40.25–0.300.2758.150 × 10−6
50.30–0.500.4003.650 × 10−6
60.50–0.700.6002.340 × 10−6
70.70–1.000.8501.237 × 10−6
Table 6. Seismic failure data.
Event (a)ComponentFailure Mode A m β R β U
EDGSFEmergency diesel generatorStructural1.000.340.19
MVSSF4.16 kV SWGRStructural0.880.330.33
MVFSF4.16 kV SWGRFunctional0.590.290.29
LVSSF480 V load centerStructural 0.710.300.30
LVFSF480 V load centerFunctional 1.060.340.34
MCCSF480 V motor control centerStructural1.480.340.34
DCCSF125 V DC control centerStructural1.160.290.32
BCHSFBattery chargerConcrete coning1.350.290.32
SITSFSafety injection tankStructural1.090.360.35
INFSFInverterStructural1.450.340.33
INTSFInstrumentation tube
(primary system)
Piping break1.500.300.30
(a) Event names have no failure mode for the simplicity of the paper.
Publisher’s Note: MDPI stays neutral with regard to jurisdictional claims in published maps and institutional affiliations.

