
Performance Analysis and Comparison of a Concentrated Photovoltaic System with Different Phase Change Materials


 and
and 
Abstract
1. Introduction
2. Methodology
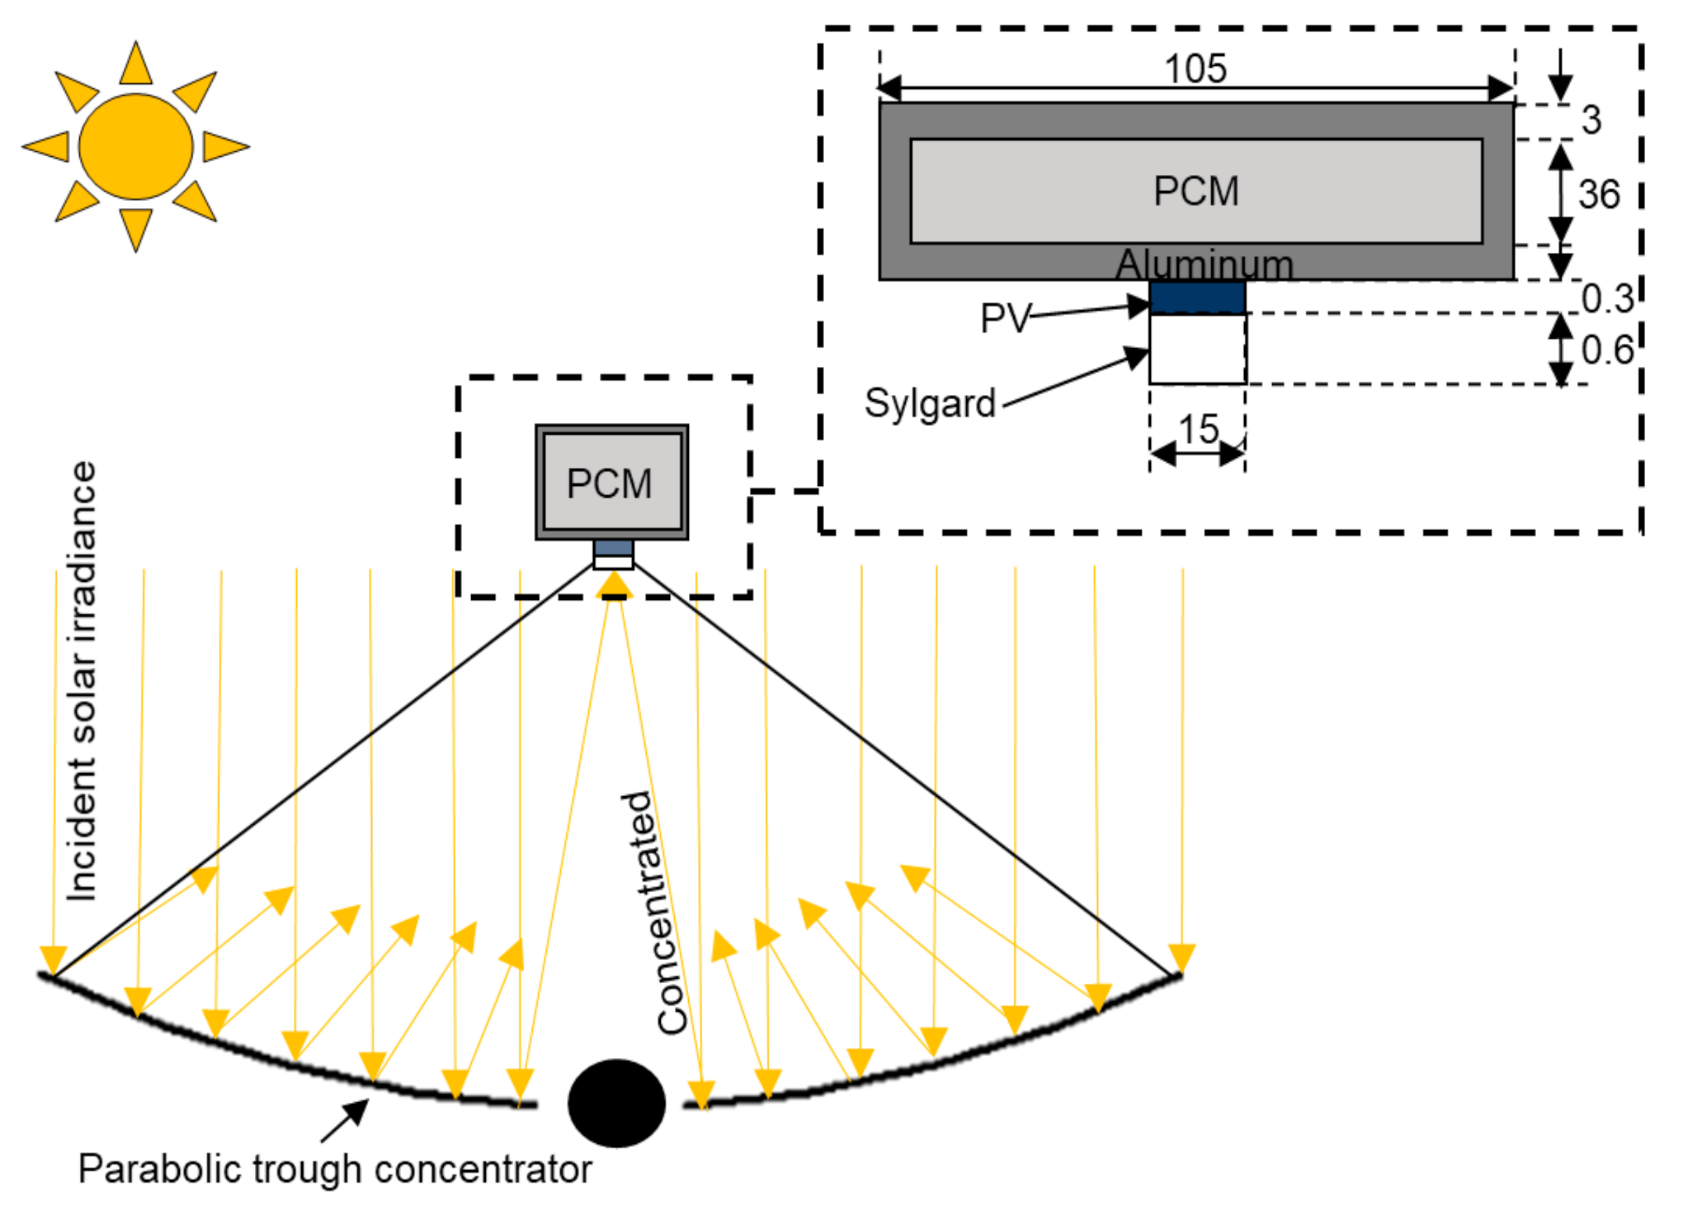
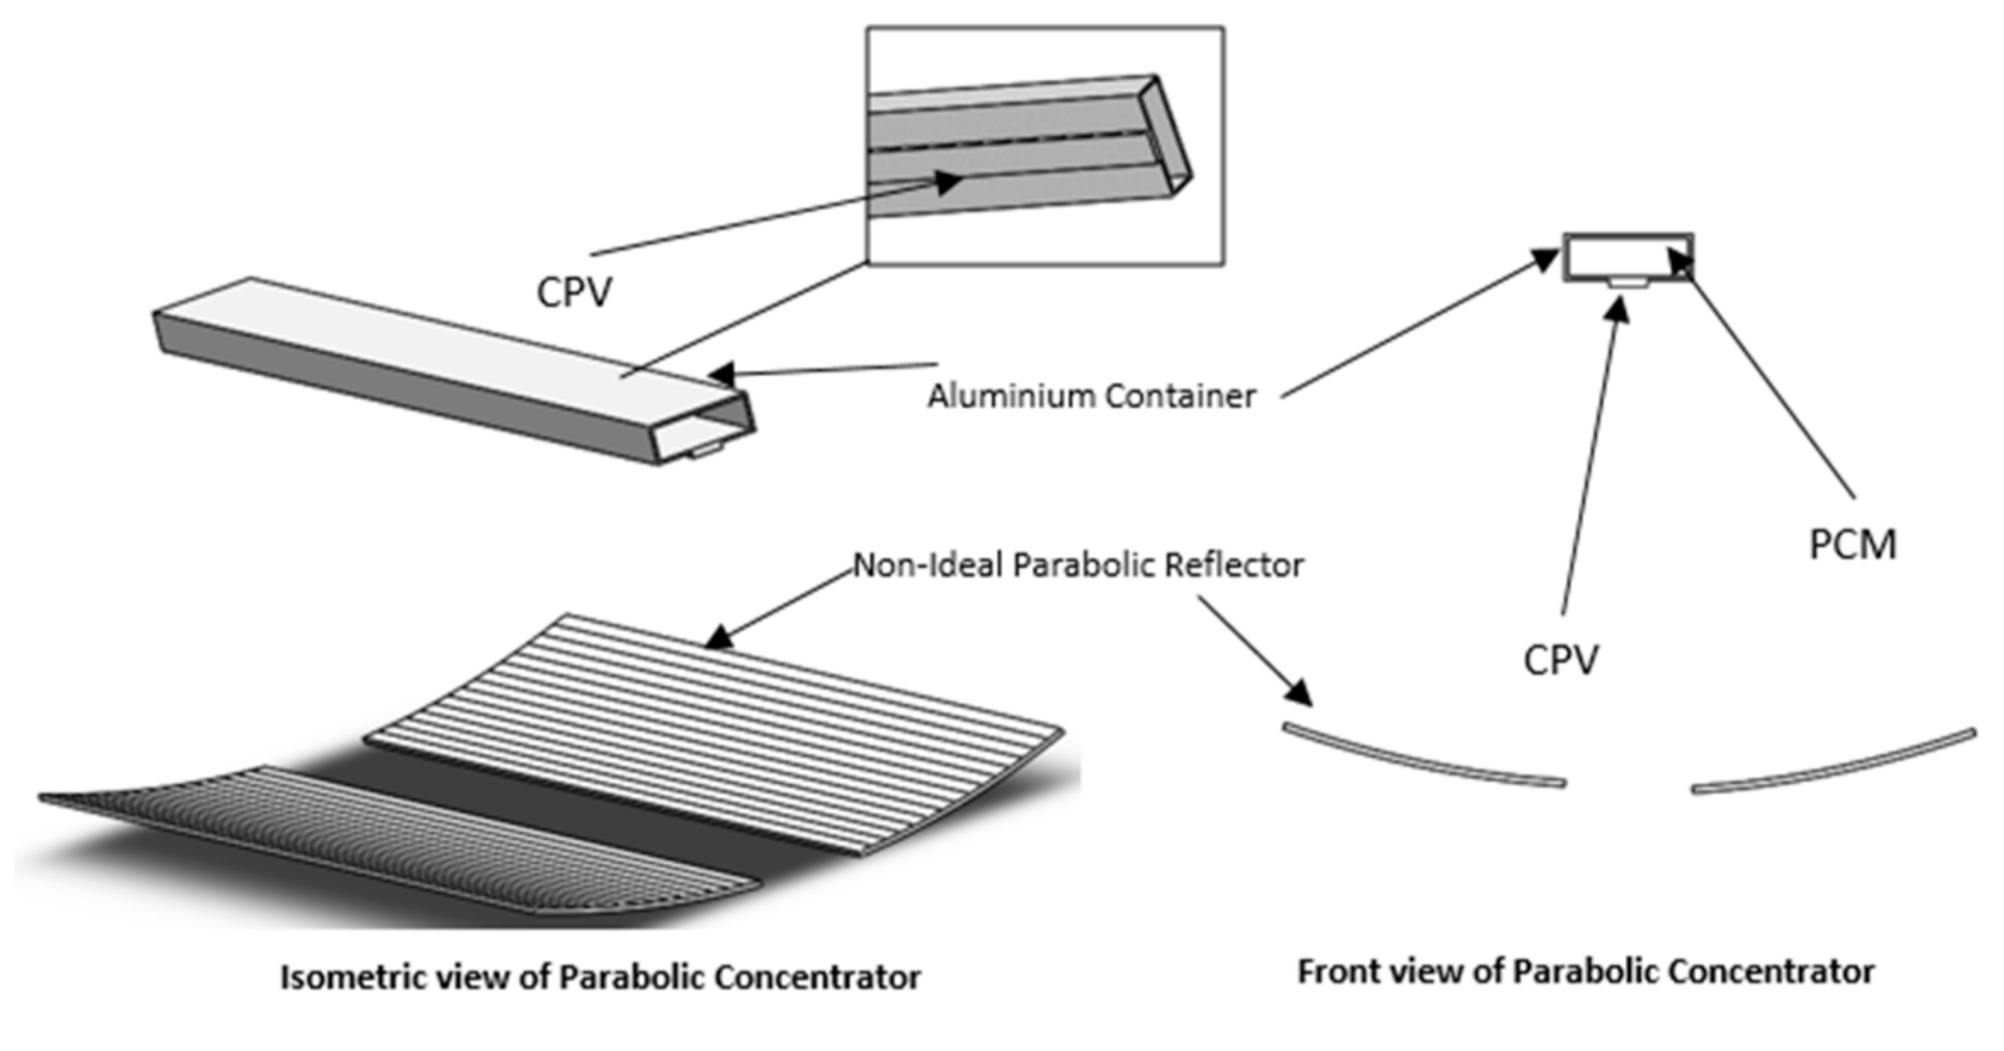
2.1. Physical Model
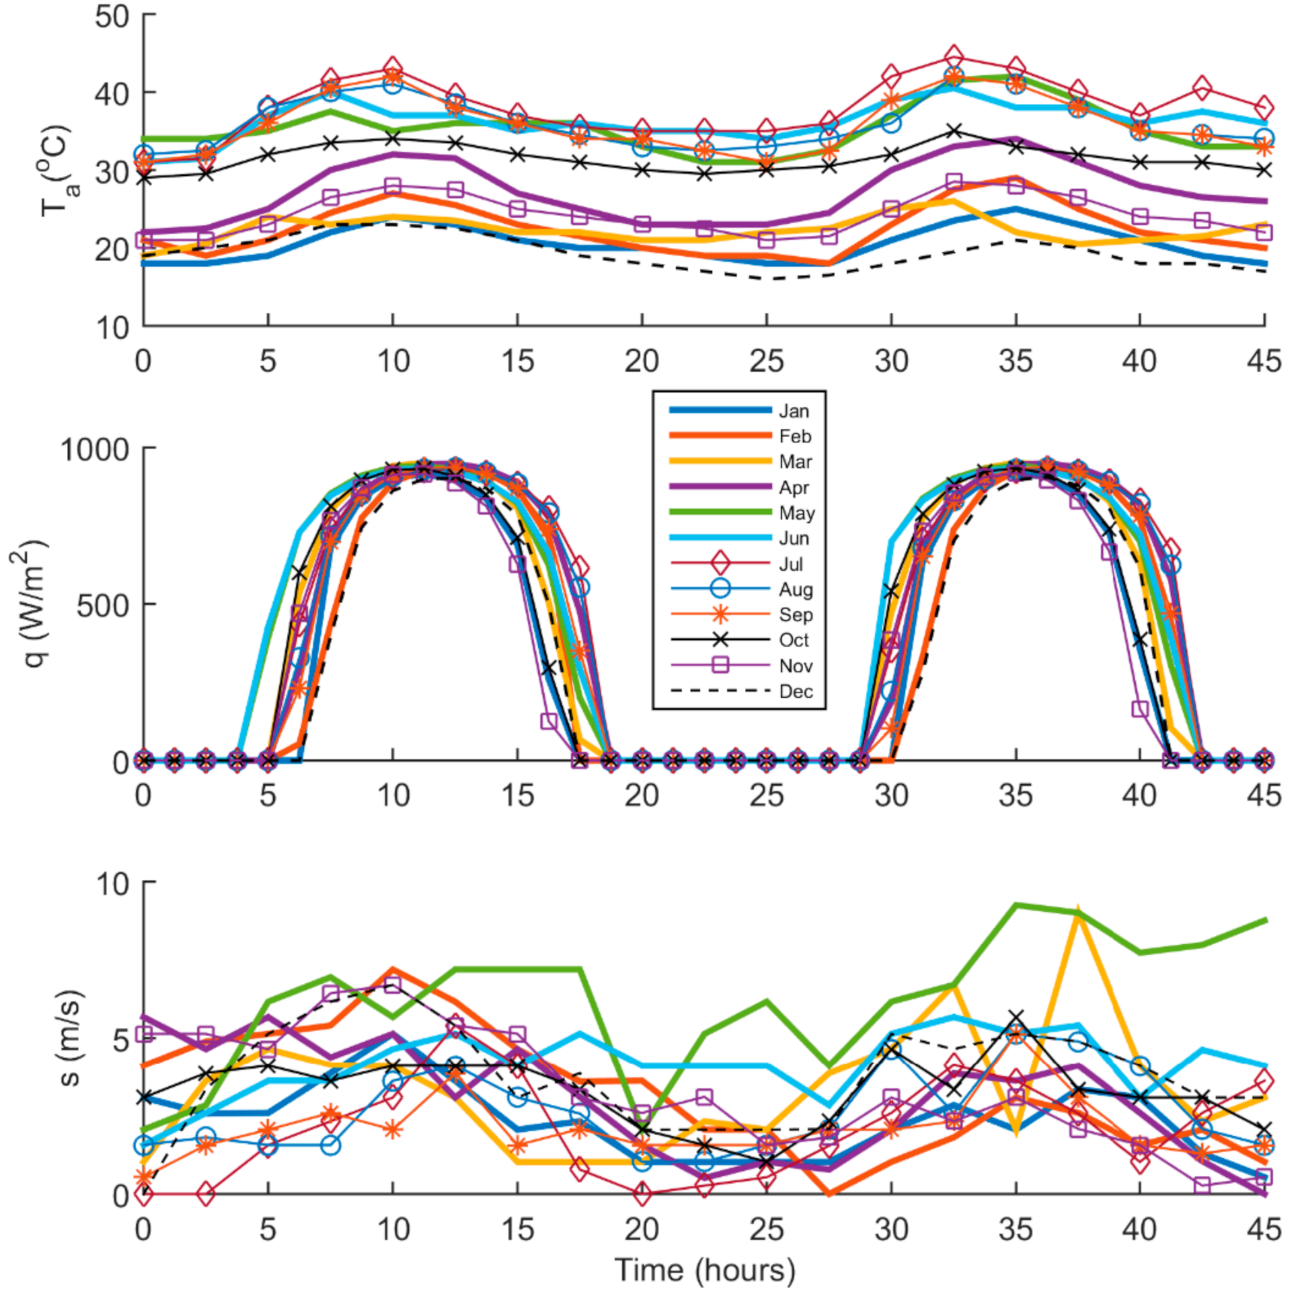
2.2. Irradiance and Weather Condition
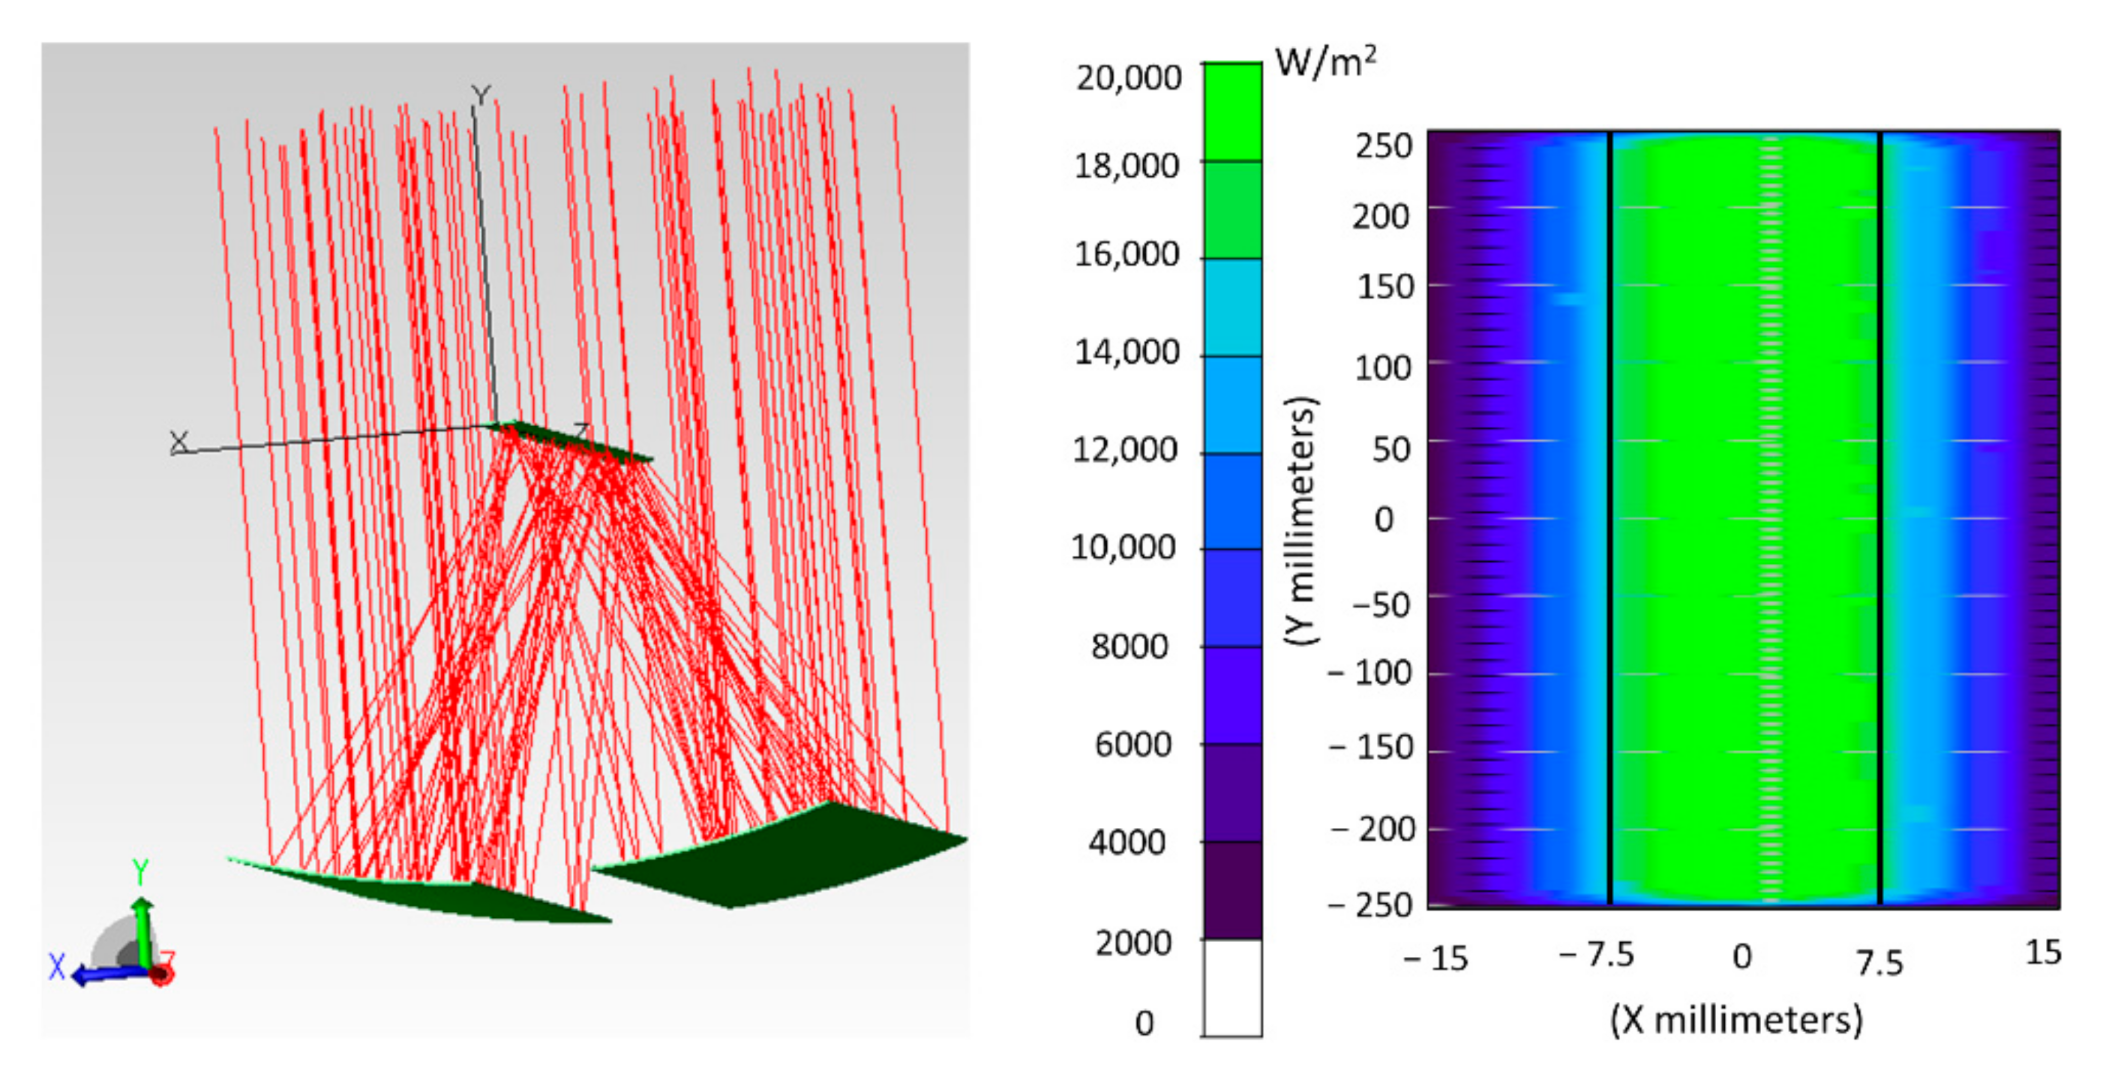
2.3. Optical Design of the Non-Ideal Solar Concentrator for Photovoltaic Application
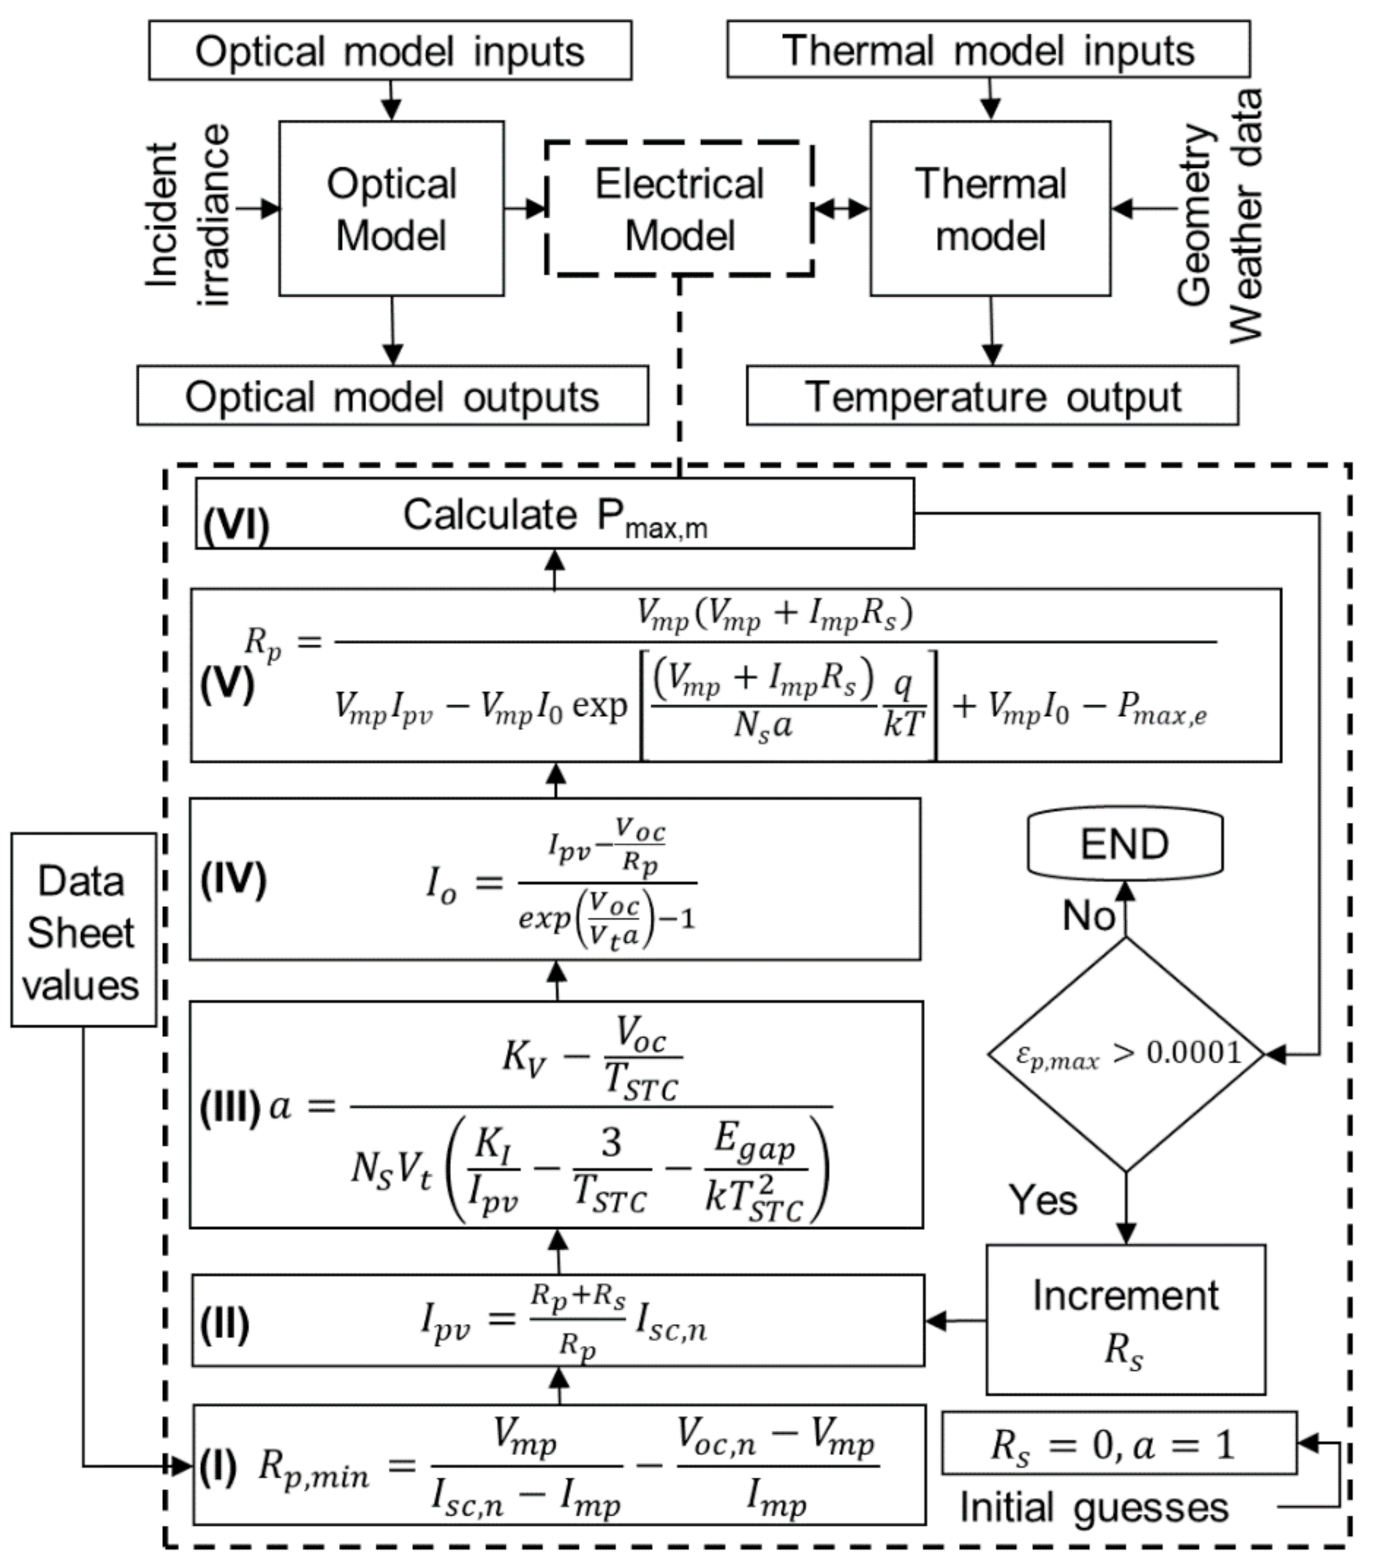
2.4. Theoretical Model
3. Numerical Procedure
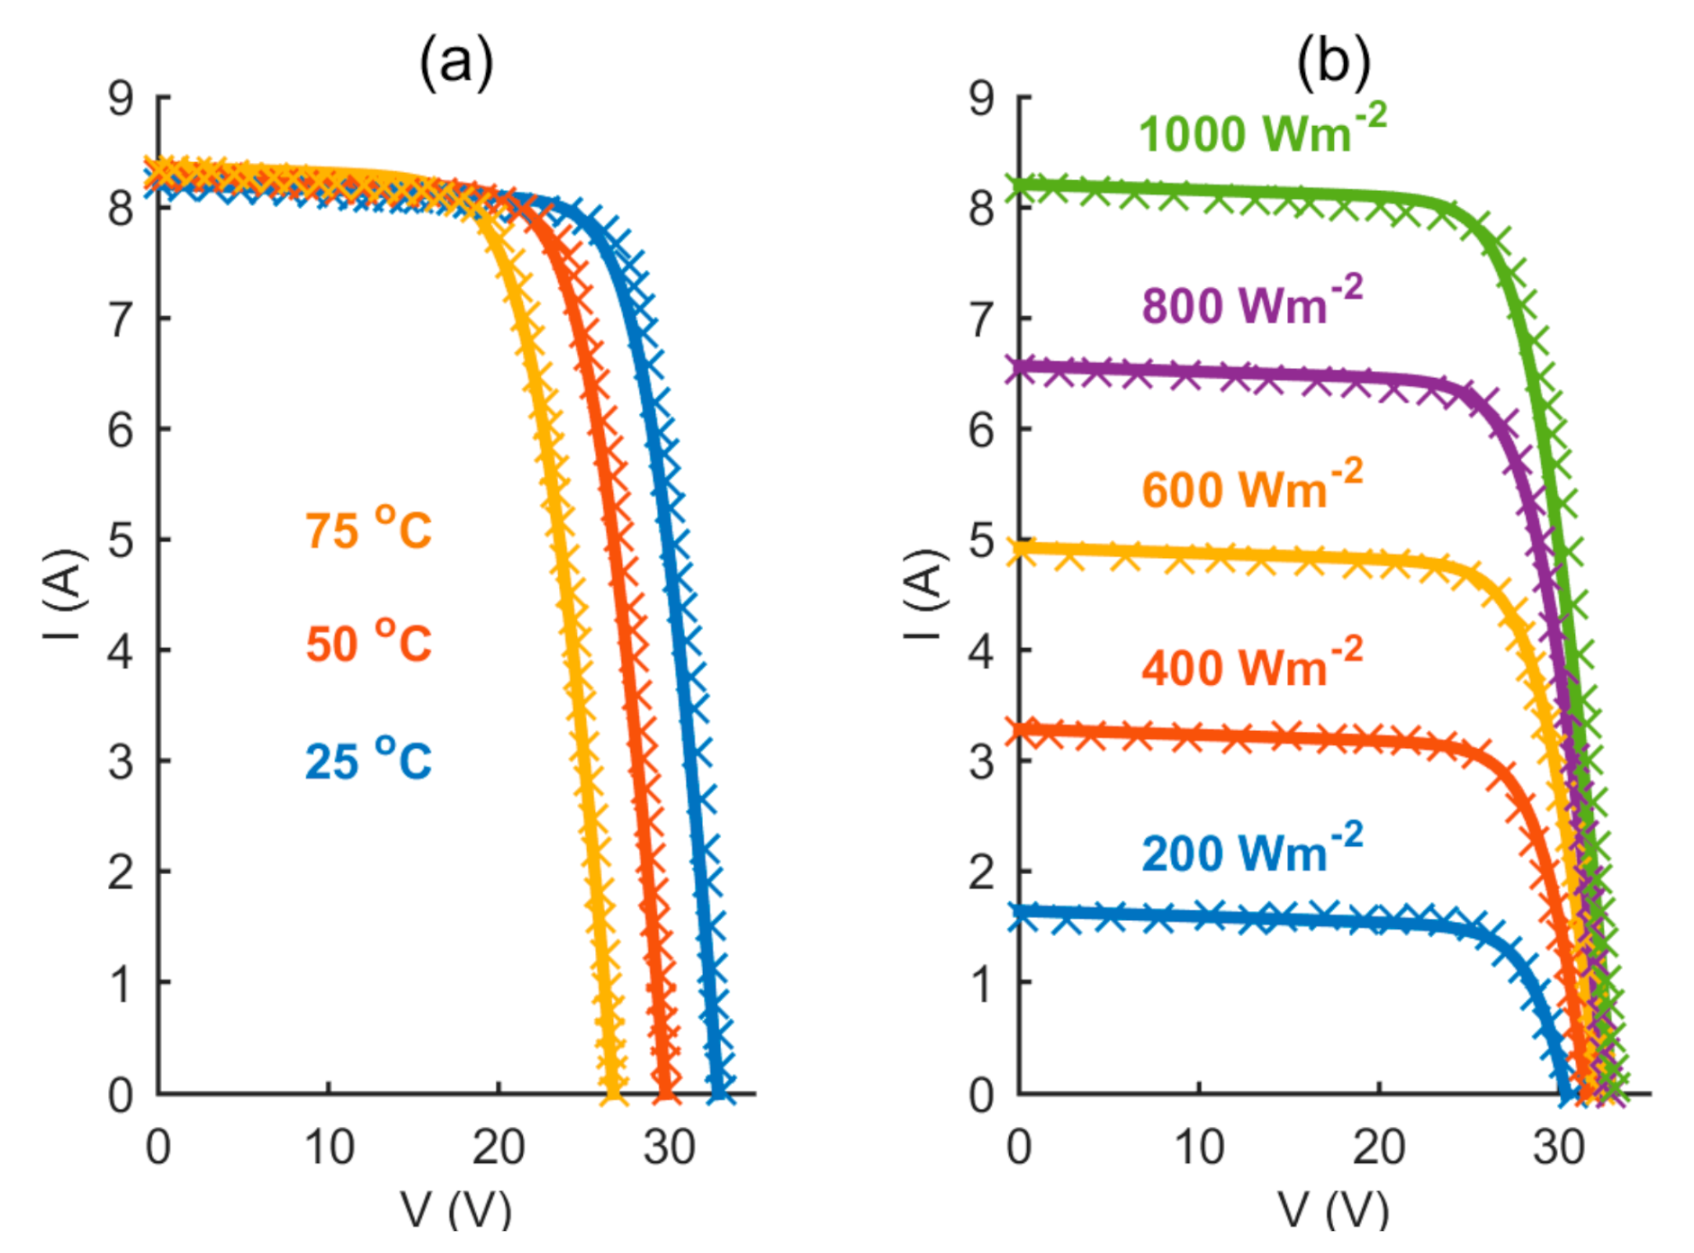
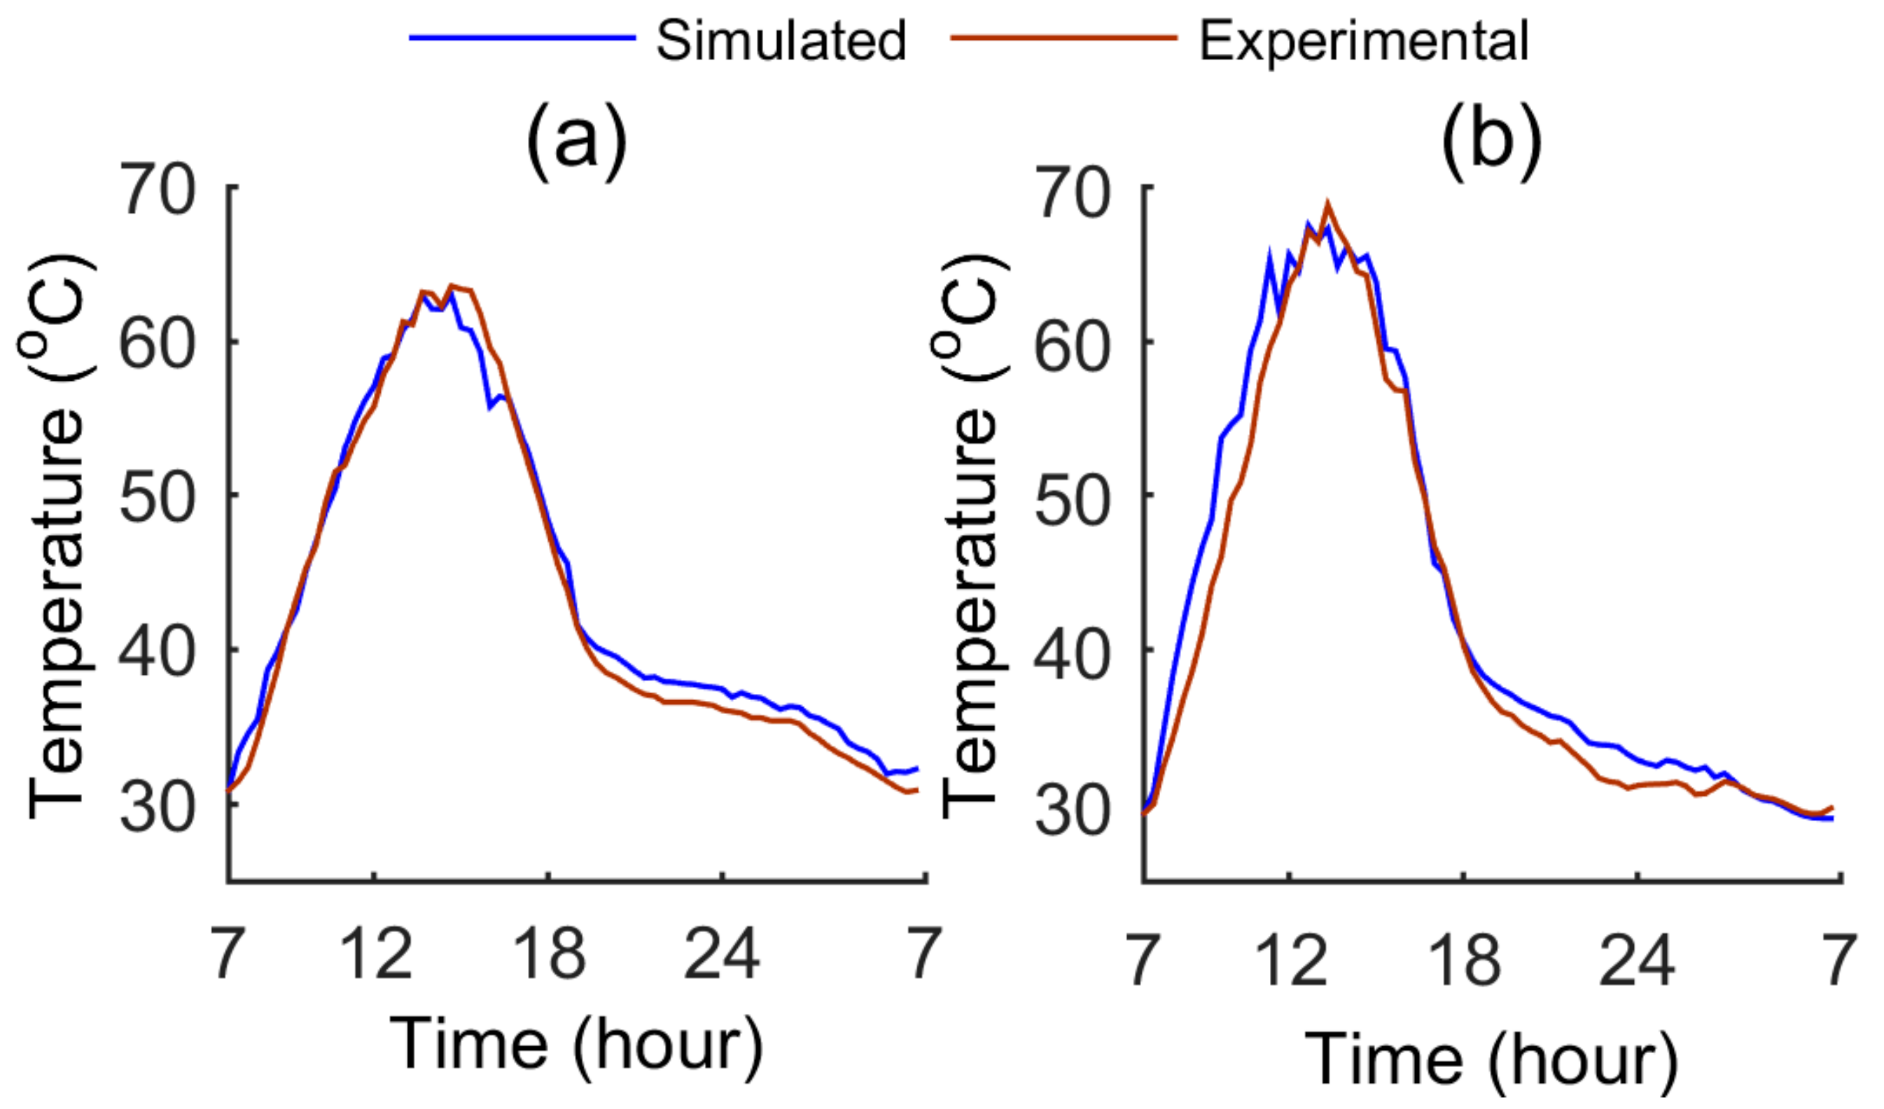
4. Electrical and Thermal Output Validation
5. Results and Discussion
5.1. Optical Analysis of the Non-Ideal Solar Concentrator
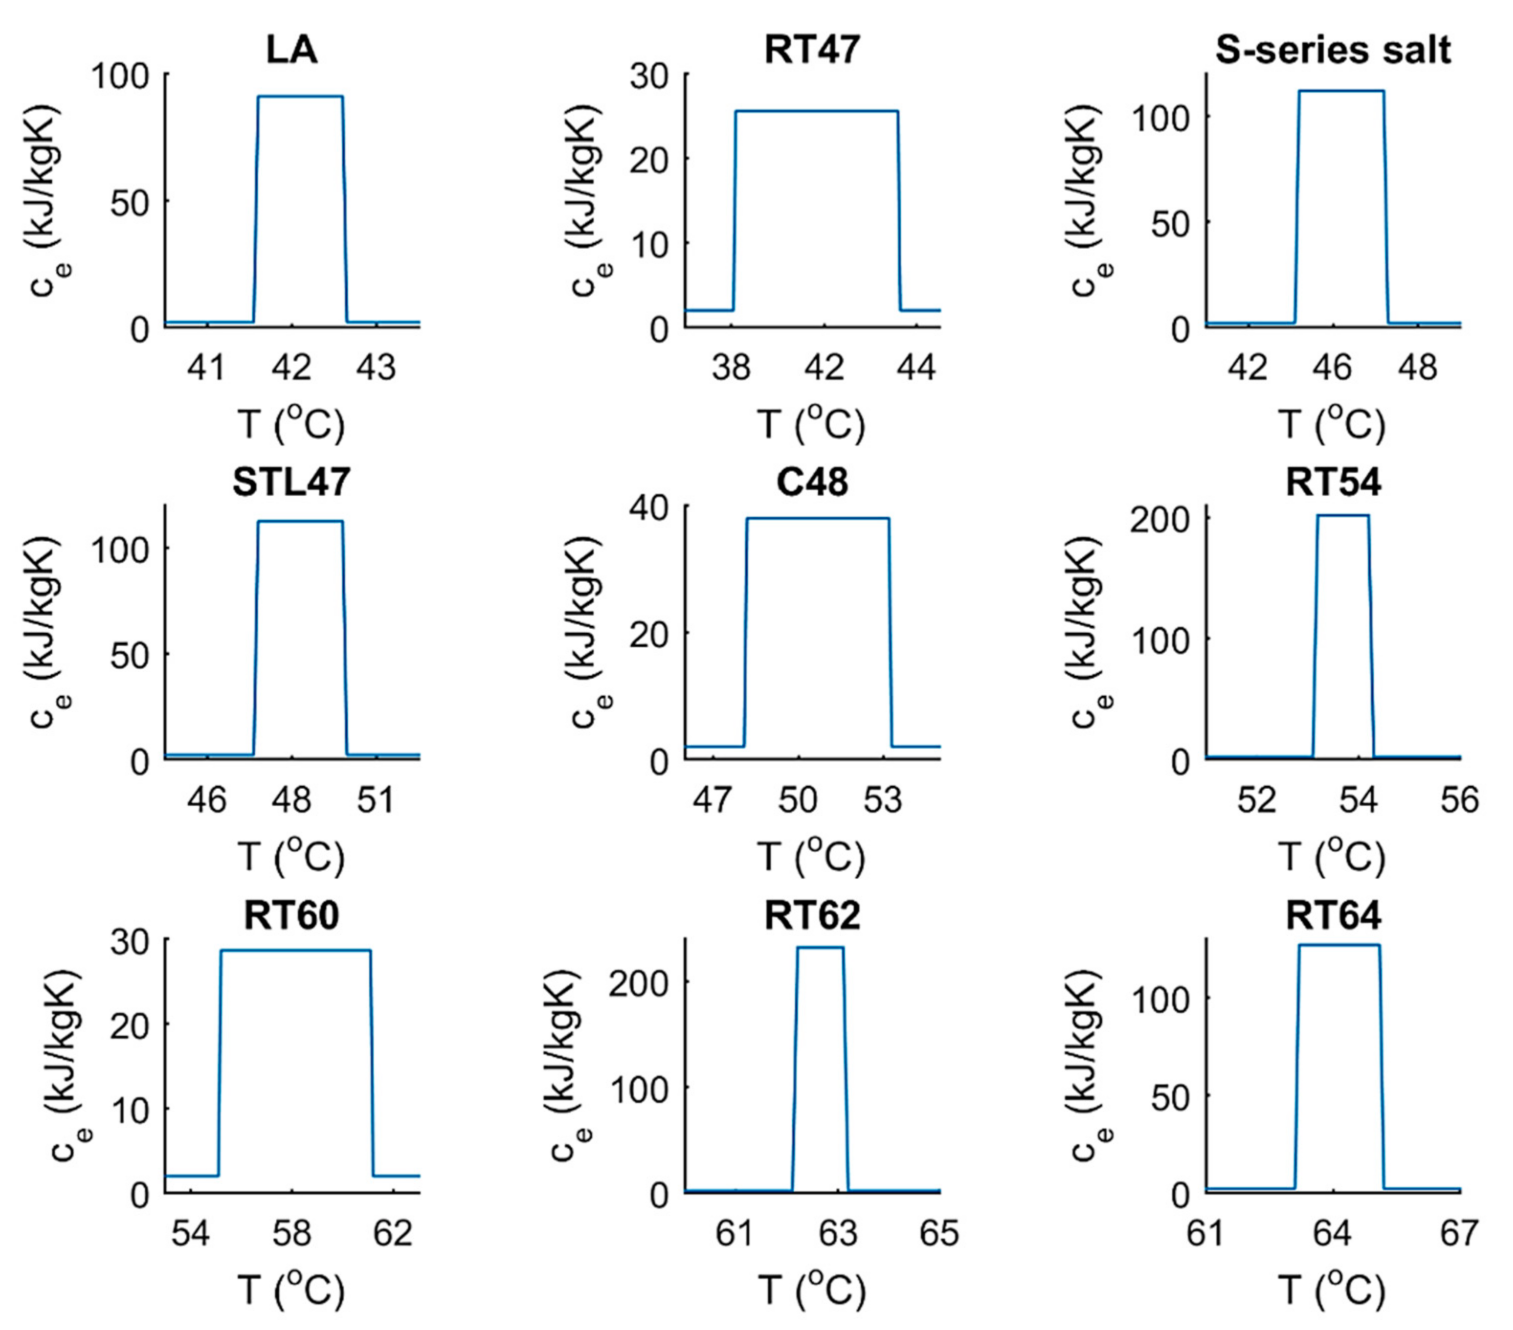
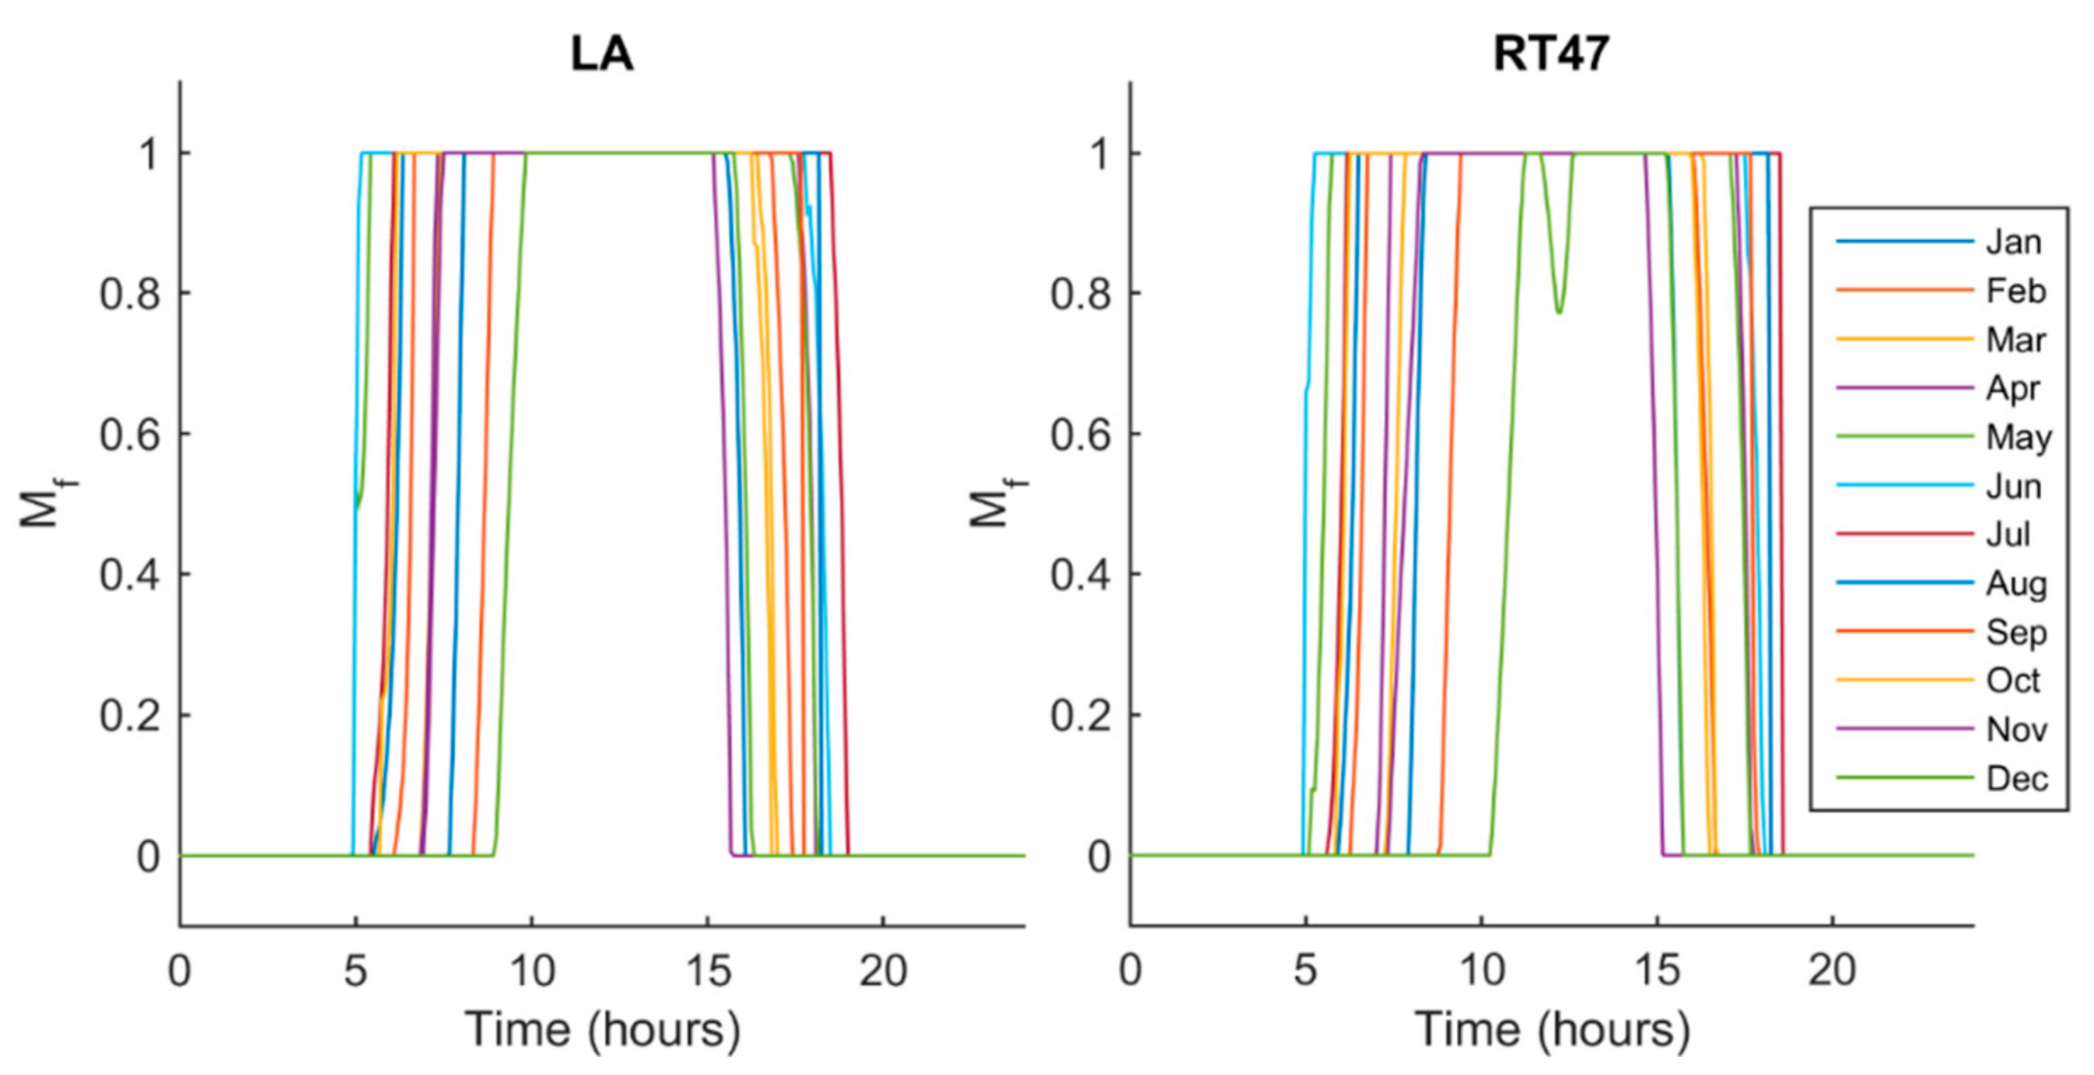
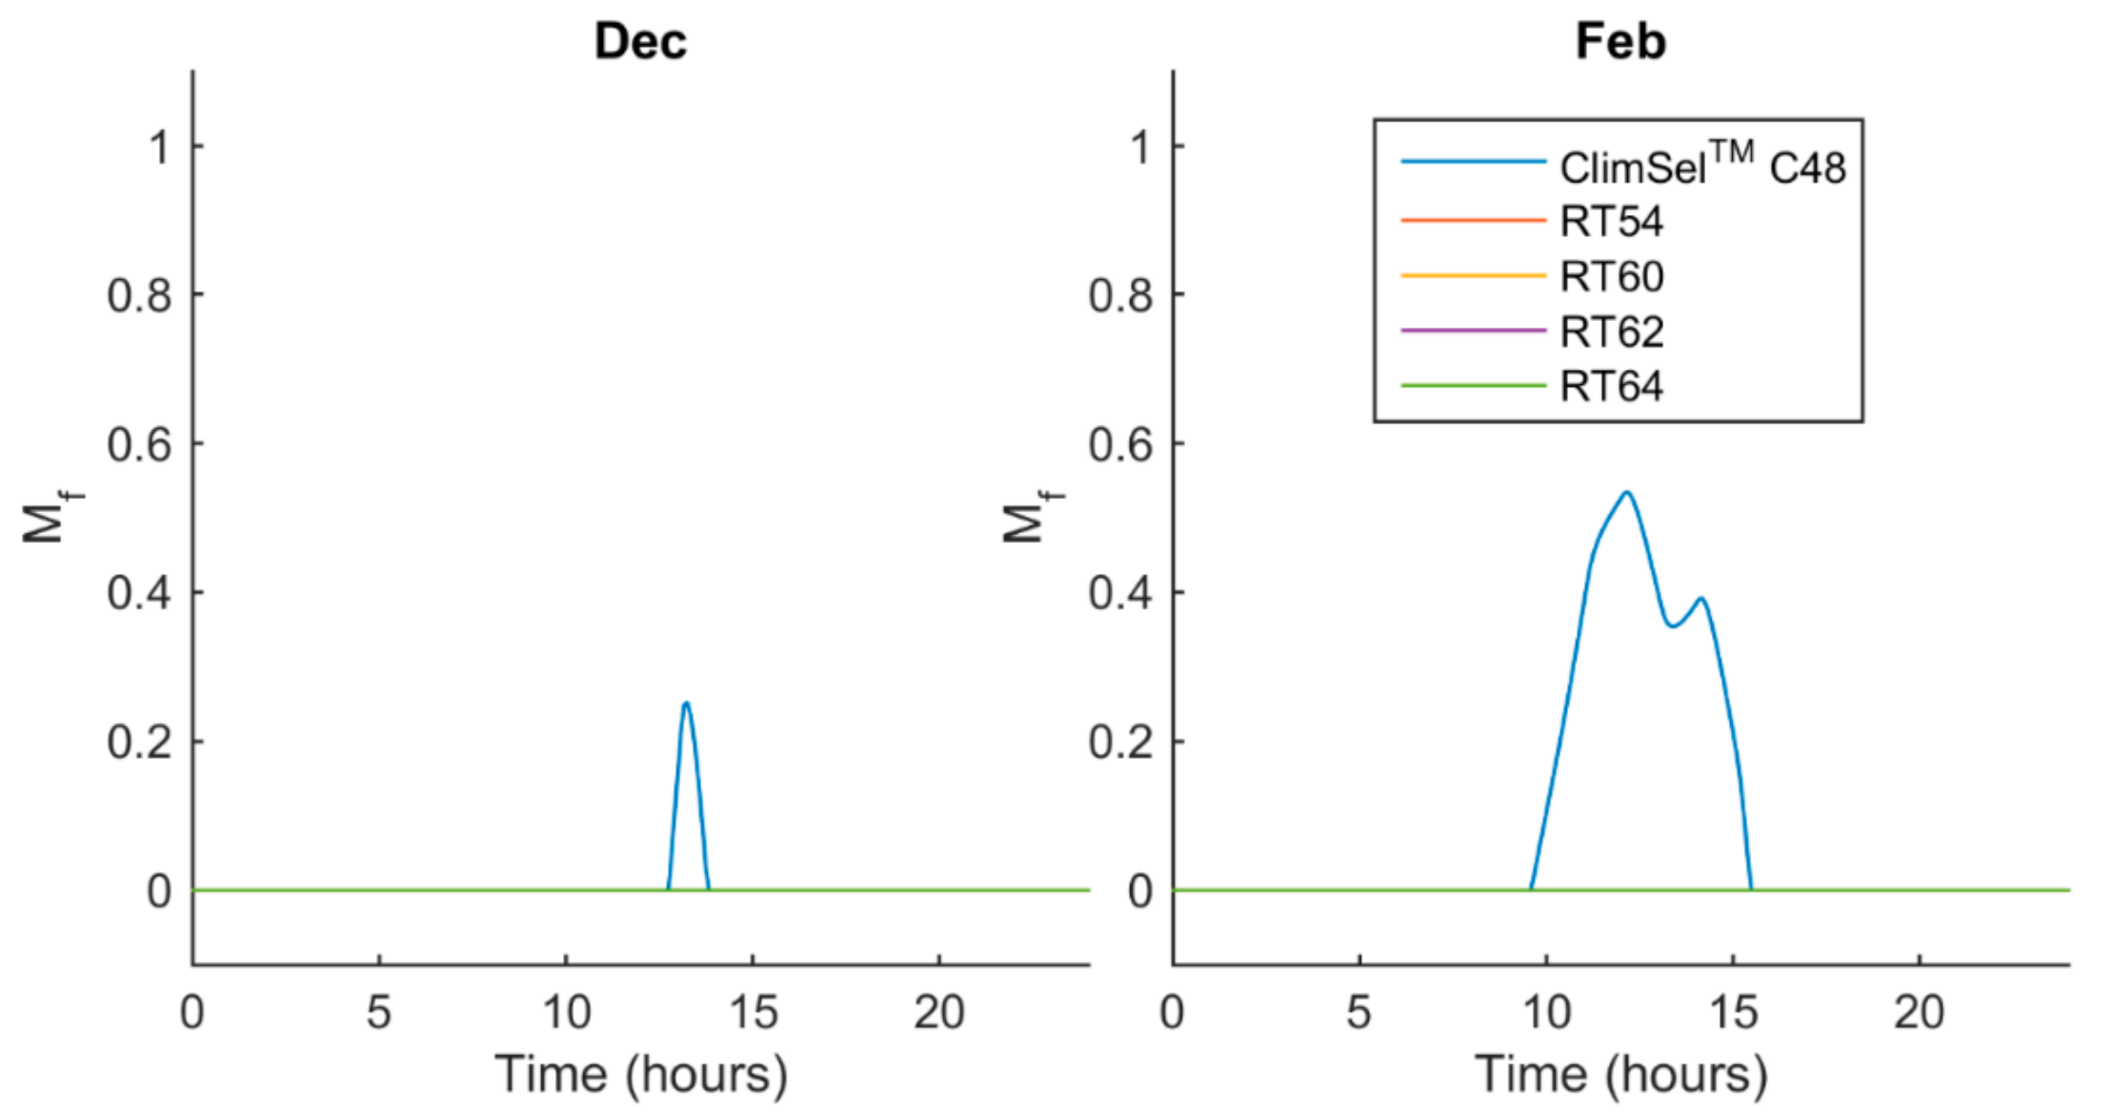
5.2. Melt Fraction
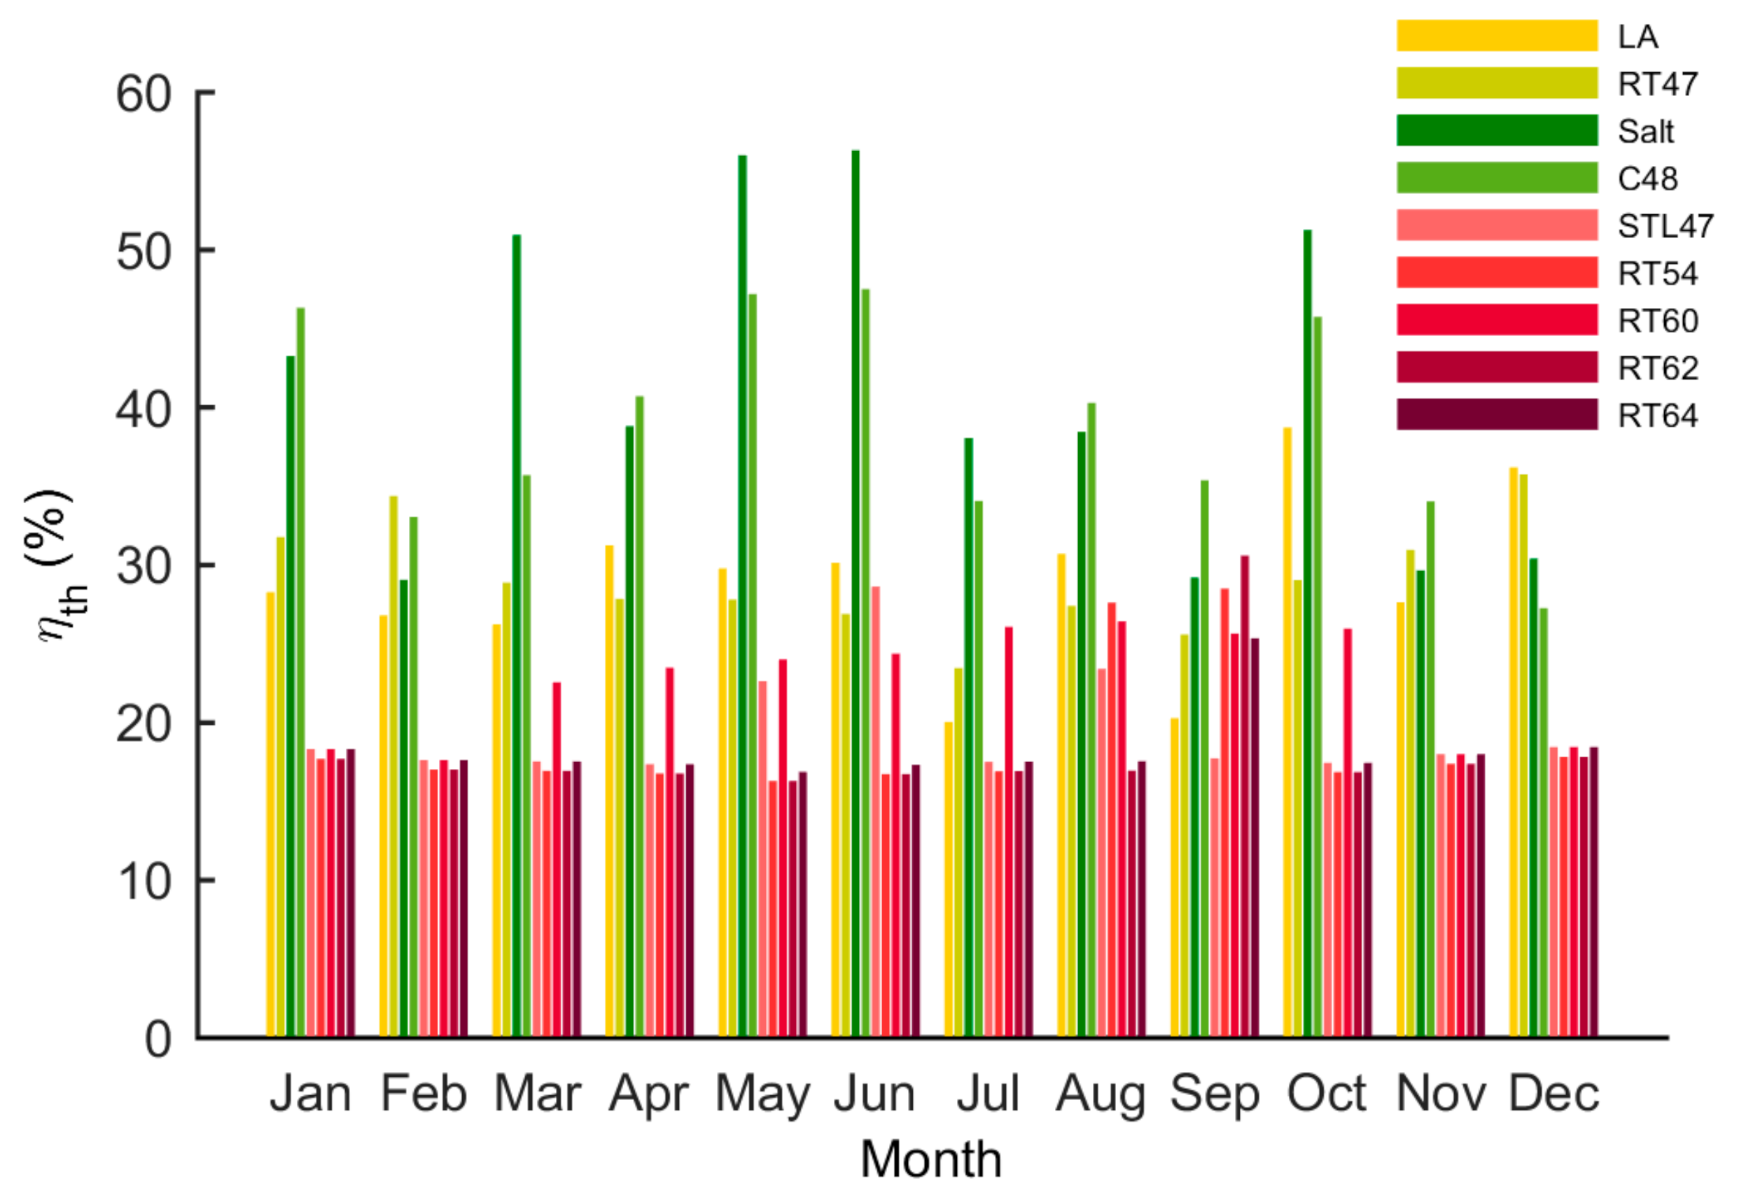
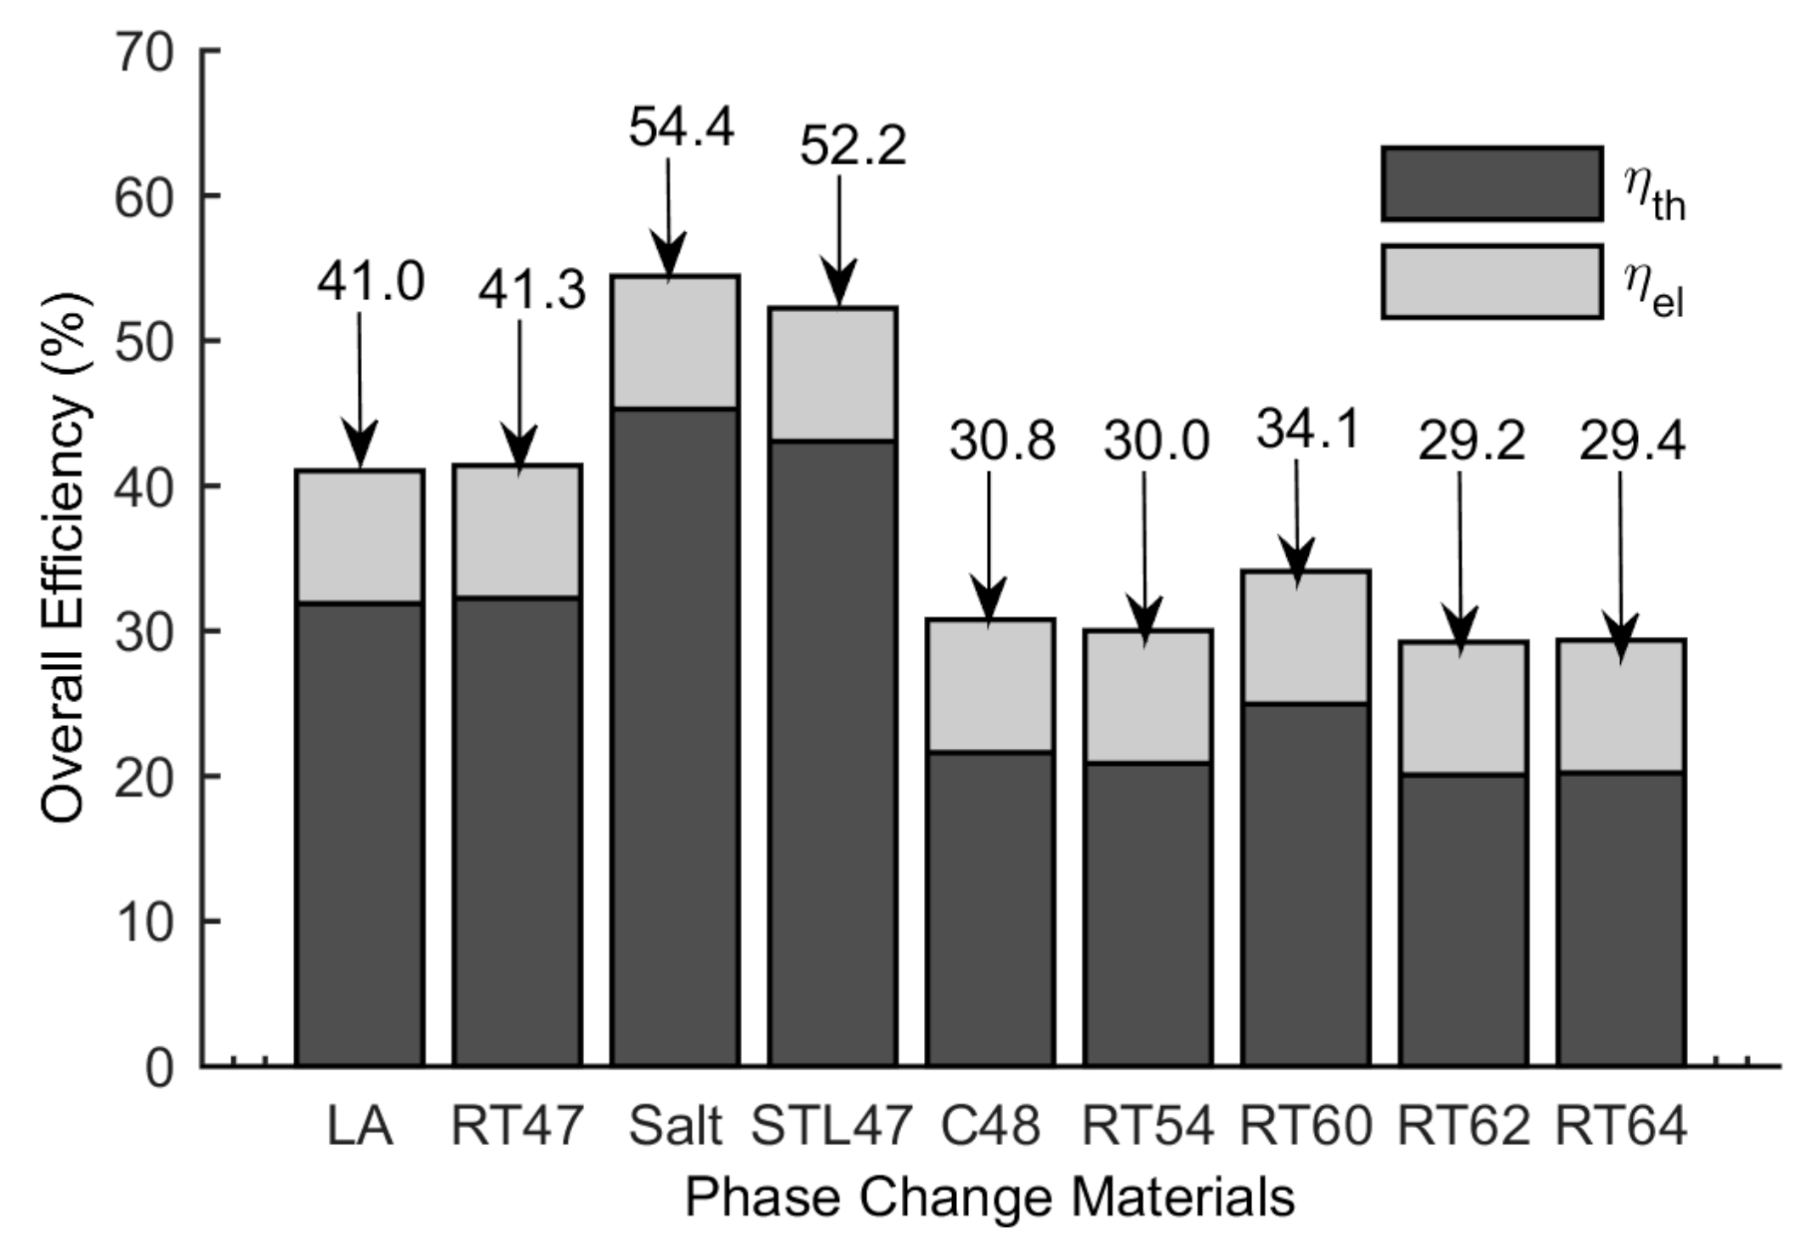
5.3. Thermal and Overall Efficiency
5.4. Temperature
5.5. Electrical Output
6. Conclusions
- (1)
- A PCM having a phase transformation temperature in the range of 41 °C to 49 °C are suitable in the current configuration.
- (2)
- The highest overall efficiency of 54.4% is found for the CPVPCM system with salt, therefore, thus is considered the best PCM in the current configuration.
- (3)
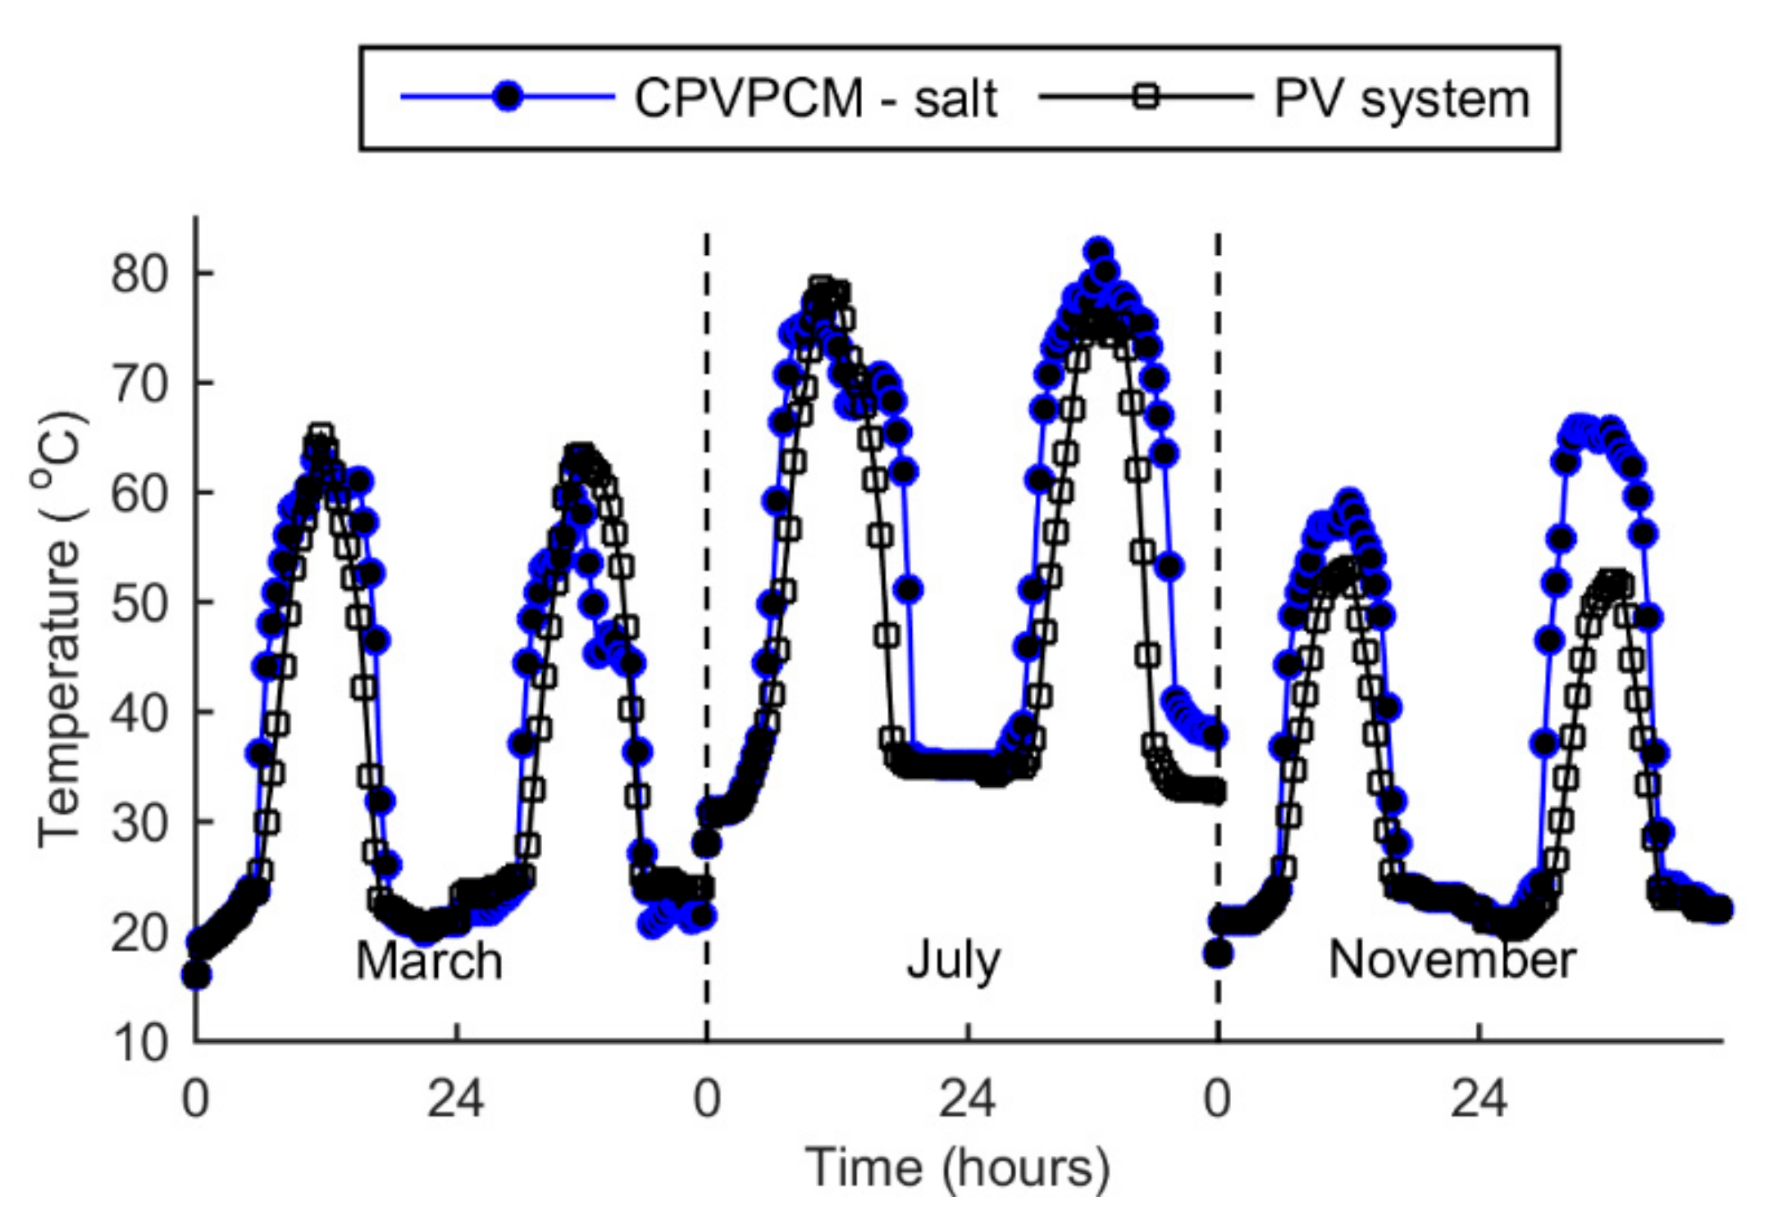
- The peak temperature of the CPVPCM system with salt stays below the limiting temperature of 85 °C. The maximum temperature of the PV cell in the CPVPCM system is found as 82.1 °C in July.
- (4)
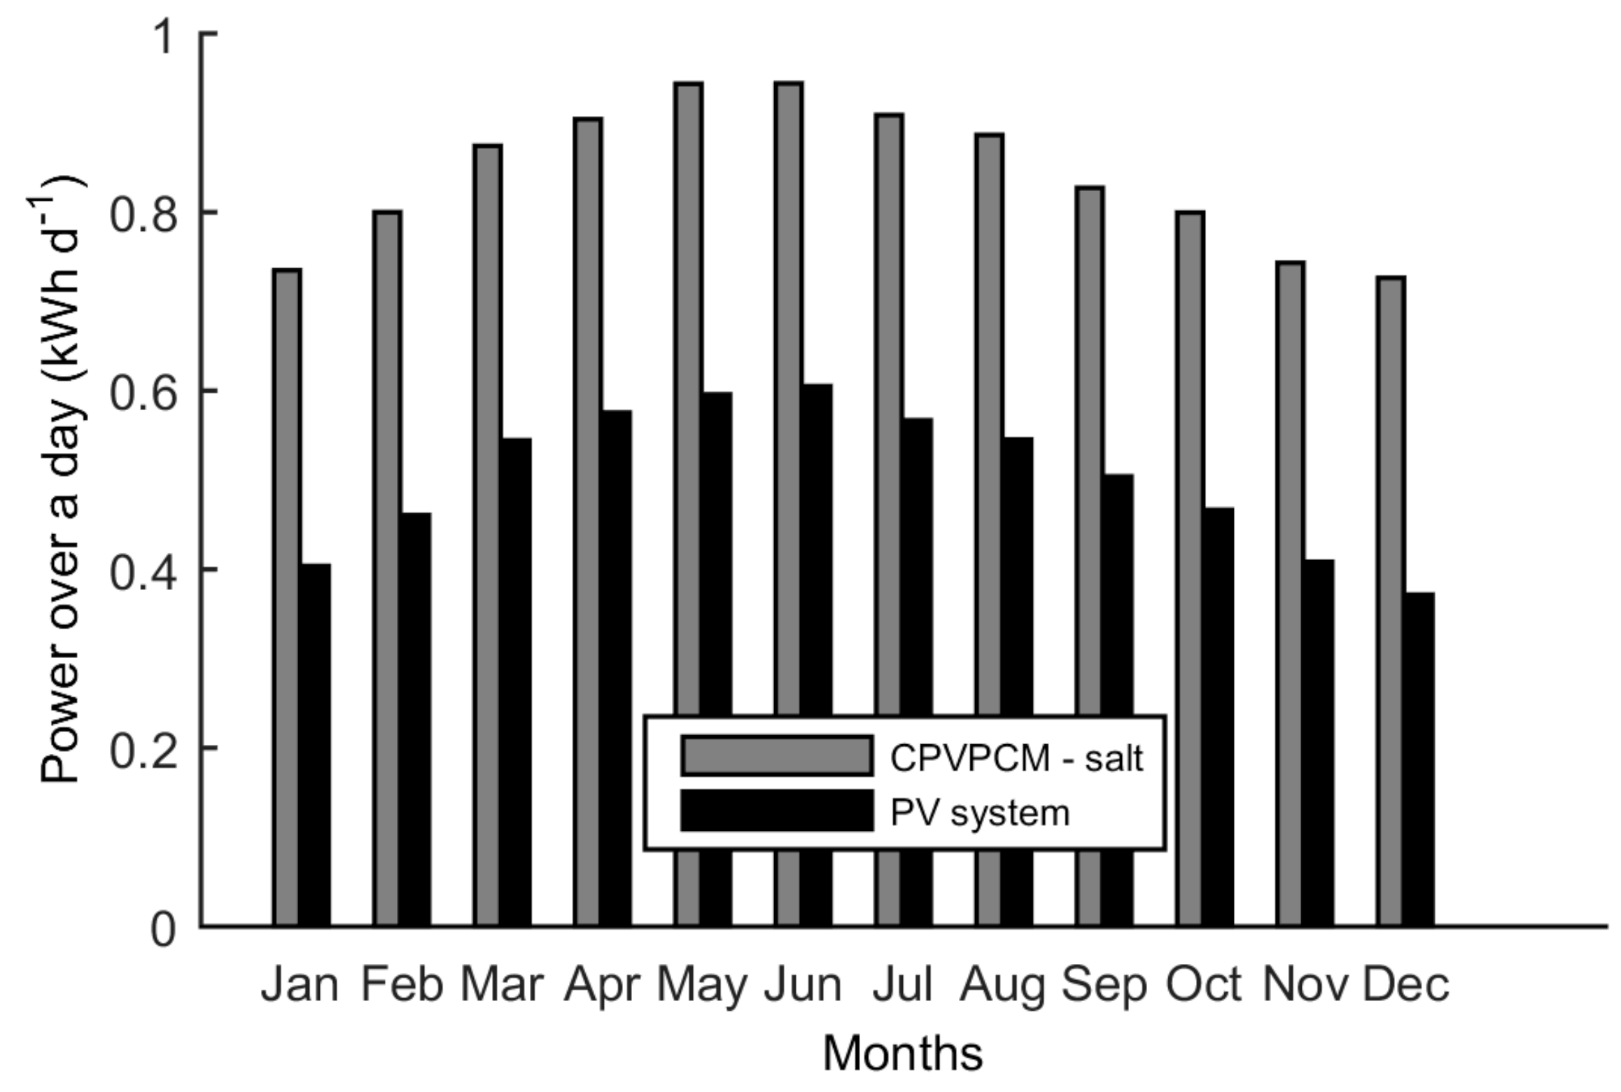
- The CPVPCM system with salt consistently produces more power over a day as compared to the PV system.
Author Contributions
Funding
Institutional Review Board Statement
Informed Consent Statement
Acknowledgments
Conflicts of Interest
References
- Sarwar, J.; Abbas, A.E.; Kakosimos, K.E. Effect of the thermophysical properties of a phase change material on the electrical output of a concentrated photovoltaic system. In Proceedings of the 2017 IEEE 44th Photovoltaic Specialist Conference (PVSC), Washington, DC, USA, 25–30 June 2017. [Google Scholar]
- Ceylan, İ.; Gürel, A.E.; Ergün, A.; Tabak, A. Performance analysis of a concentrated photovoltaic and thermal system. Sol. Energy 2016, 129, 217–223. [Google Scholar] [CrossRef]
- Radziemska, E. The effect of temperature on the power drop in crystalline silicon solar cells. Renew. Energy 2003, 28, 1–12. [Google Scholar] [CrossRef]
- Maleki, A.; Haghighi, A.; Assad, M.E.H.; Mahariq, I.; Nazari, M.A.J.S.E. A review on the approaches employed for cooling PV cells. Sol. Energy 2020, 209, 170–185. [Google Scholar] [CrossRef]
- Hasan, A.; Sarwar, J.; Alnoman, H.; Abdelbaqi, S. Yearly energy performance of a photovoltaic-phase change material (PV-PCM) system in hot climate. Sol. Energy 2017, 146, 417–429. [Google Scholar] [CrossRef]
- Browne, M.; Norton, B.; McCormack, S. Phase change materials for photovoltaic thermal management. Renew. Sustain. Energy Rev. 2015, 47, 762–782. [Google Scholar] [CrossRef]
- Kibria, M.; Saidur, R.; Al-Sulaiman, F.; Aziz, M.M.A.J.S.E. Development of a thermal model for a hybrid photovoltaic module and phase change materials storage integrated in buildings. Sol. Energy 2016, 124, 114–123. [Google Scholar] [CrossRef]
- Waqas, A.; Jie, J. Effectiveness of Phase Change Material (PCM) for cooling of PV panel for hot climate. J. Sol. Energy Eng. 2018, 140, 041006. [Google Scholar] [CrossRef]
- Sharma, S.; Tahir, A.; Reddy, K.; Mallick, T.K. Performance enhancement of a Building-Integrated Concentrating Photovoltaic system using phase change material. Sol. Energy Mater. Sol. Cells 2016, 149, 29–39. [Google Scholar] [CrossRef]
- Sarwar, J.; Hasnain, A.; Abbas, A.E.; Kakosimos, K.E.J.T.S. Comparative analysis of a novel low concentration dual photovoltaic/phase change material system with a non-concentrator photovoltaic system. Therm. Sci. 2019, 25, 468. [Google Scholar] [CrossRef]
- Emam, M.; Ahmed, M.; Ookawara, S. Performance Enhancement of Concentrated Photovoltaic System Using Phase-Change Material. In Proceedings of the ASME 2016 10th International Conference on Energy Sustainability Collocated with the ASME 2016 Power Conference and the ASME 2016 14th International Conference on Fuel Cell Science, Engineering and Technology, Charlotte, NC, USA, 26–30 June 2016; p. V001T08A006. [Google Scholar]
- Baqi, S.A.; Hassan, A.; Shah, A.H. Performance Optimization of Concentrated Photovoltaic-Thermal (CPV-T) System Employing Phase Change Material (PCM) in Hot Climate. In Renewable Energy and Sustainable Buildings; Springer: Berlin/Heidelberg, Germany, 2020; pp. 579–594. [Google Scholar]
- Cui, T.; Xuan, Y.; Li, Q. Design of a novel concentrating photovoltaic–thermoelectric system incorporated with phase change materials. Energy Convers. Manag. 2016, 112, 49–60. [Google Scholar] [CrossRef]
- Hasnain, A.; Sarwar, J.; Abbas, Q.; Younas, M.A.; Kakosimos, K.E. Thermal and Electrical Performance Analysis of a Novel Medium Concentration Dual Photovoltaic System for Different Phase Change Materials. In Proceedings of the ASME 2020 International Mechanical Engineering Congress and Exposition, Online. 16–19 November 2020. [Google Scholar]
- Karthick, A.; Ramanan, P.; Ghosh, A.; Stalin, B.; Kumar, R.V.; Baranilingesan, I. Performance enhancement of copper indium diselenide photovoltaic module using inorganic phase change material. Asia Pac. J. Chem. Eng. 2020, 15, e2480. [Google Scholar] [CrossRef]
- Karthick, A.; Murugavel, K.K.; Ghosh, A.; Sudhakar, K.; Ramanan, P. Investigation of a binary eutectic mixture of phase change material for building integrated photovoltaic (BIPV) system. Sol. Energy Mater. Sol. Cells 2020, 207, 110360. [Google Scholar] [CrossRef]
- Karthick, A.; Manokar Athikesavan, M.; Pasupathi, M.K.; Manoj Kumar, N.; Chopra, S.S.; Ghosh, A. Investigation of Inorganic Phase Change Material for a Semi-Transparent Photovoltaic (STPV) Module. Energies 2020, 13, 3582. [Google Scholar] [CrossRef]
- Pasupathi, M.K.; Alagar, K.; Matheswaran, M.M.; Ghosh, A. Characterization of Hybrid-nano/Paraffin Organic Phase Change Material for Thermal Energy Storage Applications in Solar Thermal Systems. Energies 2020, 13, 5079. [Google Scholar] [CrossRef]
- KC200GT, K. High Efficiency Multicrystal Photovoltaic Module. Available online: https://www.energymatters.com.au/images/kyocera/KC200GT.pdf (accessed on 1 February 2021).
- Bird, R.E.; Hulstrom, R.L. Simplified Clear Sky Model for Direct and Diffuse Insolation on Horizontal Surfaces; Solar Energy Research Inst.: Golden, CO, USA, 1981. [Google Scholar]
- Hecht, E. Optics; Pearson: Harlow, UK, 2012. [Google Scholar]
- Herrero, R.; Victoria, M.; Domínguez, C.; Askins, S.; Antón, I.; Sala, G. Understanding causes and effects of non-uniform light distributions on multi-junction solar cells: Procedures for estimating efficiency losses. AIP Conf. Proc. 2015, 1679, 050006. [Google Scholar]
- Sarwar, J.; Lemarchand, P.; McCormack, S.; Huang, M.; Norton, B. Novel Method to Design Non-Ideal Parabolic Dish Concentrator for Concentrated Photovoltaic Application; Its Theoratical Analysis and Experimental Characterisation for Design Validation. In Proceedings of the 28th European Photovoltaic Solar Energy Conference and Exhibition, Paris, France, 30 September–4 October 2013. [Google Scholar]
- Reddy, J.N.; Gartling, D.K. The Finite Element Method in Heat Transfer and Fluid Dynamics, 2nd ed.; CRC: Boca Raton, FL, USA, 2001; p. 469. [Google Scholar]
- Runnels, S.R.; Carey, G.F. Finite element simulation of phase change using capacitance methods. Numer. Heat Transf. Part B Fundam. 1991, 19, 13–30. [Google Scholar] [CrossRef]
- Lamberg, P.; Lehtiniemi, R.; Henell, A.-M. Numerical and experimental investigation of melting and freezing processes in phase change material storage. Int. J. Therm. Sci. 2004, 43, 277–287. [Google Scholar] [CrossRef]
- Villalva, M.G.; Gazoli, J.R.; Filho, E.R. Comprehensive approach to modeling and simulation of photovoltaic arrays. IEEE Trans. Power Electron. 2009, 24, 1198–1208. [Google Scholar] [CrossRef]
- Lal, M.; Singh, S. A new method of determination of series and shunt resistances of silicon solar cells. Sol. Energy Mater. Sol. Cells 2007, 91, 137–142. [Google Scholar]
- Brano, V.L.; Orioli, A.; Ciulla, G.; Di Gangi, A. An improved five-parameter model for photovoltaic modules. Sol. Energy Mater. Sol. Cells 2010, 94, 1358–1370. [Google Scholar] [CrossRef]
- Solomon, L.; Oztekin, A. Exergy analysis of cascaded encapsulated phase change material—High-temperature thermal energy storage systems. J. Energy Storage 2016, 8, 12–26. [Google Scholar] [CrossRef]


| Tm | H | k | cp | ||||
|---|---|---|---|---|---|---|---|
| °C | kJ/kg | W/mK | kg/m3 | kJ/kgK | |||
| On | End | s | |||||
| La | 42 | 44 | 178 | 0.15 | 1007 | 2 | 2 |
| RT47 | 41 | 48 | 165 | 0.20 | 880 | 2 | 2 |
| S-SERIES SALT | 45 | 47 | 220 | 0.60 | 1450 | 2 | 2 |
| STL47 | 47 | 49 | 221 | 1.34 | 1350 | 2 | 2 |
| C48 | 48 | 53 | 180 | 0.76 | 1300 | 2 | 2 |
| RT54 | 53 | 54 | 200 | 0.20 | 850 | 2 | 2 |
| RT60 | 55 | 61 | 160 | 0.20 | 880 | 2 | 2 |
| RT62 | 62 | 63 | 230 | 0.20 | 850 | 2 | 2 |
| RT64 | 63 | 65 | 250 | 0.20 | 880 | 2 | 2 |
| Aluminium | × | × | × | 211 | 2675 | 0.9 | × |
| PV | × | × | × | 125.4 | 2205 | 0.8 | × |
| SYLGARD | × | × | × | 0.27 | 1030 | 1.1 | × |
| PERSPEX | × | × | × | 1.9 | 1190 | 1.3 | × |
| Electrical Properties of PV Cell at STC | |||
|---|---|---|---|
| 8.21 | 32.9 | 7.61 | 26.3 |
Publisher’s Note: MDPI stays neutral with regard to jurisdictional claims in published maps and institutional affiliations. |
© 2021 by the authors. Licensee MDPI, Basel, Switzerland. This article is an open access article distributed under the terms and conditions of the Creative Commons Attribution (CC BY) license (https://creativecommons.org/licenses/by/4.0/).
Share and Cite
Sarwar, J.; Shad, M.R.; Hasnain, A.; Ali, F.; Kakosimos, K.E.; Ghosh, A. Performance Analysis and Comparison of a Concentrated Photovoltaic System with Different Phase Change Materials. Energies 2021, 14, 2911. https://doi.org/10.3390/en14102911
Sarwar J, Shad MR, Hasnain A, Ali F, Kakosimos KE, Ghosh A. Performance Analysis and Comparison of a Concentrated Photovoltaic System with Different Phase Change Materials. Energies. 2021; 14(10):2911. https://doi.org/10.3390/en14102911
Chicago/Turabian StyleSarwar, Jawad, Muhammad Rizwan Shad, Arshmah Hasnain, Farman Ali, Konstantinos E. Kakosimos, and Aritra Ghosh. 2021. "Performance Analysis and Comparison of a Concentrated Photovoltaic System with Different Phase Change Materials" Energies 14, no. 10: 2911. https://doi.org/10.3390/en14102911
APA StyleSarwar, J., Shad, M. R., Hasnain, A., Ali, F., Kakosimos, K. E., & Ghosh, A. (2021). Performance Analysis and Comparison of a Concentrated Photovoltaic System with Different Phase Change Materials. Energies, 14(10), 2911. https://doi.org/10.3390/en14102911