Article

Optimization-Driven Powertrain-Oriented Adaptive Cruise Control to Improve Energy Saving and Passenger Comfort

by
Pier Giuseppe Anselma
1,2
1
Department of Mechanical and Aerospace Engineering (DIMEAS), Politecnico di Torino, 10129 Torino, Italy
2
Center for Automotive Research and Sustainable Mobility (CARS), Politecnico di Torino, 10129 Torino, Italy
Energies 2021, 14(10), 2897; https://doi.org/10.3390/en14102897
Submission received: 13 April 2021 / Revised: 25 April 2021 / Accepted: 13 May 2021 / Published: 17 May 2021

Abstract

:
Assessing the potential of advanced driver assistance systems requires developing dedicated control algorithms for controlling the longitudinal speed of automated vehicles over time. In this paper, a multiobjective off-line optimal control approach for planning the speed of the following vehicle in adaptive cruise control (ACC) driving is proposed. The implemented method relies on the principle of global optimality fostered by dynamic programming (DP) and aims to minimize propelling energy consumption and enhance passenger comfort. The powertrain model and onboard control system are integrated within the proposed car-following optimization framework. The retained ACC approach ensures that the distance between the following vehicle and the preceding vehicle is always maintained within allowed limits. The flexibility of the proposed method is demonstrated here through ease of implementation on a wide range of powertrain categories, including a conventional vehicle propelled by an internal combustion engine solely, a pure electric vehicle, a parallel P2 hybrid electric vehicle (HEV) and a power-split HEV. Moreover, different driving conditions are considered to prove the effectiveness of the proposed optimization-driven ACC approach. Obtained simulation results suggest that up to 22% energy-saving and 48% passenger comfort improvement might be achieved for the ACC-enabled vehicle compared with the preceding vehicle by implementing the proposed optimization-driven ACC approach. Engineers may adopt the proposed workflow to evaluate corresponding real-time ACC approaches and assess optimal powertrain design solutions for ACC driving.

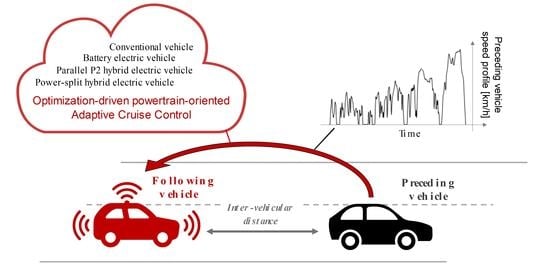
Graphical Abstract

1. Introduction

Automated and connected mobility is currently forecasted reshaping public and private transportation over the next few decades [1,2,3,4]. Remarkable benefits could be achieved in general through implementing automated mobility, including enhancing passenger comfort, reducing energy consumption for propulsion, enhancing traffic management, and improving road safety, among others [5]. This technological advance demands developing effective and flexible numerical tools for controlling and designing automated vehicles [6,7,8,9,10,11].
Automated driving, as fostered by the different communication technologies (e.g., vehicle-to-vehicle, vehicle-to-infrastructure, vehicle-to-pedestrian, vehicle-to-grid, vehicle-to-device), represents an extension of advanced driver assistance systems (ADASs). Examples for ADASs currently implemented in road vehicles include cruise control (CC), where the vehicle is controlled to travel at constant longitudinal speed over time, and adaptive cruise control (ACC), where the longitudinal speed of the vehicle is controlled to vary over time according to the measured distance from the vehicle ahead. In an ACC driving scenario, the following vehicle (named hereafter as the following vehicle) typically exploits data from the preceding vehicle (named hereafter as the preceding vehicle), which can be either human-operated or automated. ACC systems use sensors, such as radar, Light Detection and Ranging (LIDAR) or cameras to identify and monitor the preceding vehicle for measuring its current distance and speed difference [12]. Current ACC systems are calibrated to regulate the longitudinal speed of the vehicle to maintain a constant headway from the preceding vehicle [13,14]. Avoidance of front-end collision between the preceding vehicle and the following vehicle can be ensured in this way. However, when propulsion and brake systems are controlled with the exclusive aim of maintaining a constant time-headway (or distance) from the preceding vehicle, it cannot be guaranteed that the ACC-enabled vehicle achieves improved performance in terms of energy economy or passenger comfort as an example [15]. New possibilities and challenges open up in this framework concerning the development of ACC approaches that can vary both the following vehicle’s longitudinal speed and distance from the preceding vehicle over time regardless of the longitudinal speed of the preceding vehicle. Improving various predefined performance metrics for the preceding vehicle can be set as a control target for such an enhanced ACC system.
Literature regarding control approaches for the following vehicle’s speed exploiting information coming from the preceding vehicle in automated driving can be divided between single-powertrain-based approaches and multiple-powertrain-based approaches. Single-powertrain-based ACC approaches can focus either on conventional vehicles (CVs), hybrid electric vehicles (HEVs) or battery electric vehicles (BEVs) as examples. Concerning CVs powered solely by an internal combustion engine (ICE), Lang et al. [16] in 2013 discussed a control logic aiming to minimize fuel consumption while neglecting gear shifting. He and Orosz [17] in 2017 compared feedback-based and rolling horizon optimal control-based as cooperative cruise control approaches minimizing fuel consumption. The same authors extended a fuel-optimal longitudinal speed controller to the case of heavy-duty trucks exploiting information coming from multiple vehicles ahead through vehicle-to-vehicle (V2V) communication [18]. As concerns HEVs, a recurrent research topic involves developing velocity predictors that can improve the energy management strategy of the following vehicle through the information coming from the preceding vehicle. Different categories of longitudinal speed regulation logics have been developed in the literature (e.g., heuristic, instantaneous optimization, machine learning), and various HEV powertrain layouts have been considered, such as power-split [19], parallel P0 [20], parallel P2 [21] and series-parallel P1P4 [22] as an example. Regarding BEVs, the author of this paper proposed an optimal off-line velocity controller based on dynamic programming (DP) capable of minimizing the energy consumption of the following vehicle [23]. Recently, Koch et al. [24] focused on battery-electric buses and implemented DP while assuming ideal V2I communication and a dedicated traveling road lane to generate energy-efficient driving profiles. The same authors recently proposed an algorithm validated using DP that allows the simultaneous optimization of speed profile and powertrain operation to compare different BEV powertrain architectures [25].
Regarding multiple-powertrain-based control approaches for the following vehicle in car-following scenarios, in 2018, Tate et al. [26] considered different automated driving scenarios by generating the related vehicle speed profiles with a heuristic approach according to engineering experience. Both a CV and a BEV layout were retained, and considerable reductions in greenhouse gas emissions were suggested, especially in the BEV case, thanks to implementing car-following automated driving. Plum et al. [27] in 2018 investigated a CV, an HEV and a BEV powertrain layout while considering a model predictive acceleration controller that exploited information coming from traffic light schedules and the preceding vehicle. The HEV powertrain layout was demonstrated, achieving a greater portion of up to 27.7% energy savings. Nevertheless, the controller was specifically calibrated for a limited number of predefined inner-city driving conditions. Recently, Spano et al. [28] considered a CV and an HEV and estimated the fuel consumption reduction capability at different levels of automated driving using a heuristic approach.
In general, reviewed ACC approaches for enhancing energy-saving of automated road vehicles in car-following scenarios are usually developed and calibrated ad hoc for specific powertrain configurations in terms of architecture and component sizes. Extending the reviewed approaches to reduce the energy consumption of vehicles embedding different powertrain types and component sizes might, in turn, require thorough and time-consuming re-calibration procedures. To the best of the author’s knowledge, developing a control approach for the longitudinal speed of automated vehicles in car-following scenarios that can easily adapt to foster energy-saving of different powertrain layouts and component sizes still represents an open research question. To overcome the highlighted research gap, this paper aims to present a new multiobjective optimization-driven ACC algorithm that can easily estimate energy savings and passenger comfort improvements for various powertrain categories when traveling as a following vehicle in car-following scenarios. The proposed ACC approach relies on DP as a widely employed off-line control algorithm capable of identifying the optimal global solution for the considered control problem [29]. Energy consumption minimization and passenger comfort enhancement are considered as conflicting optimization targets for the proposed car-following controller. The ease of adaptability of the discussed approach is suggested through its efficient implementation retaining a CV powertrain, a BEV powertrain, a single-motor parallel HEV powertrain and a dual-motor power-split HEV powertrain. In all the presented cases, only the objective function considered in DP needs to be adapted to the given powertrain category, yet the proposed workflows can be straightforwardly applied considering different component sizes for each propulsion system category. Our results demonstrate the potential of the proposed approach for effectively and easily determining optimization-driven speed profiles over time for the following vehicle in car-following scenarios. Engineers may adopt the proposed optimization-driven ACC approach to evaluate the performance of corresponding real-time ACC approaches and to improve powertrain design methodologies considering enhanced ACC driving. The remainder of this paper is as follows: the considered vehicle powertrain layouts and the related modeling approach are first illustrated. The mathematical formulation of the car-following driving problem is then discussed, and the proposed algorithm is presented. Results are presented over different driving conditions, and conclusions are given.

2. Vehicle Powertrains

This section aims at describing the considered vehicle powertrain architectures. The adopted numerical modeling approaches find discussion as well. In this paper, a CV powertrain layout, a BEV powertrain layout, a parallel P2 HEV (P2 HEV) powertrain layout and a power-split HEV (PS HEV) powertrain layout are retained. The corresponding schematic diagrams are illustrated in Figure 1, while detailed discussion for each powertrain architecture is reported in the follow-up of this section.

2.1. CV Powertrain

For the CV powertrain layout illustrated in Figure 1a, the vehicle is propelled by an ICE alone. An automated manual transmission (AMT) is embedded capable of shifting gear according to the ICE speed and the torque request coming from the driver following a dedicated control logic. In general, a quasi-static modeling approach is implemented here in deriving speeds and torques of power components directly from the vehicle speed profile over time for the considered drive cycle [30]. The torque requested by the driver at the driven wheels T w h e e l s can particularly be evaluated following Equation (1) [31]:
T w h e e l s = F r o l l + F m i s c + F a e r o + m v e h e q · x ¨ · r d y n
where F a e r o , F m i s c and F r o l l represent resistive load elements corresponding to the aerodynamic drag, miscellaneous elements, such as road slope and side forces as an example, and rolling resistance, respectively. x ¨ is the vehicle acceleration, while r d y n and m v e h e q , respectively represent the wheel’s dynamic radius and the vehicle mass, including the equivalent mass of the rotational elements. Subsequently, the rotational speed ω I C E and the requested ICE torque T I C E can be computed as a function of the gear engaged j following Equations (2) and (3), respectively [32]:
ω I C E = x ˙ r d y n · τ d i f f · τ A M T j
T I C E = T w h e e l s τ d i f f · τ A M T j · η T R s i g n T w h e e l s
where x ˙ is the vehicle speed in meters per second, τ d i f f and τ A M T represent gear ratios for the differential and the instantaneous gear j engaged in the AMT, respectively. η T R is the efficiency of the transmission system, and it is powered to the sign of the torque at the wheels to account for both vehicle accelerating and braking cases.
Once ω I C E and T I C E are determined, the instantaneous rate of fuel consumption can be determined by interpolating in a two-dimensional lookup table with speed and torque of the ICE as independent variables. As concerns selecting the gear in the AMT, a common approach implemented here refers to determining the engaged gear number according to a pre-calibrated two-dimensional lookup table with vehicle speed and driver torque demand as an independent variable [33].

2.2. BEV Powertrain

In the BEV powertrain layout illustrated in Figure 1b, the fuel tank, ICE and AMT of the CV powertrain are replaced with a high-voltage battery, an electric motor (EM) and a direct drive, respectively. Finally, power electronics enable the proper operation of the electric powertrain components. In this framework, speed ω E M and torque T E M of the EM can be evaluated at each time step following the same procedure illustrated for the CV case in Equations (1)–(3). A gear shift logic does not need implementation in this case, given the embedment of a direct drive. The EM electrical losses l o s s E M , including inverter losses as well, can be evaluated in this case by interpolating in a two-dimensional lookup table with ω E M and T E M as independent variables. Finally, the battery state-of-charge (SOC) over time can be evaluated as a function of the requested battery power P b a t t by adopting an equivalent circuit approach and following Equations (4)–(6) [34].
S O C t = t 0 t e n d S O C ˙ P b a t t t , S O C t   d t
with:
P b a t t t = ω E M t · T E M t + l o s s E M ω E M t , T E M t + l o s s a u x t
S O C ˙ P b a t t t , S O C t = V O C S O C t V O C S O C t 2 4 · R I N S O C t · P b a t t t 2 · R I N S O C t · n P A h b a t t · 3600
where S O C ˙ , t 0 and t e n d are the instantaneous rate of SOC, the initial time instant and the final time instant of the drive cycle, respectively. l o s s a u x is the power requested by the accessories (e.g., air conditioning, lubrication), and it is modeled as having a constant value in this work. R I N and V O C represent the internal resistance and the open-circuit voltage of the battery pack, as obtained by interpolating in 1D lookup tables with SOC ad independent variables. n P is the number of cells in parallel according to the battery pack layout, while A h b a t t represents the battery pack energy capacity in ampere-hours. The factor of 3600 is considered here to convert energy units in ampere-seconds.

2.3. P2 HEV Powertrain

The parallel P2 HEV powertrain illustrated in Figure 1c represents a combination of the CV and the BEV architectures discussed above. In a parallel P2, the EM is placed downstream of the ICE output shaft before the AMT input shaft. A gear ratio between the EM and the AMT input shaft is considered in this case, while a clutch connection is included between the ICE and the EM to allow disengaging the ICE and avoiding its dragging effect in pure electric operation. Notably, P2 represents one of the potentially most efficient options among the parallel HEV powertrain architectures [35].
In a P2 HEV powertrain, the torques of ICE and EM are additive and follow Equation (7) [32]:
T w h e e l s = T I C E + T E M · τ G R · τ d i f f · τ A M T j · η T R s i g n T w h e e l s
where τ G R is the gear ratio between EM output shaft and AMT input shaft. In a quasi-static modeling approach, controlling either T I C E or T E M allows automatically determining the value of the other variable.
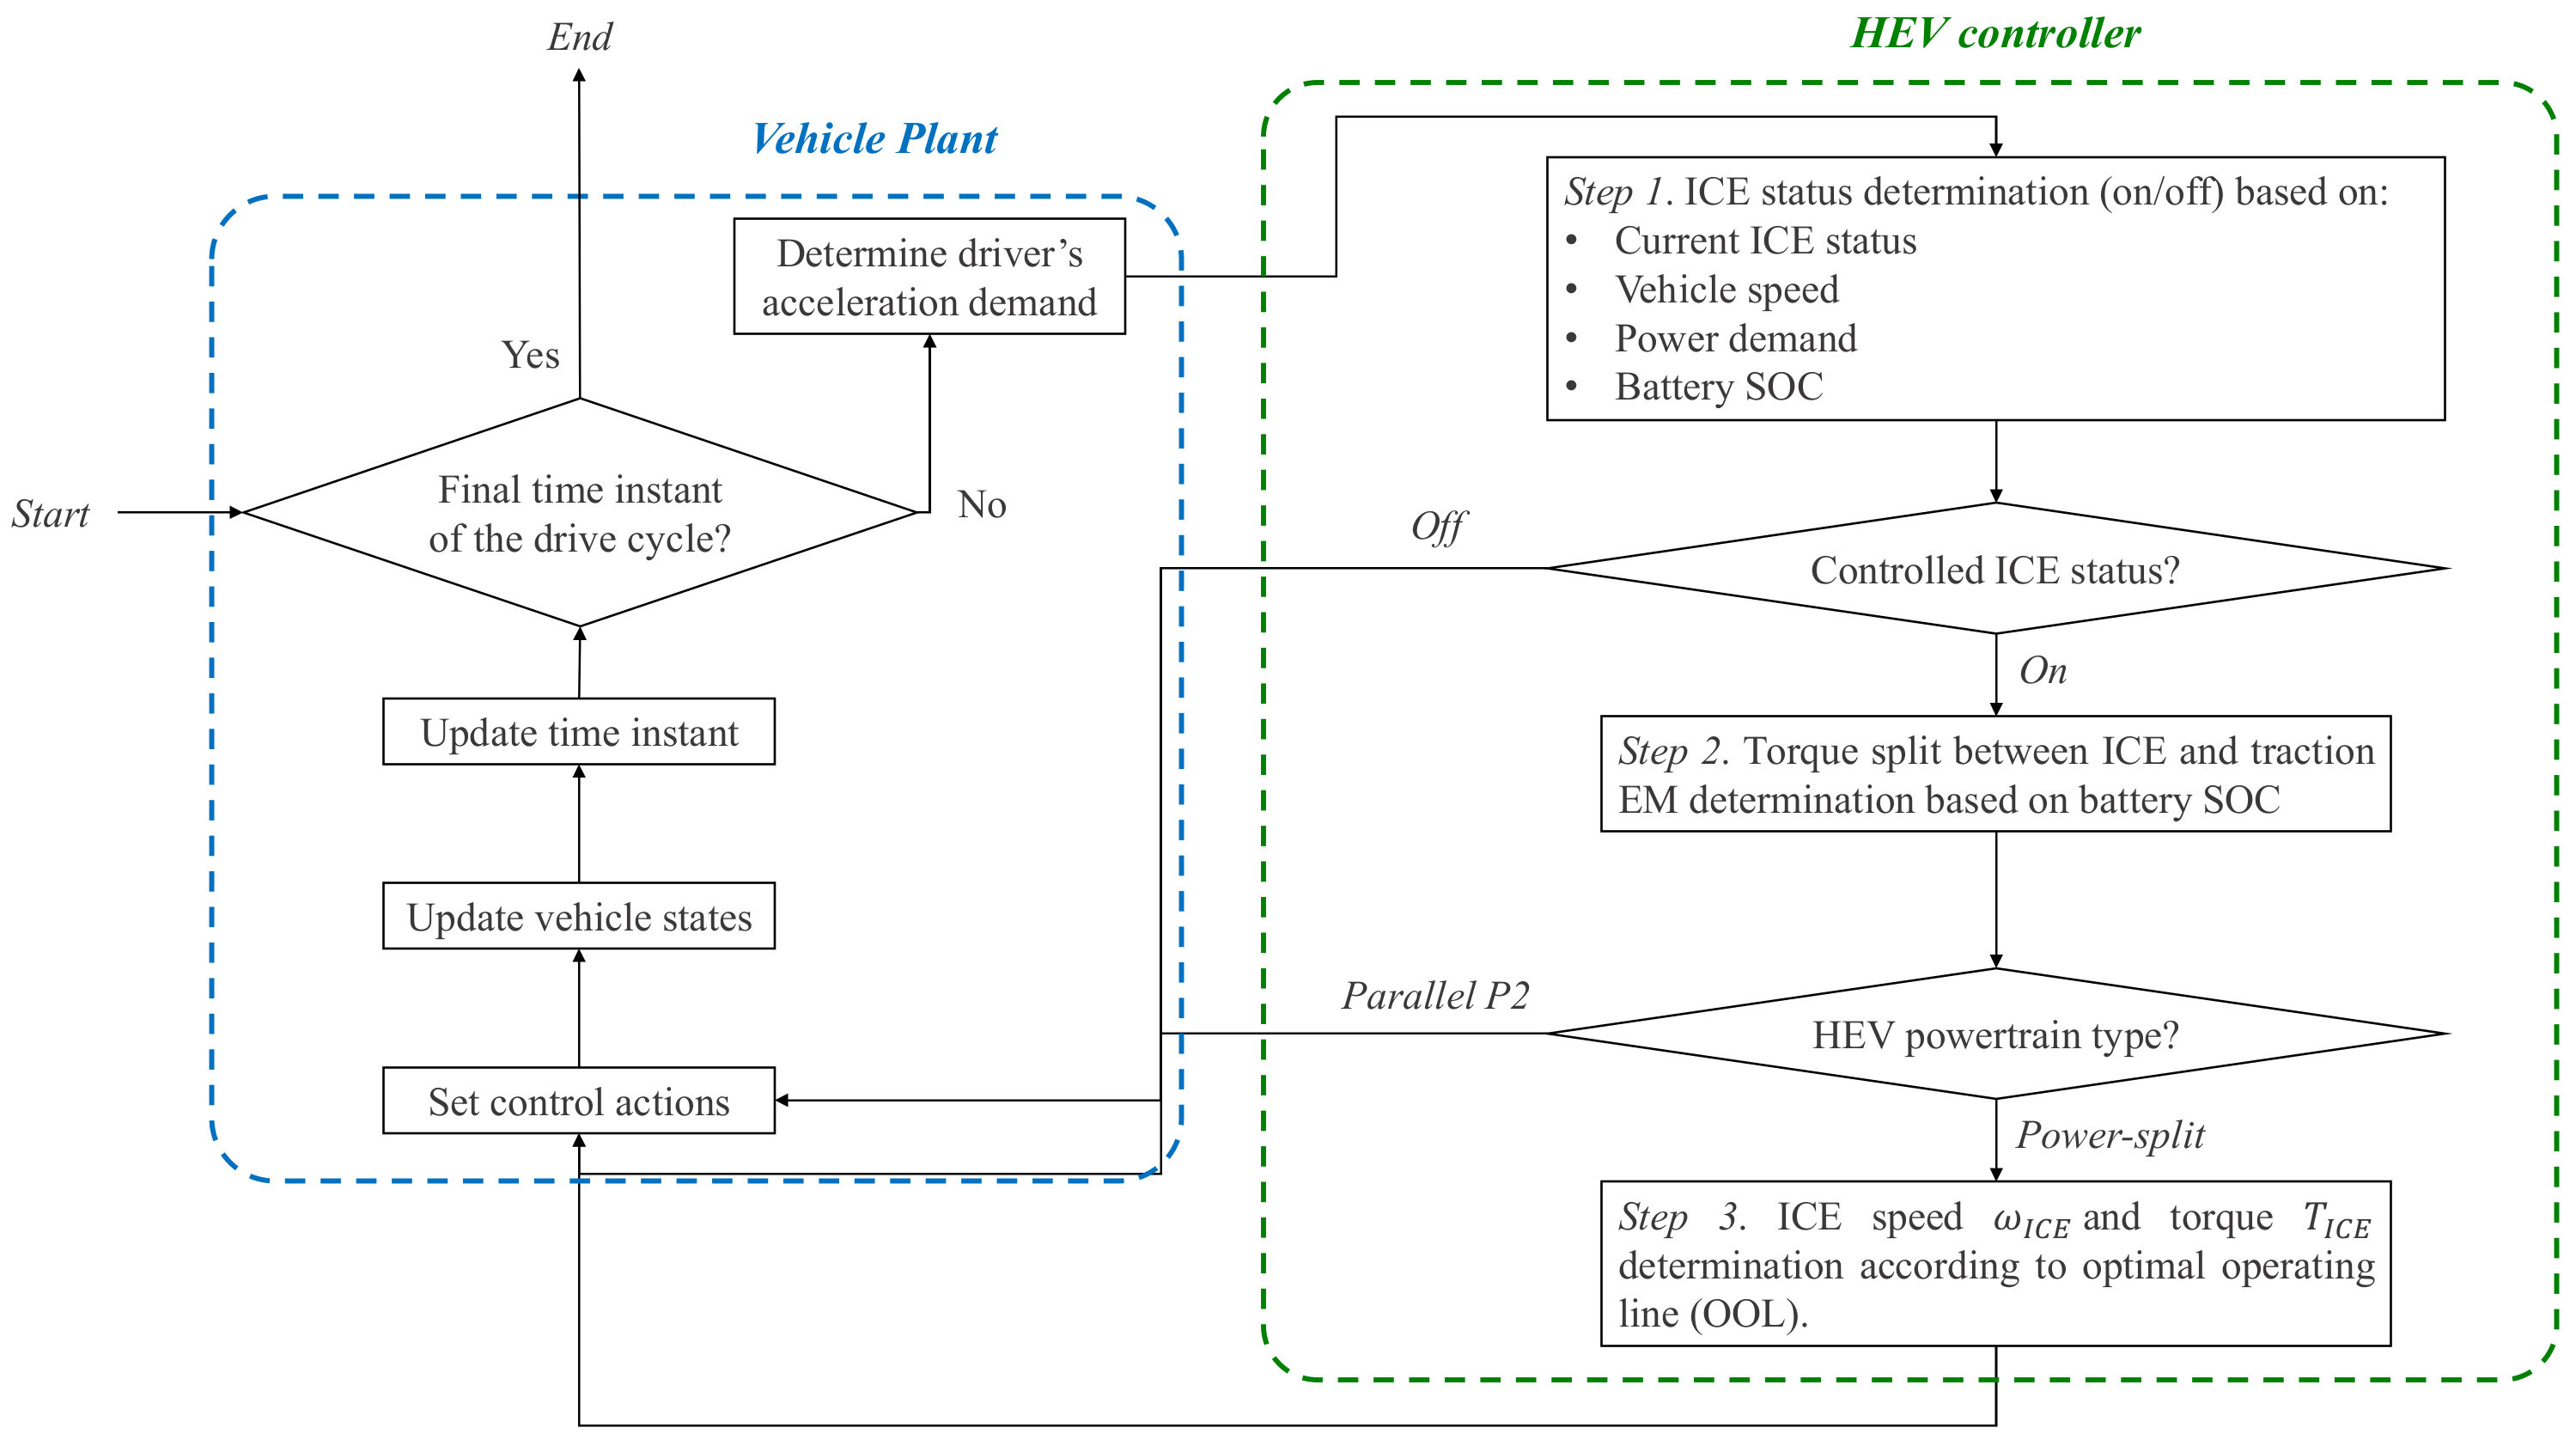
Hybrid electric or pure electric operation are distinguished in this case by the value of T I C E being positive or equal to zero, respectively. As a typical approach, a rule-based energy management strategy (EMS) is implemented here for the P2 HEV powertrain involving two decision steps, as reported in Figure 2 [36,37]. The first step relates to determining the ICE status (i.e., on or off), while the second step involves deciding the power split between ICE and EM in case the hybrid operation is selected.
For determining the ICE status, a set of rules is retained considering the current value of vehicle speed, the current value of battery SOC, the required output power and the current ICE status [38]. The rules constituting the control logic for the ICE status are reported in Table 1. Particularly, the ICE is controlled to be activated in the case at least one of the following criteria are met: (1) the vehicle speed exceeds a predefined threshold x ˙ t h r e , (2) the power demand is above a certain limit P O U T t h r e , or (3) the battery SOC falls below a certain value S O C t h r e . On the other hand, if none of the three conditions is met, the ICE is controlled to be deactivated. To reduce the frequency of ICE activation and de-activation events, different values for the discussed threshold variables are considered according to the current ICE status following x ˙ t h r e O F F < x ˙ t h r e O N , P O U T t h r e O F F < P O U T t h r e O N and S O C t h r e O F F > S O C t h r e O N , respectively.
When the hybrid operation is selected, the controlled ICE mechanical power P I C E c o n t r o l can then be determined through interpolation in a one-dimensional lookup table having battery SOC as the independent variable. A tuning process for this table was carried out beforehand to simultaneously prevent excessive charge depletion of the battery and guarantee enhanced HEV fuel economy capability. Since the speeds of both the ICE and the EM are determined by the current vehicle speed and the gear engaged, the corresponding torques can be computed from P I C E c o n t r o l and the resulting value of EM power.

2.4. Power-Split HEV Powertrain

The PS HEV powertrain architecture shown in Figure 1d comes from the industrial state-of-the-art, and it characterizes the embedment of two EMs [39]. EM2 represents the main traction motor, and it operates either to propel the HEV or to recover electrical energy in braking events. On the other hand, ICE, EM1 and the differential input shaft are mechanically connected to the carrier, the sun gear and the ring gear of a planetary gearset (PG). This mechanical device allows decoupling the ICE speed from the current vehicle speed, allowing the HEV powertrain to operate as an electrically variable transmission (eVT) [40]. In this framework, EM1 mainly operates as an electrical generator while ensuring reaction torque for the ICE torque being delivered to the wheels.
For the illustrated PS HEV, the same workflow as Figure 2 is implemented in the supervisory control logic as the one illustrated in Section 2.3 for the P2 HEV. However, other than determining the ICE status and the ICE mechanical power, a third control action needs achievement in this case related to controlling ω I C E and T I C E . To this end, once the value of P I C E c o n t r o l has been determined at the previous step of the logic, ω I C E and T I C E may be selected as the solution of the optimization process linked to the optimal operating line (OOL) of the ICE as reported in Equations (8) and (9) [41]:
O O L ω I C E , T I C E = arg min m ˙ f u e l ω I C E , T I C E
subject to:
ω I C E · T I C E = P I C E c o n t r o l
The resulting values of speed and torque for the ICE should particularly guarantee to deliver the requested value of ICE mechanical power and minimize the fuel consumption rate at the same time. The illustrated approach thus fosters efficient ICE operation. Once ω I C E and T I C E are determined, speeds and torques of both the EMs can be found following the kinematic and dynamic relationships for the PG-based PS HEV powertrain that are reported in Equations (10) and (11), respectively [34]:
ω E M 1 ω E M 2 = i P G i P G + 1 τ G R 0 ω I N F D ω I C E
T E M 1 T E M 2 = 0 1 i P G + 1 1 τ G R i P G i P G + 1 · 1 τ G R T I N F D η TR sign T wheels T I C E
ω I N F D and T I N F D represent the rotational speed and the torque at the input shaft of the final drive, respectively. i P G and τ G R are the gear ratios of the PG and the transfer gearset between EM2 and the input shaft of the final drive, respectively.

3. Multiobjective Optimal Car-Following Driving Problem

In this section, the multiobjective optimal car-following driving problem under consideration is discussed. This relates to effectively plan the following vehicle’s speed profile over time in the car-following driving scenario illustrated in Figure 3. In the highlighted scenario, the following vehicle receives at each time instant information from the preceding vehicle, including its position x p r e c , velocity x ˙ p r e c , and acceleration x ¨ p r e c , respectively. The flow of information between the two vehicles is supposed ideal and instantaneous, and a given value of inter-vehicular distance (IVD) results from the positions, speeds and accelerations of both the preceding vehicle and the following vehicle at each time instant. Two optimization targets are considered here for the following vehicle, respectively, related to the propelling energy minimization and the passenger comfort enhancement. The mathematical formulation corresponding to the optimal car-following driving problem under analysis was derived, and it is reported in Equations (12)–(16):
arg min J f o l l o w x ¨ f o l l o w , t = t 0 t e n d α e n e r g y · P t r a c t i o n f o l l o w t + 1 α e n e r g y · x ¨ f o l l o w t   d t
subject to:
IVD constraints:
x p r e c t x f o l l o w t I V D M A X t
x p r e c t x f o l l o w t I V D s a f e t y t
Powertrain constraints:
P t r a c t i o n f o l l o w t = L H V f u e l · m ˙ f u e l t + m f u e l c r a n k · s t a r t I C E t V O C · A h b a t t · 3600 · S O C ˙
P t r a c t i o n f o l l o w t P t r a c t i o n f o l l o w M A X t ,   x ˙ f o l l o w t
where J f o l l o w represents the following vehicle’s cost function that needs to be minimized in the considered optimization problem. Its value represents an integration of the instantaneous cost terms throughout the entire drive cycle from the initial time instant t 0 to the final time instant t e n d . x ¨ f o l l o w is the following vehicle’s longitudinal acceleration, and it represents the only control variable affecting the overall cost function J f o l l o w over time. The following vehicle’s longitudinal speed trajectory can be obtained by integrating x ¨ f o l l o w over time. P t r a c t i o n f o l l o w is the tractive power used for propelling the following vehicle, related to fuel or electricity or both of them depending on the given powertrain technology. Other than propelling energy reduction, enhancement of the ride’s comfort represents a crucial potential of automated driving. To foster this aspect, several motions, path, and velocity planners proposed in the literature integrate as objective reducing variables related to vehicle longitudinal acceleration, lateral acceleration and yaw rate as an example [42,43]. Following a similar approach, reducing the following vehicle’s longitudinal acceleration over the entire simulated drive cycle is considered here as an optimization target in J f o l l o w to enhance the passenger comfort. In most cases, reducing the overall energy used for propulsion and improving the passenger comfort may represent contrasting objectives. For example, in electrified vehicles, several fluctuations can be observed in the longitudinal speed when optimizing for energy consumption solely [23]. A trade-off between the two optimization targets retained might, therefore, be implied. In this framework, α e n e r g y represents a weighting coefficient that can be tuned to give more emphasis either on the fuel economy enhancement or on the passenger comfort improvement. Two categories of constraints are considered for the optimal car-following driving optimization problem illustrated in Equation (12). They, respectively, relate to IVD and the following vehicle’s powertrain, and they find illustration in the follow-up of this section.

3.1. Constraints on the IVD

Looking at Equations (13) and (14), the IVD is defined according to x p r e c and x f o l l o w , which represent the preceding vehicle’s position and the following vehicle’s position, respectively. The instantaneous value of IVD is thus set in Equations (13) and (14) to be always below I V D M A X and above I V D s a f e t y over time. I V D M A X represents the maximum distance that the following vehicle can attain from the preceding vehicle. Here, the value of I V D M A X is made varying over time depending on the current road type. As a general consideration, the IVD might be limited in urban areas to ease traffic flow and to reduce general road occupancy. This correlates well with reduced values of vehicle speed generally associated with urban driving. Contrarily, enhanced road surface availability and generally higher values of vehicle speed might lead to allow a higher value of I V D M A X in extra-urban and highway driving conditions. In light of these considerations, when extra-urban and highway driving conditions are encountered, the maximum achievable value of IVD is assumed here to be 300 m. This hypothesis stems from the current approximate range of V2V communication, which might contribute to long-distance preceding-vehicle detection [44]. On the other hand, the allowed value of I V D M A X is assumed to be reduced to 100 m in urban driving conditions to limit road occupancy.
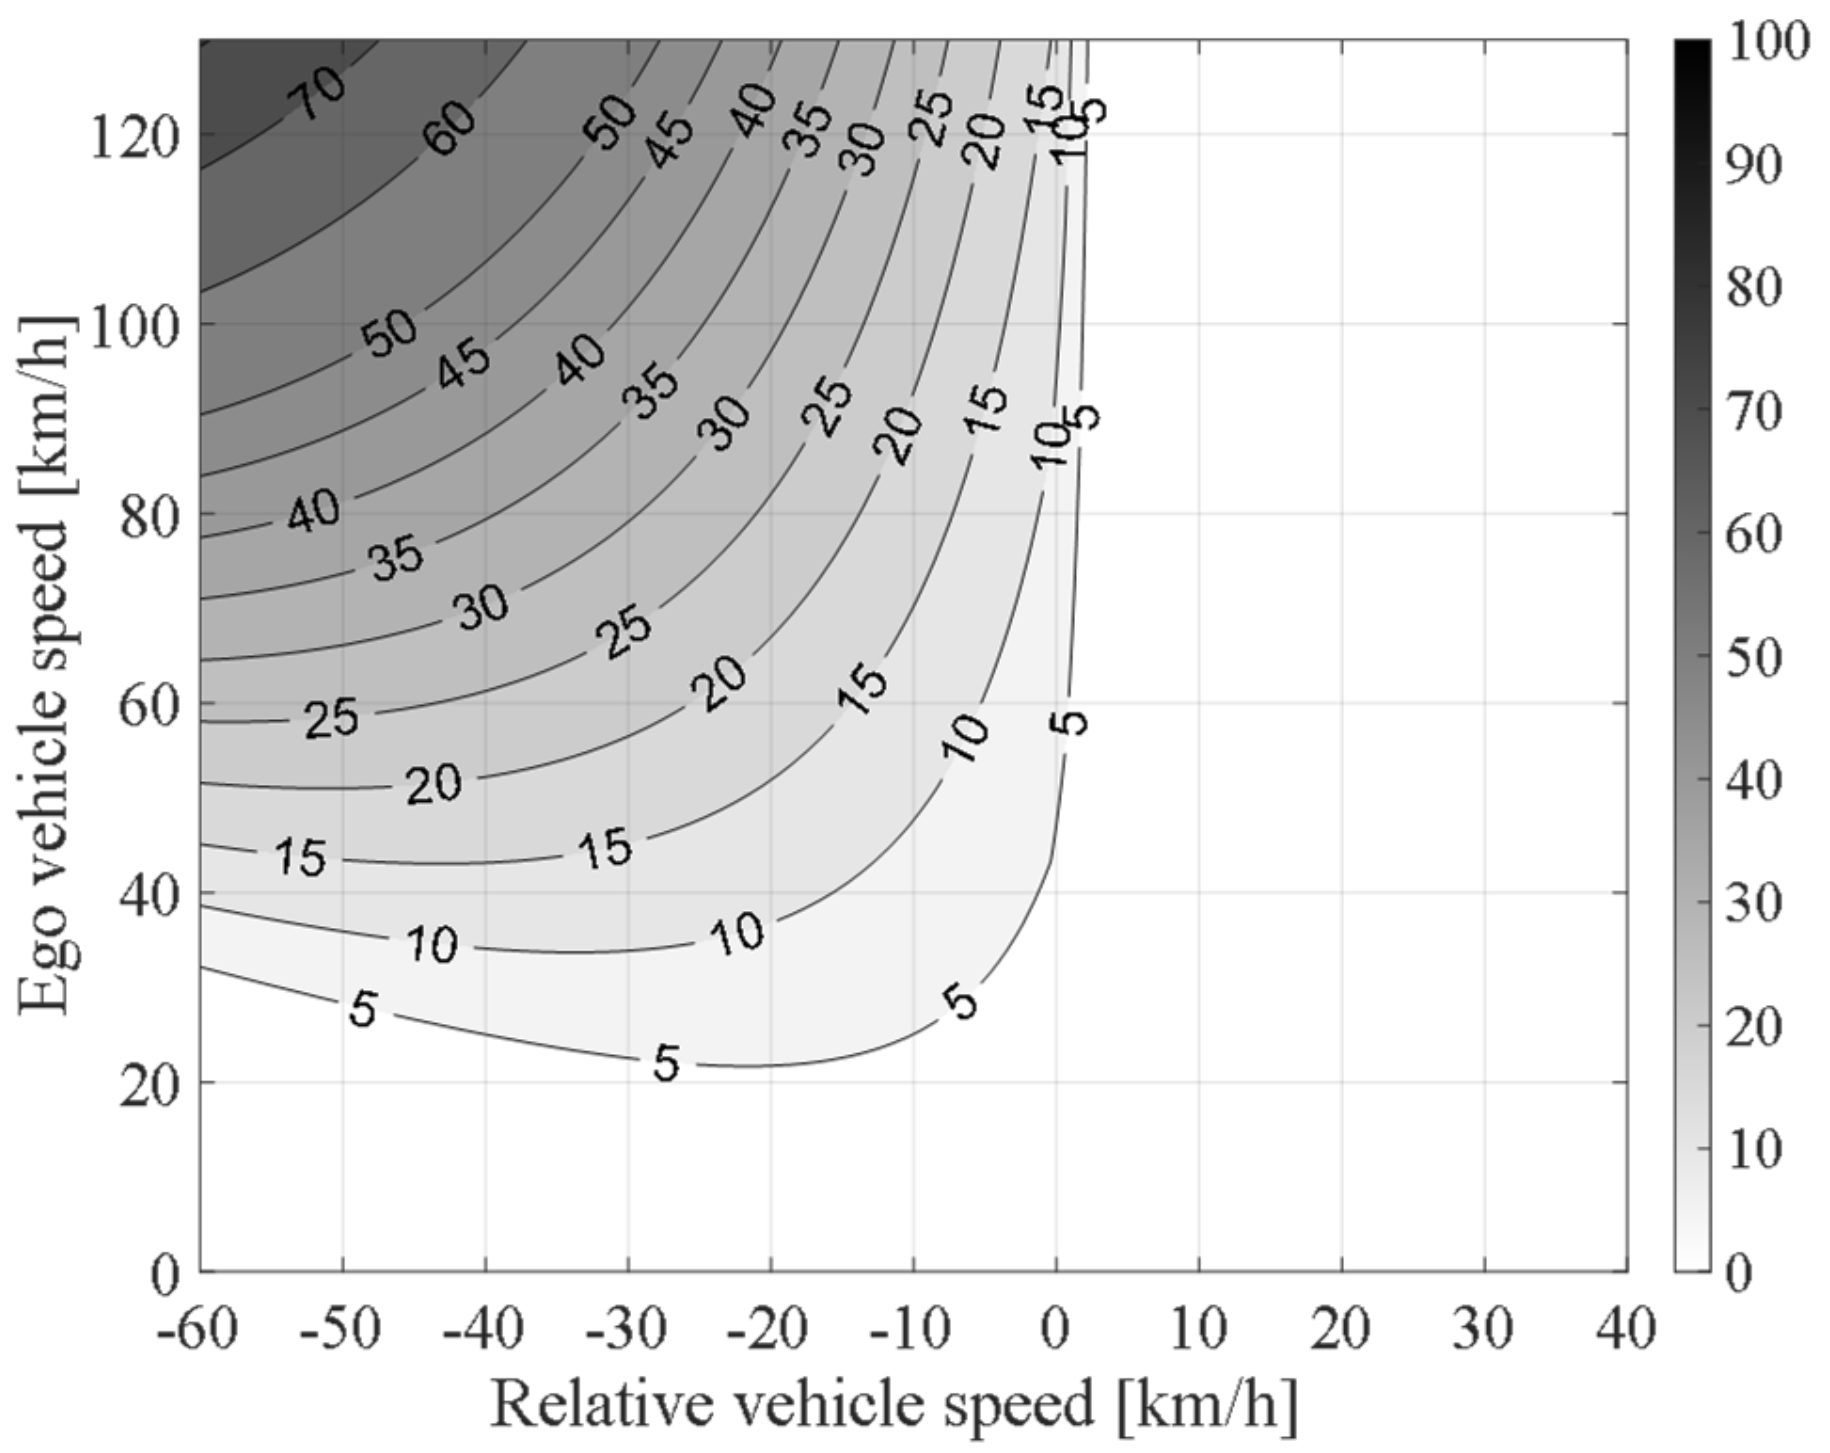
In Equation (14), I V D s a f e t y stands for the minimum safety IVD. Its value is obtained by interpolating in a two-dimensional lookup table with the following vehicle’s speed and relative vehicle speed between the preceding vehicle and the following vehicle as independent variables. The lookup table is shown in Figure 4, and it is derived from a time-headway numerical braking model proposed in [45]. The interested reader can consult [23] for further information regarding this procedure.

3.2. Constraints on the Following Vehicle Powertrain

The following vehicle’s powertrain constraints are considered in the optimal car-following driving problem illustrated in Equations (15) and (16). These allow identifying energy-saving oriented x ¨ f o l l o w control solutions that are tailored according to the given powertrain layout and control logic for the following vehicle. First, the instantaneous following vehicle’s tractive power P t r a c t i o n f o l l o w , expressed in watts, is evaluated as a function of fuel and electrical energy consumption. In Equation (15), m ˙ f u e l and m f u e l c r a n k represent the instantaneous fuel rate (as obtained by interpolating in the empirical lookup table as a function of ICE speed and torque) and the mass of fuel needed to crank the ICE in grams, respectively. s t a r t I C E represents a binary variable detecting ICE activations over time, and its value is set to 1 in those time instants in which the sign of the fuel consumption is positive, while it was zero in the previous time instant. L H V f u e l is the lower heating value of the fuel and corresponds to 43,700 J/g here.
m ˙ f u e l and m f u e l c r a n k are considered only when the powertrain layout includes an ICE, i.e., for CVs and HEVs. On the other hand, the battery power term is retained only when a high-voltage battery is embedded in the powertrain layout, i.e., for HEVs and BEVs. In Equation (15), the battery power term includes the SOC rate S O C ˙ as given by Equation (6) and the term V O C · A h b a t t · 3600 that represents the battery energy in watt-seconds. The negative sign of the battery SOC variation relates to negative values of S O C ˙ corresponding to battery charge depletion. Especially for HEVs, this formulation for the first powertrain constraint allows obtaining the same unit of measure (i.e., watts) between the fuel chemical power term and the battery electrical power term. A proper balance between the usage of the two energy sources can be achieved in this way. At each time instant, both m ˙ f u e l , s t a r t I C E and S O C ˙ related to the following vehicle can be evaluated within the control optimization process according to numerical models of powertrain layout and related onboard control logic as it has been detailed in the previous section for each retained powertrain category. Tailoring the propelling energy consumption minimization according to the specific powertrain layout of the following vehicle can be achieved in this way.
The final powertrain constraint reported in Equation (16) involves limiting the tractive power of the following vehicle within the instantaneous maximum limit represented by P t r a c t i o n f o l l o w M A X . This term is given as a function of the instantaneous maximum tractive power of each power component embedded in the retained following vehicle’s powertrain layout, and it typically depends on the current value of the following vehicle’s speed x ˙ f o l l o w .

4. Solving the Optimal Car-Following Driving Problem

A flexible and effective approach is presented in this section for solving the multiobjective optimal car-following driving problem illustrated in the previous section. Here, the considered control problem is solved off-line, i.e., exploiting the knowledge of the speed profile over time for the entire drive cycle of the preceding vehicle a priori. Dynamic programming (DP) is considered in this framework as a widely known optimization algorithm capable of returning the optimal global solution for the control problem under analysis [46,47,48,49,50]. The operating principle of DP involves exhaustively sweeping discretized values of control variables and state variables at each time instant of the retained control problem. Thus, the optimal sequence of control actions is identified by minimizing the overall value of a predefined cost function [51,52,53]. To find the global optimal control trajectory, the DP workflow is iterated at each time instant backwardly in the retained drive cycle from t e n d to t 0 . The DP adaption presented by Sundstrom and Guzzella [54] is retained here as a control workflow for all the considered powertrains. The state-space X and the control space U considered here are reported in Equation (17), and they relate to the DP algorithm implemented to solve the optimal car-following driving problem illustrated in Equation (12) [23].
X = x p r e c x f o l l o w x ˙ f o l l o w   ,   U = x ¨ f o l l o w
The state-space includes the IVD and the following vehicle’s speed x ˙ f o l l o w . The IVD is particularly considered to ensure compliance over time with the corresponding optimization constraints reported in Equations (13) and (14). The following vehicle’s longitudinal speed is retained to evaluate its trajectory over time by integrating the following vehicle’s longitudinal acceleration, representing the only control variable included in U.
In the follow-up of this section, the workflow for assessing the capability of the introduced DP as ACC algorithm for car-following scenarios is discussed for all the four vehicle powertrain architectures illustrated in Section 2. As introduced earlier, energy-saving and passenger comfort improvement compared with the preceding vehicle are retained as evaluation metrics for the following vehicle’s performance. Passenger comfort is particularly measured here in terms of the root-mean-square (RMS) of the longitudinal vehicle acceleration throughout the given driving mission. The value of RMS for vehicle acceleration indeed represents a common index for evaluating the quality of passengers’ ride perception [55,56].

4.1. CV Powertrain

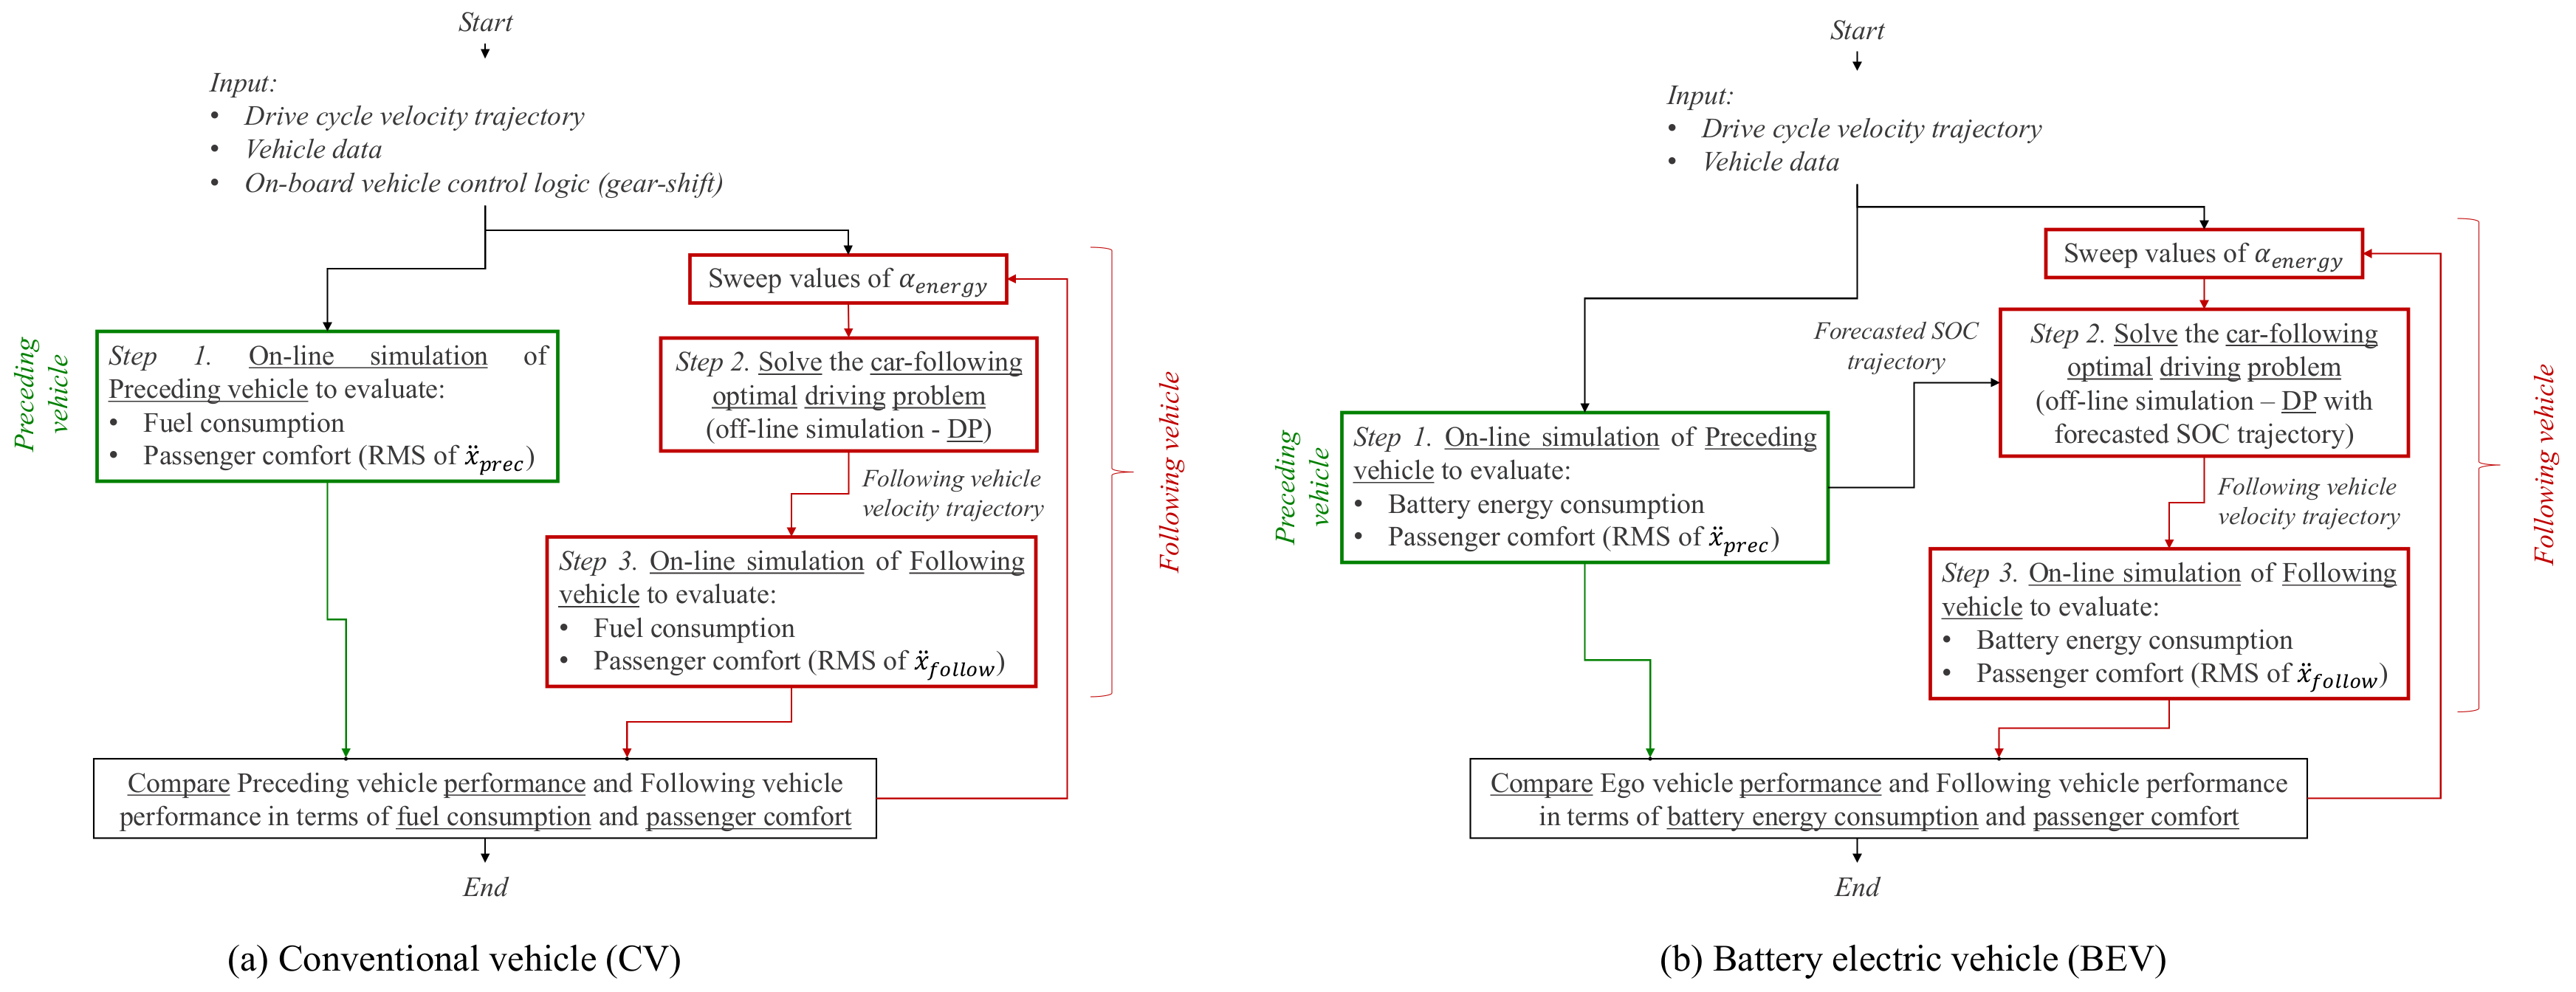
The flowchart for validating the proposed ACC algorithm for the CV powertrain is illustrated in Figure 5a, together with the corresponding flowchart considering the BEV powertrain in Figure 5b. Once the vehicle data, control logic and the drive cycle under analysis are defined, an online simulation is performed first for the preceding vehicle, following the exact speed profile over time for the given input cycle. Focusing on the CV flowchart reported in Figure 5a, the gear engaged is determined at each time instant according to the considered shift logic, while the fuel consumption can be computed according to values for speed and torque of the ICE following Equations (1)–(3). Then, the following vehicle’s case is retained while sweeping different values of α e n e r g y ranging from 0 to 1. The following vehicle’s longitudinal velocity is planned off-line following the illustrated DP approach and integrating the controlled value of longitudinal acceleration x ¨ f o l l o w over time. An online simulation is subsequently performed to double-check the fuel consumption and the passenger comfort resulting from the following vehicle’s driving solution obtained from DP. Evaluating the multiobjective optimal Pareto front when minimizing both the fuel consumption and the RMS of the vehicle acceleration for the following vehicle is allowed in this way. Moreover, the performance of the preceding vehicle that follows the drive cycle speed profile under analysis can be benchmarked with the correspondingly obtained following-vehicle control solutions.

4.2. BEV Powertrain

As regards the BEV powertrain, it should be noted that the SOC variation modeled as in Equation (6) and embedded in the car-following optimal driving problem illustrated in Equation (12) depends on the current value of SOC. Accounting for the current value of SOC over time when solving the optimal car-following driving problem with DP would, in turn, require an additional state variable. Nevertheless, DP is notably affected by the curse of dimensionality depending on the size of both control and state sets. In this framework, not only is the DP typically associated with a remarkable computational cost but this latter has been demonstrated exponentially increasing as a function of the number of control variables and state variables considered [32]. To avoid this drawback, an alternative approach is proposed here. Once the preceding vehicle has been simulated online in the retained drive cycle, the obtained SOC trajectory over time is used as information when running the DP for the following vehicle’s velocity planning in Figure 5b. Assuming an equal SOC value for both the preceding vehicle and following vehicle at the beginning of the drive cycle, this approach provides to the DP an estimation of the punctual SOC value for the following BEV at each time instant. The forecasted SOC value is used in turn to evaluate the SOC variation of the following vehicle as a function of its controlled acceleration. It is true that at each time instant, the following vehicle’s SOC may be slightly higher than the corresponding preceding vehicle’s SOC as a result of the energy savings achieved thanks to the optimal velocity planner. However, this small difference between SOC values is usually observed having little impact on the final solution of the optimization process. To answer this concern anyway, step 3 of the discussed validation methodology in Figure 5b involves performing an online simulation of the following BEV operation the following the longitudinal velocity planned earlier by DP. Evaluating the exact SOC variation over time for the following vehicle’s performance of the given drive cycle in a car-following scenario is achieved in this way. Results obtained for the following vehicle by varying α e n e r g y can be benchmarked with the corresponding the preceding vehicle’s performance for the BEV layout as well.

4.3. P2 HEV and PS HEV Powertrains

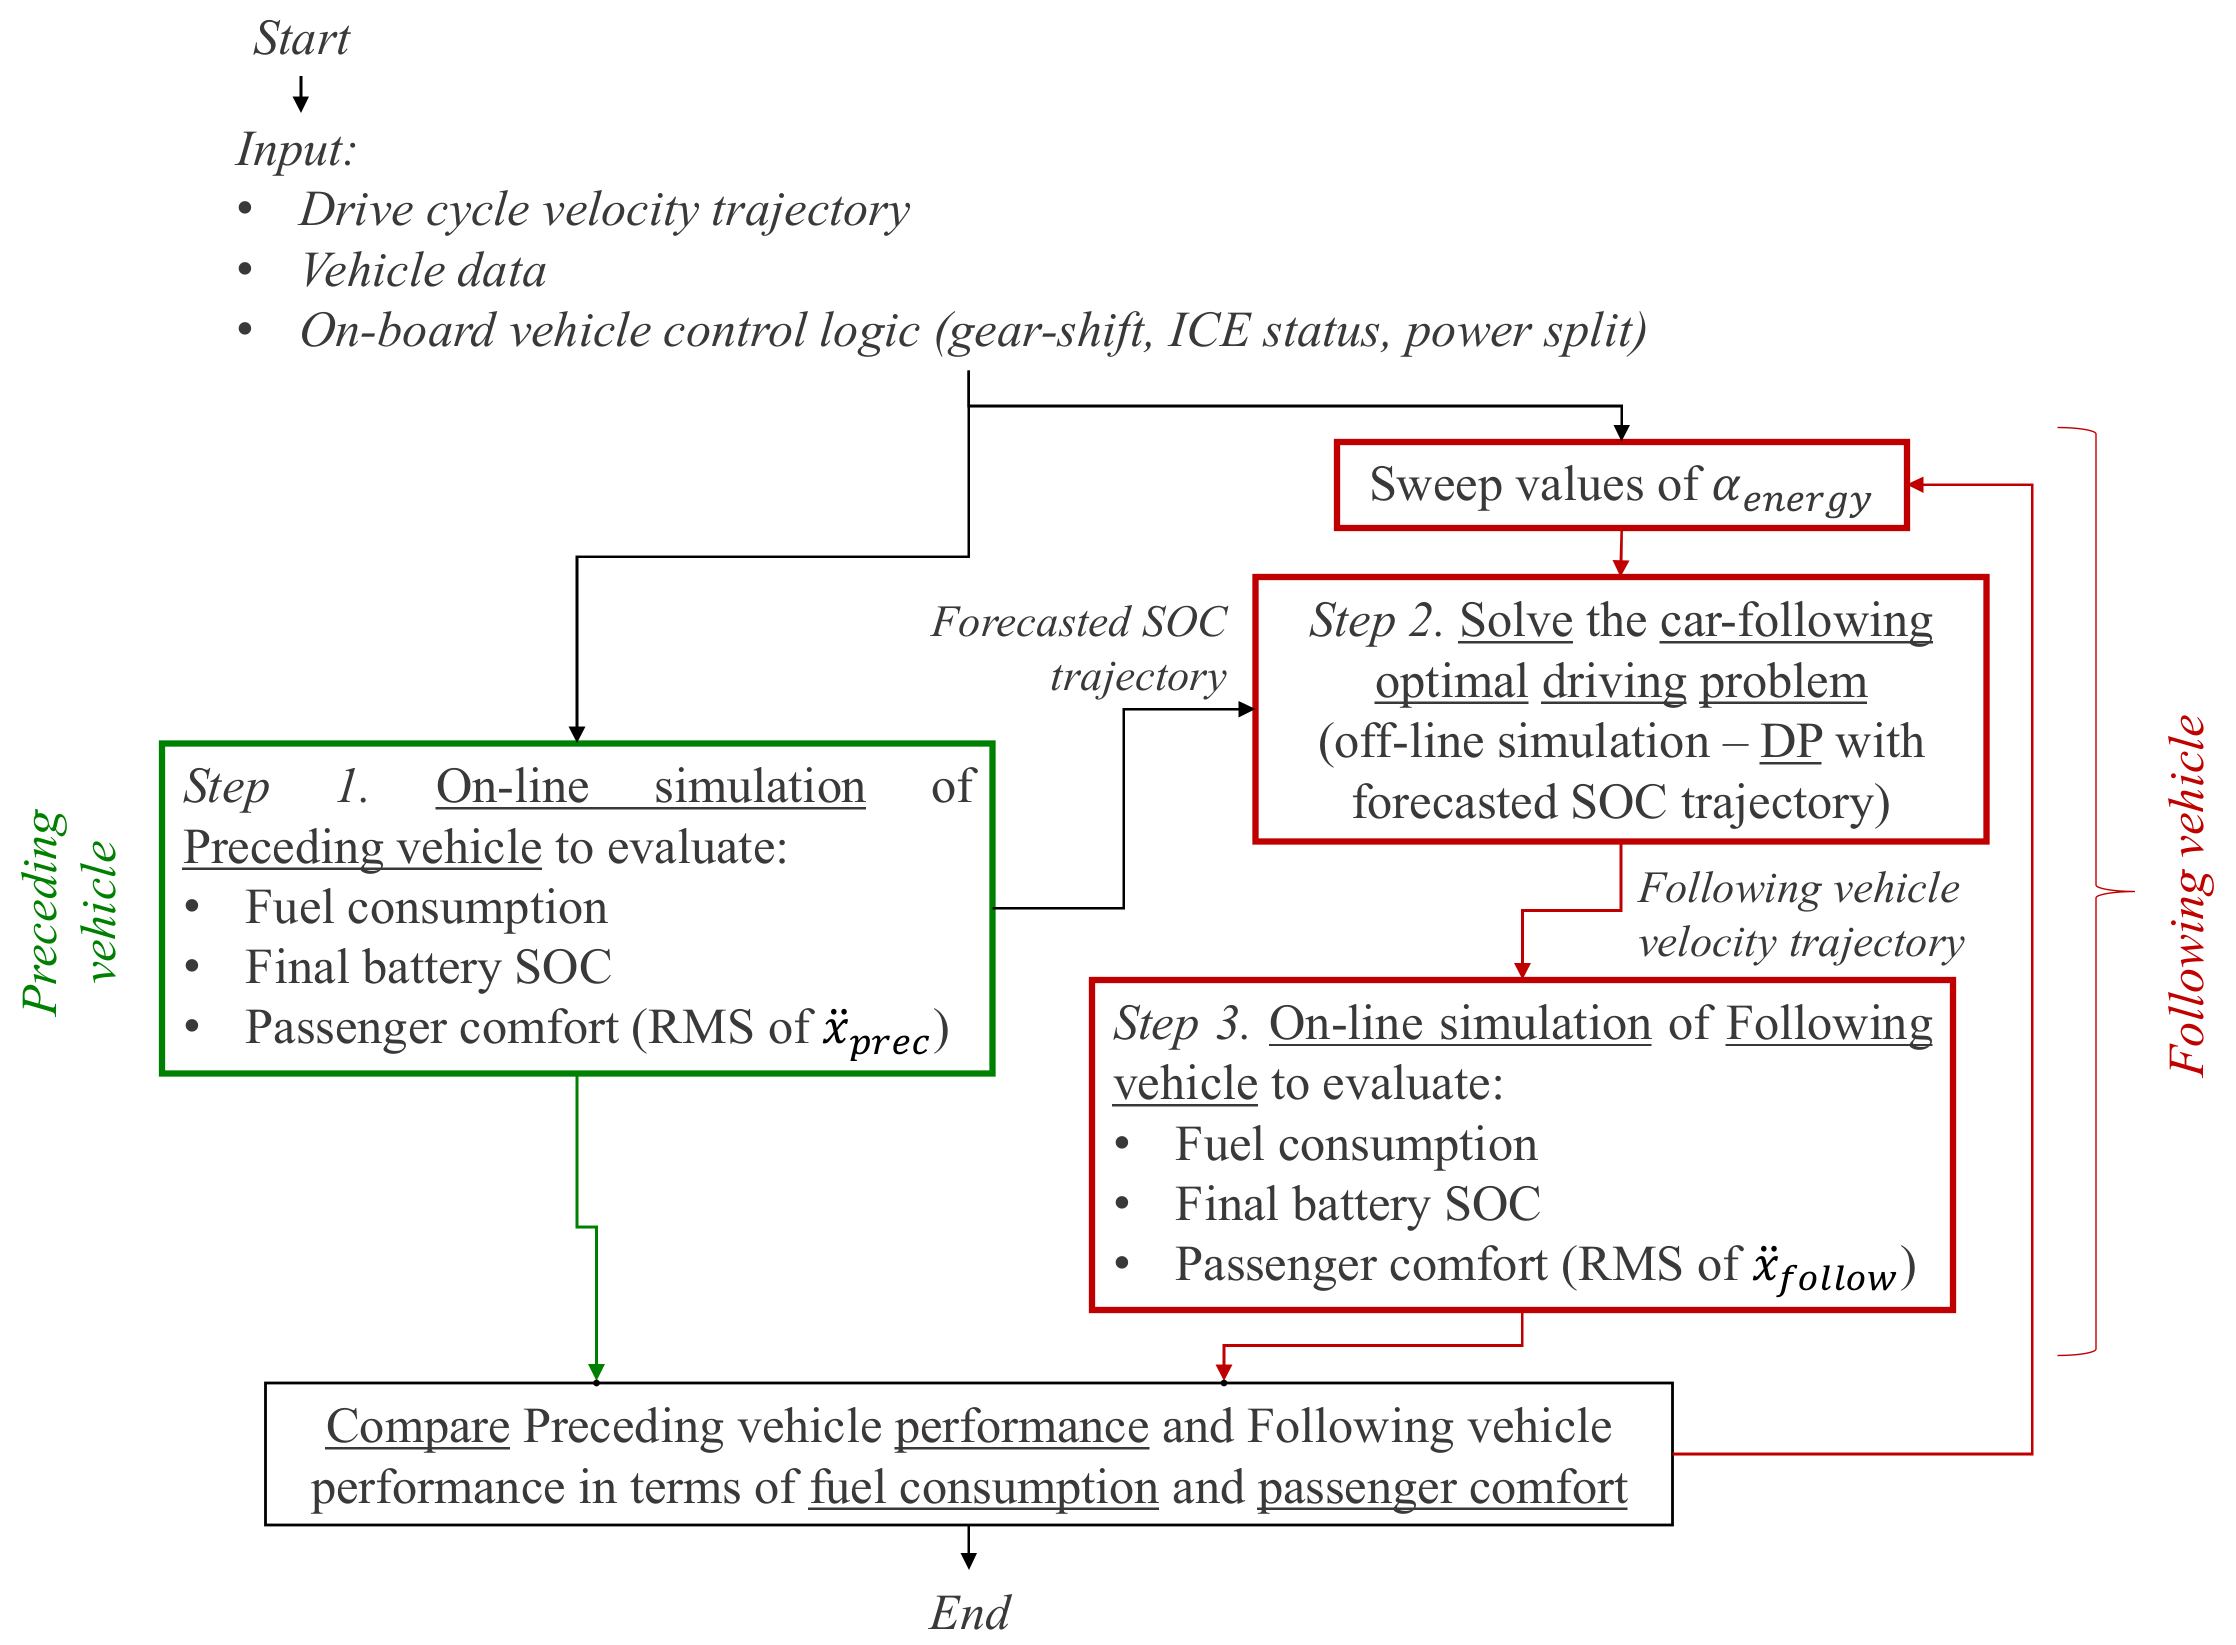
The flowchart of the validation methodology for the proposed ACC optimization-driven approach is illustrated in Figure 6 for the P2 HEV and the PS HEV powertrains. The first step aims at assessing the operation of the preceding vehicle in the retained drive cycle using an online simulation, which accounts for the HEV onboard control logic. For the P2 HEV, control variables at each time step include the gear engaged and the torque split between ICE and EM. On the other hand, ICE speed and ICE torque represent the variables to be controlled at each time instant for the PS HEV. In both cases, the fuel consumption and the battery SOC trajectory can be evaluated, and this latter is used as input to the following vehicle’s DP-based velocity planner for estimating the punctual SOC value at each time instant of the optimization process as it was described above for the BEV powertrain. In this case, the estimated value of SOC allows not only calculating the SOC variation, but it also impacts at each time instant on the HEV control logic influencing the power split between ICE and EMs as it has been described in Section 2.3 and Section 2.4. DP is subsequently executed in the second step of Figure 6 to identify the optimal control pattern according to the drive cycle, the HEV powertrain, the related control logic and the weighted objective function under analysis. The third step then aims at online simulating the following vehicle’s operation according to the longitudinal velocity profile over time identified at the previous step. Furthermore, the flowchart illustrated in Figure 6 can be repeated several times by varying the value of α e n e r g y and benchmarking obtained results with the corresponding the preceding vehicle’s performance.

5. Results

This section aims at presenting obtained results for the proposed optimization-driven ACC approach. The performance of the implemented algorithm is particularly evaluated for all the retained powertrain categories in a different drive cycle, such as the urban dynamometer driving schedule (UDDS), the worldwide harmonized light vehicle test procedure (WLTP), the highway federal test procedure (HWFET) and the US06 supplemental procedure (US06). Energy savings and comfort improvement are quantified for the ACC-enabled following vehicle by benchmarking with the performance of the preceding vehicle that embeds the same powertrain. The preceding vehicle reproduces the vehicle speed profile provided over time for the given driving mission, while the following vehicle reproduces the longitudinal speed profile provided off-line using DP and solving the car-following optimal driving problem illustrated in Section 3.
Table 2 reports the vehicle and powertrain data considered in all performed simulations and related to each retained powertrain category. The vehicle body is the same for all cases, and it was retained from [57]. The same ICE is embedded in CV, P2 HEV and PS HEV powertrain layouts, and it refers to a 1.2-L spark-ignition engine. ICE data, including an efficiency map, were generated according to the methodology implemented in Amesim® software (version 2020.1, Siemens PLM, Camberley, UK) and discussed in [58]. A 6-gear AMT layout is considered for the CV, and the P2 HEV, with corresponding gear-shift logic, developed the following approach illustrated in [33]. Efficiency maps and operational data of interior permanent magnet synchronous machines were generated for the EMs according to the corresponding methodology implemented in Amesim® software and described in [59]. Battery SOC dependent parameters (i.e., voltage and resistance) related to 42 kWh and 2 kWh high-voltage battery packs were derived for the BEV and the HEV layouts, respectively. To this end, the electrical storage system sizing tool implemented in Amesim® described in [60] was used. The HEV control logics were developed taking inspiration from [38], and they were tuned following a trial-and-error procedure to achieve charge-sustained operation while reducing fuel consumption. Finally, a constant auxiliary loss power of 500 W is considered for BEV, P2 HEV and PS HEV powertrains.
The effectiveness of the proposed optimization-driven ACC approach for the following vehicle is assessed here by performing several simulations of the following methodologies illustrated in Figure 5 and Figure 6. Each described powertrain category was simulated in all the considered drive cycles. In this case, six values are retained for α e n e r g y in each performed evaluation corresponding to (0.01 0.2 0.4 0.6 0.8 0.99) to assess a wide range of optimization targets obtained as a combination of energy minimization objective and comfort improvement objective. The simulation time step is set to 1 s. The initial IVD between the preceding vehicle and the following vehicle is set to be 50 m, and the final value is constrained to be below 50 m to ensure that the two vehicles travel the same mileage. The initial battery SOC is assumed to be 95% and 70% for the BEV powertrain and the two HEV powertrains, respectively.
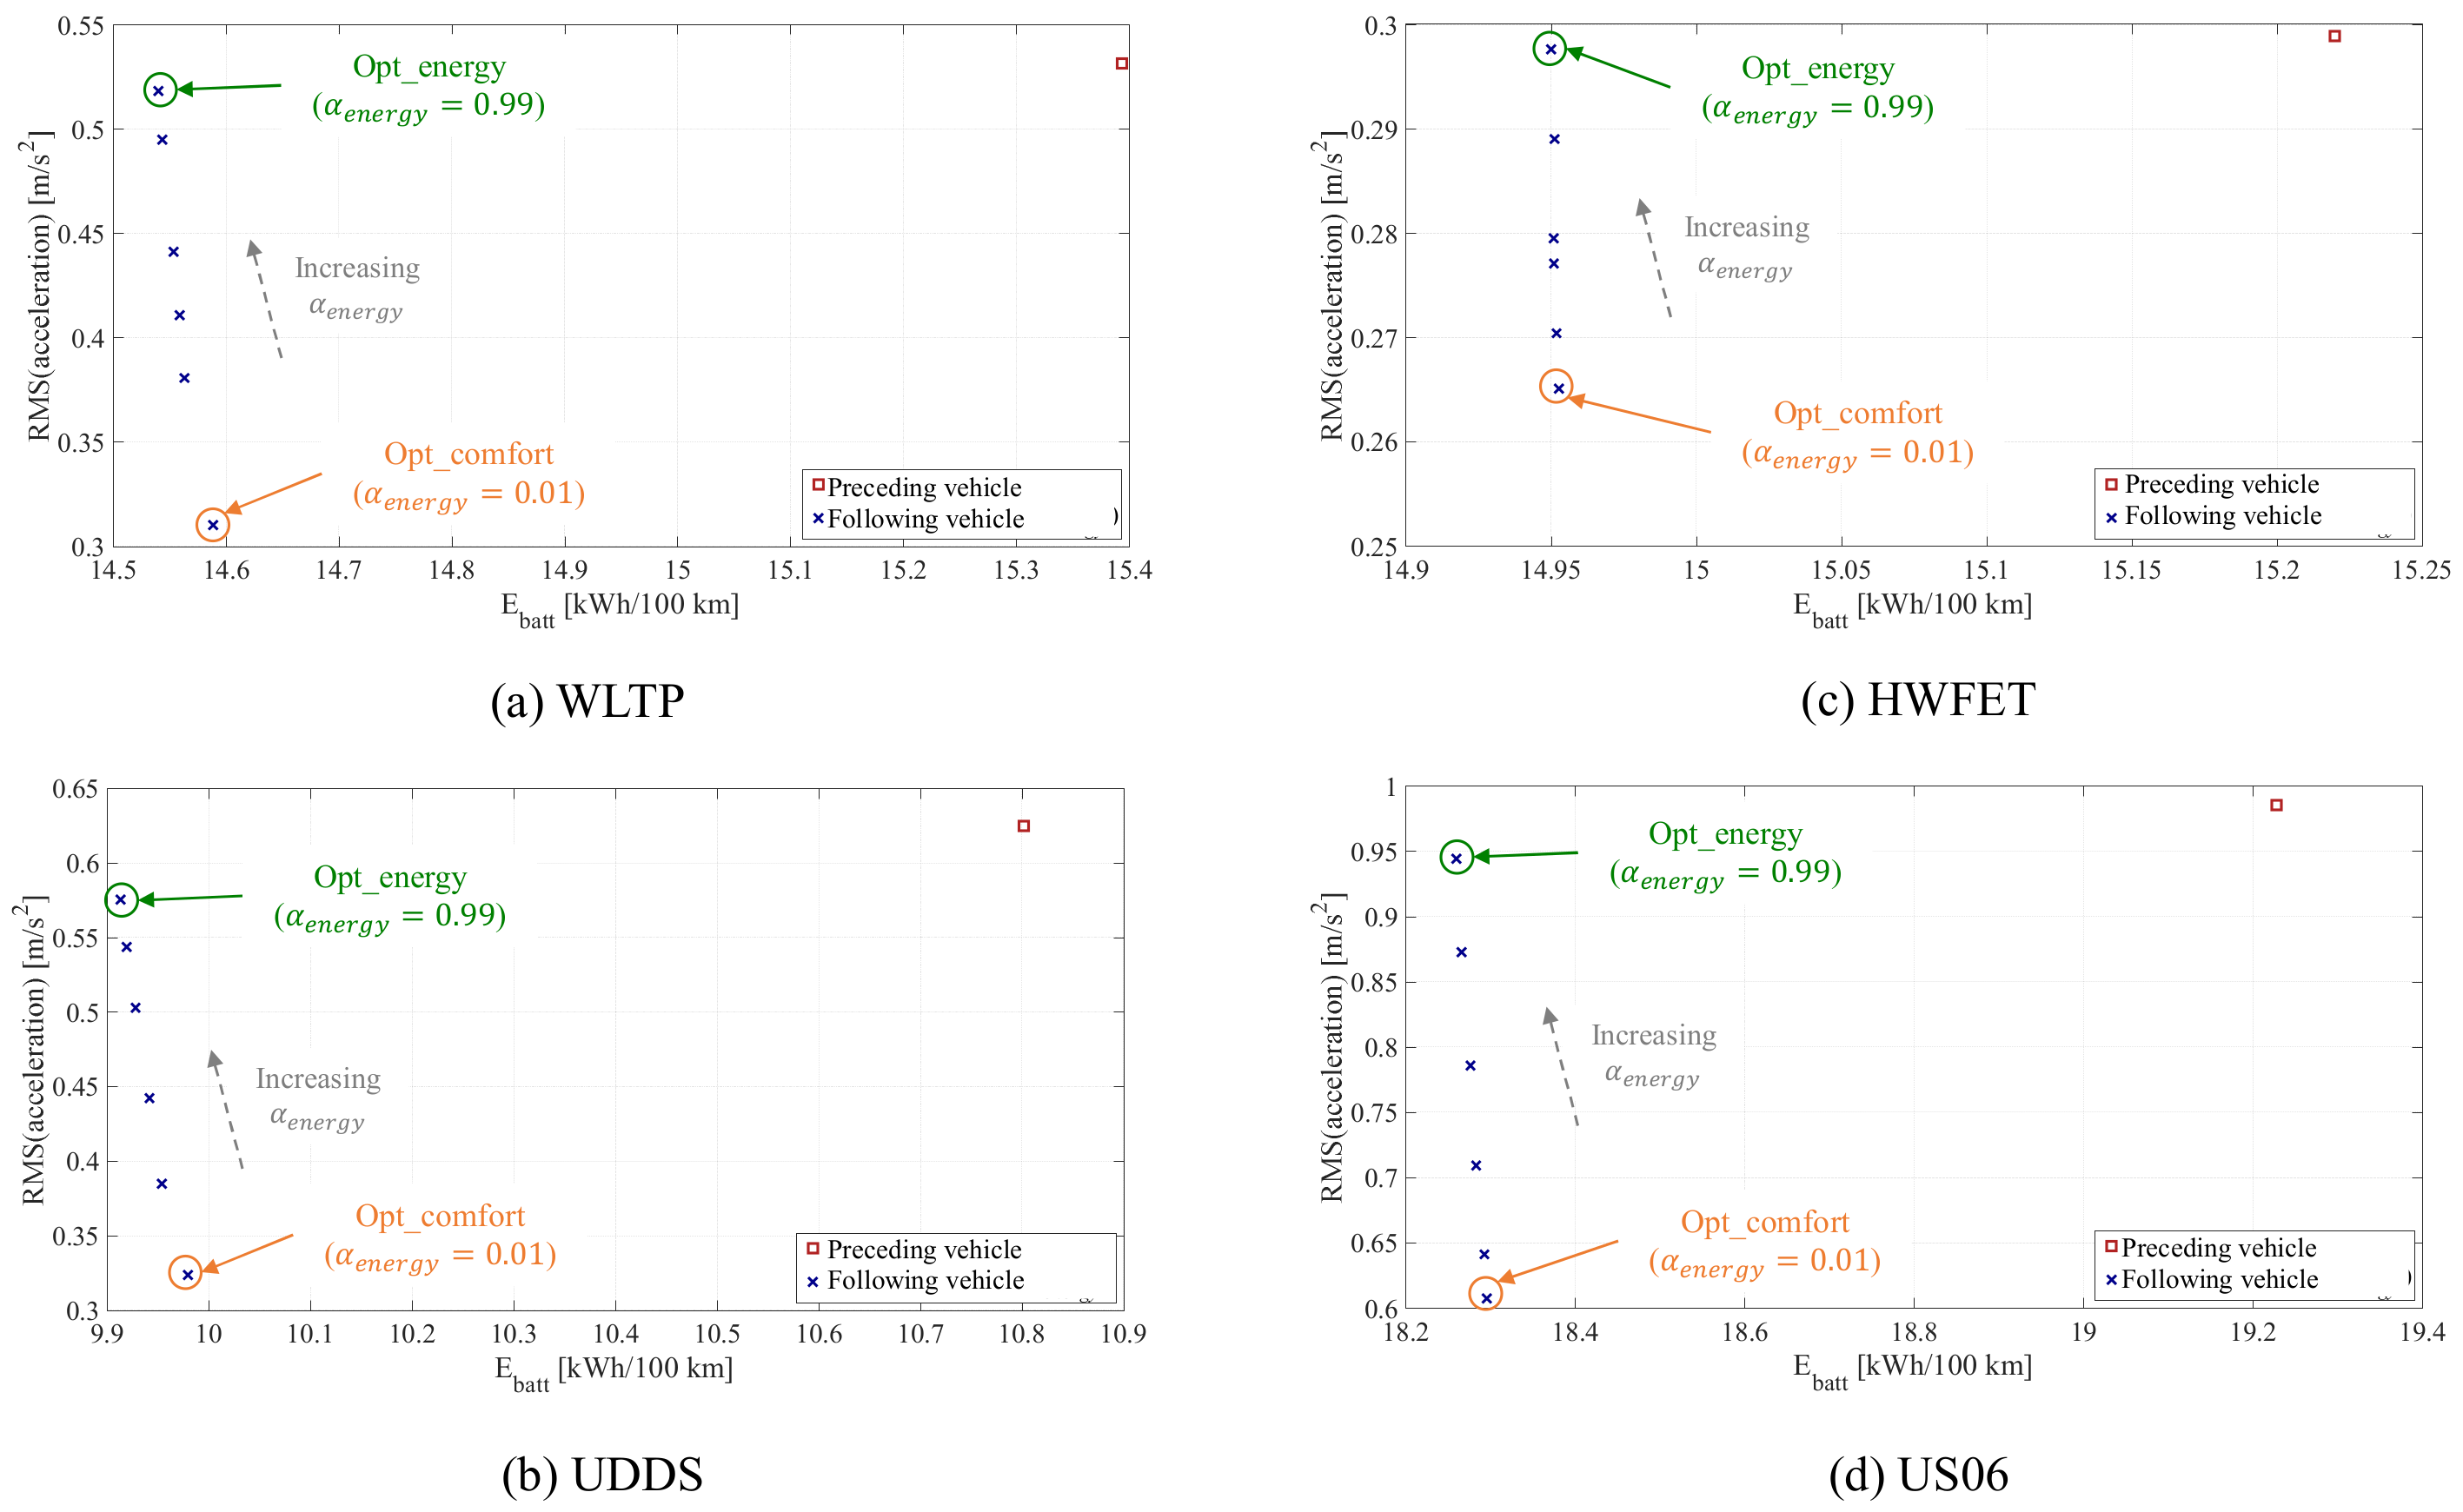
The Pareto fronts for the obtained results in terms of energy consumption and RMS of the vehicle acceleration are shown in Appendix A from Figure A1, Figure A2, Figure A3 and Figure A4 for each retained powertrain category in all the considered drive cycles. Both preceding vehicle and following vehicle’s simulation cases are illustrated. Particularly for the following vehicle, different control solutions are obtained by sweeping various values of α e n e r g y , i.e., the weighting coefficient between energy economy target and passenger comfort target. The fuel consumption and the battery energy consumption are reported as energy economy metrics in the x-axis for the CV and the BEV powertrain layouts, respectively. On the other hand, to achieve a fair comparison for the HEV powertrains, the amount of fuel needed to recharge the battery up to the initial SOC value (70% in this case) needs to be calculated and added to the previously calculated fuel consumption. A method to evaluate this additional fuel consumption was retained from literature and applied to the specific HEV architectures under analysis [61]. A parameter named equivalent fuel consumption (EFC) can be obtained in this way that accounts for both the fuel consumed by the ICE throughout the simulation of the considered drive cycle and for the amount of fuel representative of the net battery SOC increase or decrease throughout the simulated drive cycle. The EFC is thus used as an evaluation metric for the HEV energy economy assessed in the x-axis of the Pareto fronts reported in Figure A3 and Figure A4. On the other hand, the RMS of the following vehicle’s acceleration is reported in the y-axis of all Pareto fronts displayed from Figure A1, Figure A2, Figure A3 and Figure A4 as an indicator of the level of passenger comfort. In general, both lower values for both propelling energy consumption and RMS of the vehicle acceleration can be obtained for the following vehicle compared with the preceding vehicle in all Pareto fronts displayed in Figure A1, Figure A2, Figure A3 and Figure A4. The capability of the proposed optimization-driven ACC approach to effectively improve the following vehicle’s performance both in terms of energy consumption and passenger comfort may be suggested in this way.
For each evaluation case, corresponding to a given powertrain architecture and a predefined drive cycle, two suboptimal control solutions for the following vehicle were identified corresponding to energy-saving maximization (i.e., “Opt_energy”) and passenger comfort improvement maximization (i.e., “Opt_comfort”). “Opt_energy” and “Opt_comfort” control solutions for the following vehicle relate to maximum and minimum set values for α e n e r g y , i.e., 0.99 and 0.01, respectively. The Pareto fronts for the following-vehicle control solutions embedding the CV powertrain layout displayed in Figure A1 are characterized by a regular trend for all the four drive cycles under consideration. In particular, progressive reduction in fuel consumption can be achieved at the expense of increasing the RMS of the vehicle acceleration when gradually increasing the value of α e n e r g y . Similar behavior can be observed for the BEV layout and the P2 HEV layout in Figure A2 and Figure A3, respectively, even with different slopes for the Pareto fronts. For example, a Pareto front characterized by large steepness can be observed for the BEV layout in HWFET in Figure A2c, suggesting that only marginal improvement can be obtained in the overall battery energy consumption by increasing α e n e r g y for the retained highway driving conditions. As concerns passenger comfort, larger improvement can be achieved within the following-vehicle control solutions of the BEV layout in HWFET. This relates to the corresponding RMS of the following vehicle’s acceleration decreasing from 0.30 m/s2 to 0.27 m/s2 when decreasing the value of α e n e r g y . On the other hand, the Pareto front for the P2 HEV layout in UDDS shown in Figure A3b characterizes for its reduced steepness. In this case, a larger variation in EFC can be observed when varying the value of α e n e r g y among the following-vehicle control solutions, while narrower variation is obtained in the RMS value of the following vehicle’s acceleration. As a result, urban driving conditions are found promising for potentially reducing the EFC of the retained P2 HEV layout, shifting from 4.59 L/100 km to 4.33 L/100 km as the value of α e n e r g y gradually increases. As regards the PS HEV layout, the corresponding Pareto fronts are shown in Figure A4 are characterized by a less conventional trend than the remaining three powertrain layouts. Indeed, only a few following-vehicle control solutions are located on the dual-objective optimal front for EFC and RMS of vehicle acceleration, while the remaining ones are located in non-optimal regions. This effect is particularly emphasized for WLTP, and US06 drive cycles in Figure A4a,d since the optimized Pareto front is represented by only “Opt_energy” and “Opt_comfort” control solutions. For both WLTP and US06, increasing the value of α e n e r g y from 0.01 to 0.8 for the PS HEV following-vehicle control appears to bring overall improvements both in terms of energy consumption and passenger comfort. As a consequence, the “Opt_energy” control solution in both Figure A4a,d corresponds to a value of 0.8 for α e n e r g y instead of 0.01 as for the remaining cases under analysis. A possible explanation for this behavior of the following-vehicle control performance for the retained PS HEV powertrain layout may relate to the proposed optimization-drive ACC approach being capable of further improving the passenger comfort as well when focusing on EFC improvement. The opposite behavior can be observed for UDDS and HWFET in Figure A4b,c, respectively, since the related “Opt_comfort” control solution corresponds to a value of 0.6 for α e n e r g y instead of 0.99 as for the remaining considered cases. For these drive cycles, further optimizing the following PS HEV control solution for EFC reduction may indeed bring to excessively irregular trends of following-vehicle velocity solutions, thus in turn involving increased values for the EFC.
Results displayed in Figure A1, Figure A2, Figure A3 and Figure A4 in Appendix A demonstrate how the proposed optimization-driven ACC approach preserves the engineer’s freedom when selecting the control solution being oriented either to energy-saving, comfort improvement or a blending of the two objectives. Energy consumption and the RMS of vehicle acceleration are reported in Table 3 for each suboptimal control solution identified (both “Opt_energy” and “Opt_comfort”), together with the corresponding percentage of improvement compared with the related preceding vehicle’s case. In general, obtained results suggest how enhancing energy-saving and improving passenger comfort can be achieved for the following vehicle in car-following automated driving conditions implementing the proposed control approach. Particularly, energy savings vary depending on the drive cycle and on the powertrain type from 1.8% to even 22.1% for the PS HEV in US06. On the other hand, the RMS of the vehicle acceleration can be reduced from 0.4% up to even 48.2% for the BEV powertrain in UDDS.
The energy-saving potential and the passenger comfort improvement potential, respectively related to “Opt_energy” and “Opt_comfort” control solutions, are highlighted in Figure 7 for each drive cycle and for each retained powertrain category. As shown in Figure 7a, the PS HEV powertrain is suggested to achieve the best energy-saving potential in most driving conditions. This relates to the effectiveness of the proposed optimization-driven ACC approach and in part to the considered PS HEV generally exhibiting a slightly larger EFC compared with both CV and P2 HEV, thus increasing the energy-saving potential achievable using the ACC technology. On the other hand, the BEV powertrain exhibits the lowest energy-saving capability in WLTP, HWFET and US06. As regards the remaining powertrain categories, Figure 7a suggests how their ranking in terms of energy-saving capability varies across different driving conditions, making it impractical to establish a general hierarchy for the retained powertrains. As a common trend, the energy-saving potential might be considerably reduced when only highway driving conditions are encountered, such as in HWFET. The reduced speed variation over time in highway driving conditions might reduce the energy-saving opportunity achievable by the optimization-driven ACC approach in this framework.
Focusing on the passenger comfort enhancement displayed in Figure 7b, urban driving conditions, such as in UDDS, are suggested to offer the highest potential for improvement by implementing the proposed optimization-driven ACC approach. This relates to urban driving generally distinguishing for frequent vehicle start–stop events and sudden acceleration and deceleration events. In this framework, it was possible to reduce the RMS of the vehicle acceleration from 38.7% for the P2 HEV to 48.2% for the BEV for the optimal control solution provided by DP. On the other hand, as has been observed for energy-saving, highway driving conditions are suggested to exhibit the lowest potential for comfort improvement. A clear trend cannot be observed for the rank of powertrain categories even considering passenger comfort improvement, thus opening up the need for a dedicated evaluation of each given case.
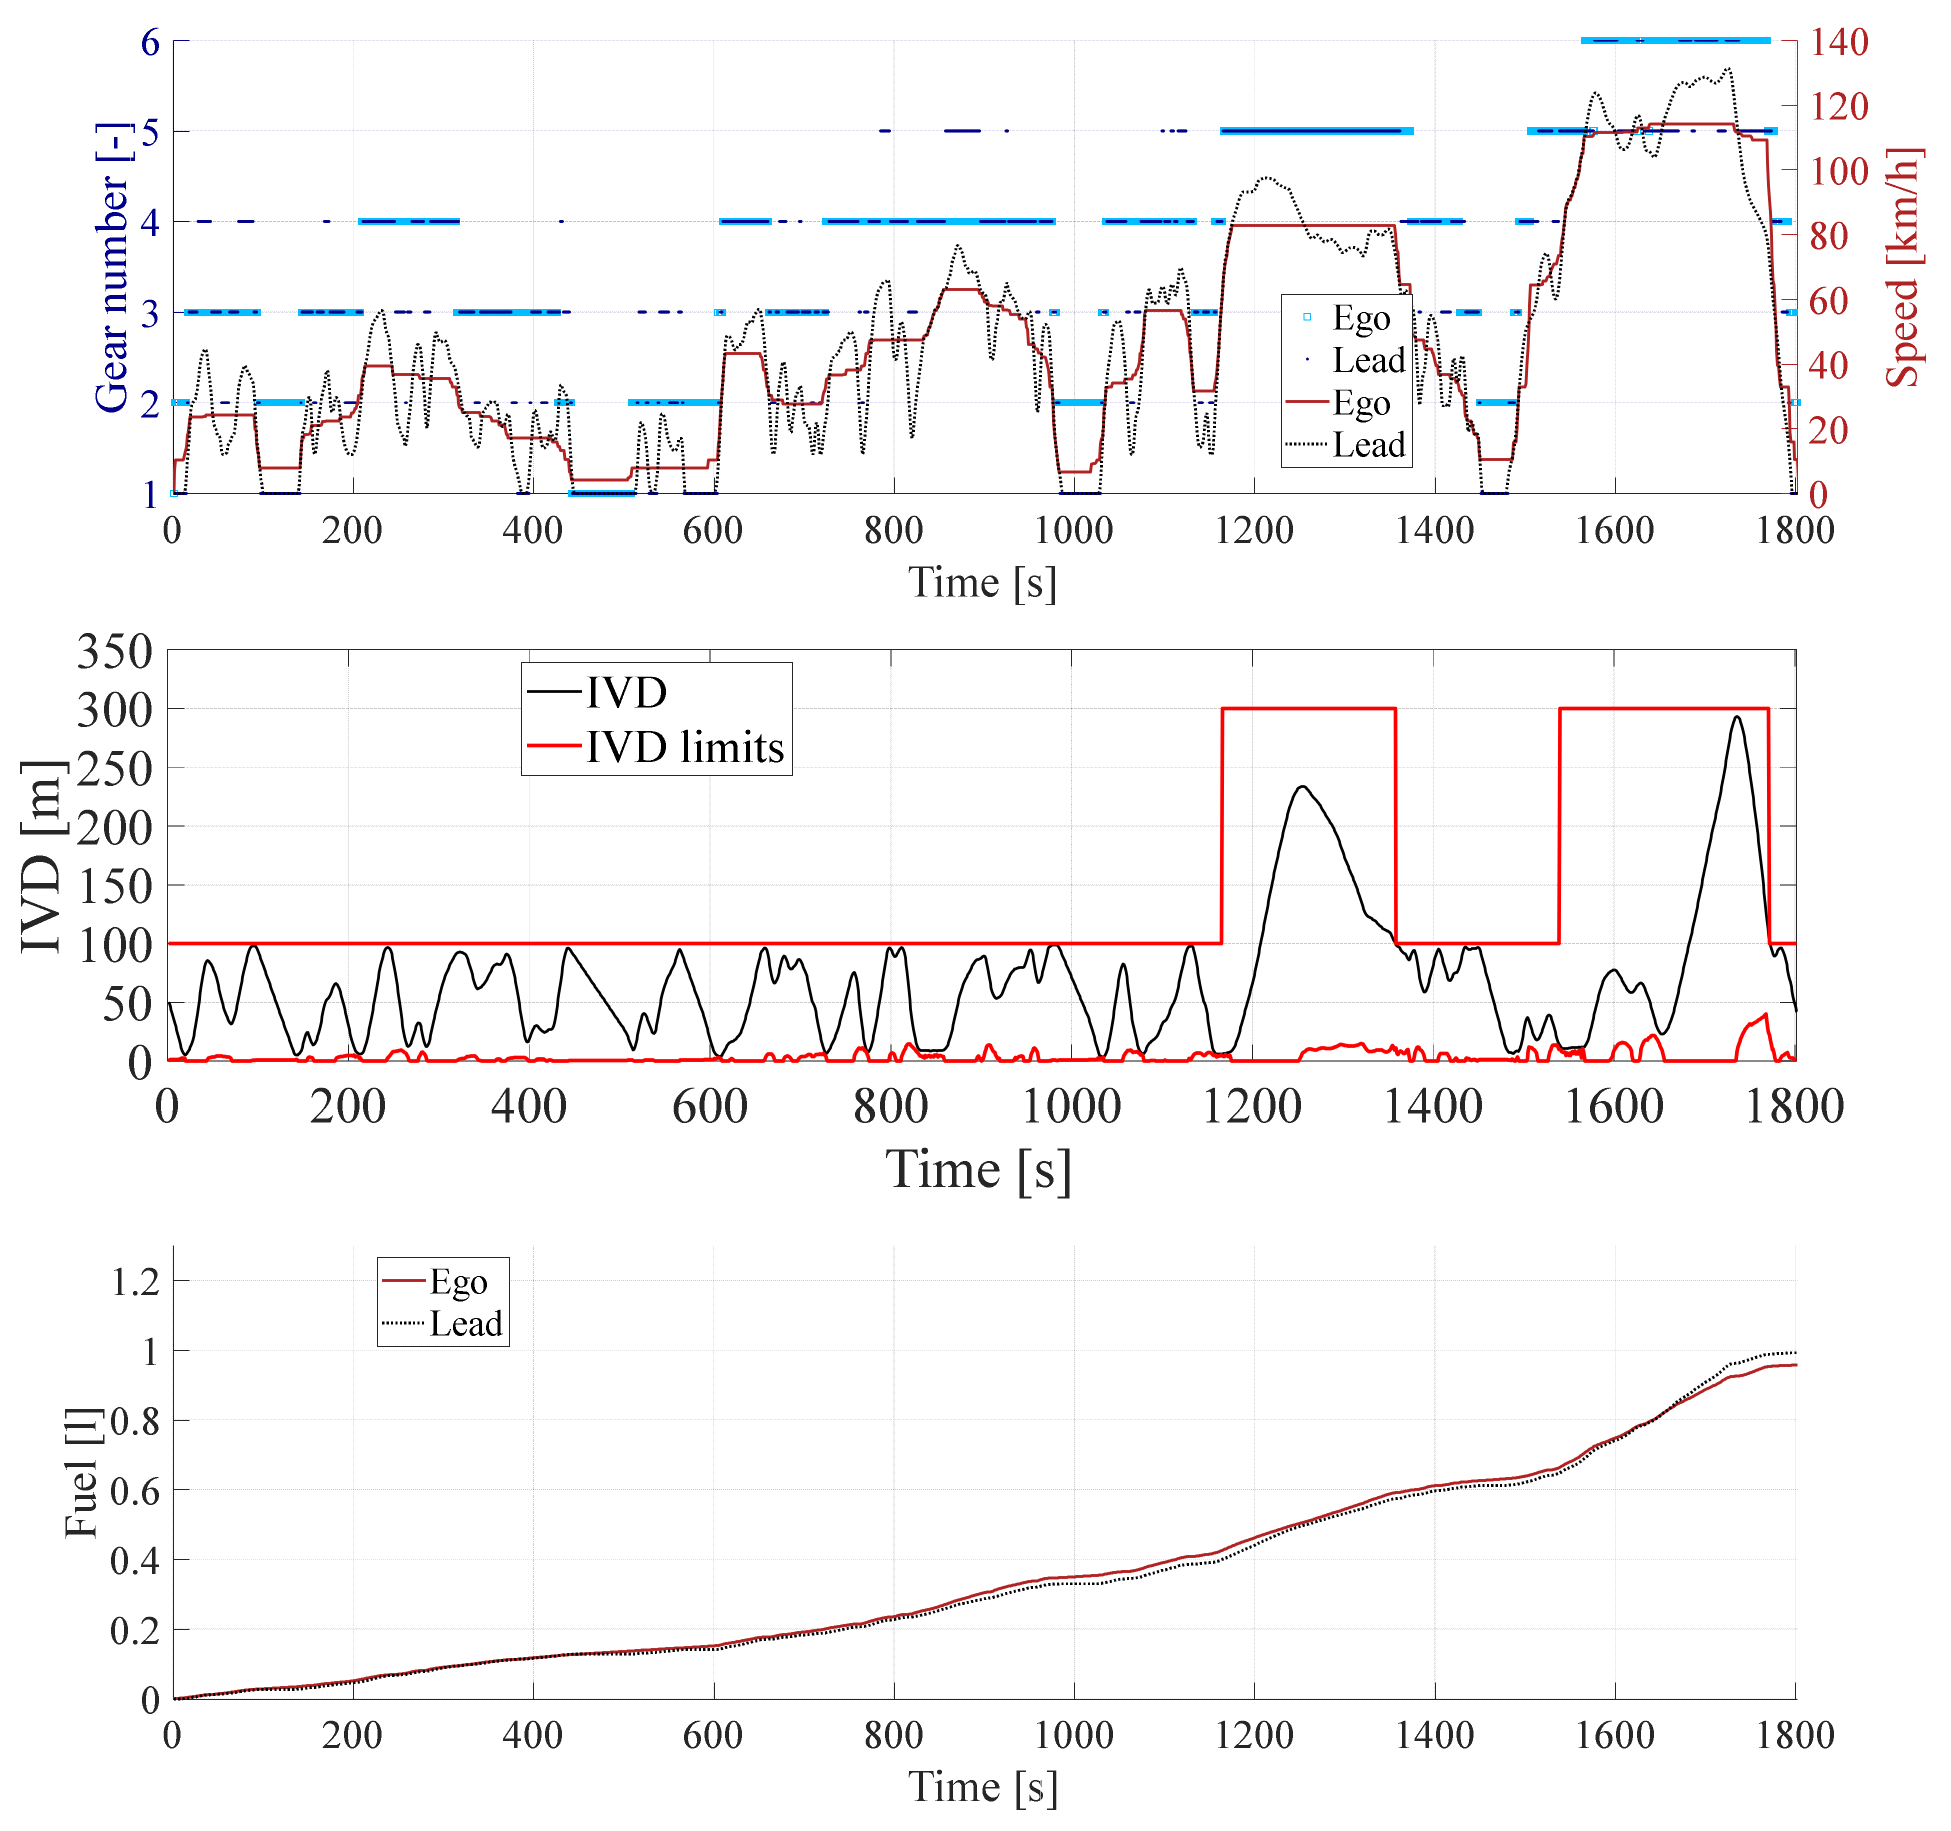
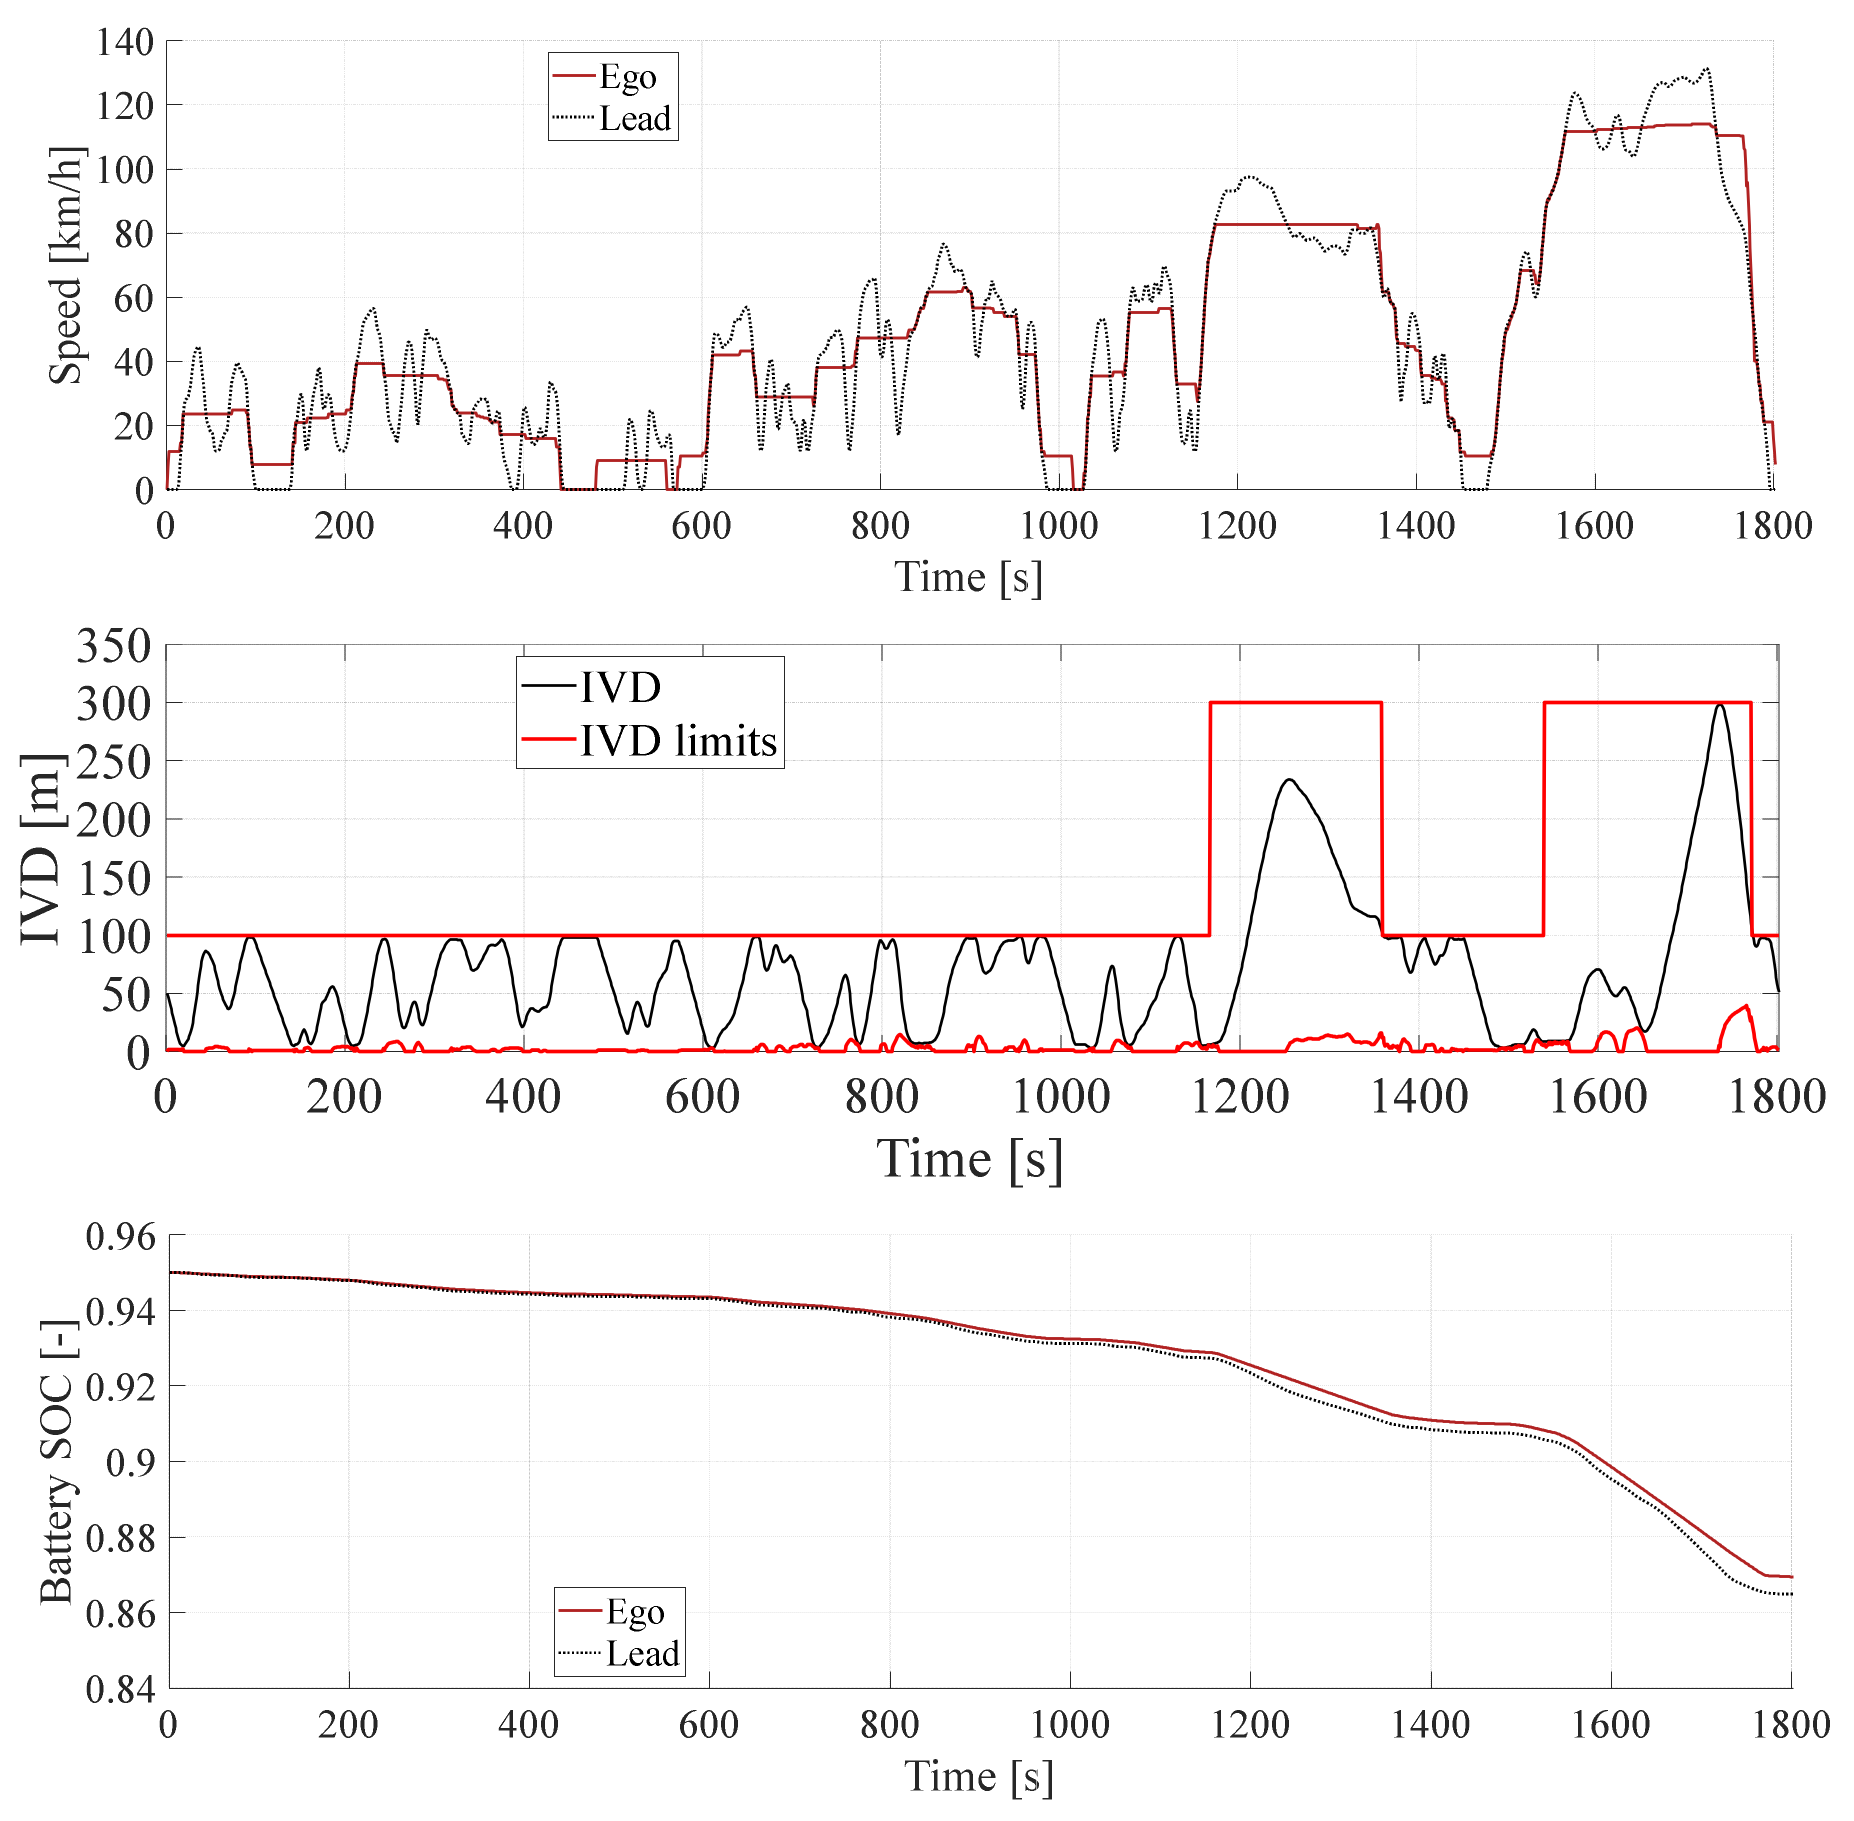
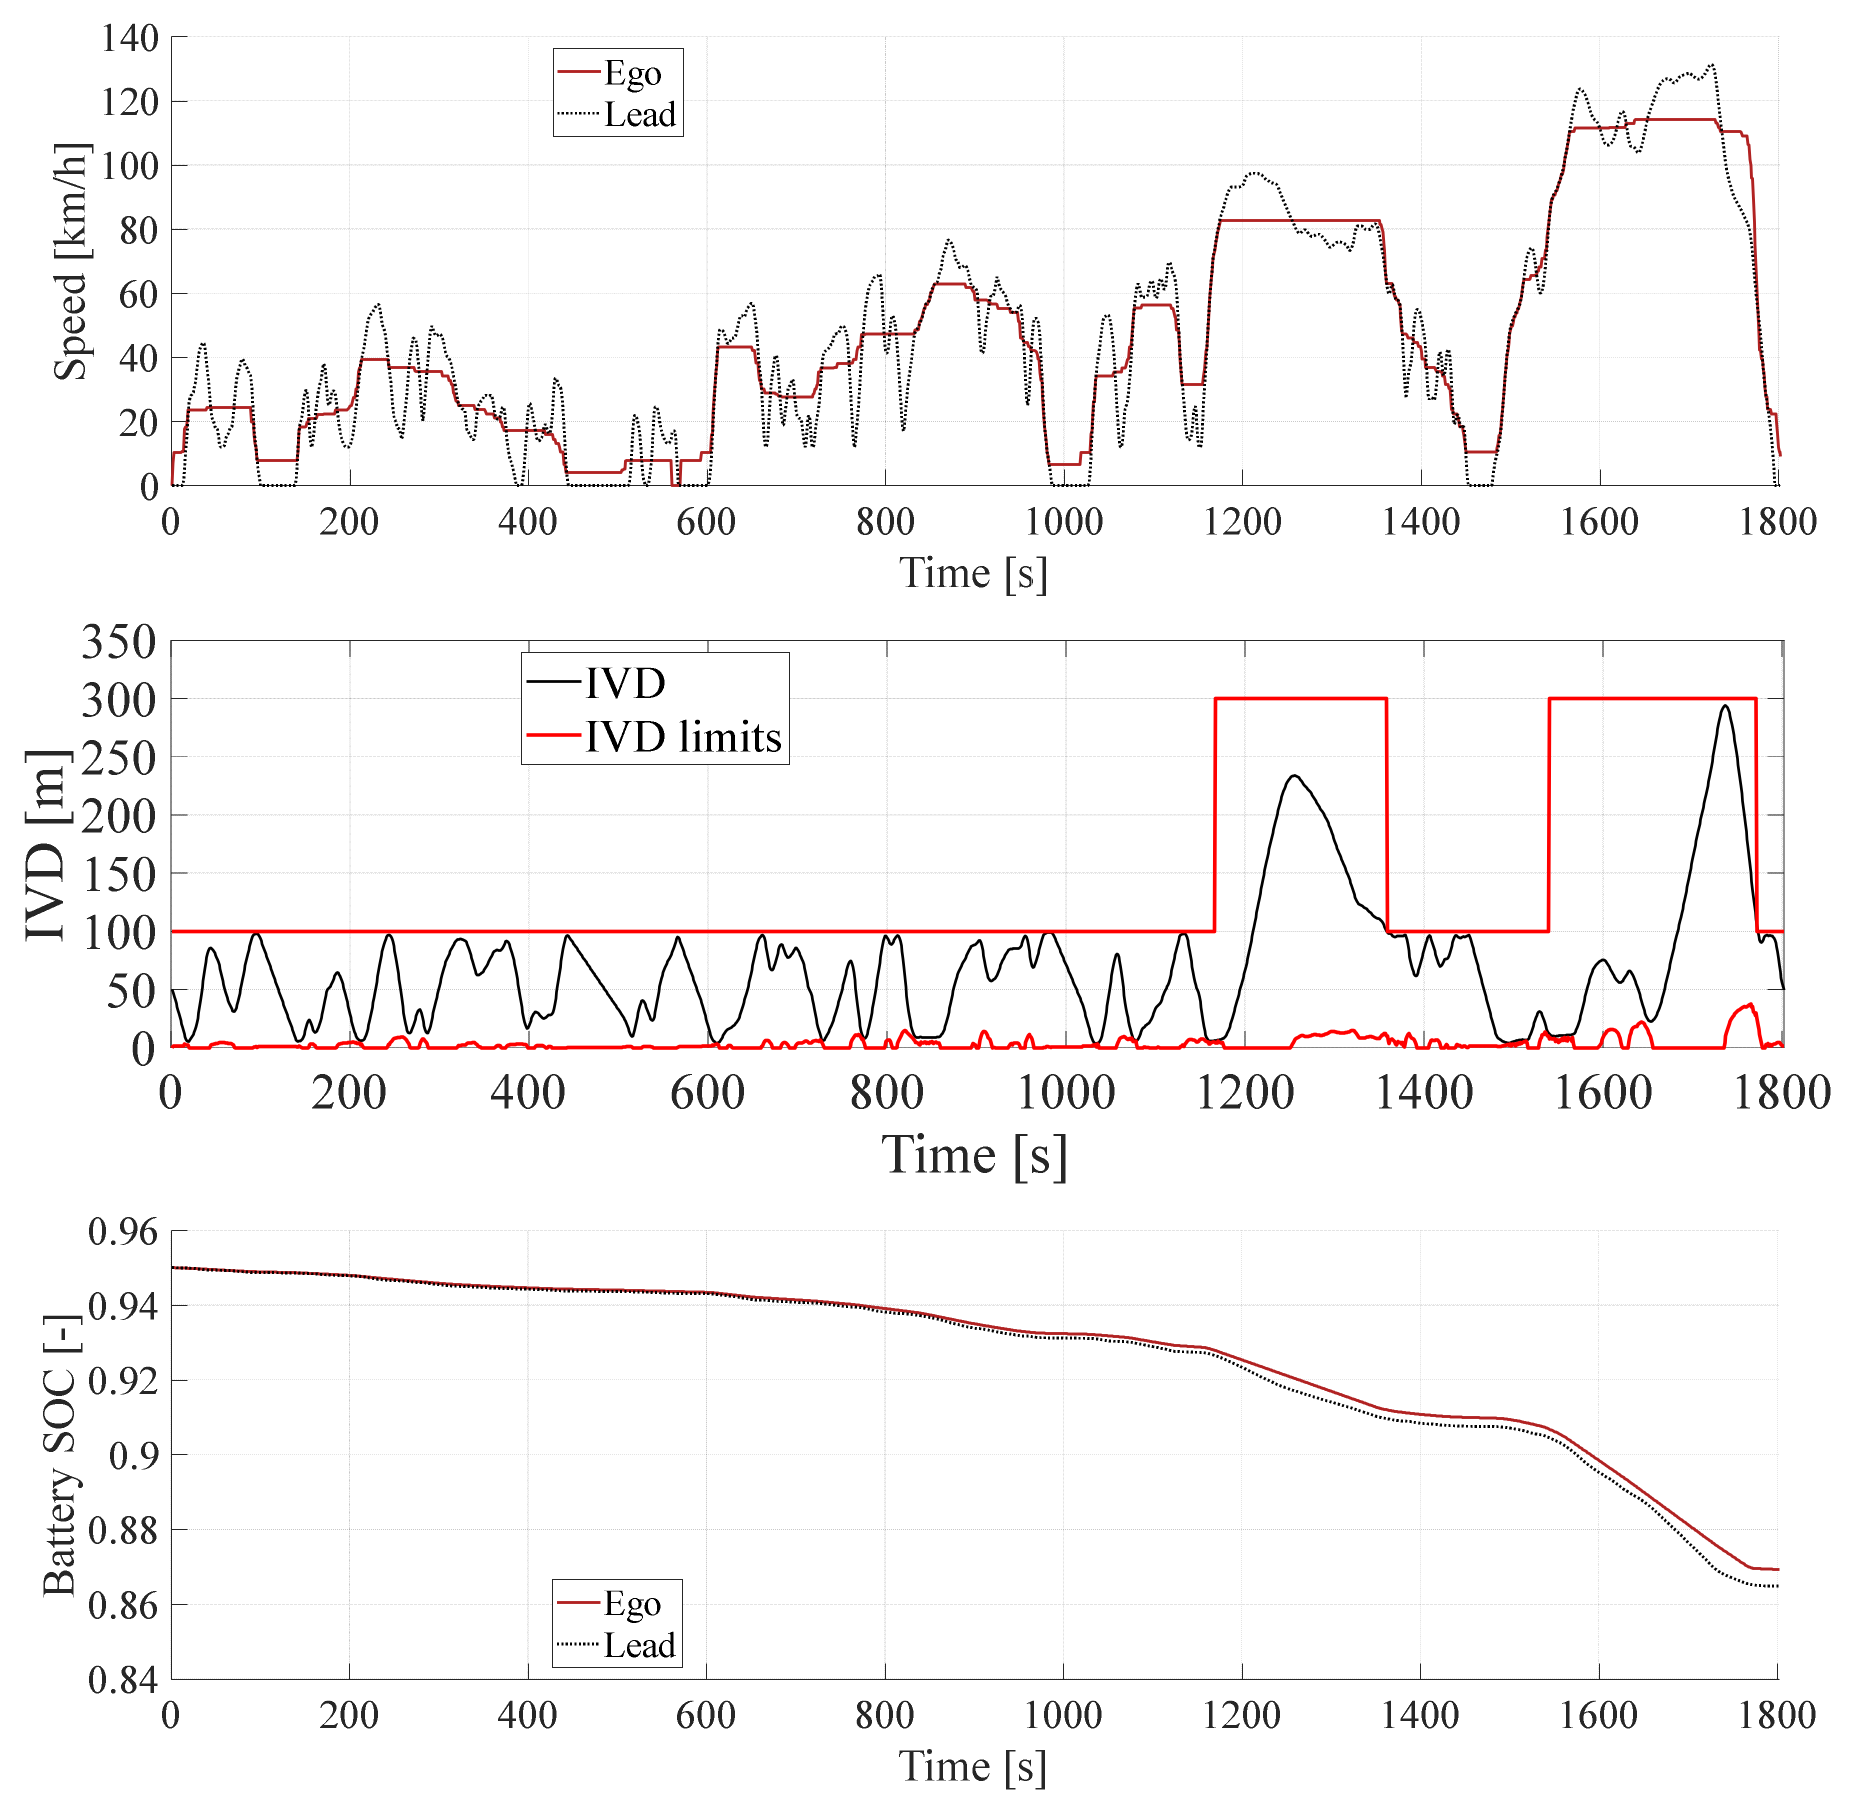
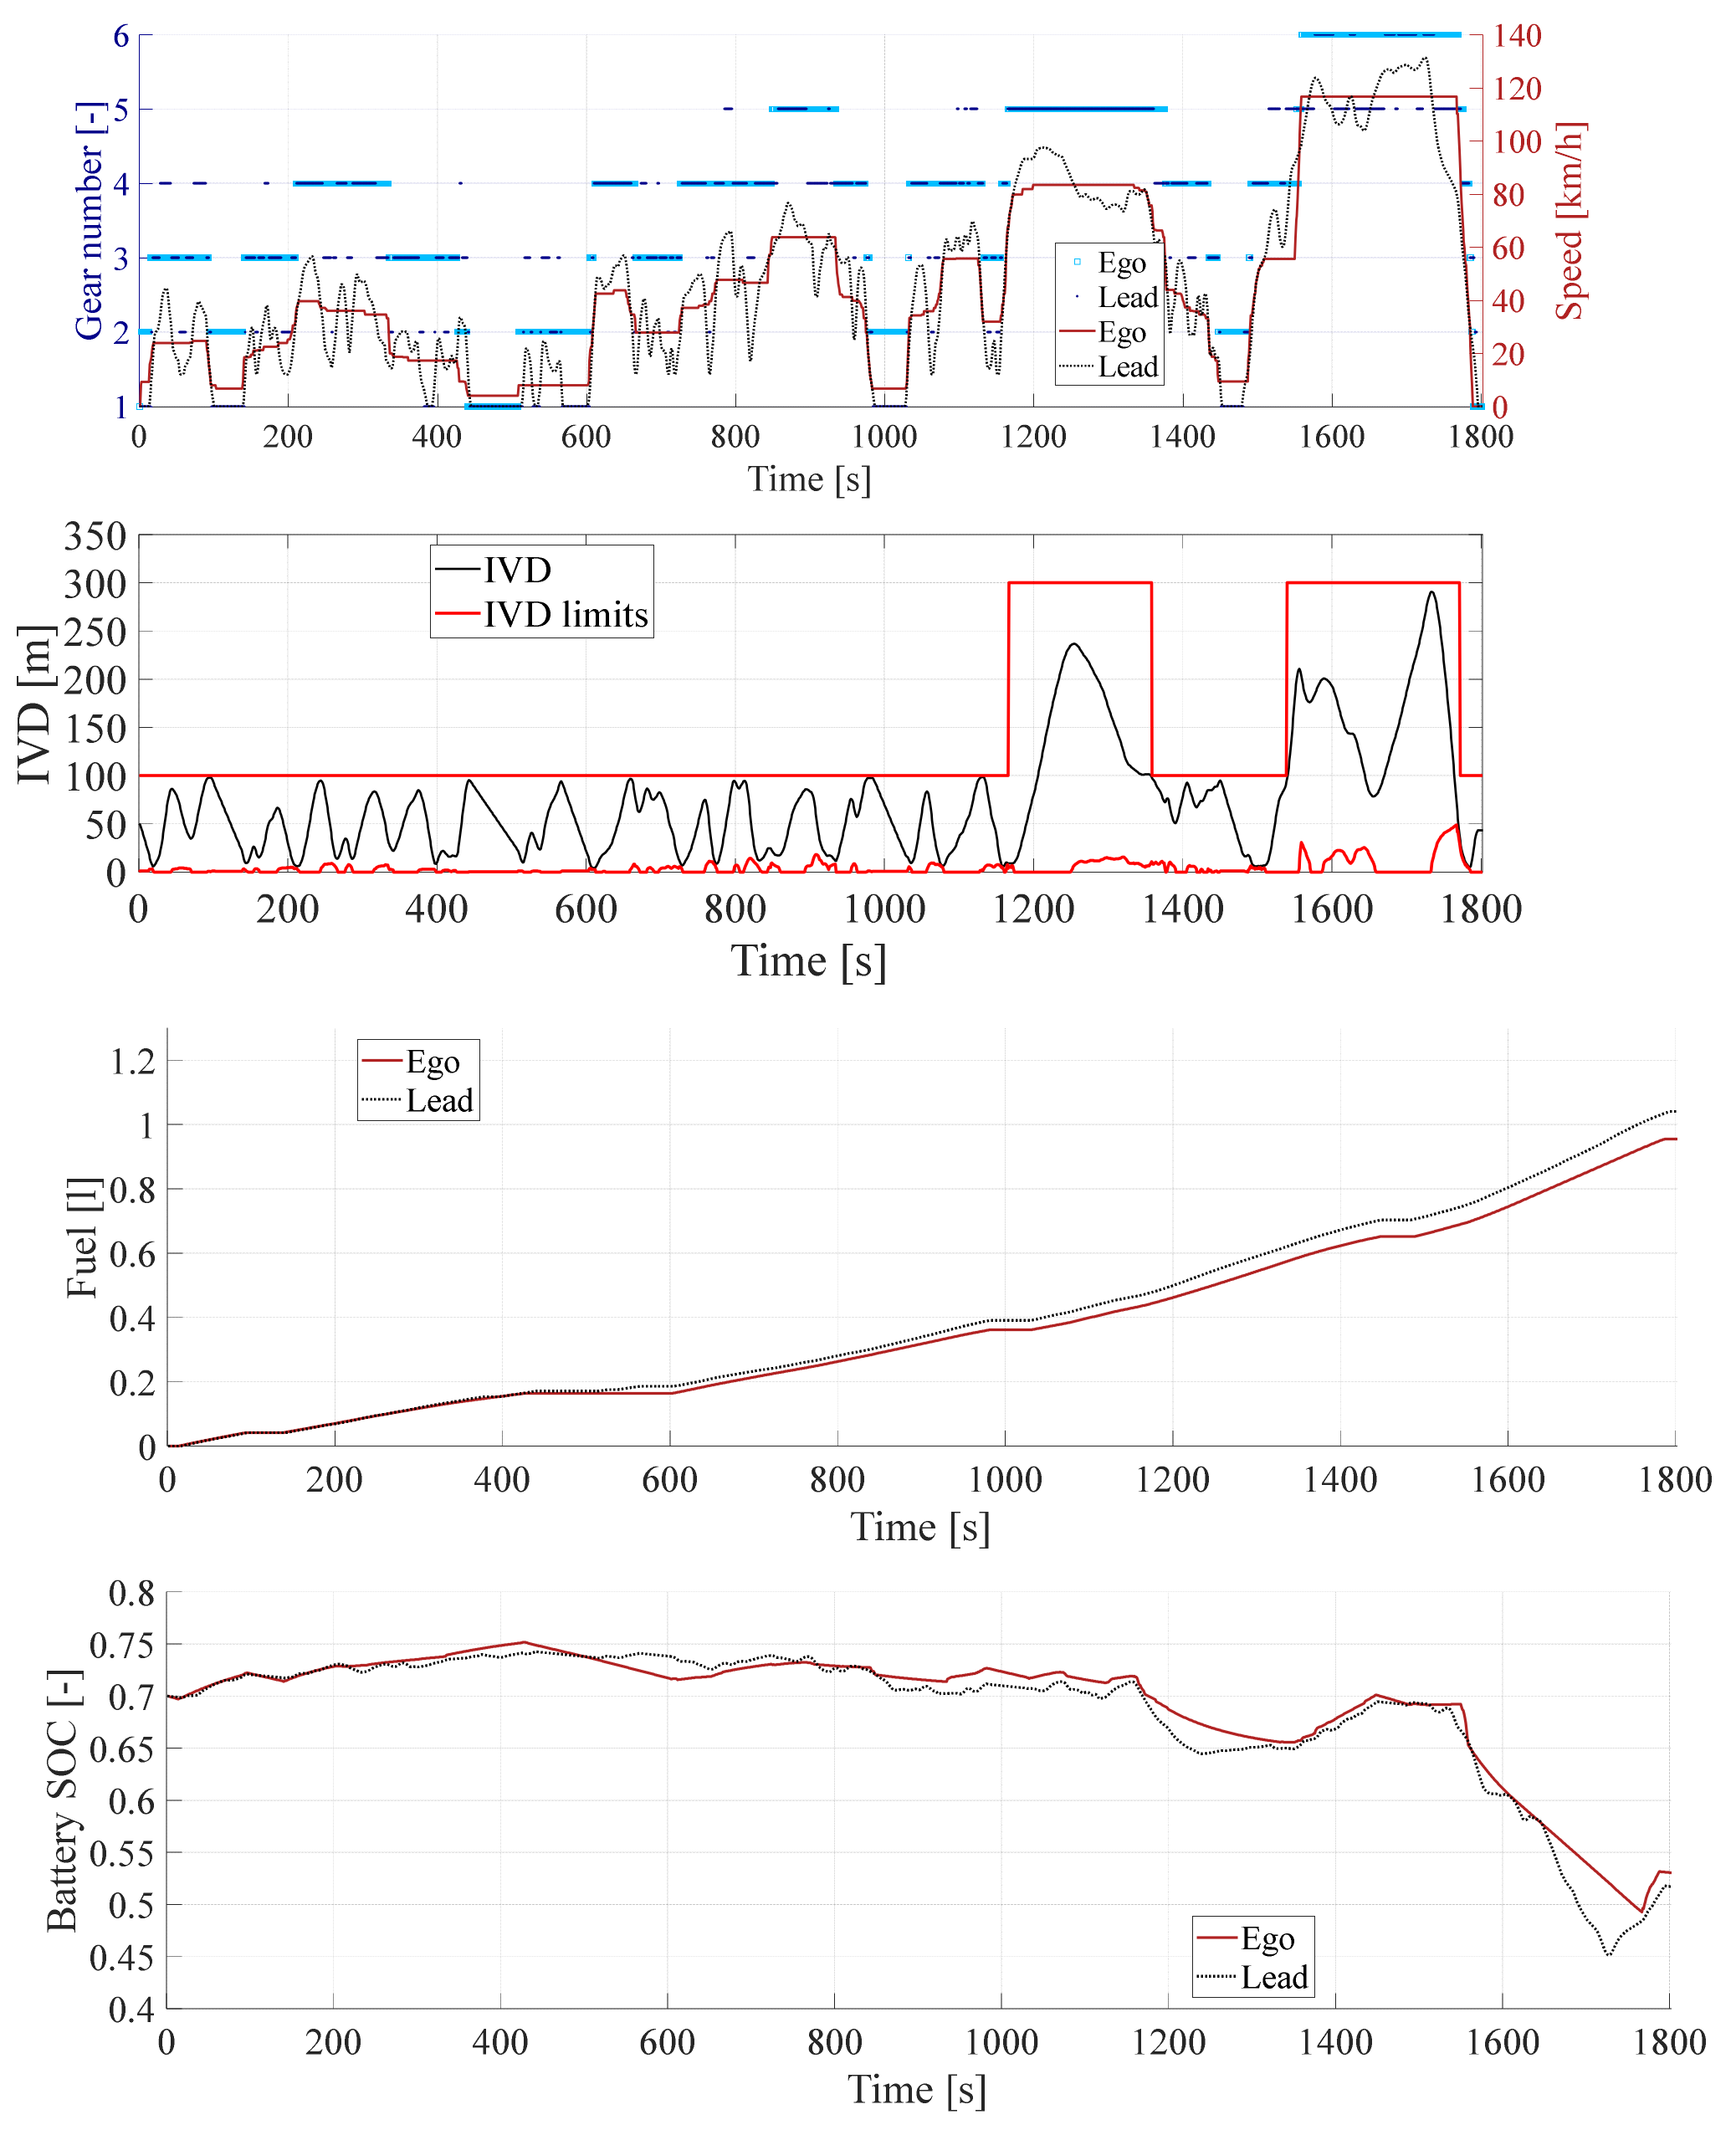
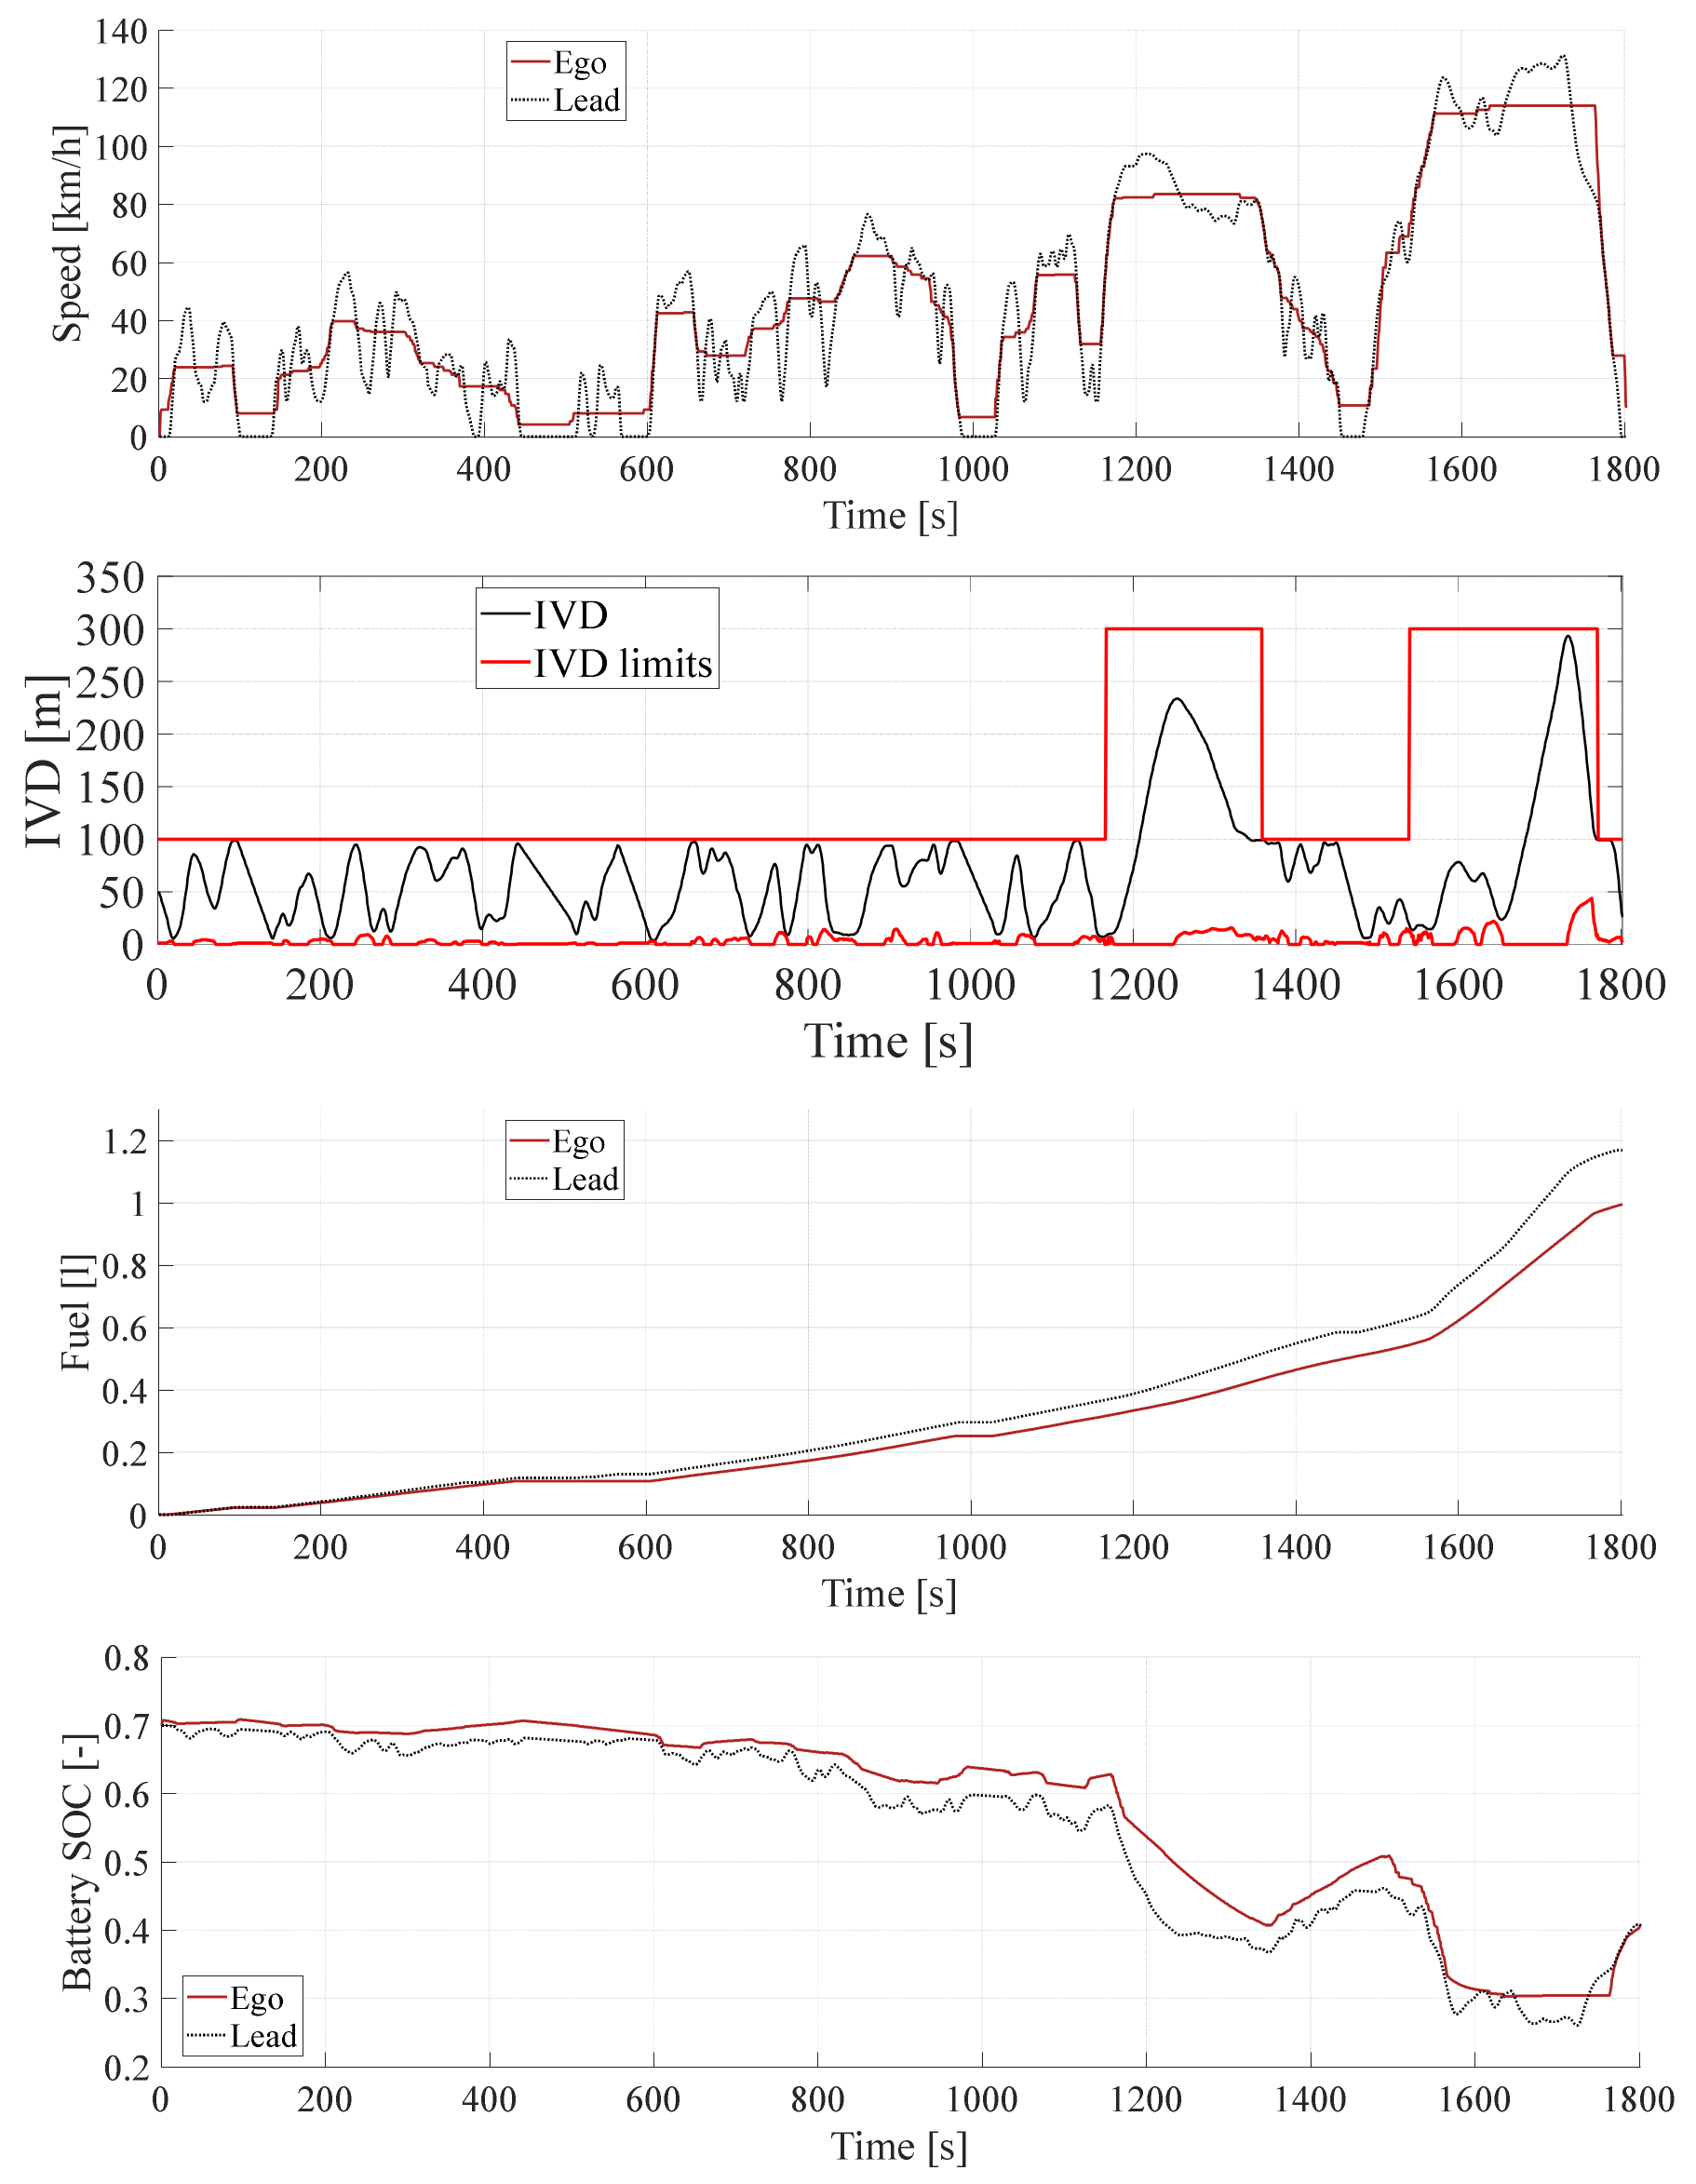
Time-series of the results for the suboptimal control solutions obtained in WLTP both as the preceding vehicle and following vehicle are reported in Appendix B from Figure A5, Figure A6, Figure A7, Figure A8, Figure A9, Figure A10, Figure A11 and Figure A12. The trend of vehicle speed, gear engaged, IVD, fuel consumption and battery SOC is particularly displayed over time when applicable. Regarding the IVD, the reader can see how the proposed optimization-driven following vehicle’s ACC approach always respects the upper and lower limits retained. Vehicle operations associated with the “Opt_Energy” suboptimal control solutions in Figure A5, Figure A6, Figure A7 and Figure A8 are distinguished by considerable savings in fuel and electrical energy for the following vehicle. On the other hand, improved uniformity in the following vehicle’s speed trend over time can be observed for the “Opt_Comfort” suboptimal control solutions in Figure A9, Figure A10, Figure A11 and Figure A12.

6. Conclusions

This paper proposes a multiobjective off-line optimization-driven ACC approach for car-following automated driving scenarios that can flexibly adapt to different powertrain categories. A CV powertrain, a BEV powertrain, a parallel P2 HEV powertrain and a PS HEV powertrain are considered as test cases, and their numerical model was presented along with the related onboard control strategies. The optimal problem for car-following driving has then been outlined. Propelling energy-saving and passenger comfort improvement were selected as the two optimization targets when controlling the following vehicle’s longitudinal acceleration throughout a given drive cycle. Dedicated constraints were integrated for the maximum and minimum achievable values of IVD, along with specific powertrain-related constraints. An optimization-driven control solution for the presented car-following driving problem can be obtained by implementing a DP technique. Simulation results obtained in different driving conditions highlight the potential of the proposed ACC approach in identifying improved control solutions for the following vehicle in terms of energy-saving and passenger comfort considering a wide range of powertrain categories. Up to 22.1% energy-saving and up to 48.2% reduction in the RMS of the vehicle acceleration were demonstrated by the following-vehicle led using the proposed approach compared with the preceding vehicle, depending on the tuning performed for the two optimization targets.
In general, the illustrated approach preserves the engineer’s freedom to select the weights for energy-saving and passenger comfort improvement for the following vehicle’s operation. The obtained optimization-driven results might be used to benchmark different ACC approaches in this way. Moreover, the proposed approach could pave the way for developing real-time-capable control algorithms for the following vehicle in car-following scenarios that mimic optimal control actions forecasted by the introduced off-line optimization-driven approach. Furthermore, improving the fidelity level for the modeling approach might be achieved in terms of powertrain, vehicle dynamics, and ACC sensing using radar, LIDAR or cameras. For example, adaptations in the onboard control logic for gear-shifting, ICE activation and power split could be examined to further enhance the powertrain efficiency when traveling as a following vehicle in car-following driving. Finally, the optimization-drive approach could be extended considering multiple ACC-enabled vehicles traveling behind the preceding vehicle.

Funding

This research was funded by the Doctoral School of Politecnico di Torino.

Conflicts of Interest

The author declares no conflict of interest.

Abbreviations

ACCAdaptive cruise control
AMTAutomated manual transmission
BEVBattery electric vehicle
CACCCooperative adaptive cruise control
CCCruise control
CVConventional vehicle
DPDynamic programming
EFCEquivalent fuel consumption
EMElectric motor
eVTElectrically variable transmission
HEVHybrid electric vehicle
HWFETHighway federal test procedure
ICEInternal combustion engine
IVDInter-vehicular distance
LIDARLight Detection and Ranging
OOLOptimal operating line
P2 HEVParallel P2 hybrid electric vehicle
PGPlanetary gearset
PS HEVPower-split hybrid electric vehicle
SOCState-of-charge
UDDSUrban dynamometer driving schedule
US06US06 supplemental procedure
V2VVehicle-to-vehicle
WLTPWorldwide harmonized light-vehicle test procedure

Appendix A. Optimal V2V Driving Pareto Fronts
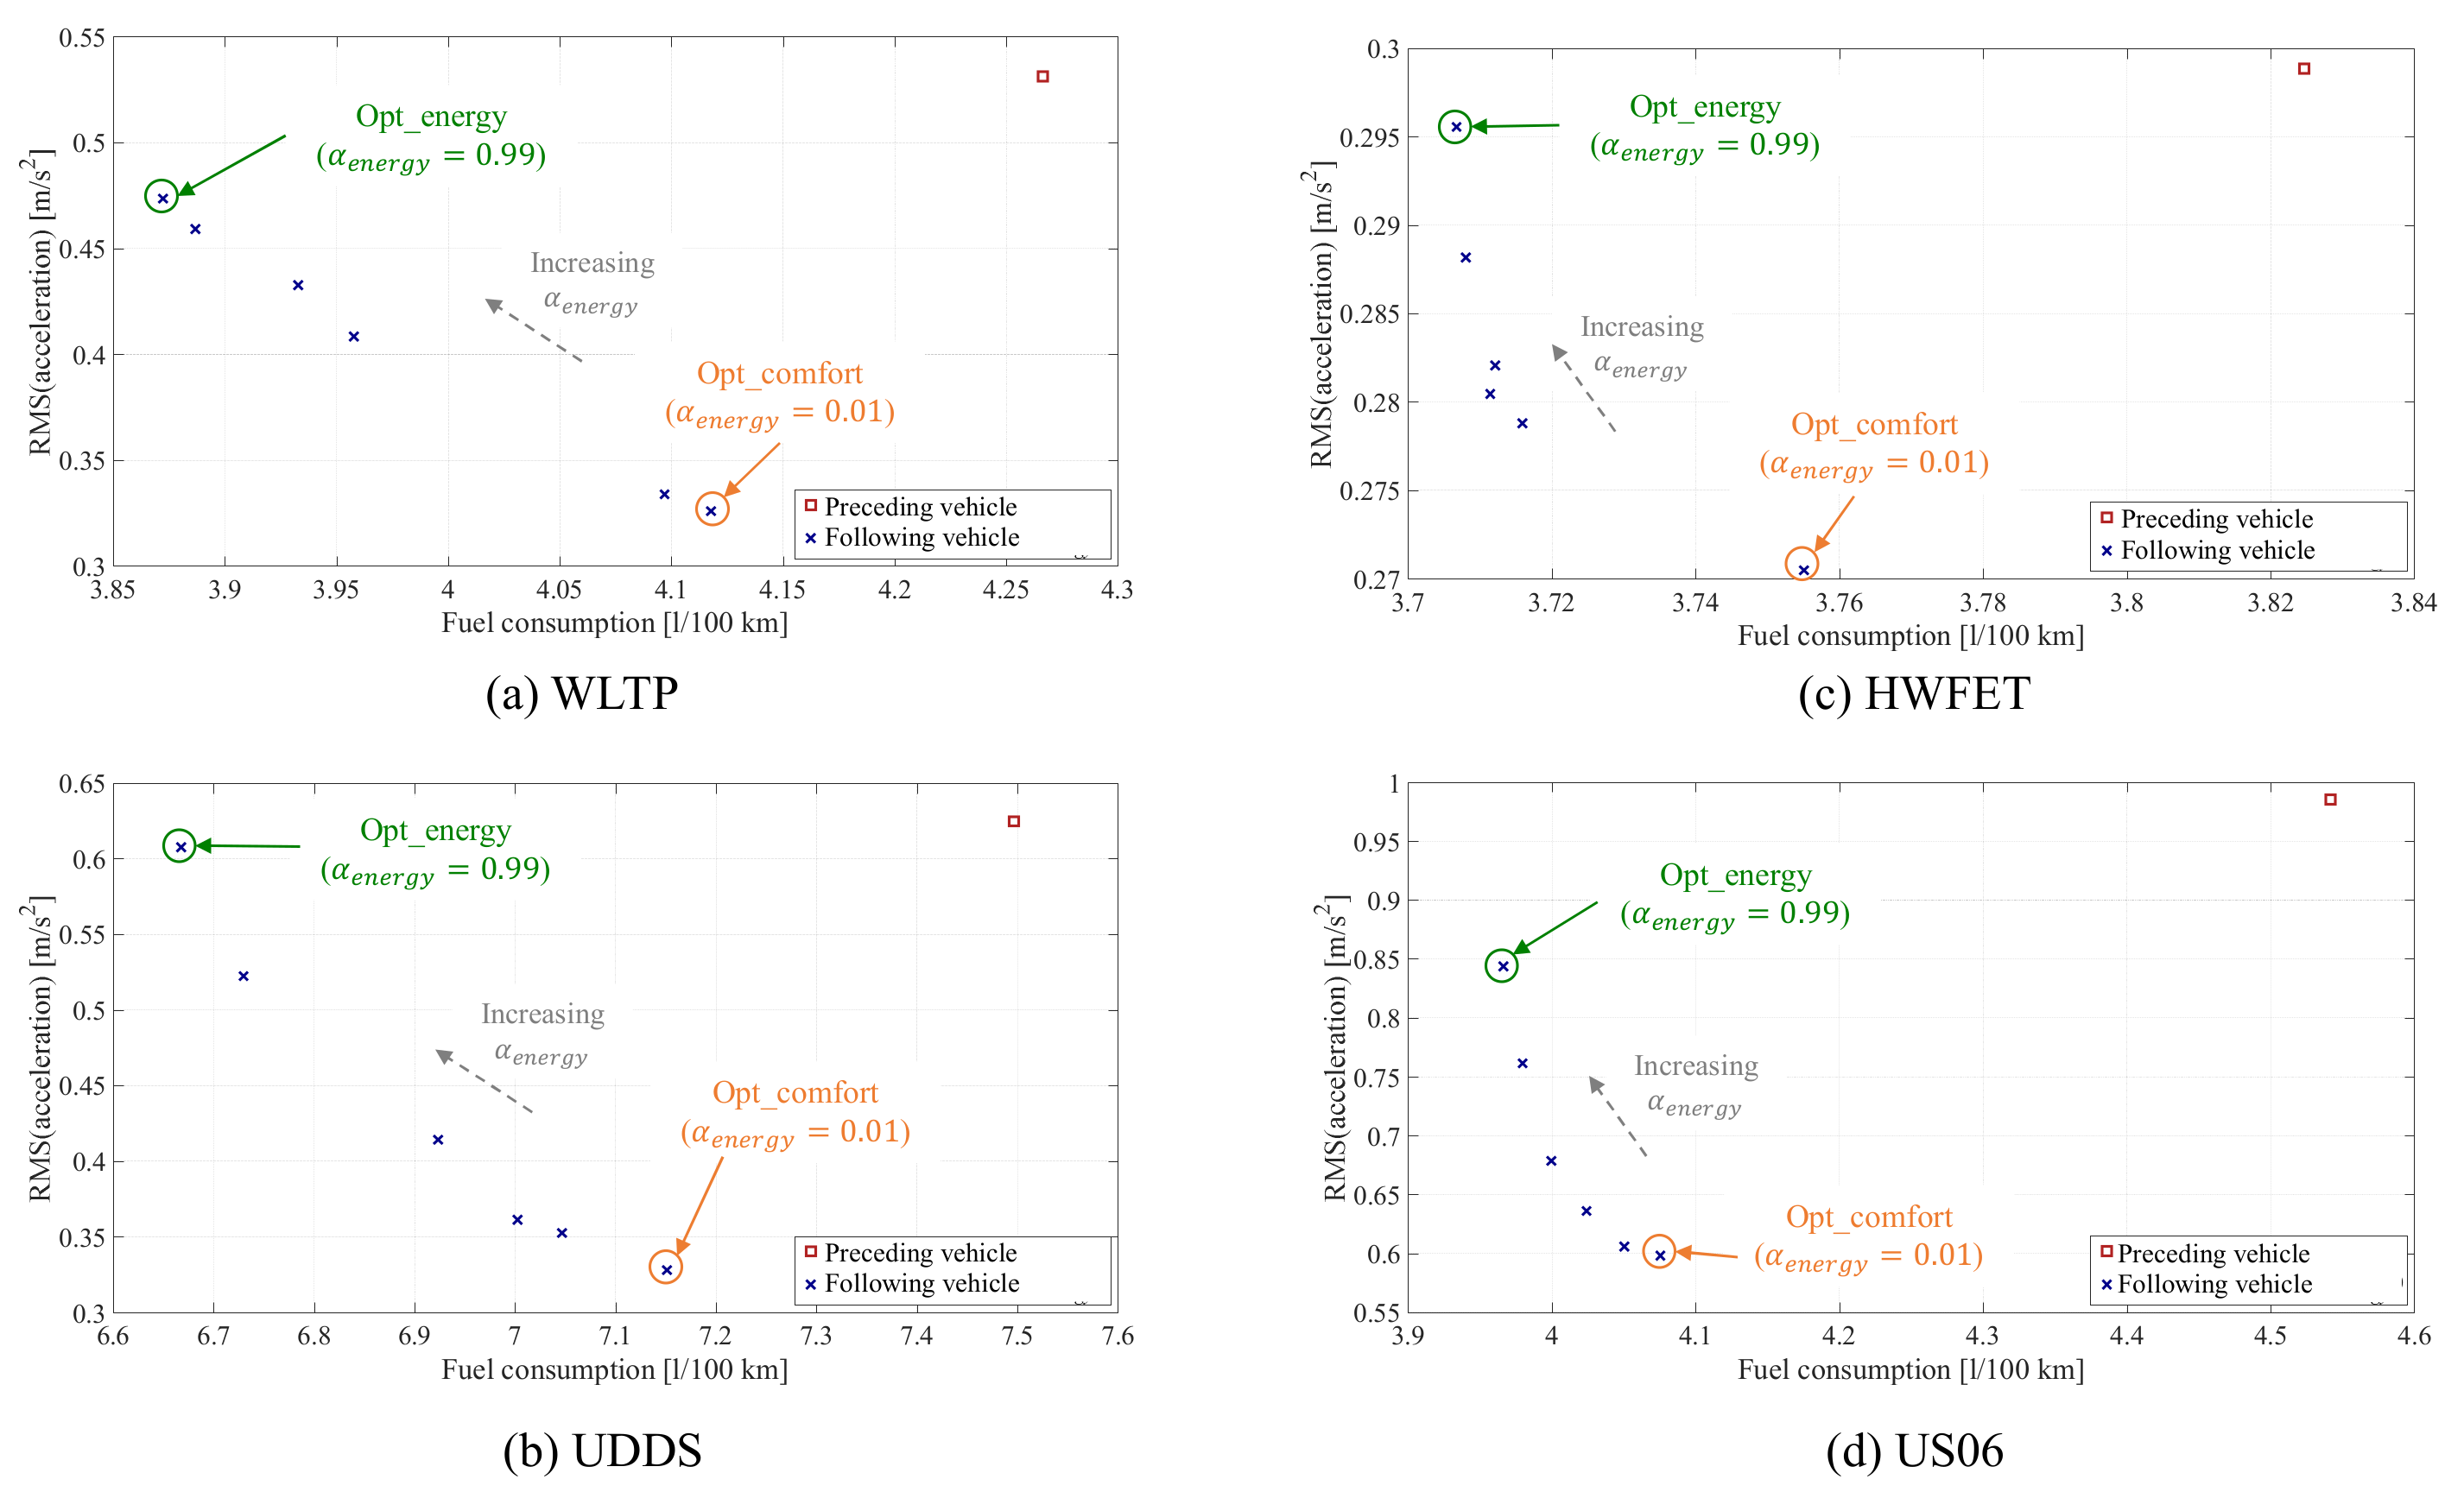
Figure A1. Pareto fronts for fuel consumption and RMS of the vehicle acceleration in WLTP (a), UDDS (b), HWFET (c) and US06 (d)—CV powertrain.
Energies 14 02897 g0a1
Figure A2. Pareto fronts for fuel consumption and RMS of the vehicle acceleration in WLTP (a), UDDS (b), HWFET (c) and US06 (d)—BEV powertrain.
Energies 14 02897 g0a2
Figure A3. Pareto fronts for fuel consumption and RMS of the vehicle acceleration in WLTP (a), UDDS (b), HWFET (c) and US06 (d)—P2 HEV powertrain.
Energies 14 02897 g0a3
Figure A4. Pareto fronts for fuel consumption and RMS of the vehicle acceleration in WLTP (a), UDDS (b), HWFET (c) and US06 (d)—PS HEV powertrain.
Energies 14 02897 g0a4

Appendix B. Time-Series of Suboptimal Control Solutions in WLTP
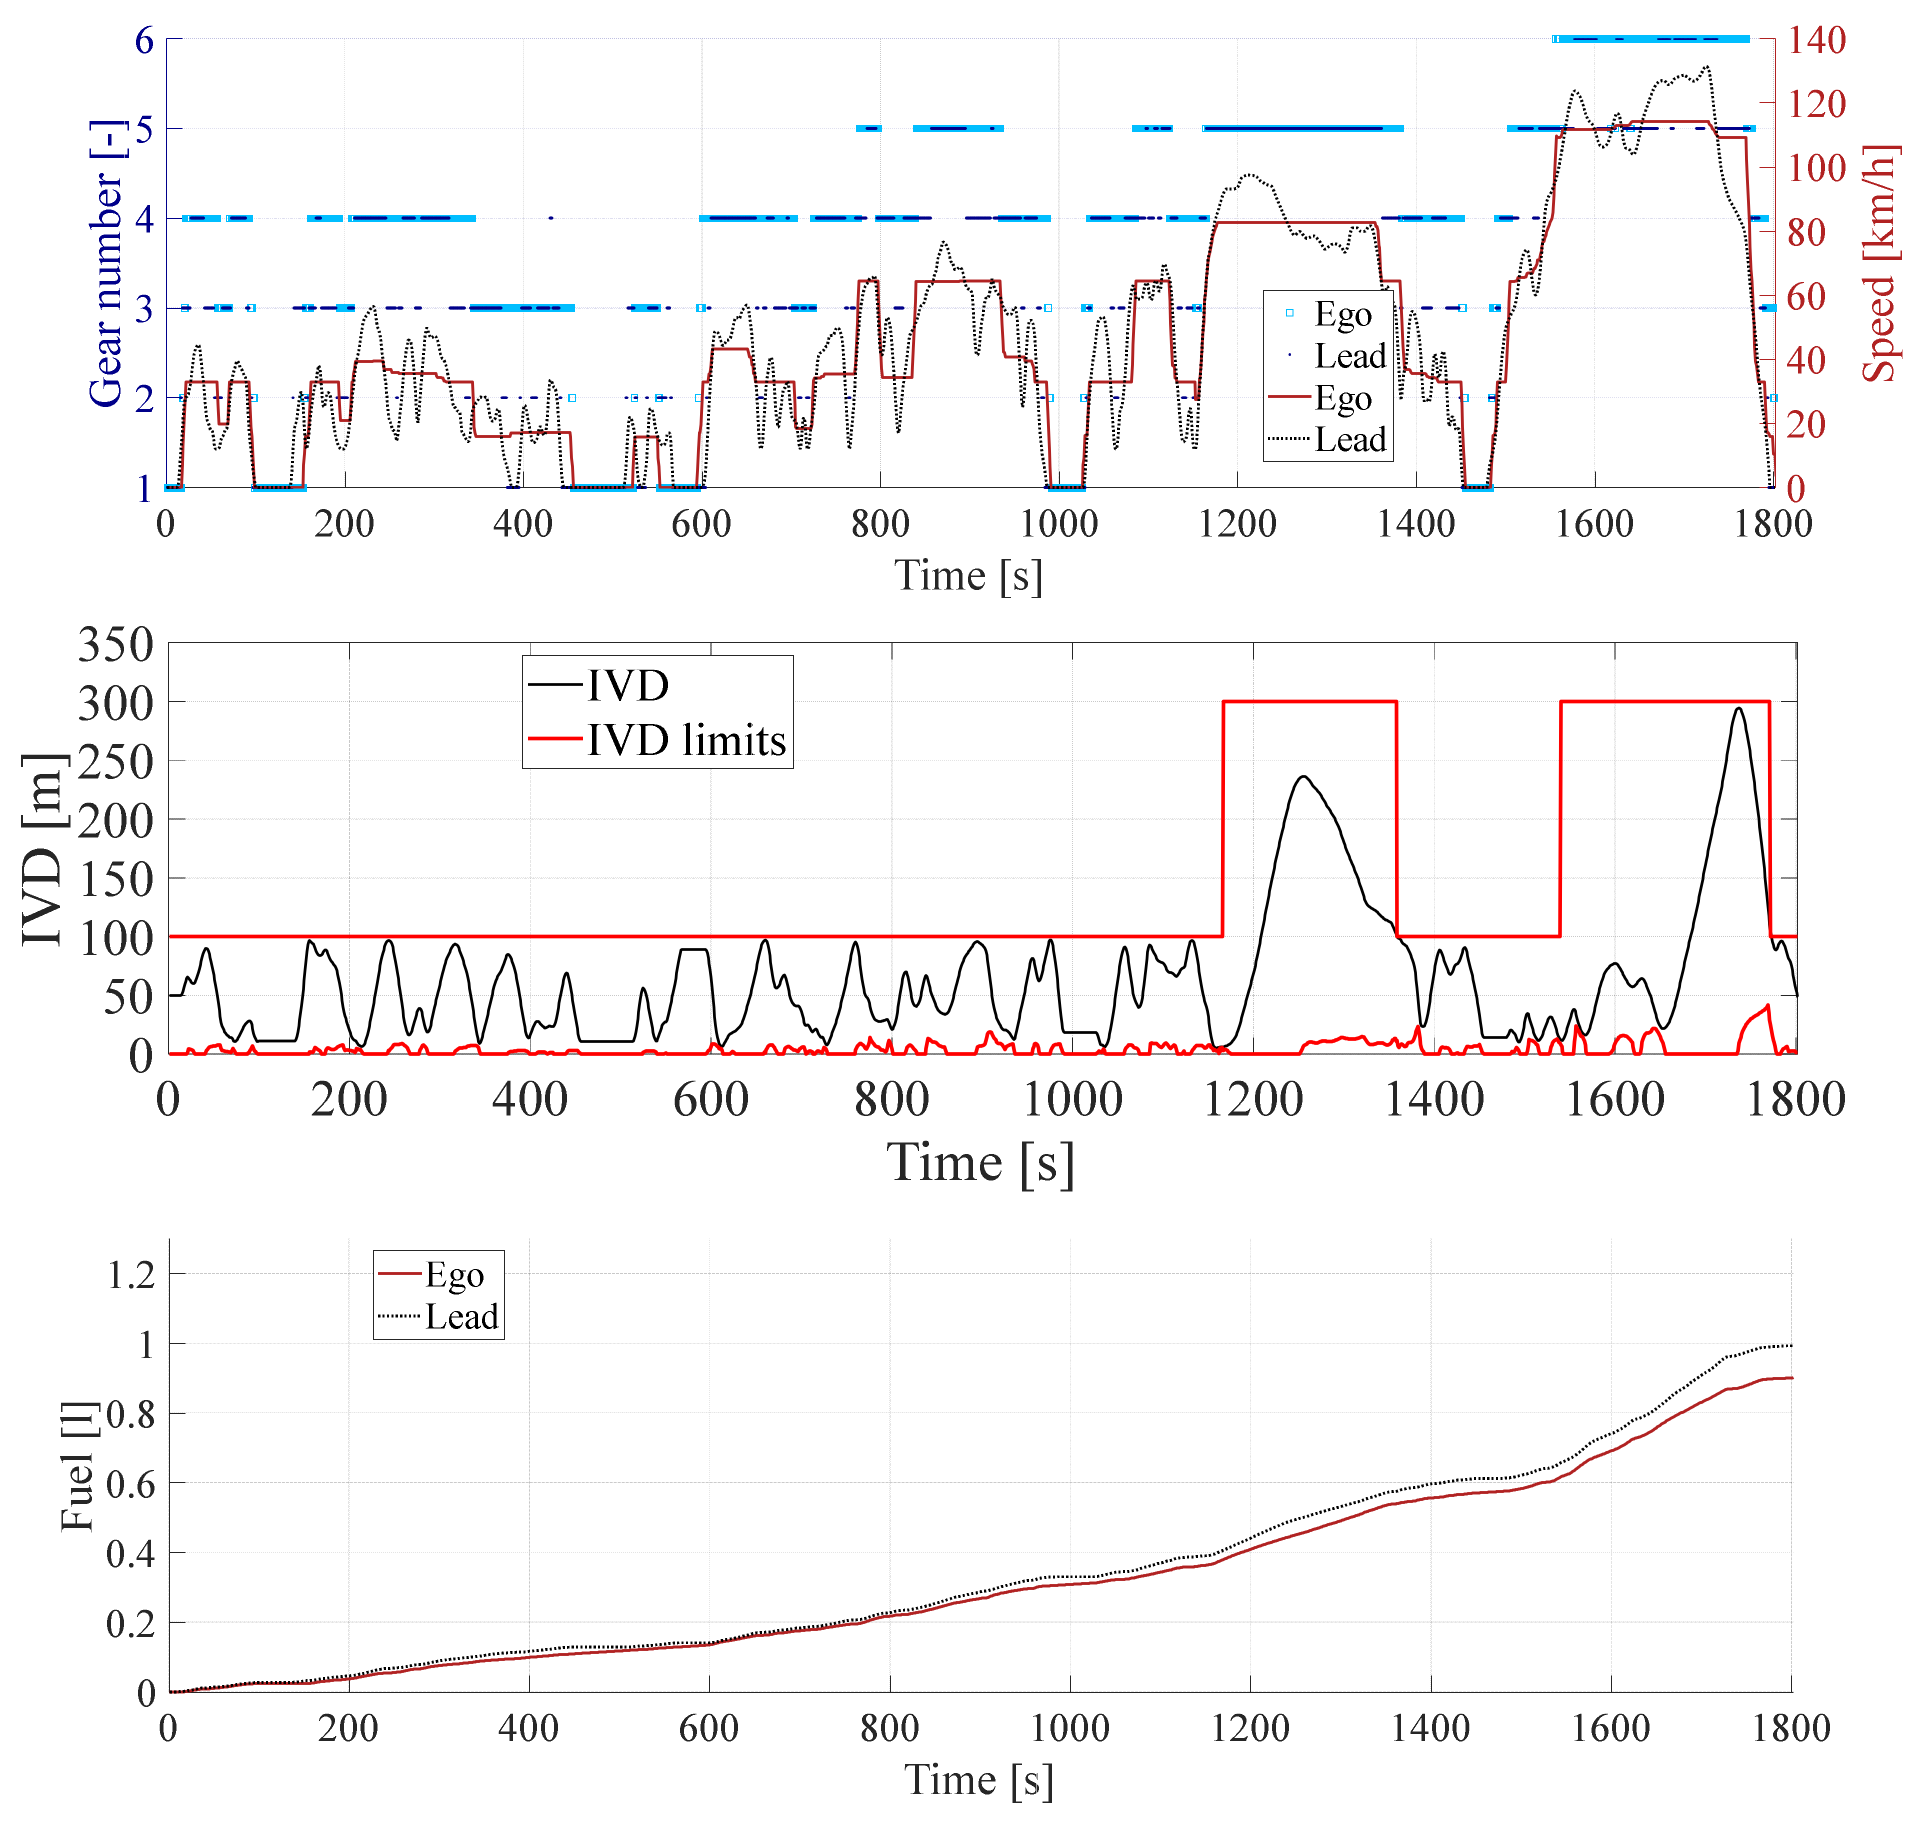
Figure A5. Time-series for the simulation results of the CV powertrain in WLTP both as the preceding vehicle and the following vehicle for the “Opt_Energy” suboptimal control solution.
Energies 14 02897 g0a5
Figure A6. Time-series for the simulation results of the CV powertrain in WLTP both as the preceding vehicle and the following vehicle for the “Opt_Comfort” suboptimal control solution.
Energies 14 02897 g0a6
Figure A7. Time-series for the simulation results of the BEV powertrain in WLTP both as the preceding vehicle and the following vehicle for the “Opt_Energy” suboptimal control solution.
Energies 14 02897 g0a7
Figure A8. Time-series for the simulation results of the BEV powertrain in WLTP both as the preceding vehicle and the following vehicle for the “Opt_Comfort” suboptimal control solution.
Energies 14 02897 g0a8
Figure A9. Time-series for the simulation results of the P2 HEV powertrain in WLTP both as the preceding vehicle and the following vehicle for the “Opt_Energy” suboptimal control solution.
Energies 14 02897 g0a9
Figure A10. Time-series for the simulation results of the P2 HEV powertrain in WLTP both as the preceding vehicle and the following vehicle for the “Opt_Comfort” suboptimal control solution.
Energies 14 02897 g0a10
Figure A11. Time-series for the simulation results of the PS HEV powertrain in WLTP both as the preceding vehicle and the following vehicle for the “Opt_Energy” suboptimal control solution.
Energies 14 02897 g0a11
Figure A12. Time-series for the simulation results of the PS HEV powertrain in WLTP both as the preceding vehicle and the following vehicle for the “Opt_Comfort” suboptimal control solution.
Energies 14 02897 g0a12

References

  1. Iclodean, C.; Cordos, N.; Varga, B.O. Autonomous Shuttle Bus for Public Transportation: A Review. Energies 2020, 13, 2917. [Google Scholar] [CrossRef]
  2. Lim, H.S.M.; Taeihagh, A. Autonomous Vehicles for Smart and Sustainable Cities: An In-Depth Exploration of Privacy and Cybersecurity Implications. Energies 2018, 11, 1062. [Google Scholar] [CrossRef] [Green Version]
  3. Bonfitto, A.; Feraco, S.; Amati, N.; Tonoli, A. Virtual Sensing in High-Performance Vehicles with Artificial Intelligence. In Proceedings of the International Design Engineering Technical Conferences and Computers and Information in Engineering Conference, Anaheim, CA, USA, 18–21 August 2019; Volume 59216. [Google Scholar]
  4. Rios-Torres, J.; Malikopoulos, A.A. Impact of Partial Penetrations of Connected and Automated Vehicles on Fuel Consumption and Traffic Flow. IEEE Trans. Intell. Veh. 2018, 3, 453–462. [Google Scholar] [CrossRef]
  5. Smith, S.W.; Kim, Y.; Guanetti, J.; Li, R.; Firoozi, R.; Wootton, B.; Kurzhanskiy, A.A.; Borrelli, F.; Horowitz, R.; Arcak, M. Improving Urban Traffic Throughput With Vehicle Platooning: Theory and Experiments. IEEE Access 2020, 8, 141208–141223. [Google Scholar] [CrossRef]
  6. Ozatay, E.; Ozguner, U.; Onori, S.; Rizzoni, G. Analytical Solution to the Minimum Fuel Consumption Optimization Problem with the Existence of a Traffic Light. In Proceedings of the ASME 2012 5th Annual Dynamic Systems and Control Conference joint with the JSME 2012 11th Motion and Vibration Conference; ASME: Fairfield, CT, USA, 2012; pp. 837–846. [Google Scholar]
  7. Wang, P.; Gao, S.; Li, L.; Sun, B.; Cheng, S. Obstacle Avoidance Path Planning Design for Autonomous Driving Vehicles Based on an Improved Artificial Potential Field Algorithm. Energies 2019, 12, 2342. [Google Scholar] [CrossRef] [Green Version]
  8. Rizzoni, G.; Özgüner, U.; Onori, S.; Wollaeger, J.; Kumar, A.; Khayyer, P.; Ozatay, E. Big Data in Automotive Applications: Cloud Computing Based Velocity Profile Generation for Minimum Fuel Consumption. 2016. Available online: https://pdfs.semanticscholar.org/68c6/39425c042ffd2e213b5a172270aa6eb6c6fe.pdf (accessed on 22 January 2021).
  9. Feraco, S.; Bonfitto, A.; Amati, N.; Tonoli, A. Combined Lane Keeping and Longitudinal Speed Control for Autonomous Driving. In Proceedings of the International Design Engineering Technical Conferences and Computers and Information in Engineering Conference, Anaheim, CA, USA, 18–21 August 2019; Volume 59216. [Google Scholar]
  10. Feraco, S.; Luciani, S.; Bonfitto, A.; Amati, N.; Tonoli, A. A local trajectory planning and control method for autonomous vehicles based on the RRT algorithm. In Proceedings of the 2020 AEIT International Conference of Electrical and Electronic Technologies for Automotive (AEIT AUTOMOTIVE), Torino, Italy, 18–20 November 2020; pp. 1–6. [Google Scholar]
  11. Anselma, P.G.; Belingardi, G. Next Generation HEV Powertrain Design Tools: Roadmap and Challenges; SAE Technical Paper 2019-01-2602; SAE International: Warrendale, PA, USA, 2019. [Google Scholar]
  12. Makridis, M.; Mattas, K.; Ciuffo, B. Response Time and Time Headway of an Adaptive Cruise Control. An Empirical Characterization and Potential Impacts on Road Capacity. IEEE Trans. Intell. Transp. Syst. 2019, 21, 1677–1686. [Google Scholar] [CrossRef]
  13. Makridis, M.; Mattas, K.; Ciuffo, B.; Re, F.; Kriston, A.; Minarini, F.; Rognelund, G. Empirical study on the properties of adaptive cruise control systems and their impact on traffic flow and string stability. Transp. Res. Rec. 2020, 2674, 471–484. [Google Scholar] [CrossRef] [Green Version]
  14. Mahdinia, I.; Arvin, R.; Khattak, J.A.; Ghiasi, A. Safety, energy, and emissions impacts of adaptive cruise control and cooperative adaptive cruise control. Transp. Res. Rec. 2020, 2674, 253–267. [Google Scholar] [CrossRef]
  15. He, Y.; Makridis, M.; Fontaras, G.; Mattas, K.; Xu, H.; Ciuffo, B. The energy impact of adaptive cruise control in real-world highway multiple-car-following scenarios. Eur. Transp. Res. Rev. 2020, 12, 1–11. [Google Scholar] [CrossRef] [Green Version]
  16. Lang, D.; Stanger, T.; Del Re, L. Opportunities on Fuel Economy Utilizing V2V Based Drive Systems; SAE Technical Paper 2013-01-0985; SAE International: Warrendale, PA, USA, 2013. [Google Scholar]
  17. He, C.R.; Orosz, G. Saving fuel using wireless vehicle-to-vehicle communication. In Proceedings of the 2017 American Control Conference (ACC), Seattle, WA, USA, 24–26 May 2017; pp. 4946–4951. [Google Scholar]
  18. He, C.R.; Ge, J.I.; Orosz, G. Fuel Efficient Connected Cruise Control for Heavy-Duty Trucks in Real Traffic. IEEE Trans. Control Syst. Technol. 2019, 28, 2474–2481. [Google Scholar] [CrossRef]
  19. Tunnell, J.A.; Asher, Z.D.; Pasricha, S.; Bradley, T.H. Towards Improving Vehicle Fuel Economy with ADAS. SAE Int. J. CAV 2018, 1, 81–92. [Google Scholar] [CrossRef]
  20. Olin, P.; Aggoune, K.; Tang, L.; Confer, K.; Kirwan, J.; Deshpande, S.R.; Gupta, S.; Tulpule, P.; Canova, M.; Rizzoni, G. Reducing Fuel Consumption by Using Information from Connected and Automated Vehicle Modules to Optimize Propulsion System Control; SAE Technical Paper 2019-01-1213; SAE Technical Paper Series; SAE International: Warrendale, PA, USA, 2019. [Google Scholar]
  21. Zhang, F.; Xi, J.; Langari, R. Real-Time Energy Management Strategy Based on Velocity Forecasts Using V2V and V2I Communications. IEEE Trans. Intell. Transp. Syst. 2016, 18, 416–430. [Google Scholar] [CrossRef]
  22. Plianos, A.; Jokela, T.; Hancock, M. Predictive Energy Optimization for Connected and Automated HEVs; SAE Technical Paper 2018-01-1179; SAE International: Warrendale, PA, USA, 2018. [Google Scholar]
  23. Anselma, P.G.; Belingardi, G. Enhancing Energy Saving Opportunities through Rightsizing of a Battery Electric Vehicle Powertrain for Optimal Cooperative Driving. SAE Int. J. CAV 2020, 3, 71–83. [Google Scholar] [CrossRef]
  24. Koch, A.; Teichert, O.; Kalt, S.; Ongel, A.; Lienkamp, M. Powertrain Optimization for Electric Buses under Optimal Energy-Efficient Driving. Energies 2020, 13, 6451. [Google Scholar] [CrossRef]
  25. Koch, A.; Bürchner, T.; Herrmann, T.; Lienkamp, M. Eco-Driving for Different Electric Powertrain Topologies Considering Motor Efficiency. World Electr. Veh. J. 2021, 12, 6. [Google Scholar] [CrossRef]
  26. Tate, L.; Hochgreb, S.; Hall, J.; Bassett, M. Energy Efficiency of Autonomous Car Powertrain; SAE Technical Paper 2018-01-1092; SAE International: Warrendale, PA, USA, 2018. [Google Scholar]
  27. Plum, T.; Wegener, M.; Eisenbarth, M.; Ye, Z.; Etzold, K.; Pischinger, S.; Andert, J. A simulation-based case study for powertrain efficiency improvement by automated driving functions. Proc. Inst. Mech. Eng. Part D J. Automob. Eng. 2019, 233, 1320–1330. [Google Scholar] [CrossRef]
  28. Spano, M.; del Vescovo, D.; Sangeorzan, B.; Misul, D.; Belingardi, G. Optimizing engine downsizing and driving behaviour in conventional and hybrid powertrains for autonomous driving applications. Int. J. Mech. Control 2020, 21, 1–12. [Google Scholar]
  29. Belingardi, G.; Anselma, P.G.; Demic, M. Optimization-Based Controllers for Hybrid Electric Vehicles. Mobil. Veh. Mech. 2018, 44, 53–67. [Google Scholar] [CrossRef]
  30. Rizzoni, G.; Guzzella, L.; Baumann, B. Unified modeling of hybrid electric vehicle drivetrains. IEEE/ASME Trans. Mechatronics 1999, 4, 246–257. [Google Scholar] [CrossRef]
  31. Anselma, P.G.; Huo, Y.; Roeleveld, J.; Emadi, A.; Belingardi, G. Rapid optimal design of a multimode power split hybrid electric vehicle transmission. Proc. Inst. Mech. Eng. Part D J. Automob. Eng. 2019, 233, 740–762. [Google Scholar] [CrossRef]
  32. Anselma, P.G.; Biswas, A.; Belingardi, G.; Emadi, A. Rapid assessment of the fuel economy capability of parallel and series-parallel hybrid electric vehicles. Appl. Energy 2020, 275, 115319. [Google Scholar] [CrossRef]
  33. Ayman, M.; Kim, N.; Rousseau, A. Vehicle Modeling for Use in the CAFE Model: Process Description and Modeling Assumptions; Argonne National Lab: Argonne, IL, USA, 2016. [Google Scholar]
  34. Anselma, P.G.; Kollmeyer, P.; Belingardi, G.; Emadi, A. Multi-Objective Hybrid Electric Vehicle Control for Maximizing Fuel Economy and Battery Lifetime. In Proceedings of the 2020 IEEE Transportation Electrification Conference & Expo (ITEC), Chicago, IL, USA, 24–26 June 2020; pp. 1–6. [Google Scholar]
  35. Anselma, P.G.; Belingardi, G.; Falai, A.; Maino, C.; Miretti, F.; Misul, D.; Spessa, E. Comparing Parallel Hybrid Electric Vehicle Powertrains for Real-world Driving. In Proceedings of the 2019 AEIT International Conference of Electrical and Electronic Technologies for Automotive (AEIT AUTOMOTIVE), Torino, Italy, 2–4 July 2019; pp. 1–6. [Google Scholar]
  36. Bianchi, D.; Rolando, L.; Serrao, L.; Onori, S.; Rizzoni, G.; Al-Khayat, N.; Hsieh, T.-M.; Kang, P. A Rule-Based Strategy for a Series/Parallel Hybrid Electric Vehicle: An Approach Based on Dynamic Programming. In Proceedings of the ASME 2010 Dynamic Systems and Control Conference; ASME International: New York, NY, USA, 2010; Volume 44175, pp. 507–514. [Google Scholar]
  37. Rizzoni, G.; Onori, S. Energy management of hybrid electric vehicles: 15 years of development at the Ohio State University. Oil Gas Sci. Technol. 2015, 70, 41–54. [Google Scholar] [CrossRef] [Green Version]
  38. Biswas, A.; Anselma, P.G.; Rathore, A.; Emadi, A. Comparison of Three Real-Time Implementable Energy Management Strategies for Multi-mode Electrified Powertrain. In Proceedings of the 2020 IEEE Transportation Electrification Conference & Expo (ITEC), Chicago, IL, USA, 23–26 June 2020; pp. 514–519. [Google Scholar]
  39. Kim, N.; Rousseau, A.; Rask, E. Autonomie Model Validation with Test Data for 2010 Toyota Prius; SAE Technical Paper 2012-01-1040; SAE International: Warrendale, PA, USA, 2012. [Google Scholar]
  40. Yang, Y.; Schofield, N.; Emadi, A. Integrated Electromechanical Double-Rotor Compound Hybrid Transmissions for Hybrid Electric Vehicles. IEEE Trans. Veh. Technol. 2016, 65, 4687–4699. [Google Scholar] [CrossRef]
  41. Kim, N.; Cha, S.; Peng, H. Optimal Control of Hybrid Electric Vehicles Based on Pontryagin’s Minimum Principle. IEEE Trans. Control Syst. Technol. 2011, 19, 1279–1287. [Google Scholar]
  42. Németh, B. Coordination of Lateral Vehicle Control Systems Using Learning-Based Strategies. Energies 2021, 14, 1291. [Google Scholar] [CrossRef]
  43. Jin, X.; Yan, Z.; Yin, G.; Li, S.; Wei, C. An Adaptive Motion Planning Technique for On-Road Autonomous Driving. IEEE Access 2021, 9, 2655–2664. [Google Scholar] [CrossRef]
  44. US Department of Energy. Nhtsa Issues Advance Notice of Proposed Rulemaking and Research Report on Ground-Breaking Crash Avoidance Technology: “Vehicle-To-Vehicle Communications: Readiness of V2V Technology for Application”. Available online: https://www.nhtsa.gov/sites/nhtsa.dot.gov/files/documents/v2v_fact_sheet_101414_v2a.pdf (accessed on 21 January 2021).
  45. Chen, C.; Lü, N.; Liu, L.; Pei, Q.-Q.; Li, X.-J. Critical safe distance design to improve driving safety based on vehicle-to-vehicle communications. J. Cent. South Univ. 2013, 20, 3334–3344. [Google Scholar] [CrossRef]
  46. Bellman, R.; Lee, E. History and development of dynamic programming. IEEE Control Syst. Mag. 1984, 4, 24–28. [Google Scholar] [CrossRef]
  47. Nazari, S.; Siegel, J.; Middleton, R.; Stefanopoulou, A. Power Split Supercharging: A Mild Hybrid Approach to Boost Fuel Economy. Energies 2020, 13, 6580. [Google Scholar] [CrossRef]
  48. Jiang, Z.; Qiao, Y.; Chen, Y.; Ji, C. A New Reservoir Operation Chart Drawing Method Based on Dynamic Programming. Energies 2018, 11, 3355. [Google Scholar] [CrossRef] [Green Version]
  49. An, L.N.; Tuan, T.Q. Dynamic Programming for Optimal Energy Management of Hybrid Wind–PV–Diesel–Battery. Energies 2018, 11, 3039. [Google Scholar] [CrossRef] [Green Version]
  50. Soldo, J.; Škugor, B.; Deur, J. Synthesis of Optimal Battery State-of-Charge Trajectory for Blended Regime of Plug-in Hybrid Electric Vehicles in the Presence of Low-Emission Zones and Varying Road Grades. Energies 2019, 12, 4296. [Google Scholar] [CrossRef] [Green Version]
  51. Delprat, S.; Lauber, J.; Guerra, T.; Rimaux, J. Control of a Parallel Hybrid Powertrain: Optimal Control. IEEE Trans. Veh. Technol. 2004, 53, 872–881. [Google Scholar] [CrossRef]
  52. Pan, C.; Liang, Y.; Chen, L.; Chen, L. Optimal Control for Hybrid Energy Storage Electric Vehicle to Achieve Energy Saving Using Dynamic Programming Approach. Energies 2019, 12, 588. [Google Scholar] [CrossRef] [Green Version]
  53. Qiao, Y.; Song, Y.; Huang, K. A Novel Control Algorithm Design for Hybrid Electric Vehicles Considering Energy Consumption and Emission Performance. Energies 2019, 12, 2698. [Google Scholar] [CrossRef] [Green Version]
  54. Sundstrom, O.; Guzzella, L. A generic dynamic programming Matlab function. In Proceedings of the 2009 IEEE Control Applications, (CCA) & Intelligent Control, (ISIC), St. Petersburg, Russia, 8–10 July 2009; pp. 1625–1630. [Google Scholar]
  55. Du, Y.; Liu, C.; Li, Y. Velocity Control Strategies to Improve Automated Vehicle Driving Comfort. IEEE Intell. Transp. Syst. Mag. 2018, 10, 8–18. [Google Scholar] [CrossRef]
  56. Luciani, S.; Bonfitto, A.; Amati, N.; Tonoli, A. Model predictive control for comfort optimization in assisted and driverless vehicles. Adv. Mech. Eng. 2020, 12, 1–14. [Google Scholar] [CrossRef]
  57. Anselma, P.; Kollmeyer, P.; Belingardi, G.; Emadi, A. Multitarget Evaluation of Hybrid Electric Vehicle Powertrain Architectures Considering Fuel Economy and Battery Lifetime; SAE Technical Paper 2020-37-0015; SAE International: Warrendale, PA, USA, 2020. [Google Scholar]
  58. Alix, G.; Dabadie, J.; Font, G. An ICE Map Generation Tool Applied to the Evaluation of the Impact of Downsizing on Hybrid Vehicle Consumption; SAE Technical Paper 2015-24-2385; SAE International: Warrendale, PA, USA, 2015. [Google Scholar]
  59. Le Berr, F.; Abdelli, A.; Postariu, D.-M.; Benlamine, R. Design and Optimization of Future Hybrid and Electric Propulsion Systems: An Advanced Tool Integrated in a Complete Workflow to Study Electric Devices. Oil Gas Sci. Technol. 2012, 67, 547–562. [Google Scholar] [CrossRef] [Green Version]
  60. Petit, M.; Marc, N.; Badin, F.; Mingant, R.; Sauvant-Moynot, V. A Tool for Vehicle Electrical Storage System Sizing and Modelling for System Simulation. In Proceedings of the 2014 IEEE Vehicle Power and Propulsion Conference (VPPC), Coimbra, Portugal, 27–30 October 2014; pp. 1–5. [Google Scholar]
  61. Ligterink, N.E.; van Mensch, P.; Cuelenaere, R.F.A.; Hausberger, S.; Leitner, D.; Silberholz, G. Correction Algorithms for WLTP Chassis Dynamometer and Coast-Down Testing; TNO-Report 2015 R10955; TNO: Delft, The Netherlands, 2015. [Google Scholar]
Figure 1. Schematic diagrams of the retained vehicle powertrain architectures, including (a) conventional vehicle (CV) powertrain; (b) battery electric vehicle (BEV) powertrain; (c) parallel P2 hybrid electric vehicle (P2 HEV) powertrain; (d) power-split hybrid electric vehicle (PS HEV) powertrain.
Energies 14 02897 g001
Figure 2. Flowchart of the rule-based hybrid supervisory controller implemented in the parallel P2 HEV and the power-split HEV.
Energies 14 02897 g002
Figure 3. Schematic of the retained car-following driving scenario highlighting the information flow from the preceding vehicle to the following vehicle.
Energies 14 02897 g003
Figure 4. Minimum safety IVD as a function of the following vehicle’s speed and the relative vehicle speed between the preceding vehicle and the following vehicle.
Energies 14 02897 g004
Figure 5. Flowchart of the validation methodology for the proposed optimal V2V vehicle velocity planner considering a CV powertrain (a) and a BEV powertrain (b).
Energies 14 02897 g005
Figure 6. Flowchart of the validation methodology for the proposed optimal V2V vehicle velocity planner considering P2 HEV and PS HEV powertrains.
Energies 14 02897 g006
Figure 7. Overall energy-saving (a) and comfort improvement (b) potential for the following vehicle compared with the preceding vehicle when being controlled by the proposed V2V optimal velocity planner for all retained powertrain categories.
Energies 14 02897 g007
Table 1. Control logic for determining the ICE status.
Controlled ICE Status: ONControlled ICE Status: OFF
Current ICE status: ON( x ˙ x ˙ t h r e O F F )   | ( P O U T P O U T t h r e O F F ) | S O C S O C t h r e O F F ( x ˙ < x ˙ t h r e O F F ) && ( P O U T < P O U T t h r e O F F ) && ( S O C > S O C t h r e O F F )
Current ICE status: OFF( x ˙ x ˙ t h r e O N ) | ( P O U T P O U T t h r e O N ) | S O C S O C t h r e O N ( x ˙ < x ˙ t h r e O N ) && ( P O U T < P O U T t h r e O N ) && ( S O C > S O C t h r e O N )
Table 2. Vehicle and powertrain parameters.
ComponentParameterCVBEVP2 HEVPS HEV
Vehicle bodyMass (kg)1248124812481248
RLA (N)143143143143
RLB (N/(m/s))0.90.90.90.9
RLC (N/(m/s2))0.440.440.440.44
Wheel dynamic
radius (m)
0.2730.2730.2730.273
TransmissionAMT gear ratios (-)(3.58; 2.06; 1.40;
1; 0.71; 0.58)
-(3.58; 2.06; 1.40;
1; 0.71; 0.58)
-
PG ratio (-)---2.6
EM to FD ratio (-)-2.321.26
FD ratio (-)4.13.44.13.27
Efficiency (-)0.90.90.90.85
ICEDisplacement (l)1.2-1.21.2
Max power89 kW @ 4000 rpm-89 kW @ 4000 rpm89 kW @ 4000 rpm
Max torque230 Nm @ 2000 rpm-230 Nm @ 2000 rpm230 Nm @ 2000 rpm
EM1Max power-95 kW @ 14,500 rpm26 kW @ 9000 rpm26 kW @ 9000 rpm
Max torque-147 Nm @ (0–4800 rpm)118 Nm @ (0–2000 rpm)118 Nm @ (0–2000 rpm)
EM2Max power---45 kW @ 9000 rpm
Max torque---204 Nm @ (0–2000 rpm)
Battery packNominal capacity (Ah)-115.56.56.5
Voltage (V)-364310310
Table 3. Results for the preceding and following vehicles.
Drive
Cycle
VehicleParameterCVBEVP2 HEVPS HEV
WLTPPrecedingFuel consumption/battery
energy consumption/EFC
4.27 L/100 km15.39 kWh/100 km4.74 L/100 km5.45 L/100 km
RMS (acceleration) (m/s2)0.530.530.530.53
Following–
Opt_energy
Fuel consumption/battery
energy consumption/EFC
3.87 L/100 km
(−9.2%)
14.54 kWh/100 km
(−5.5%)
4.27 L/100 km
(−9.8%)
4.70 L/100 km
(−13.7%)
RMS (acceleration) (m/s2)0.47
(−10.9%)
0.52
(−2.5%)
0.51
(−4.5%)
0.33
(−38.7%)
Following–
Opt_comfort
Fuel consumption/battery
energy consumption/EFC
4.12 L/100 km
(−3.5%)
14.59 kWh/100 km
(−5.2%)
4.35 L/100 km
(−8.2%)
4.71 L/100 km
(−13.6%)
RMS (acceleration) (m/s2)0.33
(−38.6%)
0.31
(−41.6%)
0.38
(−28.7%)
0.32
(−40.2%)
UDDSPrecedingFuel consumption/battery
energy consumption/EFC
7.50 L/100 km10.80 kWh/100 km4.65 L/100 km4.46 L/100 km
RMS (acceleration) (m/s2)0.620.620.620.62
Following–
Opt_energy
Fuel consumption/battery
energy consumption/EFC
6.67 L/100 km
(−11.1%)
9.91 kWh/100 km
(−8.2%)
4.33 L/100 km
(−6.8%)
4.03 L/100 km
(−9.6%)
RMS (acceleration) (m/s2)0.61
(−2.7%)
0.58
(−7.9%)
0.55
(−11.3%)
0.46
(−27.0%)
Following–
Opt_comfort
Fuel consumption/battery
energy consumption/EFC
7.15 L/100 km
(−4.6%)
9.98 kWh/100 km
(−7.6%)
4.59 L/100 km
(−1.2%)
4.11 L/100 km
(−7.8%)
RMS (acceleration) (m/s2)0.33
(−47.5%)
0.32
(−48.2%)
0.38
(−38.7%)
0.36
(−43.1%)
HWFETPrecedingFuel consumption/battery
energy consumption/EFC
3.82 L/100 km15.22 kWh/100 km4.11 L/100 km4.55 L/100 km
RMS (acceleration) (m/s2)0.300.300.300.30
Following–
Opt_energy
Fuel consumption/battery
energy consumption/EFC
3.71 L/100 km
(−3.0%)
14.95 kWh/100 km
(−1.8%)
3.95 L/100 km
(−3.8%)
4.37 L/100 km
(−4.0%)
RMS (acceleration) (m/s2)0.28
(−6.2%)
0.30
(−0.4%)
0.29
(−2.5%)
0.29
(−3.2%)
Following–
Opt_comfort
Fuel consumption/battery
energy consumption/EFC
3.76 L/100 km
(−1.8%)
14.95 kWh/100 km
(−1.8%)
3.95 L/100 km
(−3.7%)
4.37 L/100 km
(−4.0%)
RMS (acceleration) (m/s2)0.27
(−9.5%)
0.27
(−11.3%)
0.29
(−3.3%)
0.28
(−4.8%)
US06PrecedingFuel consumption/battery
energy consumption/EFC
4.54 L/100 km19.23 kWh/100 km4.78 L/100 km7.30 L/100 km
RMS (acceleration) (m/s2)0.990.990.990.98
Following–
Opt_energy
Fuel consumption/battery
energy consumption/EFC
3.97 L/100 km
(−12.7%)
18.26 kWh/100 km
(−5.0%)
4.46 L/100 km
(−6.6%)
5.69 L/100 km
(−22.1%)
RMS (acceleration) (m/s2)0.84
(−14.4%)
0.94
(−4.2%)
0.94
(−4.3%)
0.58
(−40.4%)
Following–
Opt_comfort
Fuel consumption/battery
energy consumption/EFC
4.08 L/100 km
(−10.3%)
18.30 kWh/100 km
(−4.9%)
4.51 L/100 km
(−5.6%)
5.70 L/100 km
(−21.9%)
RMS (acceleration) (m/s2)0.60
(−39.3%)
0.61
(−38.4%)
0.59
(−40.4%)
0.58
(−40.7%)
Publisher’s Note: MDPI stays neutral with regard to jurisdictional claims in published maps and institutional affiliations.