
Influence of Clearance Flow on Dynamic Hydraulic Forces of Pump-Turbine during Runaway Transient Process


Abstract

1. Introduction
2. CFD Simulation Methods for the Pump-Turbine
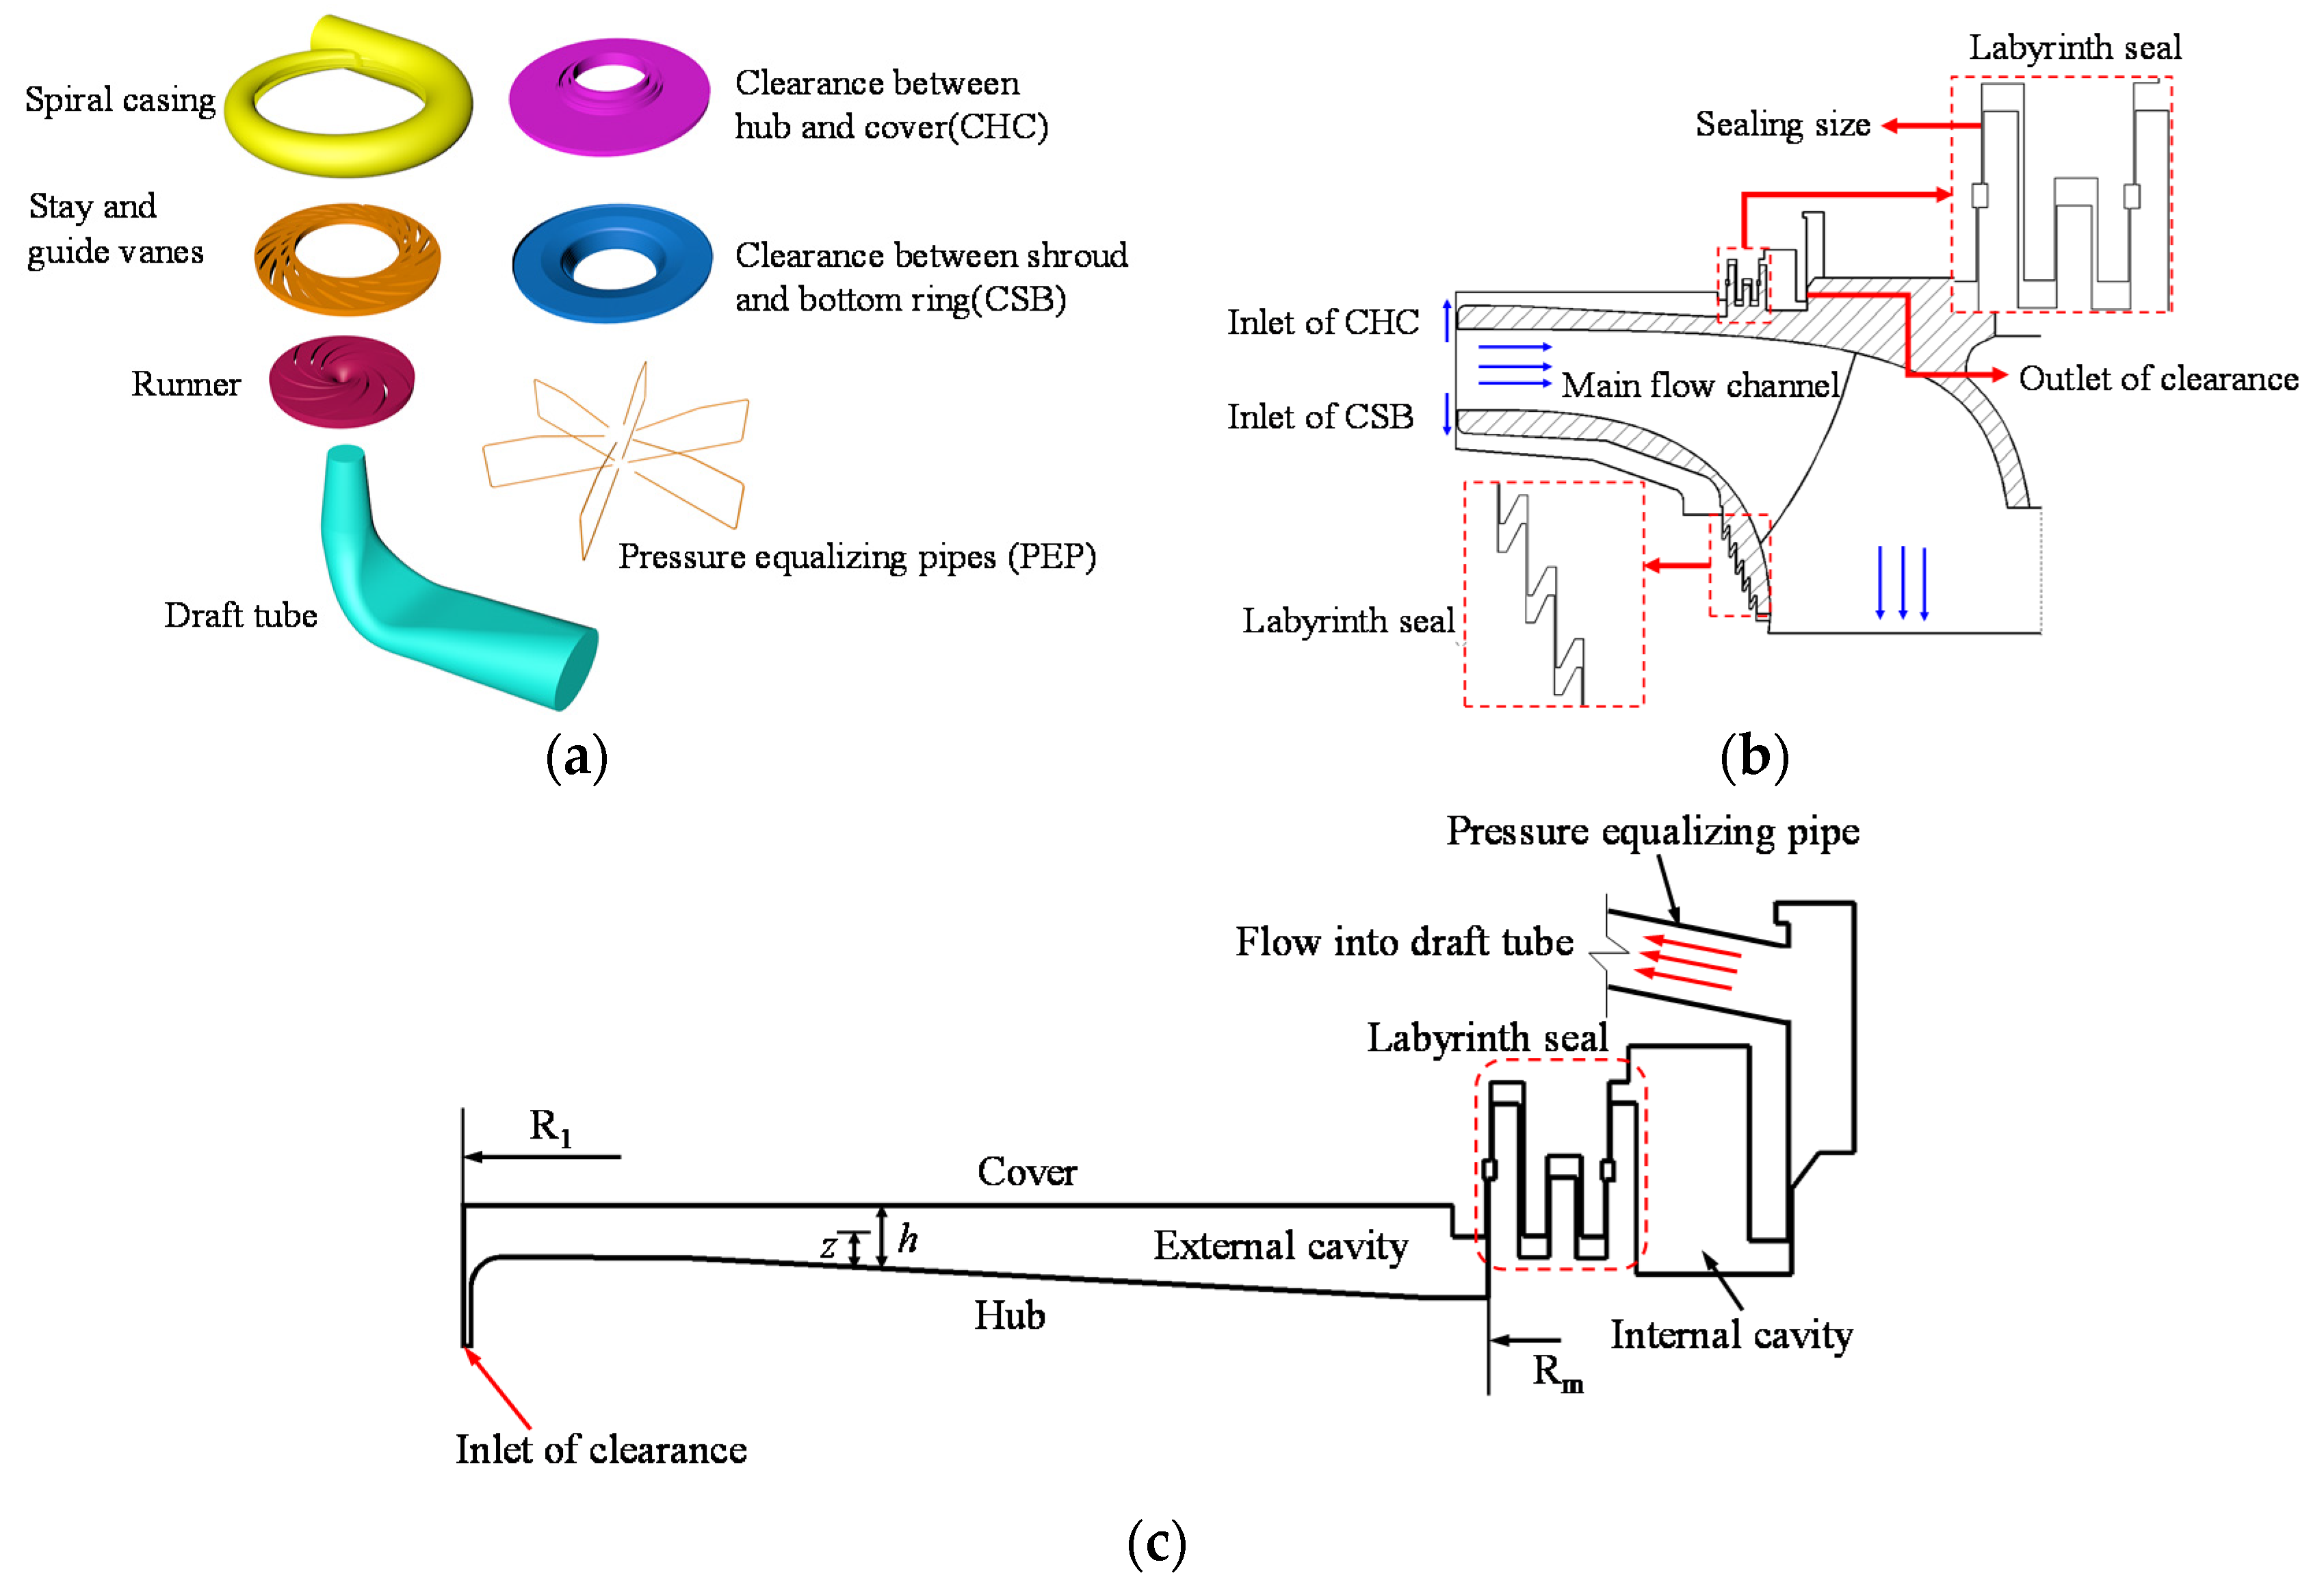
2.1. Pump-Turbine Model
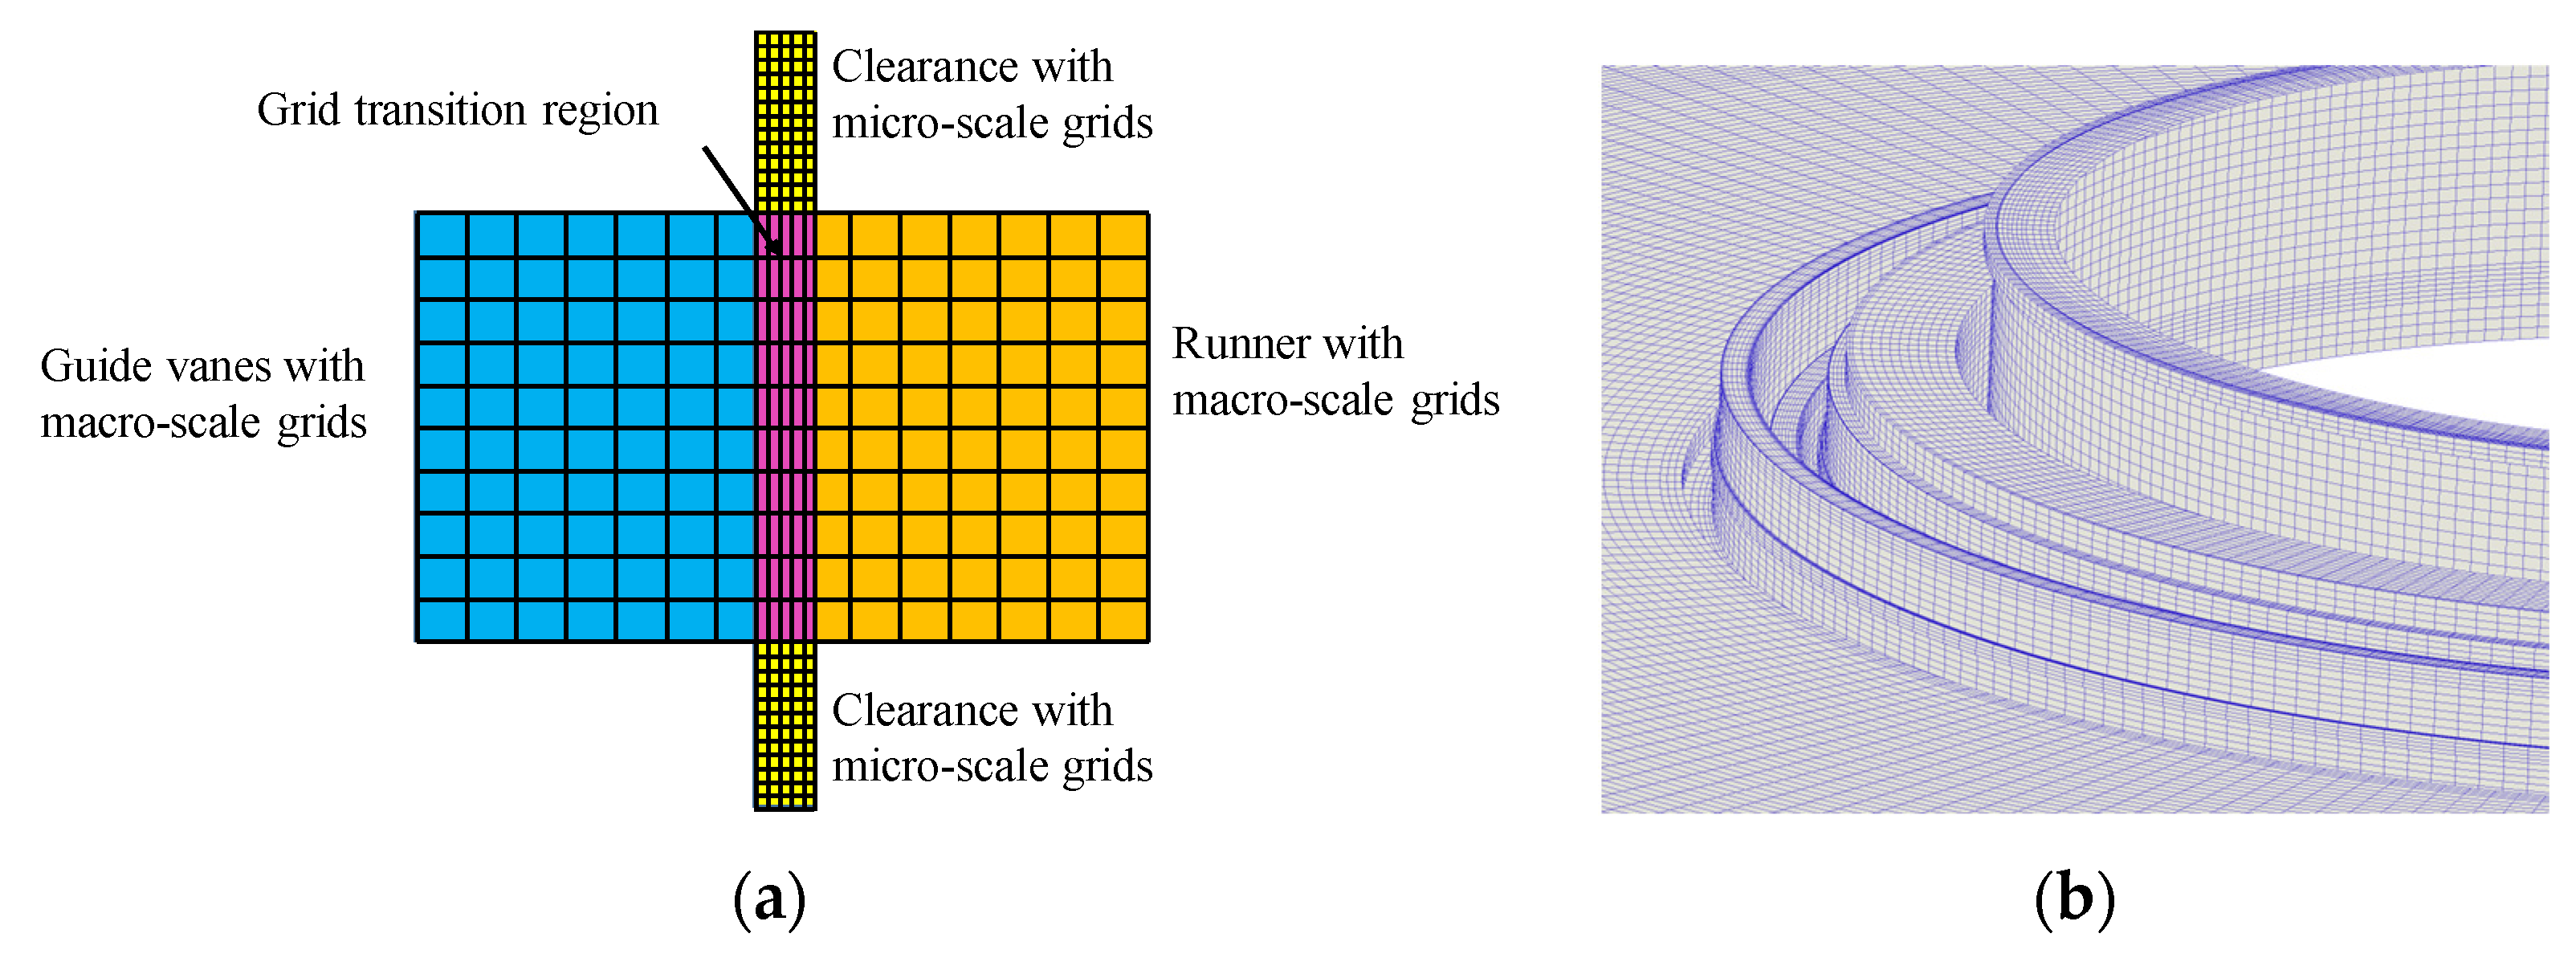
2.2. Multi-Scale Grid Coupling
2.3. Grid Independence Verification
2.4. Numerical Methods
- (1)
- Boundary conditions
- (2)
- Rotational speed
- (3)
- Definition of dimensionless parameters
3. Clearance Force and Flow Results
3.1. Macro Parameters during the Runaway Transient Process
3.2. Runner Force Oscillating Characteristics
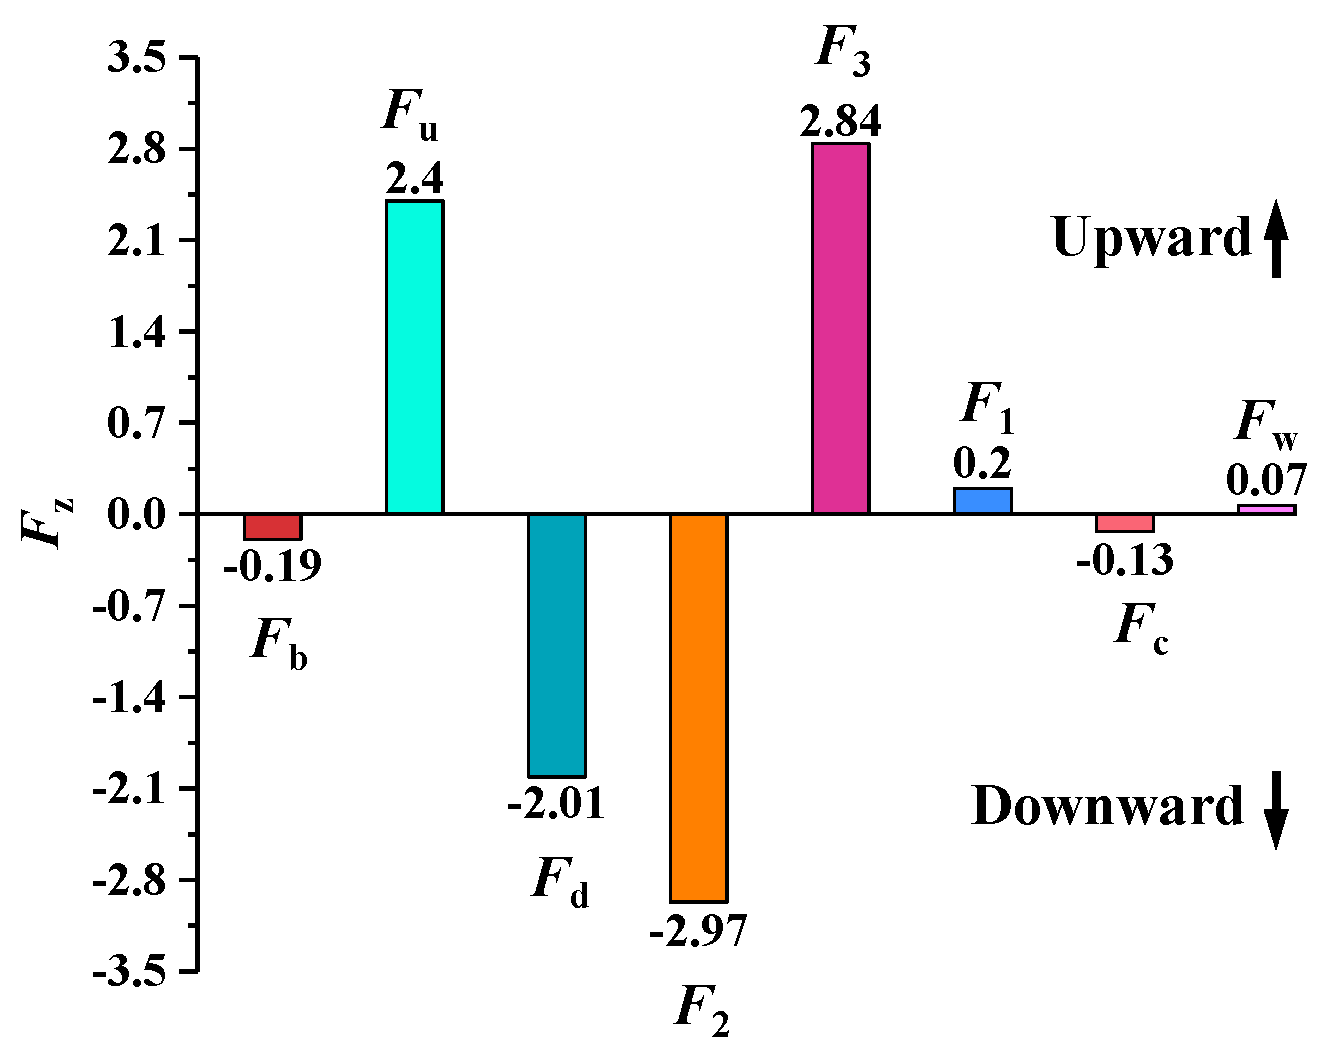
3.2.1. Axial Forces
- (1)
- Axial hydraulic force in MFC—
- (2)
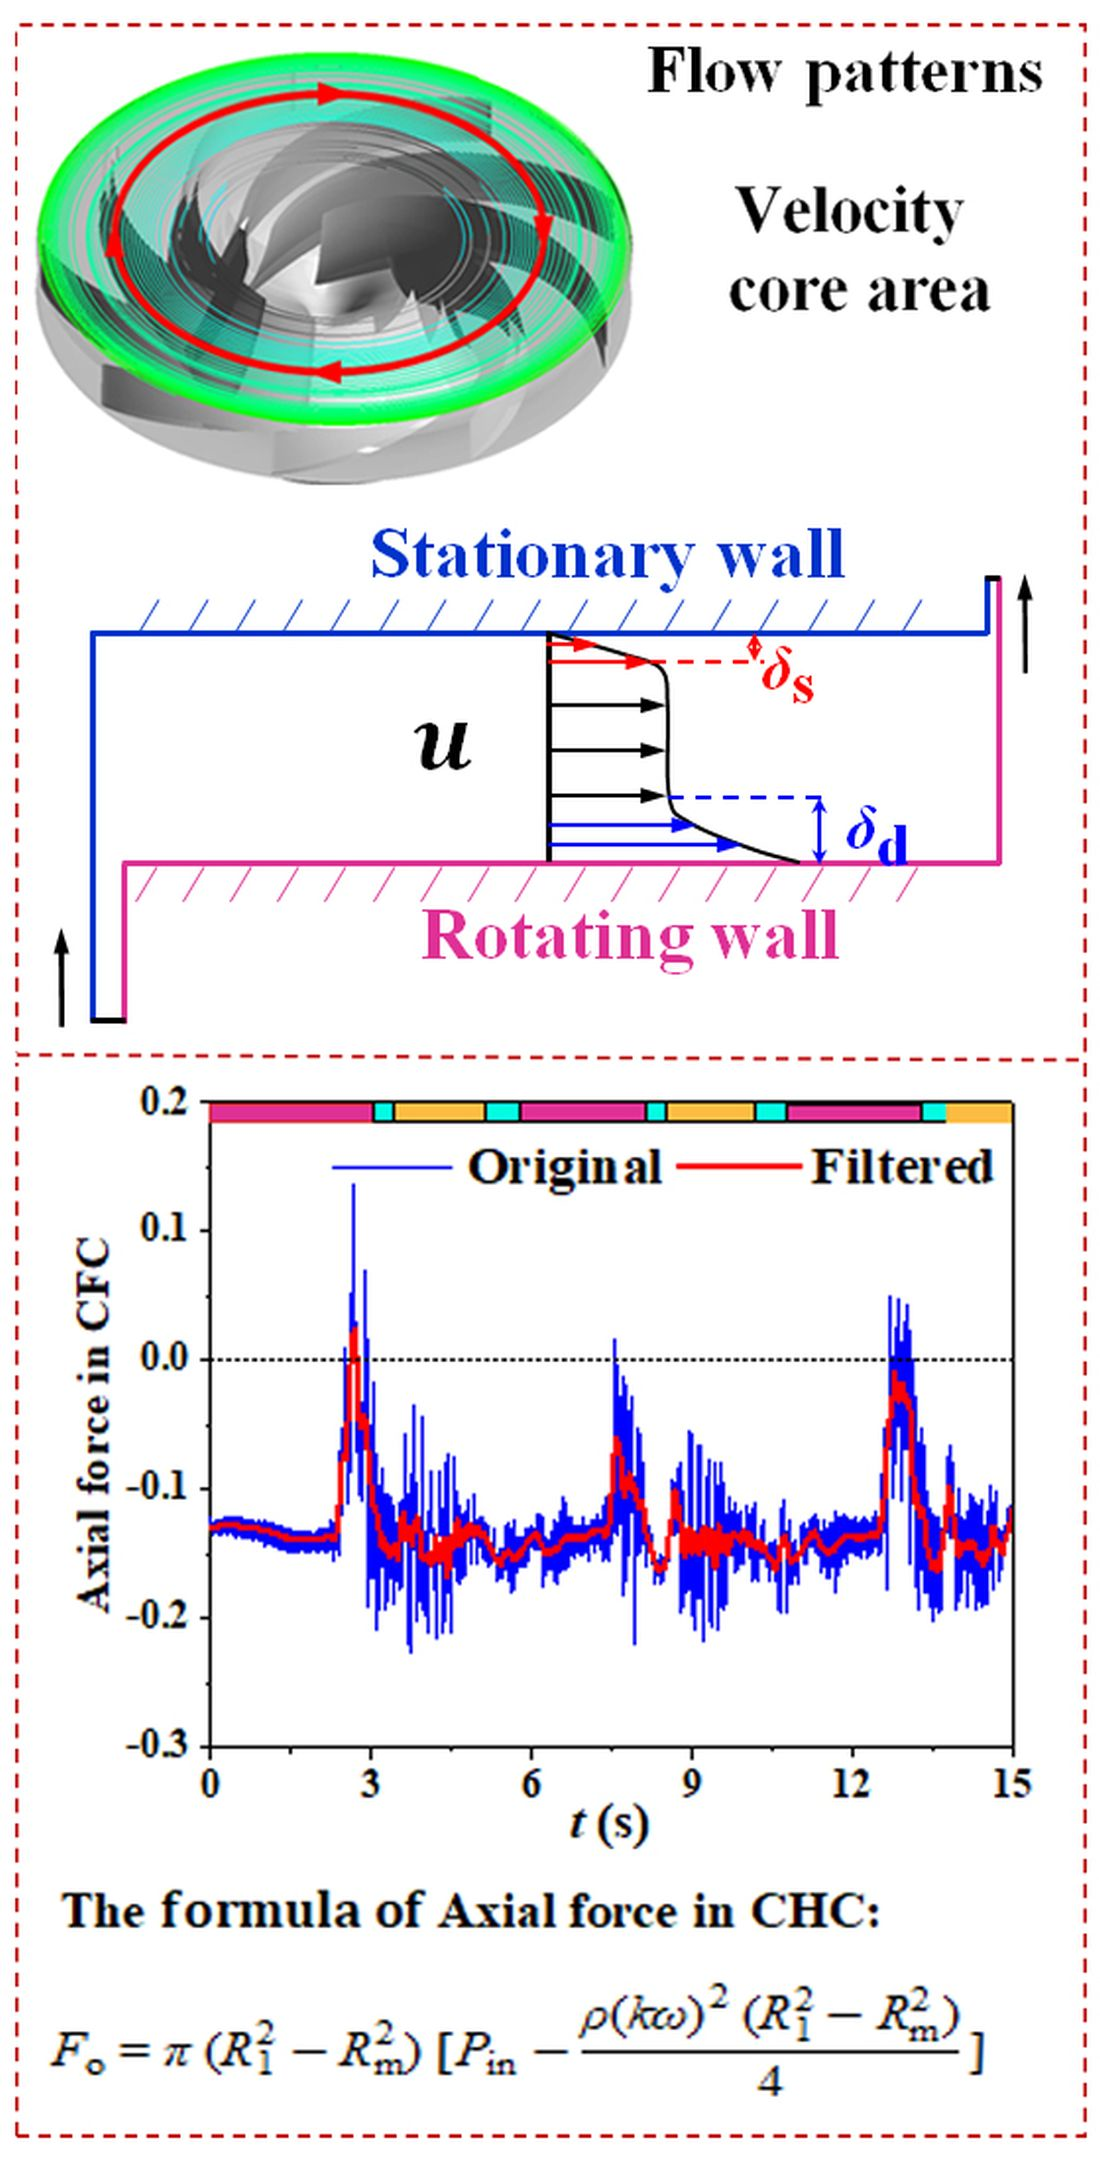
- Axial hydraulic forces in CFC— and
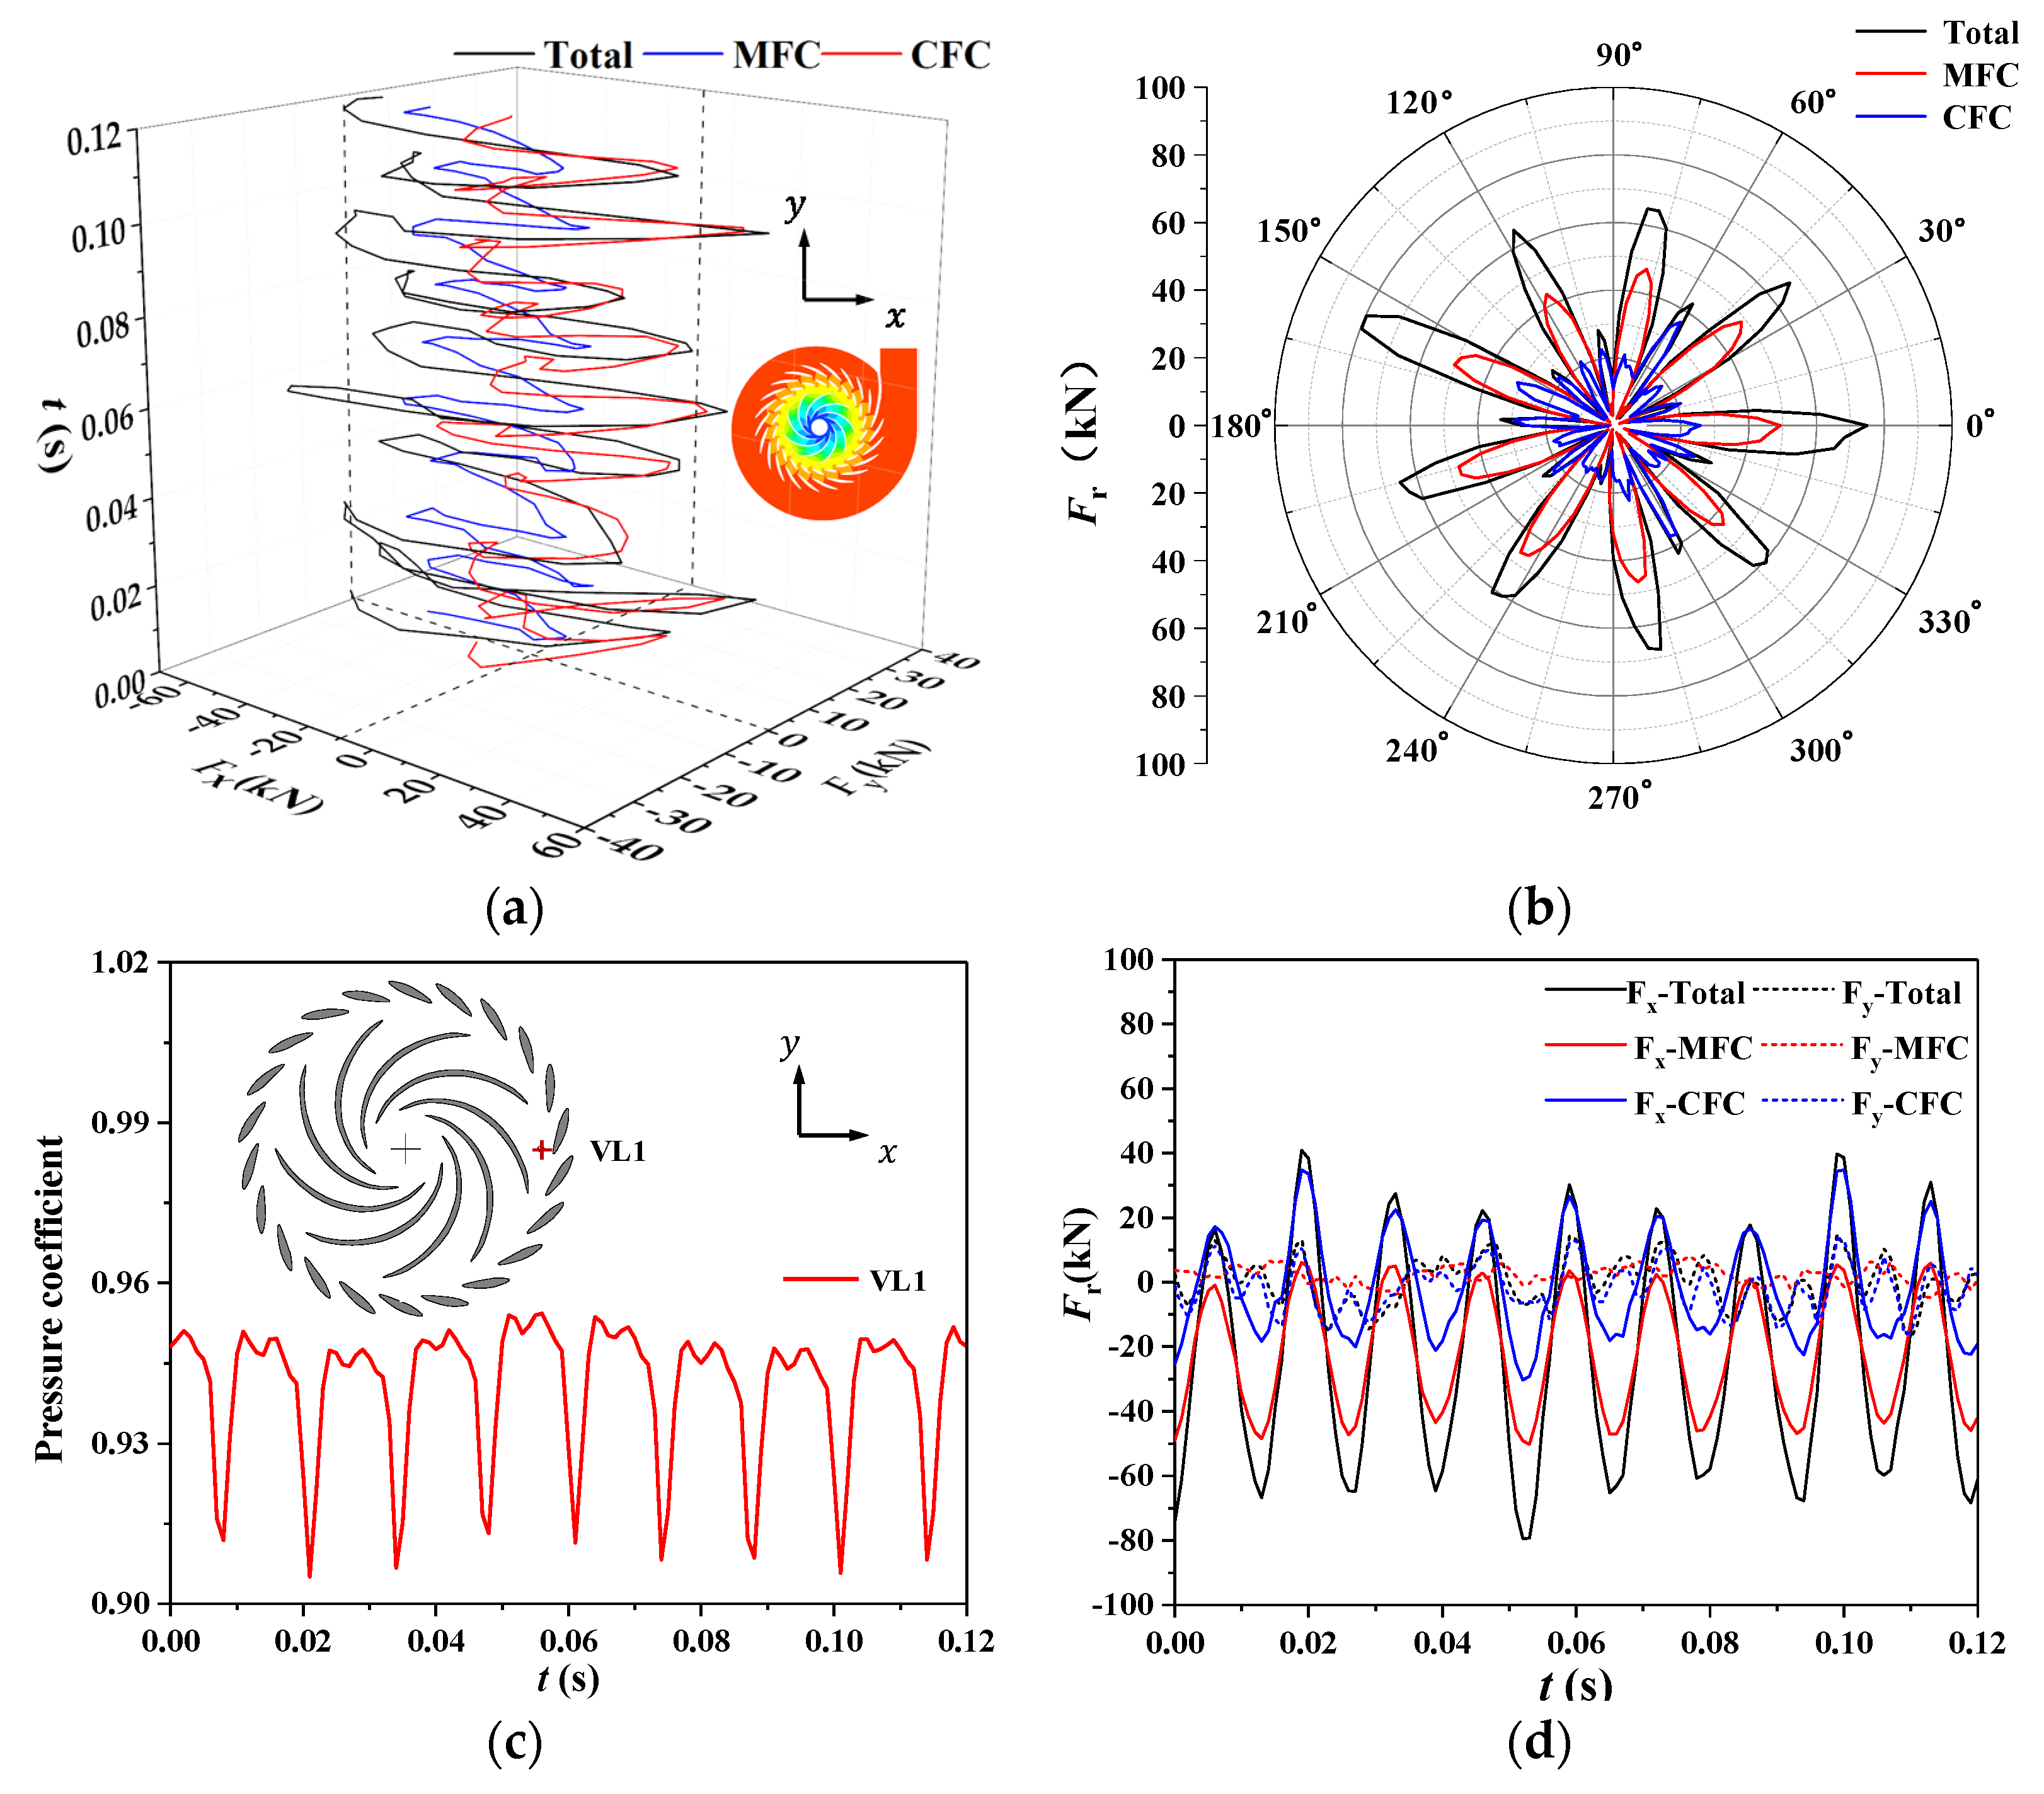
3.2.2. Radial Forces
3.3. Pressure Distribution in CHC and Its Formulation
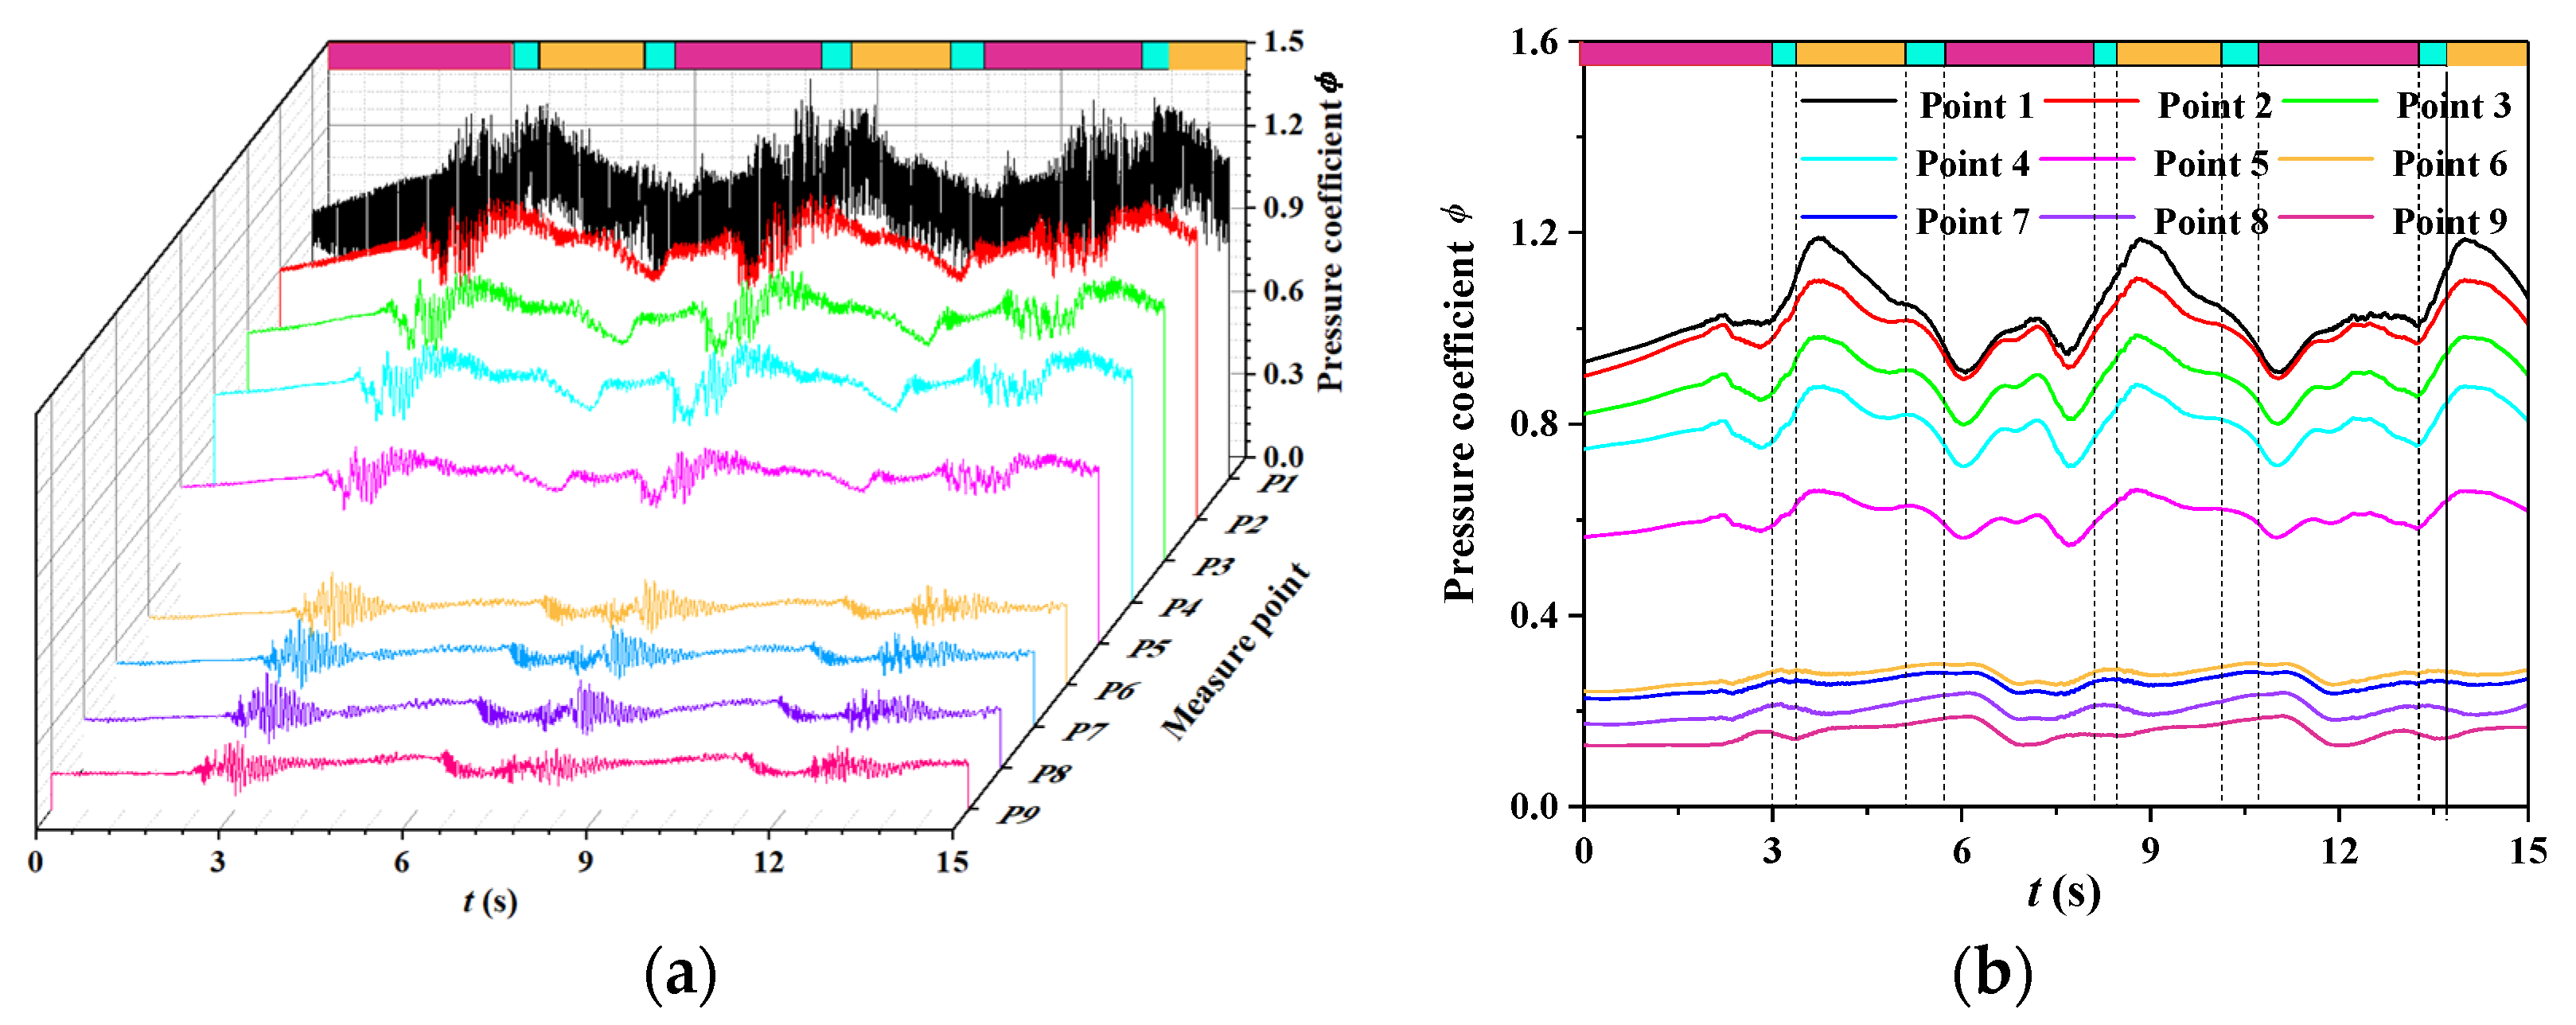
3.3.1. Pressure Distribution in CHC
3.3.2. Pressure Calculation in CHC
3.3.3. Axial Force Formula
3.4. Flow Patterns in the Clearance Region
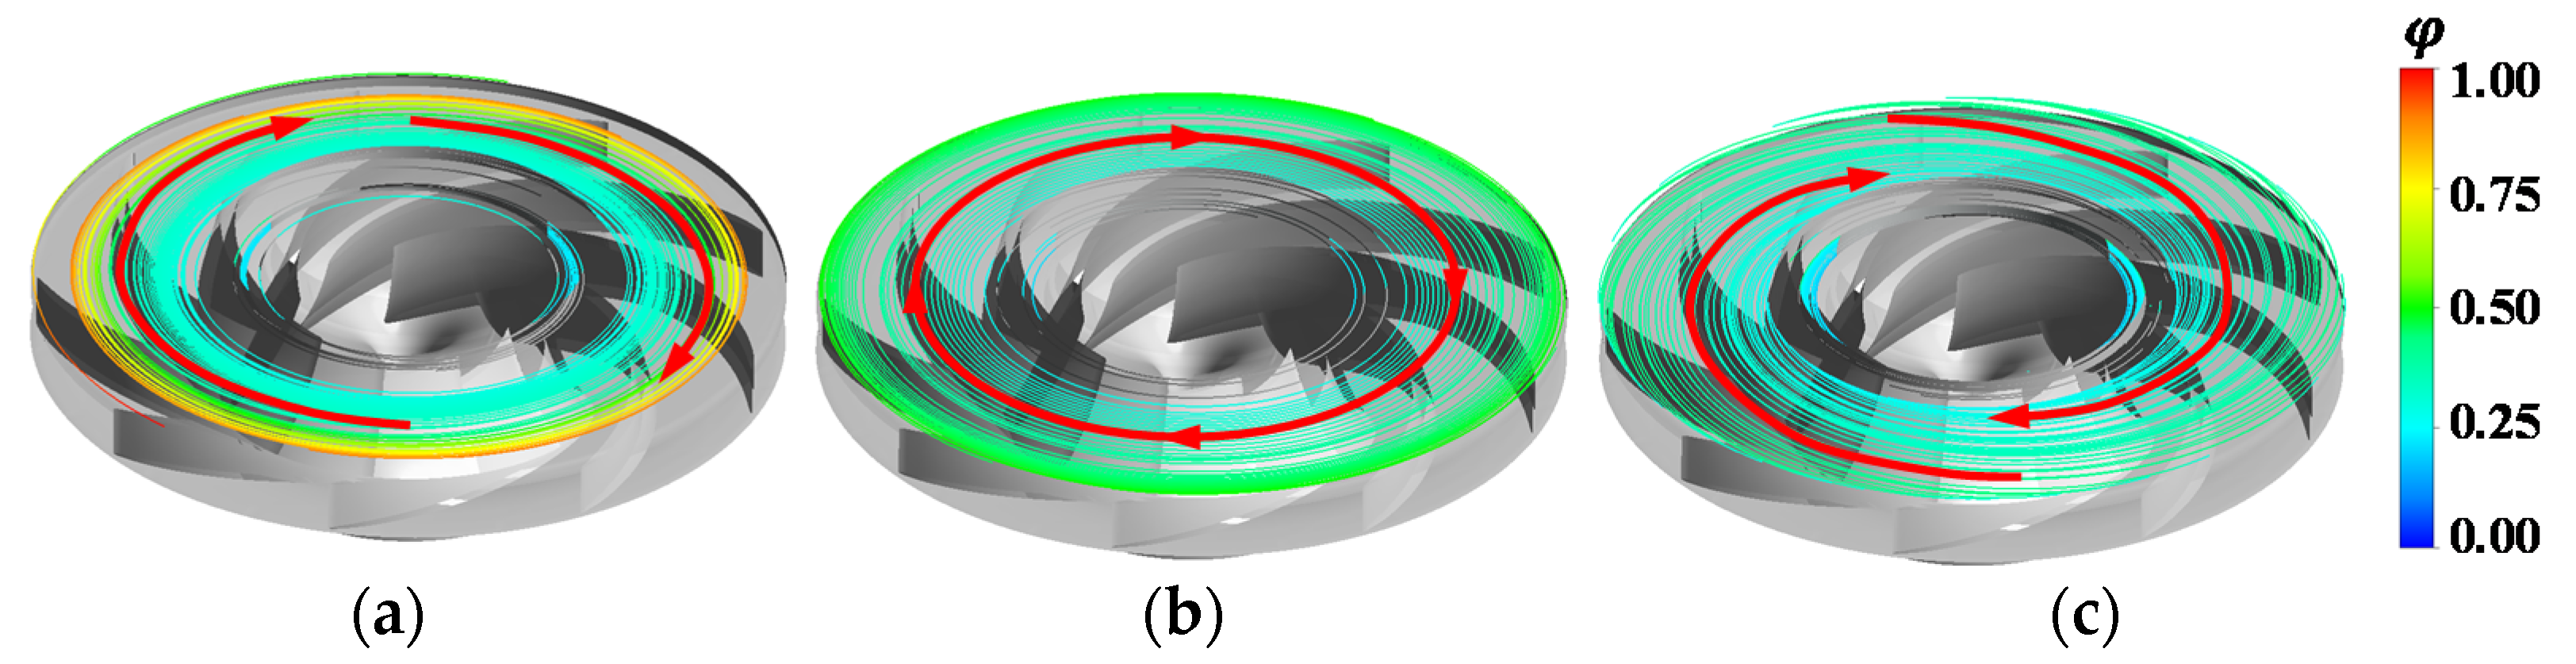
3.4.1. Streamline Distribution in Clearance Region
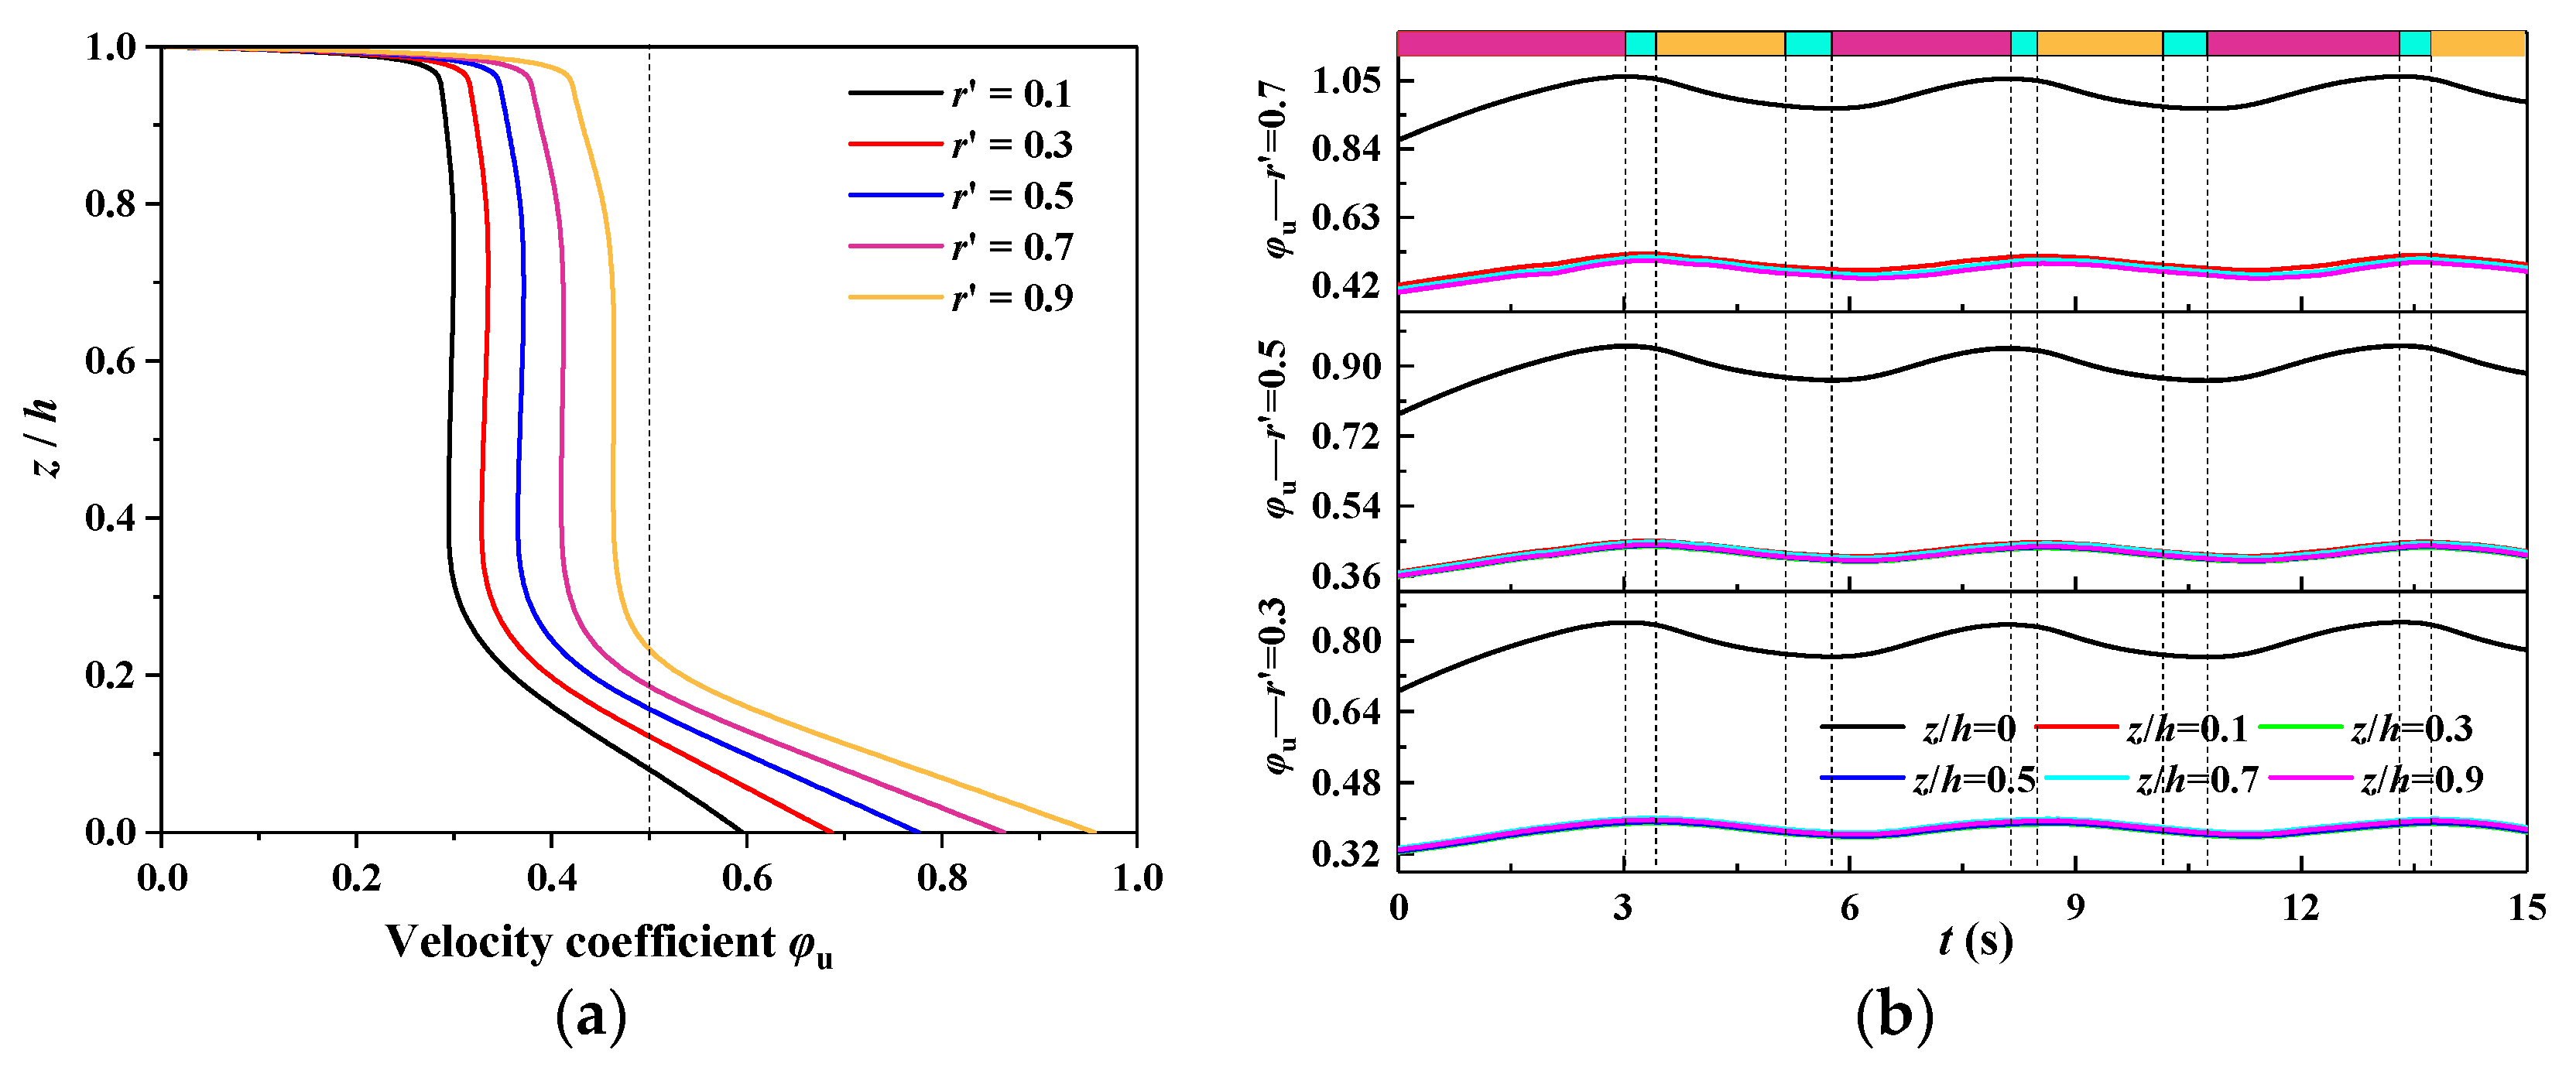
3.4.2. Velocity Distribution in the Clearance Region
- (1)
- Circumferential velocity distribution
- (2)
- Radial velocity distribution
4. Conclusions
Author Contributions
Funding
Institutional Review Board Statement
Informed Consent Statement
Data Availability Statement
Acknowledgments
Conflicts of Interest
Abbreviations
| MFC | Main Flow Channel (-) |
| CFC | clearance flow channel (-) |
| CHC | clearance between the hub and the cover (-) |
| CSB | clearance between the shroud and the bottom ring (-) |
| specific speed (m,) | |
| guide vane height (m) | |
| rated rotational speed | |
| rated discharge () | |
| rated output | |
| rated head | |
| diameter of the runner inlet | |
| diameter of the runner outlet | |
| number of blades (-) | |
| number of guide vanes (-) | |
| number of stay vanes (-) | |
| rotational speed at current timestep (l/s) | |
| rotational speed at previous timestep (l/s) | |
| time step size (s) | |
| hydraulic torque (Nm) | |
| moment of inertia (kgm2) | |
| density of water | |
| rated rotational speed (l/s) | |
| radius of the runner inlet (m) | |
| radius of runner outlet (m) | |
| circumferential velocity | |
| v | flow velocity |
| radius of the clearance area (m) | |
| radius at the inlet of the sealing ring in CHC (m) | |
| z | distance from the hub upper surface to the external cavity (m) |
| h | height of external cavity in CHC (m) |
| unit rotational speed () | |
| unit discharge () | |
| Moment during the runaway process (N ▪ m) | |
| n | rotational speed during the runaway process (rpm) |
| axial hydraulic force in MFC (kN) | |
| axial hydraulic force in CHC (kN) | |
| axial hydraulic force in CSB (kN) | |
| runner self-weight (kN) | |
| buoyancy force acting on the runner (kN) | |
| axial force acting on the shaft end (kN) | |
| axial hydraulic force generated by the water flow (kN) | |
| axial force acting on the hub lower surface (kN) | |
| axial force acting on the blades (kN) | |
| axial force acting on the shroud upper surface (kN) | |
| axial force in CFC, includes and (kN) | |
| axial force acting on the water body exerted by the runner (kN) | |
| axial force acting on the runner outlet surface (kN) | |
| discharge | |
| cross-sectional area of the runner outlet | |
| pressure at the inlet of CHC (kPa) | |
| pressure (kPa) | |
| pressure drop in CHC (kPa) | |
| axial force in the external cavity (kN) | |
| radial force (kN) | |
| radial force in the-direction (kN) | |
| radial force in the-direction (kN) | |
| radial reference force (kN) | |
| axial reference force(kN) | |
| original axial force (kN) | |
| original radial force (kN) | |
| dimensionless axial force(-) | |
| dimensionless radial force(-) | |
| pressure coefficient | |
| circumferential velocity coefficient | |
| radial velocity coefficient |
References
- Landry, M.; Gagnon, Y. Energy Storage: Technology Applications and Policy Options. Energy Procedia 2015, 79, 315–320. [Google Scholar] [CrossRef]
- Kong, Y.; Kong, Z.; Liu, Z.; Wei, C.; Zhang, J.; An, G. Pumped storage power stations in China: The past, the present, and the future. Renew. Sustain. Energy Rev. 2017, 71, 720–731. [Google Scholar] [CrossRef]
- Yao, Z.; Bi, H.; Zhuang, X.; Huang, Q.; Zhi, F.; Wang, Z. Simulation and analysis of transient process for Guangzhou pumped storage power plant A. J. Hydroelectr. Eng. 2015, 34, 176–181. (In Chinese) [Google Scholar]
- Goyal, R.; Gandhi, B.K. Review of hydrodynamics instabilities in Francis turbine during off-design and transient operations. Renew. Energy 2018, 116, 697–709. [Google Scholar] [CrossRef]
- Cai, J.; Zhou, X.; Deng, L.; Zhang, W. The research of the abnormal water hammer phenomenon based on the unit 3 over speed test of Jiangsu Yixing pumped storage power Station. Water Power 2009, 2, 76–79. (In Chinese) [Google Scholar]
- Le, Z.; Kong, L. Cause analysis on rotating part lifting of Unit 2 in Tianhuangping Pumped Storage Plant. Mech. Electr. Tech. Hydropower Stn. 2005, 28, 11–14. (In Chinese) [Google Scholar]
- Wei, B.; Ji, C. Study on rotor operation stability of high-speed large-capacity generator-motor: The accident of rotor pole in Huizhou pumped-storage power station. Water Power 2010, 36, 57–60. (In Chinese) [Google Scholar]
- Dai, Y.; Wang, H.; Zhang, K.; Zheng, L.; You, G.; Kong, L.; Zhu, X.; Lou, Y. Research on axial hydraulic thrust of Francis pump-turbine’s runner. J. Hydroelectr. Eng. 2005, 24, 105–113. (In Chinese) [Google Scholar]
- Xia, L.; Cheng, Y.; You, J.; Zhang, X.; Yang, J.; Qian, Z. Mechanism of the S-Shaped Characteristics and the Runaway Instability of Pump-Turbines. J. Fluids Eng. 2016, 139, 031101. [Google Scholar] [CrossRef]
- Xia, L.; Cheng, Y.; Yang, Z.; You, J.; Yang, J.; Qian, Z. Evolutions of Pressure Fluctuations and Runner Loads During Runaway Processes of a Pump-Turbine. J. Fluids Eng. 2017, 139, 091101. [Google Scholar] [CrossRef]
- Yang, Z.; Cheng, Y.; Xia, L.; Meng, W.; Liu, K.; Zhang, X. Evolutions of flow patterns and pressure fluctuations in a prototype pump-turbine during the runaway transient process after pump-trip. Renew. Energy 2020, 152, 1149–1159. [Google Scholar] [CrossRef]
- Widmer, C.; Staubli, T.; Ledergerber, N. Unstable Characteristics and Rotating Stall in Turbine Brake Operation of Pump-Turbines. J. Fluids Eng. 2011, 133, 041101. [Google Scholar] [CrossRef]
- Fu, X.L.; Li, D.Y.; Wang, H.J.; Zhang, G.H.; Wei, X.Z.; Qin, D.Q. Investigation on the fluctuation of hydraulic exciting force on a pump-turbine runner during the load rejection process. IOP Conf. Ser. Earth Environ. Sci. 2018, 163, 012101. [Google Scholar] [CrossRef]
- Huang, L.; Huang, P.; Cheng, G.; Li, M.; Liu, Y. Numerical simulation of flow field and leakage rate in labyrinth seal. Hunan Electr. Power 2007, 27, 1–4. (In Chinese) [Google Scholar]
- Le Roy, V.; Guibault, F.; Vu, T.C. Validation of a CFD model for hydraulic seals. Int. J. Fluid Mach. Syst. 2009, 2, 400–408. [Google Scholar] [CrossRef][Green Version]
- Kim, T.S.; Cha, K.S. Comparative analysis of the influence of labyrinth seal configuration on leakage behavior. J. Mech. Sci. Technol. 2009, 23, 2830–2838. [Google Scholar] [CrossRef]
- Jia, X.; Zheng, Q.; Jiang, Y.; Zhang, H. Leakage and rotor dynamic performance of T type labyrinth seal. Aerosp. Sci. Technol. 2019, 88, 22–31. [Google Scholar] [CrossRef]
- Zhao, W.; Nielsen, T.K.; Billdal, J.T. Effects of cavity on leakage loss in straight-through labyrinth seals. IOP Conf. Ser. Earth Environ. Sci. 2010, 12, 012002. [Google Scholar] [CrossRef]
- Wang, W.; Su, S.; Yan, Y. Study on comb labyrinth seals of Francis turbine at different Reynolds. Appl. Mech. Mater. 2014, 444, 423–426. [Google Scholar] [CrossRef]
- Koirala, R.; Zhu, B.; Neopane, H.P. Effect of Guide Vane Clearance Gap on Francis Turbine Performance. Energies 2016, 9, 275. [Google Scholar] [CrossRef]
- Dong, Z. Numerical Analysis of Clearance Flow in Francis Pump-Turbine. Master’s Thesis, Lanzhou University of Technology, Lanzhou, China, 2013. (In Chinese). [Google Scholar]
- Jürgen, S.; Helmut, B.; Helmut, J. Analysis of the leakage behavior of Francis turbines and its impact on the hydraulic efficiency—A validation of an analytical model based on computational fluid dynamics results. J. Fluids Eng. 2017, 139, 021106. [Google Scholar]
- Čelič, D.; Ondráčka, H. The influence of disc friction losses and labyrinth losses on efficiency of high head Francis turbine. J. Phys. Conf. Ser. 2015, 579, 012007. [Google Scholar] [CrossRef]
- Wu, G.; Zhang, K.; Dai, Y. Influence of the runner gap and seal construction on the safety in operation of Francis water power sets. Large Electr. Mach. Hydraul. Turbine 2005, 1, 44–48. (In Chinese) [Google Scholar]
- Wu, G.; Zhang, K.; Dai, Y.; Sun, J. Influences of the leakage rate of low specific speed Francis runner on phenomenon of the lifting hydroelectric generator set. J. Hydroelectr. Eng. 2004, 23, 106–111. (In Chinese) [Google Scholar]
- Fu, X.; Li, D.; Wang, H.; Zhang, G.; Li, Z.; Wei, X. Influence of the clearance flow on the load rejection process in a pump-turbine. Renew. Energy 2018, 127, 310–321. [Google Scholar] [CrossRef]
- Zhang, J. Numerical Simulation of Multi-Scale Flows in Francis Turbine and Research on Hydraulic Stability of Transient Processes. Master’s Thesis, Hohai University, Nanjing, China, 2017. (In Chinese). [Google Scholar]
- Liu, D.; Zhang, X.; Yang, Z.; Liu, K.; Cheng, Y. Evaluating the pressure fluctuations during load rejection of two pump-turbines in a prototype pumped-storage system by using 1D-3D coupled simulation. Renew. Energy 2021, 171, 1276–1289. [Google Scholar] [CrossRef]
- Yang, Z.; Liu, Z.; Cheng, Y.; Zhang, X.; Liu, K.; Xia, L. Differences of Flow Patterns and Pressure Pulsations in Four Prototype Pump-Turbines During Runaway Transient Processes. Energies 2020, 13, 5269. [Google Scholar] [CrossRef]
- Dörfler, P.; Lohmberg, A.; Michler, W.; Sick, M. Investigation of Pressure Pulsation and Runner Forces in a Single-Stage Reversible Pump Turbine Model. In Proceedings of the 11th IAHR International Meeting of the Workgroup on the Behaviour Machinery and Steady Oscillatory Conditions, Stuttgart, Germany, 8–10 October 2003. [Google Scholar]
- Dörfler, P.; Sick, M.; Coutu, A. Flow-Induced Pulsation and Vibration in Hydroelectric Machinery; Springer: London, UK, 2013. [Google Scholar]
- Batchelor, G.K. Note on a Class of Solutions of the Navier-Stokes Equations Representing Steady Rotationally-Symmetric Flow. Q. J. Mech. Appl. Math. 1951, 4, 29–41. [Google Scholar] [CrossRef]
- Mukherjee, A.; Steinberg, V. Von Kármán swirling flow between a rotating and a stationary smooth disk: Experiment. Phys. Rev. Fluids 2018, 3, 014102. [Google Scholar] [CrossRef]
- Singh, A. Theoretical Investigation on Inflow between Two Rotating Disks. J. Fluids Eng. 2017, 139, 111202. [Google Scholar] [CrossRef]


| Parameter | Value | Parameter | Value |
|---|---|---|---|
| Specific speed (m,) | 30.5 | Guide vane height | 0.3 |
| Rotational speed | 500 | Blade number | 9 |
| Rated discharge | 62.43 | Guide vane number | 22 |
| Rated output | 357 | Stay vane number | 22 |
| Rated head | 655 | Sealing size of CHC (mm) | 1.4 |
| Runner inlet diameter | 4.260 | Sealing size of CSB (mm) | 1.6 |
| Runner outlet diameter | 1.955 | Level of the sealing ring | 7 |
| Domains | Spiral-Casing | Vanes | Transition Region | Runner |
| number | 0.71 | 1.06 | 0.16 | 0.75 |
| Domains | Draft-Tube | CHC | CSB | PEP |
| number | 0.81 | 0.74 | 0.60 | 0.34 |
Publisher’s Note: MDPI stays neutral with regard to jurisdictional claims in published maps and institutional affiliations. |
© 2021 by the authors. Licensee MDPI, Basel, Switzerland. This article is an open access article distributed under the terms and conditions of the Creative Commons Attribution (CC BY) license (https://creativecommons.org/licenses/by/4.0/).
Share and Cite
Hou, X.; Cheng, Y.; Yang, Z.; Liu, K.; Zhang, X.; Liu, D. Influence of Clearance Flow on Dynamic Hydraulic Forces of Pump-Turbine during Runaway Transient Process. Energies 2021, 14, 2830. https://doi.org/10.3390/en14102830
Hou X, Cheng Y, Yang Z, Liu K, Zhang X, Liu D. Influence of Clearance Flow on Dynamic Hydraulic Forces of Pump-Turbine during Runaway Transient Process. Energies. 2021; 14(10):2830. https://doi.org/10.3390/en14102830
Chicago/Turabian StyleHou, Xiaoxia, Yongguang Cheng, Zhiyan Yang, Ke Liu, Xiaoxi Zhang, and Demin Liu. 2021. "Influence of Clearance Flow on Dynamic Hydraulic Forces of Pump-Turbine during Runaway Transient Process" Energies 14, no. 10: 2830. https://doi.org/10.3390/en14102830
APA StyleHou, X., Cheng, Y., Yang, Z., Liu, K., Zhang, X., & Liu, D. (2021). Influence of Clearance Flow on Dynamic Hydraulic Forces of Pump-Turbine during Runaway Transient Process. Energies, 14(10), 2830. https://doi.org/10.3390/en14102830