Abstract
The knowledge of the air velocity distribution in the supply jets is essential when designing ventilation and air conditioning systems. In this study, we tested and analyzed the velocity distributions in the radial wall jets—these jets are commonly used in ventilated rooms. Tests included jets from two ceiling diffusers of different constructions, at three airflow rates. The mean air speed distributions were measured with a 16-channel hot-sphere anemometer both in the self-similarity zone and in the terminal zone. A specially developed method of converting the mean speed to mean velocity was used. The measurement results show that the spread coefficients of the jets from both diffusers were the same, but the positions of the virtual origin were different. Due to the friction of the jet with the ceiling and the transfer of momentum to the recirculating flows, the momentum flux in the self-similarity zone decreased by up to 50%. An improved method for calculating velocity distributions in radial wall jets was developed and validated. This method takes into account the decrease of momentum, non-zero position of the jet origin, and faster velocity decrease in the terminal zone. A reliable method of predicting air velocity distribution in radial wall jets (RWJs) from ceiling diffusers may allow to properly select the diffuser size, its location, and the range of flow rate changes. The design process for variable air volume systems can be facilitated.
1. Introduction
The air distribution in ventilated rooms depends on the number, type, size, and location of the diffusers, and the velocity, direction, and turbulence intensity of the supplied air. The current review of air distribution methods is presented in the paper [1]. After a period of decline in interest in air-only central air conditioning systems, these systems have been improved and are again frequently used. Due to advanced design methods and optimal control strategies, it is possible to obtain high-performance systems with variable air volume (HP VAV). HP VAV systems can be as energy efficient as dedicated outdoor air systems (DOASs), but they are more advantageous in terms of investment and operational costs [2,3,4,5]. In the case of HP VAV systems, during periods of low occupancy resulting in decreased heat load and reduced bioeffluents concentration, the airflow should be reduced to the lowest possible value. A significant decrease in the supply airflow decreases the throw length of the jets, which affects air distribution in the room. In cooling mode, this may cause cold air dumping, i.e., the jet detachment from the ceiling and flowing of cold air directly to the occupied zone. In heating mode, this may deteriorate the air mixing in the room, decrease the air change effectiveness, and increase the thermal stratification. The maximum value of the supply airflow from diffusers is limited by noise. The review of technical data of ceiling diffusers of leading European manufacturers showed that to ensure the noise level below 40 dB, the maximum air velocity at the spigot of the plenum box should not exceed 4–6 m/s. The review also showed that, with a supply air temperature within ±10 K of the room temperature, the supply airflow rate can be reduced typically to approx. 45% and at most to 33%. The knowledge on the air velocity distribution in the supplied jets at different airflow rates is crucial when diffusers are selected.
In this study, we tested and analyzed the velocity distributions in the radial wall jets (RWJs), which are common flow elements in many ventilated rooms. Tests included jets from two ceiling diffusers of different constructions at three airflow rates. Velocity distributions were measured in self-similarity and terminal zones. The tested radial wall jets were generated by multi-cone and plate diffusers. For multi-cone diffusers, the mixing of room air and supply air starts within the diffuser. Plate diffusers supply radial jets from a cylindrical opening and turbulent mixing starts at a higher radial distance than the radius of the diffuser. As a consequence of these differences, in the near field region, the width of the jet from the multi-cone diffuser is higher than from the plate one. As a result of friction of the RWJ against the ceiling and transfer of momentum to the recirculating flows, the momentum flux decreases with the distance from the diffuser. The often-used assumption of a constant value of the momentum flux can hardly be accurate. To correctly model the air velocity distribution in RWJs, the calculation method should take into account both the momentum flux decrease with radial distance and the non-zero position of the virtual origin. The throw length of the jet is the distance from the diffuser at which the maximum velocity drops to the assumed value, typically in the range 0.1–0.5 m/s. It is the most important parameter of the jet when designing the air distribution in a room. In RWJs the terminal zone occurs in the region where the maximum mean velocity is lower than approx. 0.35 m/s. In that zone, a faster decrease in maximum velocity is observed. It should be also taken into account in the calculation method of air velocity in RWJs.
1.1. Summary of Previous Studies
Radial wall jets radially distribute air along the flat, solid surface. RWJs can be produced in different ways: by discharging air through the slot between a circular disc and a flat surface, Figure 1a, and by supplying the air from the diffuser, Figure 1b. RWJs can be also generated by circular jet impinging on the surface (3rd region of the impinging jet).
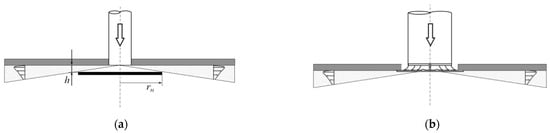
Figure 1.
Radial wall jets (RWJs) produced by (a) discharging a fluid through the slot between a circular disc and a flat surface and (b) issuing the air from the diffuser.
RWJs have been studied for many years using different, more and more advanced measurement techniques. One of the first studies of RWJs was performed by Bakke [6] and Bradshaw and Love [7]. In these tests, the velocity was measured using a Pitot tube. The results show that distributions of mean velocity are similar in the direction normal to the wall, the jet spreads linearly, and maximum velocity is inversely proportional to the radial distance. The earliest experimental studies of the velocity distribution in RWJs were conducted and analyzed by Rajaratnam [8]. Analyzing equations of motion and continuity, he found that the jet momentum flux is preserved.
The first measurement results of the turbulence in RWJs were presented in [9]. The measurements were performed using a hot-wire anemometer. The results confirm previous results regarding the mean velocity distribution and show the similarity of RMS distributions of streamwise (radial) velocity fluctuations. Measurements of streamwise velocity fluctuations , wall-normal velocity fluctuations , and shear stresses were presented in [10,11,12]. The results show the similarity of profiles of these turbulent parameters. However, in regions with a turbulence intensity above approx. 30%, the accuracy of hot-wire results is relatively low [13]. 2D and 3D velocity measurements in RWJs were also performed using particle image velocimetry (PIV) [14,15,16], laser Doppler anemometers (LDAs) [17,18], and ultrasonic anemometers (UAs) [19]. LDAs, PIV, and UAs have the uni-directional sensitivity enabling the measurement of the mean radial velocity component . The PIV and LDA measurement results of the mean radial velocity component show a reverse flow at the edge of the jet [14,15,16,17,18].
Based on , the momentum flux of the jet M can be determined. UAs were used in measurements of the air distribution in a room [19,20,21,22], but due to low spatial resolution (probes have dimensions of 5–8 cm), they are not recommended for measurements in regions of the high-velocity gradient.
The disadvantage of LDAs and PIV is the necessity of introducing additional particles into the fluid. LDA systems for the measurement of two or three velocity components are bulky, expensive, and relatively difficult to use. PIV has become an increasingly popular instrument [23,24,25]. However, PIV is not ideal when turbulence measurements are required. In the review paper [23], it was concluded that in full-scale tests thermoanemometers could be more practical than PIV systems.
The advantages of thermoanemometers are high spatial resolution, simultaneous multi-point measurement, and wireless data transmission. Omnidirectional thermal anemometers have been used in measurements of the air speed in thermal plumes [26] and attached plane jets [27]. In the tests presented in [26], the conversion procedure of the air speed into the air velocity was applied. The turbulence intensity Tu needed for that conversion was taken from 3D stereoscopic PIV measurements of the three velocity components in a pure thermal plume [28].
The terms velocity and speed are used as synonyms in colloquial language. In the paper, we use these terms as they are defined in the ANSI/ASHRAE 113-2005 standard [29]. According to this standard, velocity and speed are different physical quantities. The velocity is a vector quantity whereas speed, the magnitude of the velocity vector, is a scalar quantity. The mean air velocity is equal to mean air speed only in a steady airflow without any velocity fluctuations. In turbulent flow, the mean speed is always higher than mean velocity; at turbulence intensity 15%, 30%, and 50%, the mean speed is higher than mean velocity by 2%, 8.5%, and 23%, respectively [30].
Requirements for air velocity measuring instruments used in ventilated rooms with mixed ventilation are included in the European Standard EN 13182-2002 [31]. This standard requires the use of “uni-directional” anemometers for velocity measurements in supply jets. According to this standard, a “uni-directional” anemometer has a sensor that has high directional sensitivity and measures selected velocity components.
Due to the axial symmetry, the flow in the radial wall jets is two-dimensional. The cylindrical coordinate system used in the paper is presented in Figure 2. The results of previous tests of RWJs show that in the direction normal to the wall distributions of mean velocity , the streamwise velocity fluctuations , normal to the wall velocity fluctuations , and shear stresses are similar. It means that in the self-similarity zone of RWJs, there is a similarity of the distributions of turbulence intensity Tu.
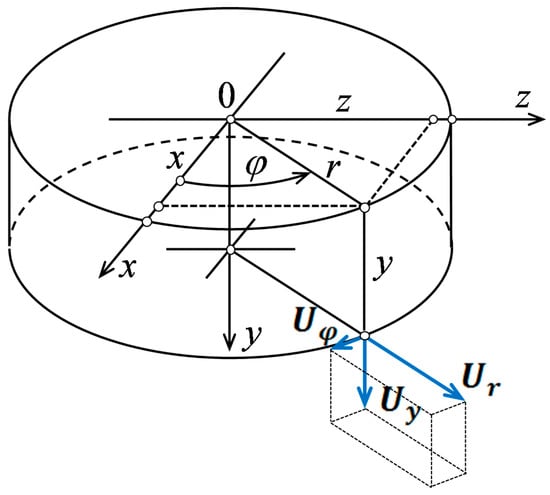
Figure 2.
Cylindrical coordinate system. The origin of the coordinate system is located in the center of the diffuser on the ceiling level.
Analyzing the results of the previous studies on RWJs [6,7,8,9,10,11,12,13], it is possible to determine the relationship between the maximum velocity and the radial distance It can be found assuming:
- -
- The linear spread of RWJ half-width:the origin position should be taken into account in particular when fluid is discharged through the slot between the circular disc and the wall.
- -
- The law of the momentum conservation which links the jet spread with the decay of velocity; in the self-similarity zone of an RWJ, the momentum flux M is proportional to the product of squared maximum velocity , radius r, and half-width of the mean velocity profile :
- -
- That the boundary momentum flux Mo is equal to the momentum flux in the self-similarity zone:
Equations (1)–(3) yield:
At a short distance from the opening, a constant value of M can be assumed. However, taking into account the physics of the flow in RWJs, the momentum flux decreases due to the friction of the jet against the ceiling. One of the goals of our study was to find out the impact of the momentum decrease on the velocity distribution in RWJs.
The transformation of Equation (3) gives the formula to calculate the effective outlet area Ao based on the outlet momentum flux Mo/ρ and the outlet volume flux Vo:
The results of velocity measurement were often approximated using a power function, without analyzing the momentum conservation of the RWJs.
In the tests presented in [6,7,8,9,10,11,12,17,18], characterized by Re > 104, the values of the jet parameters were = 0.082 ± 0.014 (±16%), = 1.71 ± 0.46 (±27%), and m = 1.08 ± 0.07 (±6%). The main reason for the high variability of was the lack of a well-defined method for the effective area of the outlet determination. In most cases, the exponent m was higher than 1, which indicates a decrease in the momentum flux in RWJs. Despite numerous studies, the momentum decay along with the radial distance has not yet been recognized, although it is substantial for the correct determination of the jet throw length. Thorough knowledge of the performance of RWJs is important for reliable prediction of airflow patterns in rooms.
1.2. Goals of the Study
The objective of our research was:
- Developing a method for determining the mean velocity (vector) distribution in the self-similarity zone of RWJs based on the mean speed (scalar) distribution and literature data on turbulence intensity;
- Experimental identification of the losses of the momentum flux due to the friction of the jet with the ceiling and the transfer of momentum to induced recirculating flows;
- Developing a method for calculating velocity distribution in the self-similarity zone of RWJs and its extension on the terminal zone.
2. Development of the Method for Determination of the Mean Velocity Based on the Mean Speed Data
Since the speed is a magnitude of the velocity vector, instantaneous speed can be directly calculated from the components of instantaneous velocity . There is no such close relationship between the mean speed and mean velocity values. However, the ratio of mean speed and mean velocity can be estimated with relatively high accuracy if turbulence intensity is known [30,32,33,34]. The ratio of mean speed and mean velocity was described by a set of two equations in [32] and then using the single formula of Equation (7) in [33].
Experimental validation has shown that using the estimation method presented in [33] mean speed can be estimated with the uncertainty of 0.006 m/s.
To estimate the turbulence intensity in RWJs, the similarity of the distributions of mean velocity components and normal Reynolds stresses normalized by and was utilized.
We analyzed the literature data on mean velocity components and turbulence in the self-similarity zone of RWJs presented in [15,16,17,18]. Due to the highest resolution of the PIV system (vector spacing equal to 0.5 mm), the measurement results presented in [16] for Re = 12.4 × 10³ were considered representative. We described the profiles of air velocity distribution parameters by a general formula in Equation (8). The least-square method was used for the approximation of experimental data. The obtained coefficients are listed in Table 1.

Table 1.
The values of coefficients in Equation (7) describing the profiles of air velocity distribution parameters.
The distribution of mean velocity radial component is presented in Figure 3a. For < 1.94, has a positive value. The profile of the radial mean velocity component can be expressed by equation .
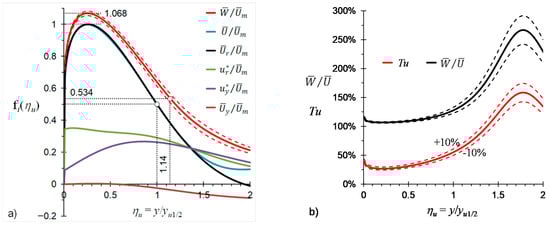
Figure 3.
Profiles of velocity and turbulence in the RWJ self-similarity zone determined based on the results of measurements presented in [16] and using the method of converting the mean velocity into the mean speed presented in [34]: (a) mean velocity , mean velocity components and , standard deviations of velocity fluctuations and , and estimated mean speed ; (b) turbulence intensity Tu and the ratio of mean speed and mean velocity .
In the tests presented in [16], the changes in and with a radial distance were described by Equations (1) and (6), respectively. Based on longitudinal and lateral distributions of the radial velocity component using continuity equation, it was possible to calculate the profile of normal to the wall mean velocity component and to calculate the profile of mean air velocity These profiles are shown in Figure 3a. The coefficients of the profiles of and are presented in Table 1. For < 1.3, the profiles of and overlap. Thus, it can be assumed that and .
The profiles of standard deviations of velocity fluctuations and presented in [16], for Re = 12.4 × 10³, were selected as representative for estimation of turbulence intensity in the self-similarity zone of RWJs. The profiles of and are presented in Figure 3a. The coefficients of the profiles and are presented in Table 1. No data is available on spanwise Reynolds normal stresses . Therefore, it was assumed that the value of spanwise Reynolds normal stresses is an average of streamwise (radial) normal stresses and wall-normal stresses . The validity of this estimation is confirmed by the measurement results of the RWJ presented in [35]. The profile of turbulence intensity is shown in Figure 3b.
The profile of the ratio was found using Equation (7), which is shown in Figure 3b. Multiplying mean speed and the ratio, the profile of the mean speed was determined. The profile of is shown in Figure 3a.
Comparing the profiles of the mean speed and the mean velocity , it was found that the maximum value of mean speed is 1.068 times higher than the maximum value of the mean velocity:
and that the half-width of the mean speed profile is 1.14 times higher than the mean velocity profile :
Analyzing the literature data on turbulence measurements in RWJs, it can be estimated that relative expanded uncertainty of turbulence intensity Tu is equal to approx. 10%. This may result in an uncertainty of and of 1.5% and 4%, respectively. Equations (9) and (10) can also be used inversely to estimate parameters of the mean velocity based on the measured profile of mean speed W. In the current study, we used that inverse method to determine and based on measured and , respectively.
3. Experimental Identification of Velocity Distribution and the Momentum Flux Losses for Two RWJs
Series of air speed measurements with two RWJ types were conducted under laboratory conditions. Based on the speed measurements, a method for calculating velocity distribution in the self-similarity zone of an RWJ and its extension on the terminal zone was developed. Moreover, mathematical relationships of the momentum flux decay with the radial distance were developed
3.1. Experimental Method
The tests were performed in a room with dimensions of 18.3 × 5.7 × 2.8 m3 (length × width × height). The test room fulfills the requirements of EN 12238: 2001 [36] regarding the size of the test room: length 7.5 m, width 5.6 m, and height 2.8 m. The jets from a plate diffuser and a multi-cone diffuser were tested; they are shown in Figure 4. The diffusers were equipped with plenum boxes, which were placed in the space above the suspended ceiling. Due to the insufficient height of the space above the suspended ceiling, it was not possible to supply air to the diffusers in accordance with the recommendations of EN 12238: 2001. Therefore it was checked how the air supply perpendicular to the plenum box affects the symmetry of the airflow supplied from the diffuser. The measurement results are presented in the next subsection. The measuring rig is shown in Figure 5.
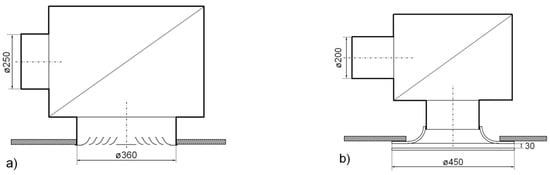
Figure 4.
Diffusers used in the tests: (a) Multi-cone diffuser, (b) Plate diffuser.
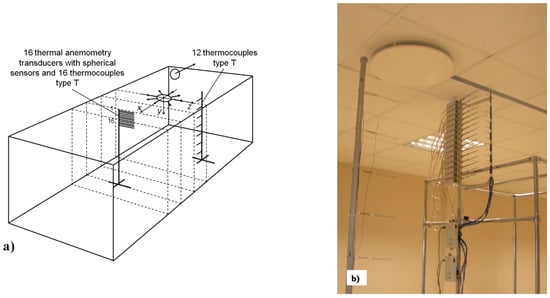
Figure 5.
Experimental rig for testing RWJs. (a) Schematic of the rig; (b) thermo-anemometric transducers with spherical sensors and thermocouple sensors installed on a stand with a traversing mechanism.
Supply air was prepared in the air handling unit located outside the building, which was equipped with an air filter, a rotating heat exchanger for heat recovery, a heating coil, and a cooling coil. The set value of the supply air temperature was equal to the room temperature; isothermal conditions were kept within the range ±0.5 K. To control the flow rate of supply and exhaust air, fan inverters were used. The airflow rate was measured with an uncertainty of 2% using an MSD-type circular airflow unit by Halton. That unit was placed in the duct in front of the plenum box. The measurements were performed at three supply airflow rates Vo: 793, 480, and 245 m3/h.
An AirDistSys 5000 measuring system was used for air speed measurement. It included 16 SensoAnemo 5100SF thermoanemometric transducers mounted on a stand with a traversing mechanism, a SensoBee485 radio transmitter, a SensoBee USB radio receiver, and AirDistSys 5000 software.
The main features of used thermoanemometric transducers are the diameter of speed sensor 2 mm, measurement speed range 0.05–5 m/s, uncertainty in speed measurement ±0.02 m/s ±1.5% of readings, upper frequency of speed fluctuation 1 Hz, and sampling rate 8 Hz. Averaging time of the air speed measurement was 360 s. Air speed distributions in RWJs were measured every 0.5 m from the diffuser axis, totaling nine measurements in the range of 0.5 m to 4.5 m. The vertical distance between the speed sensors was 0.035 m. The speed sensors were positioned at the vertical distance from the ceiling, from 0.005 m to 0.53 m. For the radial distances from the diffuser axis 0.5 and 1 m, additional measurements were performed by moving the set of sensors down 0.0175 m. The sensors used in measurements were calibrated in a wind tunnel with horizontal airflow.
Additionally, the T-type thermocouple temperature measurement system MTT-302 was used to control isothermal conditions. Sixteen thermocouples were placed near the thermoanemometric sensors, twelve thermocouples were evenly placed on the vertical tripod along with the entire room height, and one thermocouple was placed directly in the diffuser.
3.2. Results
To check the symmetry of the airflow from the multi-cone diffuser at the radial distance r = 0.75 m, measurements of air velocity distributions in eight radial directions were made, as shown in Figure 6. For each direction, the maximum velocity and the half-width were determined. Considering that the momentum flux is proportional to the product of the square of the maximum speed and the half-width of the jet , for each direction, the partial momentum flux per 1/8 cylindrical cross-sectional area of a radial jet was determined . The results of the calculations are shown in Figure 5. Larger values were observed on the connection side of the air supply duct to the plenum box, directions φ = 225° i φ = 270°. On opposite directions φ = 45°–135°, momentum flux had the smallest values. In the direction φ = 0 °, the momentum flux was close to the average momentum flux determined from eight directions. The study of jets generated by both diffusers was carried out in the plane z = 0, direction φ = 0°.
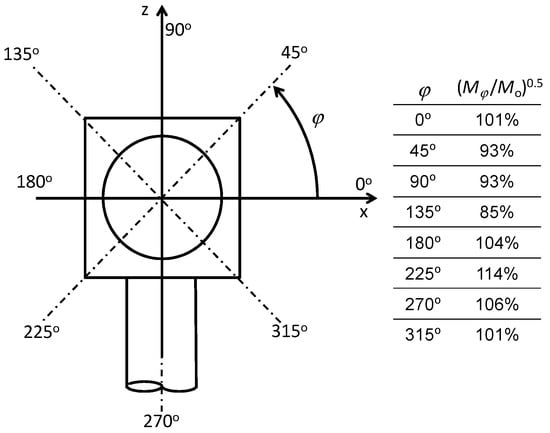
Figure 6.
The symmetry check of the supply airflow from the multi-cone diffuser, partial momentum jet per 1/8 of the cylindrical cross-sectional area of the RWJ .
The results of the air speed measurement in RWJs from both diffusers at the airflow rate of 793 m3/h were used to adjust the calculation method of the air velocity. Measurement data from all cross-sections of tested jets was approximated using the Verhoff’s equation presented in [8] at the distance from the ceiling 0 < ηw < 1.2:
The dimensionless mean air speed distributions, normalized by and , confirmed the self-similarity of the mean speed, Figure 7. For = 0–1.2, the measured values of agree well with the values calculated using Equation (11). For > 1.2, the measured is higher than the calculated one. Additionally, in this range of , a greater scattering of the measurement results is observed.
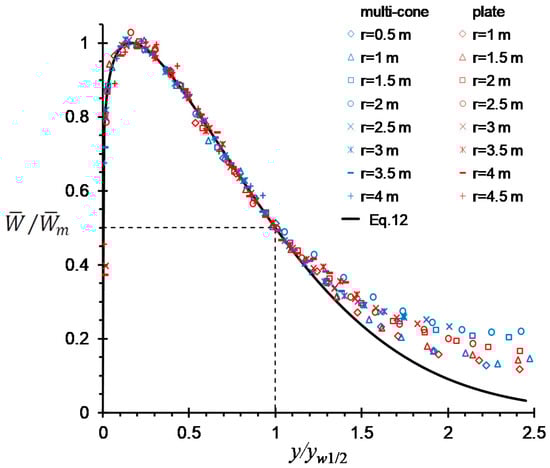
Figure 7.
Distributions of the air speed in RWJs from the plate diffuser and the multi-cone diffuser.
The least-squares method was used to find the maximum mean speed and the half-width of the jet . Equations (10) and (11) were used to find the maximum mean velocity and the half-width of the velocity profile . To calculate jet momentum flux , the equation obtained by the numerical integration of distribution in the range from ηu = 0 to ηu = 1.94 was used, Equation (12). The results are presented in Table 2.
where .
Table 2.
The parameters of RWJs from multi-cone and plate diffusers for Vo = 793 m3/h.
The increase of the half-width of the RWJ versus a radial distance r from the diffusers is shown in Figure 8a. In the distance r − ro lower than 3.5 m, the half-width of the jets increases linearly. For both tested jets, the jet spread coefficient is approximately the same. The position of the jet origin ro is different. This parameter has an impact on the jet throw length, and it should be taken into account in the calculation method of velocity distribution in RWJs.
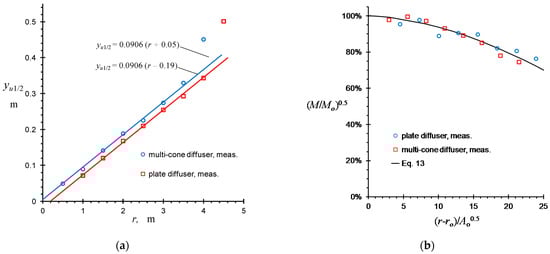
Figure 8.
Results of measurements in tested RWJs at the airflow rate 793 m3/h. (a) The growth of the half-width of RWJs with the distance from the diffuser, (b) the decrease of momentum flux with the distance from the diffuser.
Figure 7 shows that in the distance r − ro lower than 3.5 m, differences in the calculated and measured values of are within ±5%. The rapid increase of is observed at the radial distance where maximum velocity decreases below 0.35–0.4 m/s, which is typical for the terminal zone of the jet.
The decrease of the momentum flux with the radial distance is shown in Figure 8b. The square root of the momentum flux (M/Mo)0.5 decreases according to the equation:
The least-squares method was used to find the and parameters and the outlet momentum fluxes Mo/ρ. The differences between the calculated using Equation (13) and measured values of (M/Mo)0.5 are within ±6%. The values of , , Mo/ρ, and other parameters generally characterizing the tested RWJs are presented in Table 3.
Table 3.
The gross and integral parameters of the tested RWJs from multi-cone and plate diffusers.
The decay of the maximum velocity in RWJs can be found by combining Equation (4) with Equation (13):
where .
For = 0.0906, the velocity decay coefficient Ku is equal to 1.513. In the self-similarity jet zone, the maximum velocity changes are approximately inversely proportional to the radial distance if the momentum flux decrease is neglected. The handbook [37] shows that in axial and radial jets the terminal zone occurs in the region where the maximum mean velocity is lower than approx. 0.35 m/s. In the terminal zone, it is usually assumed that the maximum velocity decreases approximately inversely to the square of the radial distance, . Thus, to calculate the maximum velocity in the terminal zone, i.e., for , we propose the following formula:
where .
The comparison of the measured and calculated with Equations (14) and (15) maximum mean air velocity in jets from both diffusers is presented in Figure 9a. For the distance (r − ro) < 3.8 m, the standard deviation of the difference in measured and calculated maximum velocity Um is equal to 2.5%; in practical applications, this is a satisfactory accuracy. At higher distances from the diffusers where the measured velocity drops below 0.35 m/s, a rapid decrease of the velocity, typical for the terminal region, is observed.
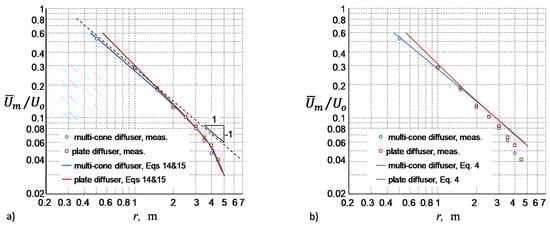
Figure 9.
The decay of maximum mean air velocity with distance from the diffuser. (a) The results of measurement compared with the results of a calculation using Equations (14) and (15), (b) the results of measurement compared with the results of a calculation using Equation (4).
Equation (4) assumes the constant momentum flux. The comparison of the measured and calculated with Equation (4) values of is shown in Figure 9b. The good agreement between the measured and calculated is observed only at the radial distance r < 1.8 m. At a higher distance, the differences between the calculated and measured increase. For r = 3.8 m, calculated with Equation (4) is higher than the measured one by approx. 25%.
The measurements of the air speed in RWJs from the multi-cone diffuser were performed also for the reduced supply airflow rate to 60% and 30%, i.e., for Vo = 480 m3/h and Vo = 245 m3/h. The increase of the half-width and the decay of the maximum mean air velocity of RWJs from the multi-cone diffuser versus a radial distance r is shown in Figure 10a. The results presented in Figure 10a show that the value of the jet spread coefficient does not change with the airflow rate for the Reynolds number from 24,000 to 77,800. The measurement results of maximum velocity agree with Equations (14) and (15), Figure 10b.
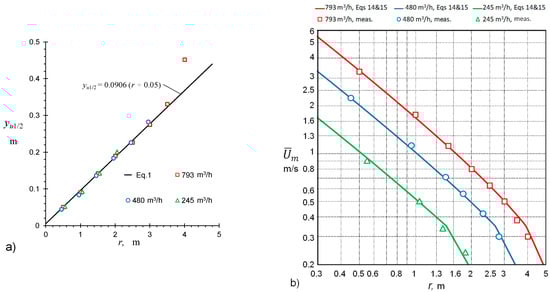
Figure 10.
The results of air velocity distribution in RWJs for multi-cone diffuser at the reduced supply airflow rate to 60% and 30%. (a) The increase of the half-width yU1/2 of RWJs versus a radial distance r, compared with the results of a calculation using Equation (1); (b) the decay of maximum mean air velocity of RWJs versus a radial distance r, compared with the results of a calculation using Equations (14) and (15).
In the self-similarity zone of the jets, the differences between measured and calculated results are within ±5%. In the terminal zone of the jets, the differences are approx. within ±0.05 m/s. Thus, the correctness of the proposed model for calculating the mean velocity distribution in RWJs from ceiling diffusers was confirmed. The model accurately describes the velocity field in all jet regions of interest and can be used to prepare aerodynamic characteristics of jets from the ceiling diffusers.
3.3. Discussion
Terms air speed and air velocity are often used as synonymous, whereas they are defined differently: the first is scalar, and the latter is a vector. The air speed measurements were performed with the multi-channel hot-sphere anemometer system which measures the scalar speed magnitude of the velocity vector. The system has an adequate range of air speed measurement, accuracy, precision, and satisfactory spatial resolution. The simultaneous use of over a dozen anemometer transducers shortens the overall measurement time and allows the use of a long averaging time.
The mean velocity was estimated based on measured mean speed and data on turbulence intensity available in the literature. The analysis presented in the paper showed that for the RWJ the maximum mean air speed is 1.068 times higher than the maximum mean air velocity and that the half-width of the speed profile is 1.14 times higher than the half-width of the velocity profile . The measurement of air distribution in radial wall jets from ceiling diffusers confirmed that in self-similar flows the distribution of mean air velocity can be successfully estimated based on the measured distribution of mean air speed. This method can also be used for other turbulent flows characterized by the similarity of mean and turbulent motion. It can be particularly useful in full-scale experiments.
A constant momentum flux can be assumed in the calculation of velocity distribution in the self-similarity zone for the relatively short distance, i.e., in the range approx. 3 < (r ‒ ro)/Ao0.5 < 8. For higher distance, the decrease of the radial wall jet momentum flux due to the friction of the jet with the ceiling and the transfer of momentum to induced recirculation flows should be taken into account. At a radial distance (r ‒ ro)/Ao0.5 = 25, the momentum flux decreases to approx. 50% of the value of momentum flux at the diffuser outlet . If constant momentum flux is assumed, the uncertainty of maximum velocity predictions are over 25%. This uncertainty decreases to approx. 5% when the decay of momentum flux is taken into account. A method for determining the mean velocity distribution in RWJs was validated at Reynolds number from 24,000 to 77,800. This method takes into account the decrease of momentum, non-zero position of the jet origin, and faster velocity decrease in the terminal zone. In the self-similarity zone of the jets, the differences between measured and calculated results are within ±5%. In the terminal zone of the jets, the differences are approx. within ±0.05 m/s. Thus, the correctness of the proposed model for calculating the mean velocity distribution in RWJs from ceiling diffusers was confirmed. The model accurately reproduces the physics of flow phenomena occurring in RWJ in all jet regions of interest. It can be used to prepare aerodynamic characteristics of ceiling diffusers and engineering programs for the selection of diffusers.
Based on the developed model for the calculation of air velocity distribution in RWJs, the aerodynamic characteristics of the tested multi-cone diffuser were found. These characteristics are shown in Figure 11. It presents the jet throw length for different terminal velocity UL from 0.1 to 0.5 m/s, in the range of the supply airflow rate from Vmin = 141 to Vmax = 884 m3/h, which corresponds to the air velocity at the diffuser spigot of 0.8 and 5 m/s, respectively. The air velocity of 0.8 m/s in the VAV system can be considered as the lowest velocity from the airflow regulation point of view and 5 m/s as the highest air velocity due to the noise generation. For the terminal velocity = 0.25 m/s, the dependence of the jet throw length on the supply airflow rate is slightly non-linear; in the supply airflow rate change from 141 to 884 m3/h, the throw length L varies from 1 to 4.8 m (= 5.5–25). The characteristics presented in Figure 11 can be used in the full range of airflow changes for the isothermal flow as it is in the case of make-up air supplied into commercial kitchens, laboratories, industrial halls, and other rooms equipped with canopy hoods and local exhausts.
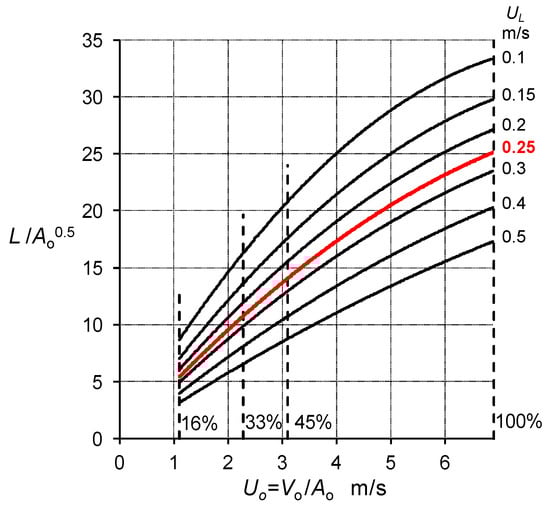
Figure 11.
The aerodynamic characteristic of the tested multi-cone diffuser—the dependence of the jet throw length on the supply airflow rate.
The decrease in the supply airflow decreases the throw length of the jets. In cooling mode, this may cause cold air dumping, i.e., the jet detachment from the ceiling and flowing of cold air directly to the occupied zone. In heating mode, this may deteriorate the air mixing in the room, decrease the air change effectiveness, and increase the thermal stratification. For non-isothermal cases, the characteristics shown in Figure 11 can be used only for airflow rates higher than approx. 400 m3/h (45% of Vmax).
If the flow rate of the cold air cannot be reduced to the required low value, the zones can be overcooled. Thus, to ensure proper thermal comfort, reheating of the supply air is needed. However, it is not the best solution because the energy consumption in VAV systems with reheating is significantly higher when comparing to the VAV system without reheating [38]. Reheating of the supplied air can be avoided and the airflow of primary air can be reduced even to approximately 15% of Vmax by using variable geometry diffusers or fan-assisted VAV terminal boxes or by using induction controllers instead of traditional ones. Deciding what actions should be taken to prevent the cold air damping and the deterioration of air mixing phenomena at low airflow rates requires a comprehensive analysis of thermal comfort as well as technical and economic analysis of the operation of an air conditioning system for a particular building structure and outdoor climate.
Research on RWJs should be continued. It would be beneficial to study RWJs in a broader Reynolds number range and determine the influence of ceiling roughness on the velocity distribution in RWJ, as well as to determine the conditions of non-isothermal flow, at which the air jet is detached from the ceiling. The developed research methodology of the RWJs can be used in the studies of air supply jets in impinging jet ventilation (IJV) systems [39]. IJV is a system with several advantages that are still being developed [39,40,41].
4. Conclusions
Based on the test results, the following conclusions can be drawn:
- The performed measurement confirmed that in self-similar flows the distribution of mean air velocity can be successfully estimated based on the measured distribution of mean air speed (magnitude of velocity vector) using the multi-channel hot-sphere anemometers system.
- A constant momentum flux can be assumed in the calculation of velocity distribution in the self-similarity zone for the relatively short distance, i.e., in the range approx. 3 < (r ‒ ro)/Ao0.5< 8. At a radial distance (r ‒ ro)/Ao0.5 = 25, the momentum flux decreases to approx. 50% of the value of momentum flux at the diffuser outlet . If constant momentum flux is assumed, the uncertainty of maximum velocity predictions are over 25%. When the reduction of the momentum flux is taken into account, the can be determined with the uncertainty of approx. 5% in the self-similarity zone and uncertainty of 0.05 m/s in the terminal zone.
- A method for determining the mean velocity distribution in RWJs was validated at Reynolds number from 24,000 to 77,800. This method takes into account the decrease of momentum, non-zero position of the jet origin, and faster velocity decrease in the terminal zone.
- A reliable method of predicting air velocity distribution in RWJs from ceiling diffusers may have a positive impact on the design process of variable air volume systems. It can help to select the diffuser size, its location, and the range of flow rate change.
The authors believe that the studies of RWJs from ceiling diffusers should be continued in a wider range of Reynolds numbers and that the influence of ceiling roughness and supply air temperature on the velocity distribution in RWJs should be recognized. A deficiency of our tests was the necessity to use literature data for the estimation of turbulence intensity Tu in RWJs. We estimated that the relative expanded uncertainty of Tu is equal to approx. 10% and it may result in the uncertainty of and of 1.5% and 4%, respectively. We plan to verify this statement experimentally.
Author Contributions
Conceptualization, M.H. and Z.P.; methodology, Z.P. and M.H.; investigation, formal analysis, M.H.; resources, J.K. and M.H.; writing—original draft preparation, review and editing, M.H., Z.P. and J.K. All authors have read and agreed to the published version of the manuscript.
Funding
This research received no external funding.
Institutional Review Board Statement
Not applicable.
Informed Consent Statement
Not applicable.
Data Availability Statement
The data presented in this study are available on request from the corresponding author.
Acknowledgments
The work was supported by the Polish Ministry of Science and Higher Education within research subsidy.
Conflicts of Interest
The authors declare no conflict of interest.
Nomenclature
| A | area, m2 |
| a | coefficient |
| h | height of the slot opening, m |
| K | coefficient |
| k | kinetic turbulence energy, m2/s2 |
| L | throw length, m |
| M | mean motion momentum flux, kg·m/s2 |
| m | exponent |
| n | exponent |
| r | radial distance, m |
| Re | Reynolds number, |
| Tu | turbulence intensity |
| U | velocity, m/s |
| u | velocity fluctuations, m/s |
| standard deviation (RMS) of velocity fluctuations, m/s | |
| Reynolds normal stresses, m2/s2 | |
| V | volume flux, m3/s |
| W | mean speed, m/s |
| w | speed fluctuations, m/s |
| x | distance, m |
| y | distance from the ceiling, m |
| y1/2 | half-width of the jet profile, m |
| r | density, kg/m3 |
| h | dimensionless distance from the wall |
| n | kinematic viscosity of air, m2/s |
| Subscripts | |
| M | momentum flux |
| V | volume flux |
| L | terminal velocity |
| m | maximum |
| o | origin, outlet |
| r | radial, streamwise |
| j | spanwise, transversal |
| u | velocity |
| ur | radial velocity component |
| w | speed |
| y | vertical, wall normal |
References
- Yang, B.; Melikov, A.K.; Kabanshi, A.; Zhang, C.; Bauman, F.S.; Cao, G.; Awbi, H.; Wigo, H.; Niu, J.; Cheong, K.W.D.; et al. A review of advanced air distribution methods—theory, practice, limitations and solutions. Energy Build. 2019, 202. [Google Scholar] [CrossRef]
- Advanced Variable Air Volume System. Design Guide. California Energy Comission. Available online: https://newbuildings.org/sites/default/files/A-11_LG_VAV_Guide_3.6.2.pdf (accessed on 27 November 2020).
- Introducing High Performance Air System. An AMCA International White Paper. Available online: https://www.amca.org/educate/articles-and-technical-papers/whitepapers/air-systems/high-performance-air-systems.html (accessed on 27 November 2020).
- Hurnik, M. Novel cylindrical induction controller and its application in VAV air conditioning system in an office building. Energy Build. 2016, 130, 341–349. [Google Scholar] [CrossRef]
- Anand, P.; Sekhar, C.; Cheong, D.; Santamouris, M.; Kondepudi, S. Occupancy-based zone-level VAV system control implications on thermal comfort, ventilation, indoor air quality and building energy efficiency. Energy Build. 2019, 204. [Google Scholar] [CrossRef]
- Bakke, P. An experimental investigation of a wall jet. J. Fluid Mech. 1957, 2, 467–472. [Google Scholar] [CrossRef]
- Bradshaw, P.P.; Love, E. The Normal Impingement of a Circular Air Jet on a Flat Surface; R&M 3205; ARC: London, UK, 1959; Available online: http://naca.central.cranfield.ac.uk/reports/arc/rm/3205.pdf (accessed on 30 November 2020).
- Rajaratnam, N. Turbulent Jets, 1st ed.; Elsevier Scientific Publishing Company: Amsterdam, The Netherland; Oxford, UK; New York, NY, USA, 1976; ISBN 9780080869964. [Google Scholar]
- Tanaka, T.; Tanaka, E. Experimental studies of a radial turbulent jet. 2. Wall jet on a flat smooth plate. Bull. JSME Jpn. Soc. Mech. Eng. 1977, 20, 209–215. [Google Scholar] [CrossRef]
- Cooper, D.; Jackson, D.C.; Launder, B.E.; Liao, G.X. Impinging jet studies for turbulence model assessment. 1. Flow-field experiments. Int. J. Heat Mass Transf. 1993, 36, 2675–2684. [Google Scholar] [CrossRef]
- Knowles, K.; Myszko, M. Turbulence measurements in radial wall-jets. Exp. Therm. Fluid Sci. 1998, 17, 71–78. [Google Scholar] [CrossRef]
- Guerra, D.R.S.; Su, J.; Freire, A.P.S. The near wall behavior of an impinging jet. Int. J. Heat Mass Transf. 2005, 48, 2829–2840. [Google Scholar] [CrossRef]
- Hussein, H.J.; Capp, S.P.; George, W.K. Velocity-Measurements in A High-Reynolds-Number, Momentum-Conserving, Axisymmetrical, Turbulent Jet. J. Fluid Mech. 1994, 258, 31–75. [Google Scholar] [CrossRef]
- Braganca, P.; Sodjavi, K.; Meslem, A.; Nastase, I. Passive control strategy for mixing ventilation in heating mode using lobed inserts. Energy Build. 2016, 133, 512–528. [Google Scholar] [CrossRef]
- Yadav, H.; Agrawal, A. Self-similar behavior of turbulent impinging jet based upon outer scaling and dynamics of secondary peak in heat transfer. Int. J. Heat Fluid Flow 2018, 72, 123–142. [Google Scholar] [CrossRef]
- Van Hout, R.; Rinsky, V.; Grobman, Y.G. Experimental study of a round jet impinging on a flat surface: Flow field and vortex characteristics in the wall jet. Int. J. Heat Fluid Flow 2018, 70, 41–58. [Google Scholar] [CrossRef]
- Tummers, M.J.; Jacobse, J.; Voorbrood, S.G.J. Turbulent flow in the near field of a round impinging jet. Int. J. Heat Mass Transf. 2011, 54, 4939–4948. [Google Scholar] [CrossRef]
- Loureiro, J.B.R.; Freire, A.P.S. Wall shear stress measurements and parametric analysis of impinging wall jets. Int. J. Heat Mass Transf. 2012, 55, 6400–6409. [Google Scholar] [CrossRef]
- Chuah, Y.; Hu, S.; Barber, J. Airflow characteristics of circular ceiling diffusers. Int. J. Archit. Sci. 2000, 1, 59–67. [Google Scholar]
- Kobayashi, T.; Sugita, K.; Umemiya, N.; Kishimoto, T.; Sandberg, M. Numerical investigation and accuracy verification of indoor environment for an impinging jet ventilated room using computational fluid dynamics. Build. Environ. 2017, 115, 251–268. [Google Scholar] [CrossRef]
- Koskela, H.; Maula, H. A CFD Model of a Swirl Diffuser for Heating and Cooling Modes. Int. J. Vent. 2013, 12, 159–165. [Google Scholar] [CrossRef]
- Arens, E.; Ghahramani, A.; Przybyla, R.; Andersen, M.; Min, S.; Peffer, T.; Raftery, P.; Zhu, M.; Luu, V.; Zhang, H. Measuring 3D indoor air velocity via an inexpensive low -power ultrasonic anemometer. Energy Build. 2020, 211. [Google Scholar] [CrossRef]
- Cao, X.D.; Liu, J.J.; Jiang, N.; Chen, Q.Y. Particle image velocimetry measurement of indoor airflow field: A review of the technologies and applications. Energy Build. 2014, 69, 367–380. [Google Scholar] [CrossRef]
- Serra, N.; Semiao, V. Characterization of non-isothermal flows typical of built environments in a laboratory scale model. Part I—Experiments with 3D PIV. Build. Environ. 2013, 68, 225–238. [Google Scholar] [CrossRef]
- Cao, G.Y.; Sivukari, M.; Kurnitski, J.; Ruponen, M.; Seppanen, O. Particle Image Velocimetry (PIV) application in the measurement of indoor air distribution by an active chilled beam. Build. Environ. 2010, 45, 1932–1940. [Google Scholar] [CrossRef]
- Zukowska, D.; Popiolek, Z.; Melikov, A. Determination of the integral characteristics of an asymmetrical thermal plume from air speed/velocity and temperature measurements. Exp. Therm. Fluid Sci. 2010, 34, 1205–1216. [Google Scholar] [CrossRef]
- Cao, G.Y.; Kandzia, C.; Muller, D.; Heikkinen, J.; Kosonen, R.; Ruponen, M. Experimental study of the effect of turbulence intensities on the maximum velocity decay of an attached plane jet. Energy Build. 2013, 65, 127–136. [Google Scholar] [CrossRef]
- Pham, M.W.; Plourde, F.; Kim, S.D. Three-dimensional characterization of a pure thermal plume. J. Heat Transf. Trans. ASME 2005, 127, 624–636. [Google Scholar] [CrossRef]
- ANSI/ASHRAE Standard. ASHRAE 113:2005 Method of Testing for Room Air Diffusion; American Society of Heating, Refrigerating and Air Conditioning Engineers: Atlanta, GA, USA, 2005. [Google Scholar]
- Popiolek, Z. Estimation of mean speed and speed standard deviation from CFD prediction. Archit. Civil. Eng. Environ. ACEE 2008, 1, 141–146. Available online: http://www.acee-journal.pl/1,7,3,Issues.html (accessed on 30 November 2020).
- EU Standard. EN 13182:2002 Ventilation for Buildings—Instrumentation Requirements for Air Velocity Measurements in Ventilated Spaces; European Committee for Standardization: Brussels, Belgium, 2002. [Google Scholar]
- Koskela, H.; Heikkinen, J.; Niemela, R.; Hautalampi, T. Turbulence correction for thermal comfort calculation. Build. Environ. 2001, 36, 247–255. [Google Scholar] [CrossRef]
- Hurnik, M.; Blaszczok, M.; Popiolek, Z. Air distribution measurement in a room with a sidewall jet: A 3D benchmark test for CFD validation. Build. Environ. 2015, 93, 319–330. [Google Scholar] [CrossRef]
- Ivanov, N.; Zasimova, M. Large Eddy Simulation of Airflow in a Room with a Sidewall Jet: Comparison with Benchmark Test Data for Occupied Zone. In Proceedings of the Conference: Roomvent & Ventilation 2018: Excellent Indoor Climate and High. Performing Ventilation, Espoo, Finland, 2–5 June 2018; Available online: https://www.researchgate.net/publication/325539468_Large_Eddy_Simulation_of_Airflow_in_a_Room_with_a_Sidewall_Jet_Comparison_with_Benchmark_Test_Data_for_Occupied_Zone (accessed on 30 November 2020).
- Fairweather, M.; Hargrave, G.K. Experimental investigation of an axisymmetric, impinging turbulent jet. 1. Velocity field. Exp. Fluids 2002, 33, 464–471. [Google Scholar] [CrossRef]
- EU Standard. EN 12238:2001 Ventilation for Buildings—Air Terminal Devices—Aerodynamic Testing and Rating for Mixed Flow Application; European Committee for Standardization: Brussels, Belgium, 2001. [Google Scholar]
- ASHRAE. ASHRAE Handbook—Fundamentals; SI Edition; American Society of Heating, Refrigerating and Air-Conditioning Engineers, Inc. (ASHRAE): Atlanta, GA, USA, 2017; Chapter 20; ISBN 9781939200570. [Google Scholar]
- Ameen, A.; Cehlin, M.; Larsson, U.; Karimipanah, T. Experimental investigation of ventilation performance of different air distribution systems in an office environment—heating mode. Energies 2019, 12, 1835. [Google Scholar] [CrossRef]
- Karimipanah, T.; Awbi, H.B. Theoretical and experimental investigation of impinging jet ventilation and comparison with wall displacement ventilation. Build. Environ. 2002, 37, 1329–1342. [Google Scholar] [CrossRef]
- Ameen, A.; Cehlin, M.; Larsson, U.; Karimipanah, T. Experimental investigation of ventilation performance of different air distribution systems in an office environment—cooling mode. Energies 2019, 12, 1354. [Google Scholar] [CrossRef]
- Ye, X.; Kang, Y.; Yan, Z.; Chen, B.; Zhong, K. Optimization study of return vent height for an impinging jet ventilation system with exhaust/return-split configuration by TOPSIS method. Build. Environ. 2020, 177, 106858. [Google Scholar] [CrossRef]
Publisher’s Note: MDPI stays neutral with regard to jurisdictional claims in published maps and institutional affiliations. |
© 2021 by the authors. Licensee MDPI, Basel, Switzerland. This article is an open access article distributed under the terms and conditions of the Creative Commons Attribution (CC BY) license (http://creativecommons.org/licenses/by/4.0/).