Article

Parametric Study of Air Infiltration in Residential Buildings—The Effect of Local Conditions on Energy Demand

1
Institute of Building Engineering, Warsaw University of Technology, al. Armii Ludowej 16, 00-637 Warsaw, Poland
2
Department of Environmental Engineering, Lodz University of Technology, ul. Wolczanska 213, 90-924 Lodz, Poland
*
Author to whom correspondence should be addressed.
Energies 2021, 14(1), 127; https://doi.org/10.3390/en14010127
Submission received: 21 November 2020 / Revised: 21 December 2020 / Accepted: 24 December 2020 / Published: 29 December 2020
(This article belongs to the Special Issue Ventilation and Building Energy Systems)

Abstract

:
Airtightness is nowadays one of the physical parameters which determine overall building energy performance. In a wide range of states, the upper limit for air change rate at a Pa (na), air permeability rate at a Pa (qa), or specific leakage rate at a Pa (wa) is determined by the formal regulations. It should be highlighted that airtightness requirements are mainly the same around the world, disregarding any site and climatic conditions. The main goal of the presented work was to reveal the effect of individual location and surrounding infiltration rate and heat demand. The analyses were done using numerical techniques and computational models of the three buildings developed and calibrated based on the blower door test results. The compared buildings characterize by a similar geometry but differ in the air change rate at 50 Pa (n50). Analyses done for different locations and levels of sheltering by surrounding elements allow the determination of the real effect of local conditions. The obtained differences in energy demand between two locations from the same climatic zone were from 70% to 90%, depending on the airtightness of the buildings. Considering different sheltered conditions, the differences for the same location can be even 200%. The obtained results allowed for the formulation of the general conclusion that building location and level of exposure could be considered in future airtightness regulations.

1. Introduction

Directive 2012/27/EU of the European Parliament and of the Council on energy efficiency, great attention is paid to the need to increase the energy efficiency of buildings. It is commonly recognized that airtightness has a large impact on the energy efficiency of buildings [1,2,3], which directly affects the level of CO2 emissions [4]. More and more recent studies and publications pay attention to the impact of air infiltration on the level of energy losses [5,6,7]. Some analyzes [8,9,10] show that infiltration is responsible for even 13%–30% of energy losses during the heating season and 4%–14% in the cooling season, while others [11] found that the impact was more significant (even up to 50%). Moreover, airtightness is an important indicator of the building quality, as it affects not only the thermal parameters of the building but also the indoor air quality [12,13], the level of thermal comfort in new [14] and modernized buildings [15], and the long-term durability of buildings [16].
Building airtightness is considered as a factor determining energy requirements not only in a new design [17,18] but in retrofitted [19,20] buildings as well. Increasing the airtightness of the building envelope is often a necessary condition to achieve better energy performance (to 1.0 h−1 for low energy [21] and 0.6 h−1 for passive standard [17]). However, in practice, the newly developed buildings have different levels of tightness (varies from n50 = 0.17 to 5.33 h−1, where n50 is air change rate at 50 Pa), based on the results obtained for mainly masonry buildings in Poland [18,22]. In the case of timber-frame envelopes [11] and lightweight houses [23], the averaged airtightness is as follows 1.02 h−1 (for Sweden), 3.90 h−1 (for Finland), 4.23 h−1 (for Estonia). Moreover, the effect of airtightness impacts not only energy performance but also thermal comfort and indoor air quality.
The analysis of airtightness requirements around the world [5] do not show any relationship between limited values of n50 and local climatic conditions. The legal requirements can be treated as local/country regulations and are mainly differentiated due to the expected standard of buildings. The on-site testing is mandatory only in France, Ireland, Monaco, the UK, and the USA. In Poland, the values of airtightness are only recommended. In Europe, the required values change from 0.6 to 6.0 h−1 independently from latitude or climatic zone. Only for the USA, two different values of n50 for climate zone one and two and zone three to eight are defined. On the other hand, the requirements for limited values of thermal transmittance of building envelope relates to the local climatic condition. Moreover, as it was revealed by Ahmed et al. [24] the optimal thermal transmittance depends on heating degree days (HDD), giving for some specific locations (with a lower value of HDD) thinner insulation as the cost-optimal one [25].
Although there are no requirements formulated depending on the climatic zone or building location, it seems that both factors have an influence on the heat loss due to the infiltration. The influence of different wind local conditions on the real infiltration rate seems to be obvious. Based on the data from Global Wind Atlas 3.0 [26], the averaged wind speed at 10 m above the ground (open site) is between <2.5 m/s and 9.5 m/s for the UK, and between <2.5 m/s and 8.75 m/s for Poland (except Tatra mountains). Additional corrections in wind speed should be considered due to the urban morphology [27] and local conditions. A lot of research has been done on the effect of building construction on local wind flow [28,29]. Furthermore, the airspeed changes nearby building elements and also affects heat exchange by convection [30] and infiltration [31]. The local wind pressure distribution on the building is considerably affected by wind veering, especially at the upper part of the building surface [32]. Besides the building height variability, other morphological features (building aspect ratio, the angle between the street canyons and the incoming wind, and local geometrical features) are a significant factor in shaping flow and dispersion at the local to the neighborhood scale in the urban canopy [33]. This led to attempts to optimize buildings, inter alia, in terms of airflow [34], taking into account, for example, building arrangement. All these studies confirmed that local wind conditions could significantly influence heat losses due to the infiltration airflow. A comparison between the building energy simulation results using both the adjusted (due to local wind) and original weather data indicates that the total building energy consumption decreased by 5% [35]. It can be concluded that building location, exposure, and topology clearly affect infiltration and should be considered regards legal building requirements.
The aim of this study is to reveal the effect of local wind conditions on infiltration airflow in buildings. Three cases that differed in airtightness were investigated numerically using an airflow network model. Numerical models were calibrated based on the results from blower door tests. Three geographical locations in Poland (Katowice, Poznan, and Warsaw) were studied here, considering wind data (hourly averaged for the purpose of building performance simulation) of a typical meteorological year for the selected location [36]. Climatic conditions in Poland are classified according to the Köppen–Geiger class as a cold climate without a dry season and with warm summer (Dfb) [37,38]. Moreover, three different exposures were assumed to properly determine wind boundary conditions [39]. The results of building air flows as well as energy to cover infiltration heat losses for the heating season were presented and discussed.

2. Airtightness Requirements—The Current State

Due to the high impact of airtightness on the energy efficiency of a building, many countries have developed their recommendations or requirements for the maximum allowable level of air infiltration through the building envelope. Using various parameters defining building airtightness (Table 1), each country independently determines the permissible level of air infiltration (Table 2). The airtightness level of a building is defined as the amount of air leakage at a pressure difference (between the inside of the building and its surroundings) of typically 50 Pa or 4 Pa, and sometimes at a difference of 10 Pa, 25 Pa, 75 Pa and 100 Pa [40].
Governing approaches differ from country to country as some laws impose mandatory restrictions on air infiltration through the building envelope, while others only make recommendations or do not consider infiltration at all as an essential building parameter.
Tightness regulations very often depend on additional criteria, which include:
  • Type of ventilation system (natural, hybrid, mechanical, and in some cases heat recovery), e.g., Czech Republic and Latvia; In the case of gravity ventilation, the tightness of the building, depending on the country, should meet the condition n50 < 2.4–4.5 h−1 for new buildings and n50 < 3.6 h−1 for buildings subject to modernization. More stringent requirements apply to buildings with mechanical ventilation, where n50 < 1.5–2.0 h−1 for new buildings and n50 < 2.4 h−1 for buildings undergoing modernization.
  • Type of residential building (single or multi-family), e.g., France;
  • Building condition (new or refurbished), e.g., Switzerland and Liechtenstein;
  • Energy efficiency, e.g., Lithuania;
  • Climatic zone, e.g., USA;
  • Relationship between different geometrical properties, e.g., Denmark and Spain;
  • Guidelines describing the air barrier, e.g., Canada.
It is noticeable that the recommended or required airtightness level of residential buildings does not depend on the location, degree of exposure, and other local factors (except in the USA), which affect the amount of air infiltrating the building envelope and thus the energy demand. In the greatest number of countries, the level of infiltration required depends on the type of ventilation system (Table 2).

3. Building Types, Weather Data, and Local Conditions

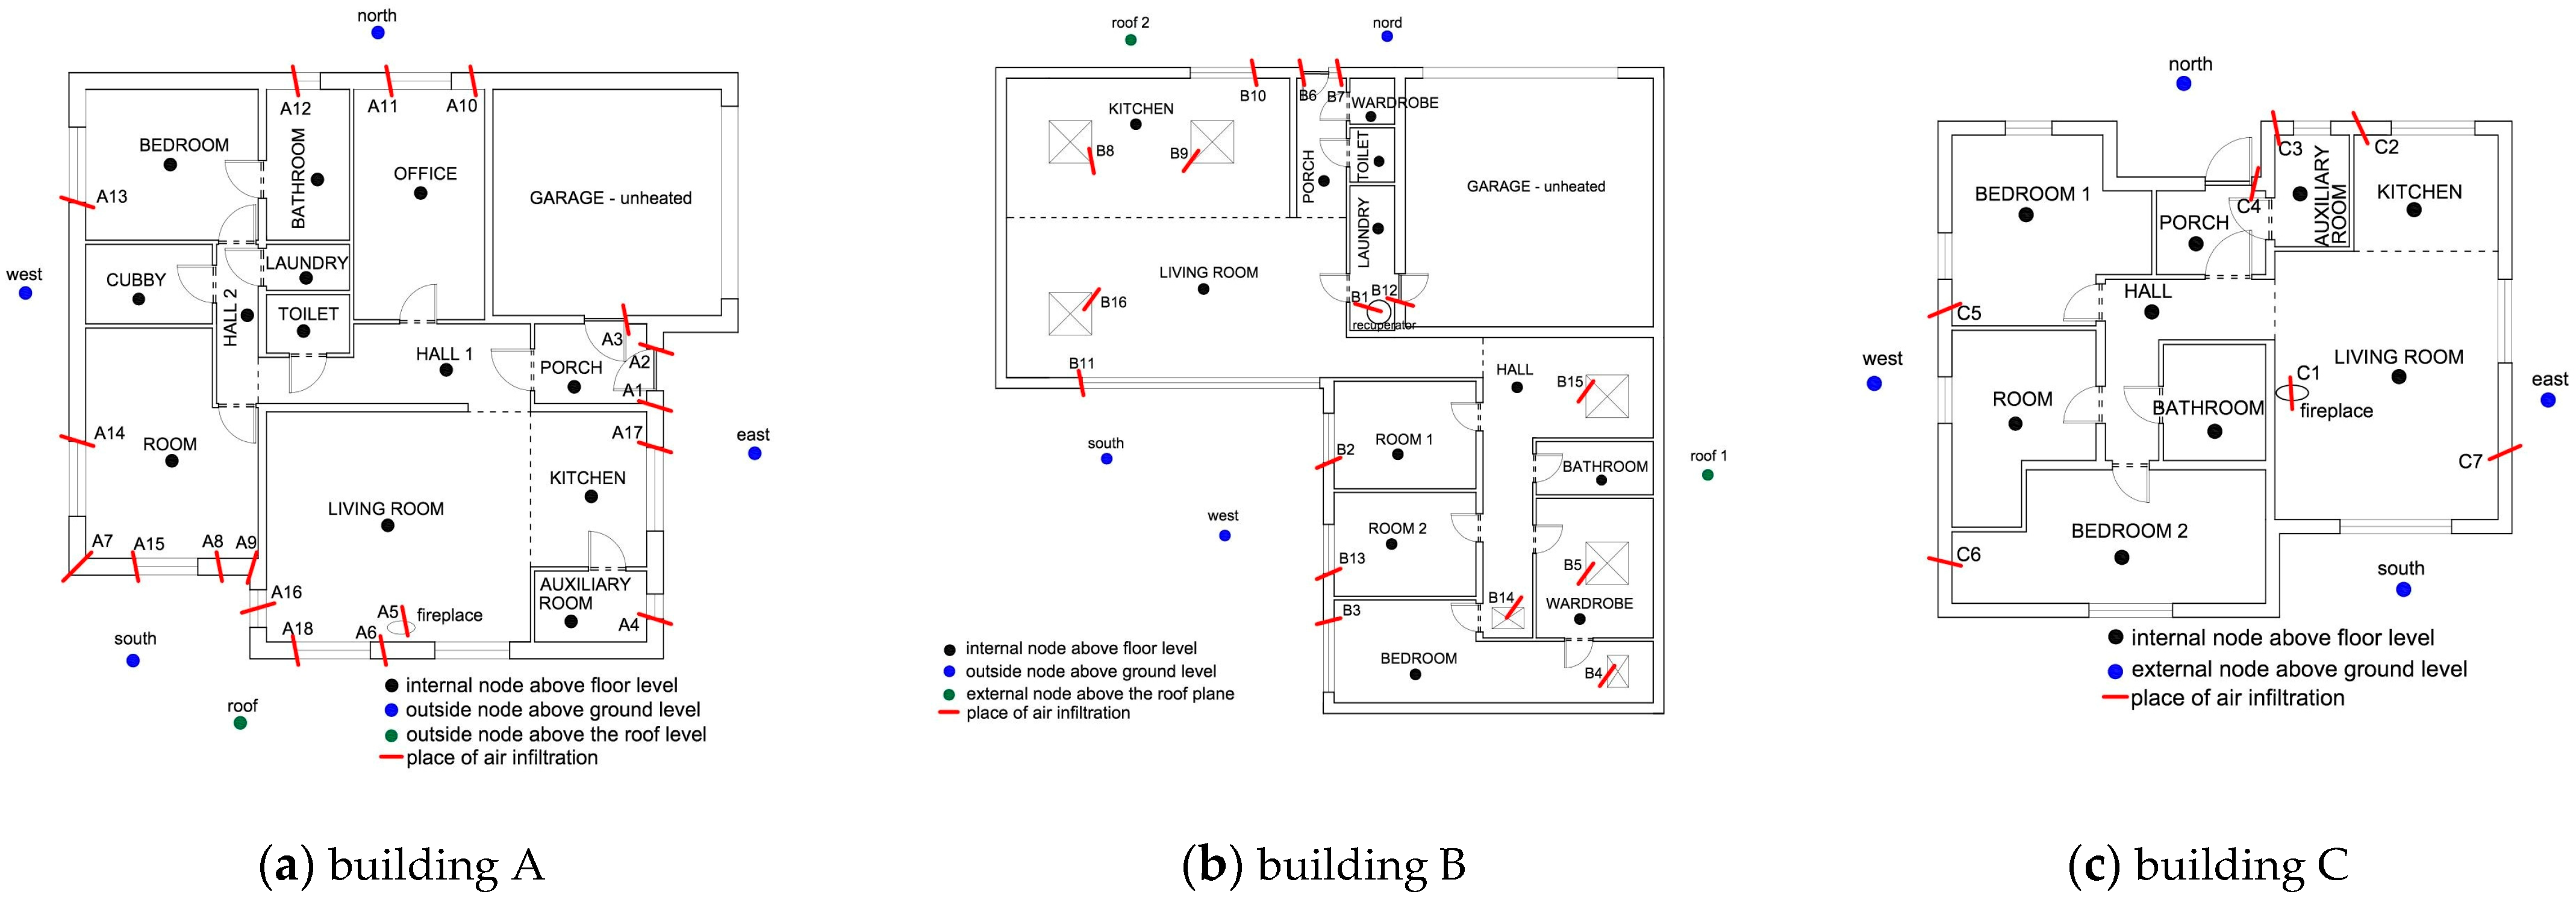
3.1. Building Types and Construction

Three existing single-story buildings were selected for detailed simulation analyses. They have a diversified structure of walls and roofs and the level of airtightness.
The oldest building (A) that is located in Katowice, with the construction completed in 2011, has external brick walls insulated with the ETICS method (External Thermal Insulation Composite System) with the use of polystyrene; the roof was made of a wooden roof truss, insulated in the construction layer with additionally mineral wool added. The building was built on a thermally protected concrete footing. Windows and doors were installed with the use of the so-called warm assembly, which consists of placing the window and door joinery in the thermal insulation layer. This method reduces the influence of the thermal bridge on the joining of the joinery with the partition. The area of the heated part of the building is 130 m2, the area of external partitions is 504 m2, and the cubic capacity was 333 m3. The building had 12 heated rooms and an unheated garage.
The second building (B) located in Poznan, included in the simulations, was put into operation in 2012; it had 12 heated rooms and an unheated garage. The external walls of the building were made of a brick system with ETICS insulation. The building was founded on a reinforced concrete foundation plate thermally insulated from the bottom; the roof was insulated with polystyrene on the top was made of prestressed concrete. Windows and doors in the building were installed both in the external walls and the roof using so-called warm installation, additionally with the use of vapor barrier tape. The area of the heated part of the building was 196 m2, the area of external partitions was 790 m2, and the cubic capacity was 588 m3.
The newest building (C), located in Warsaw, was built in 2015 and had nine heated rooms. The building had a timber frame construction with mineral wool filling the external walls and the roof. Additionally, the roof and external walls were insulated from the outside with polystyrene. The facility was founded on a thermally insulated concrete footing, and the windows were installed using the so-called warm assembly. The area of the heated part of the building was 102 m2, the area of external partitions was 435 m2, and the cubic capacity was 290 m3.
Mechanical ventilation with heat recovery was used in all three analyzed buildings. The degree of tightness of individual buildings varied. The infiltration level, which was performed according to the Blower Door Test procedure (PN-EN 13829: 2002), is presented in Table 3.

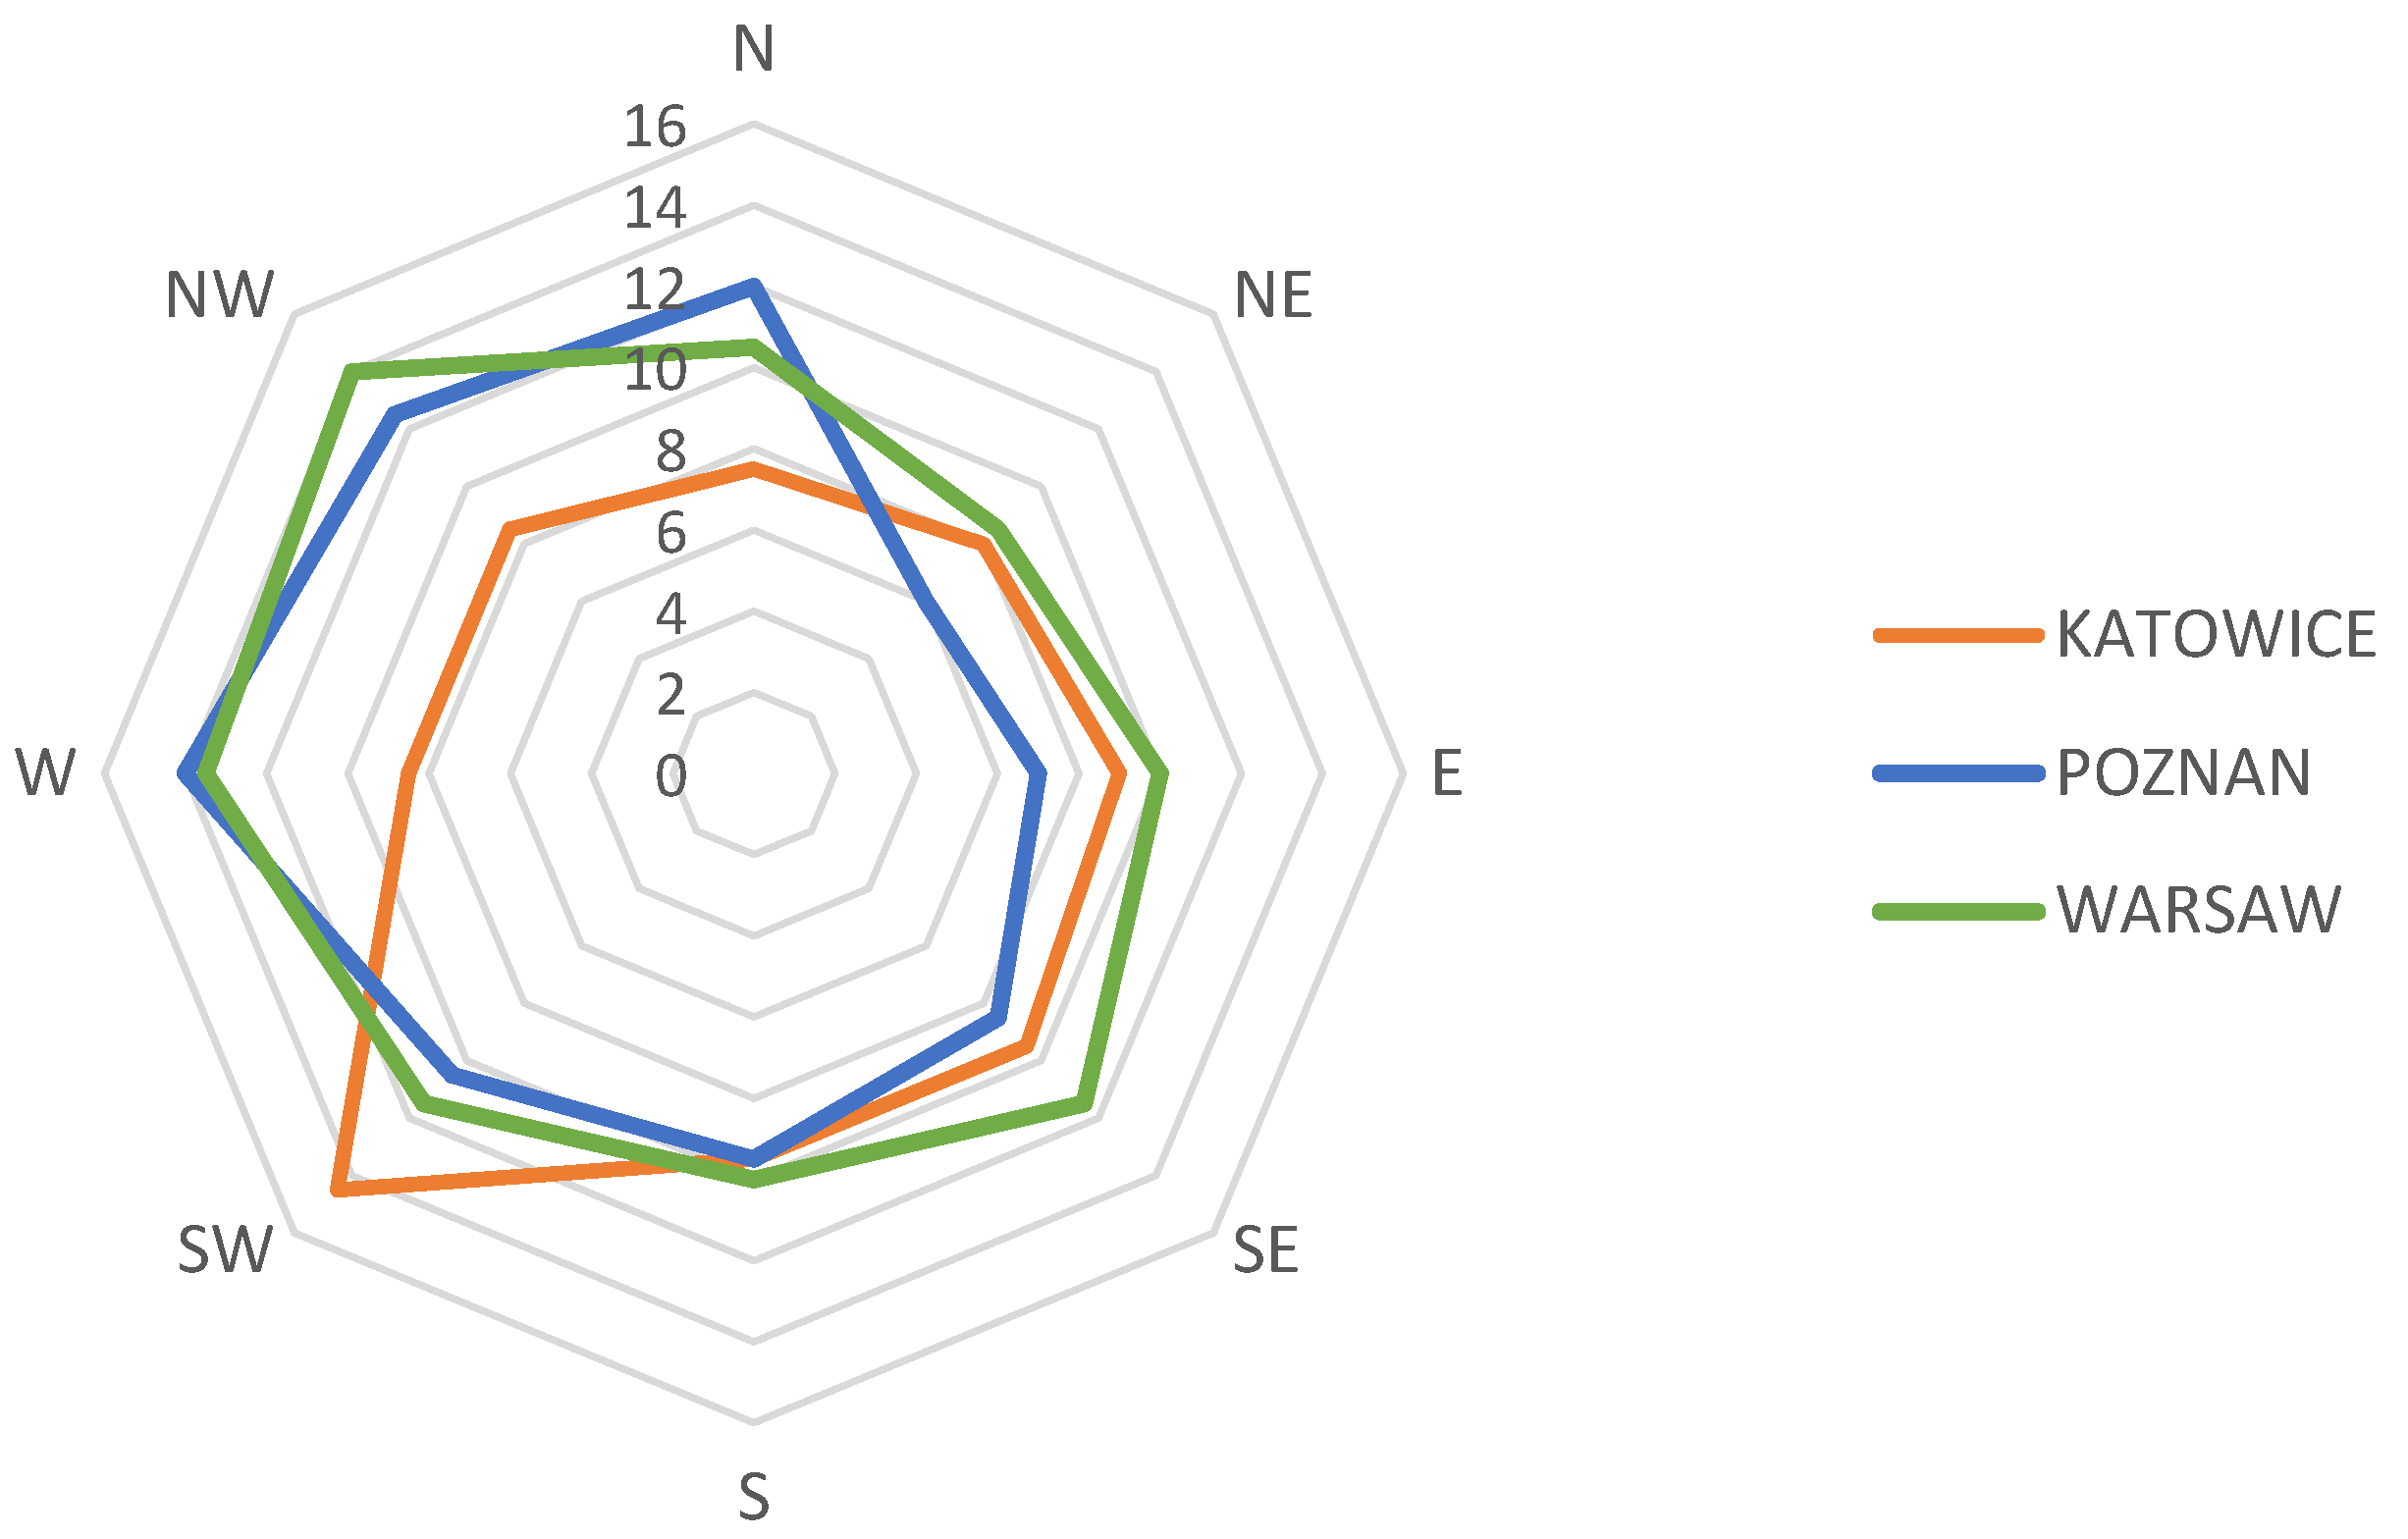
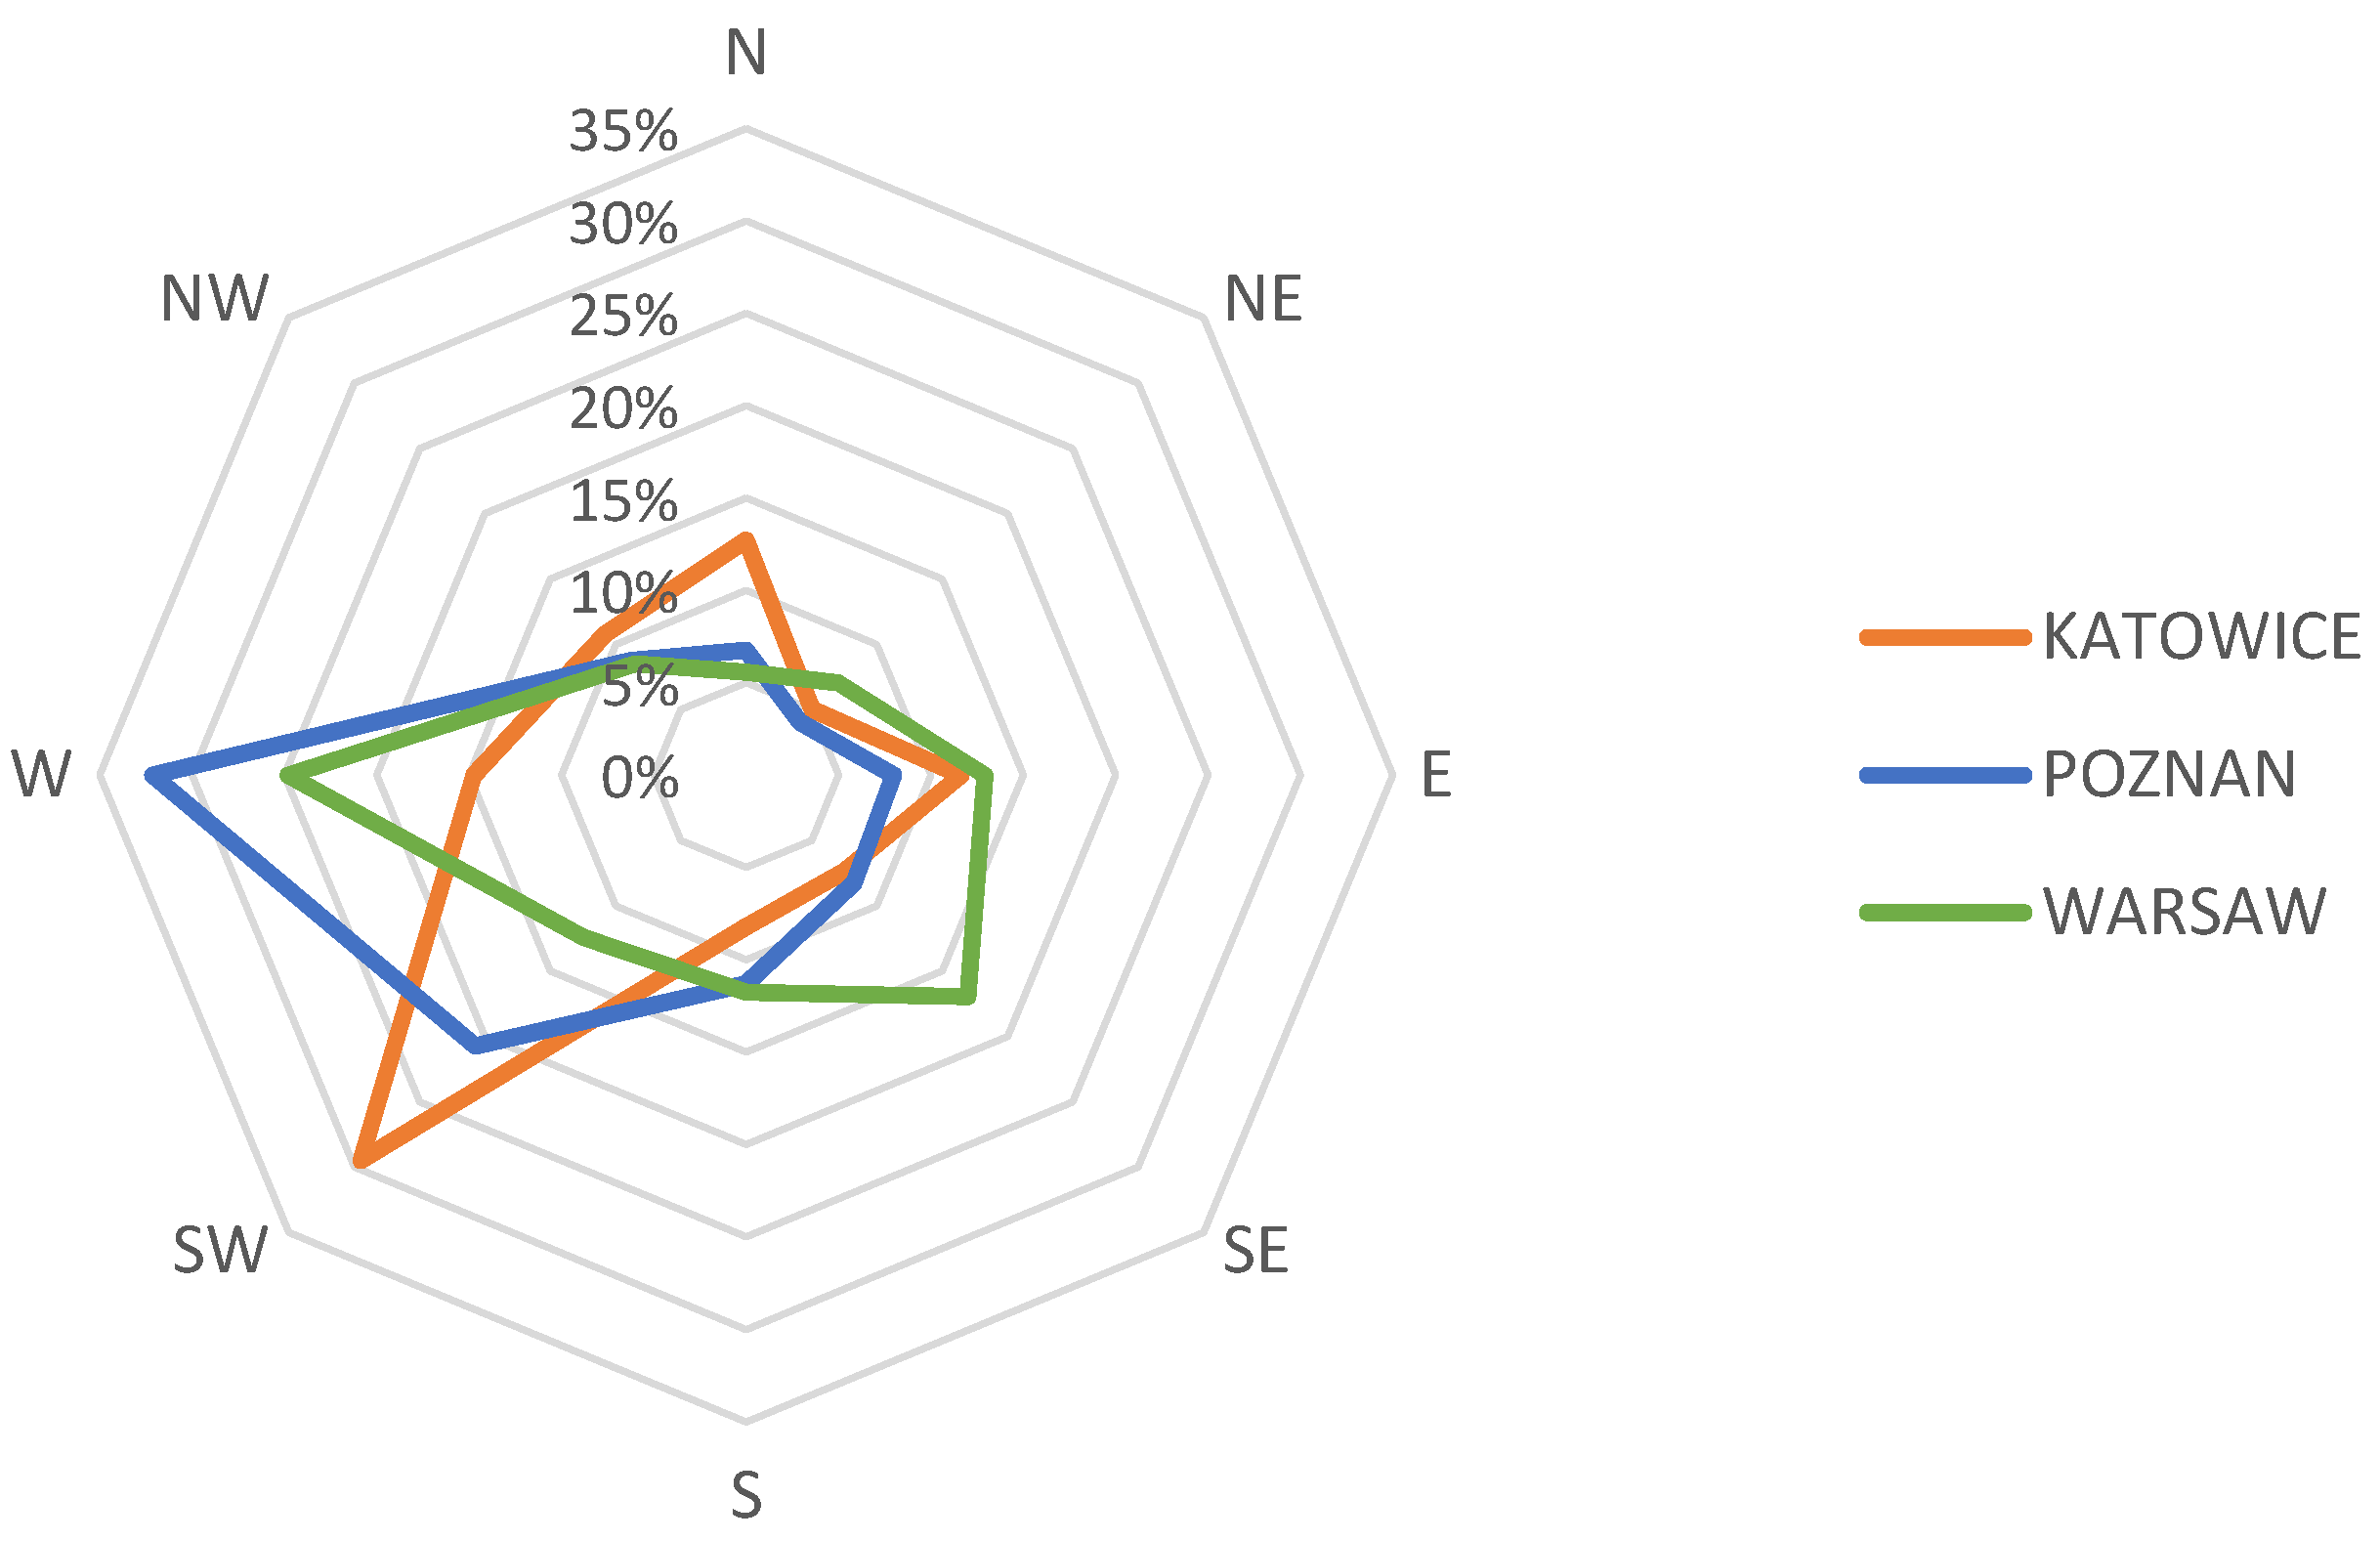
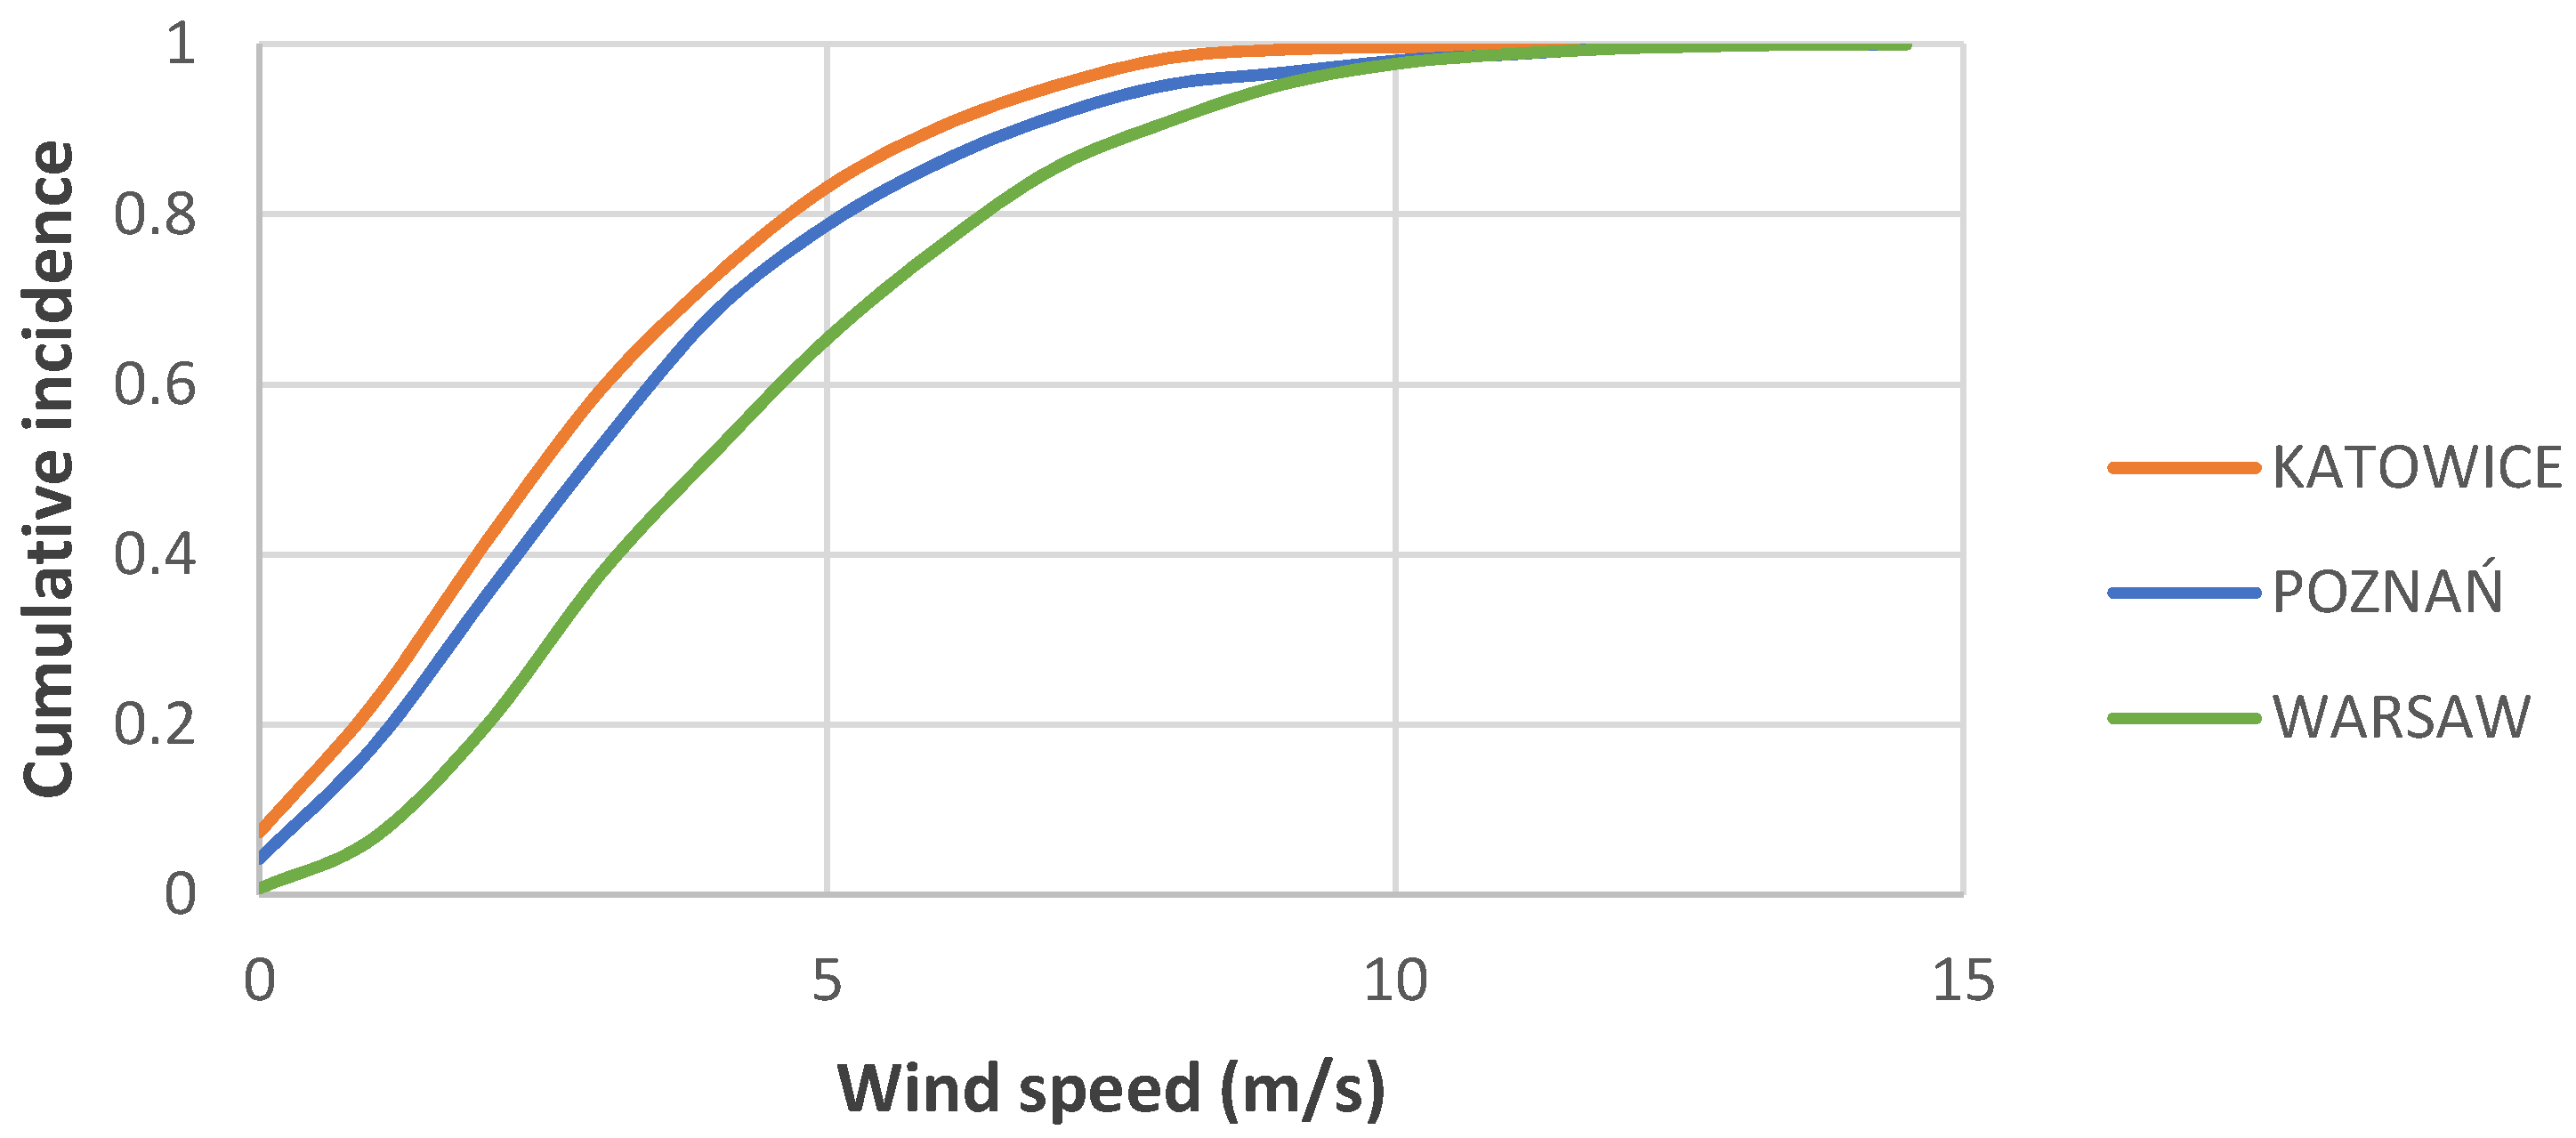
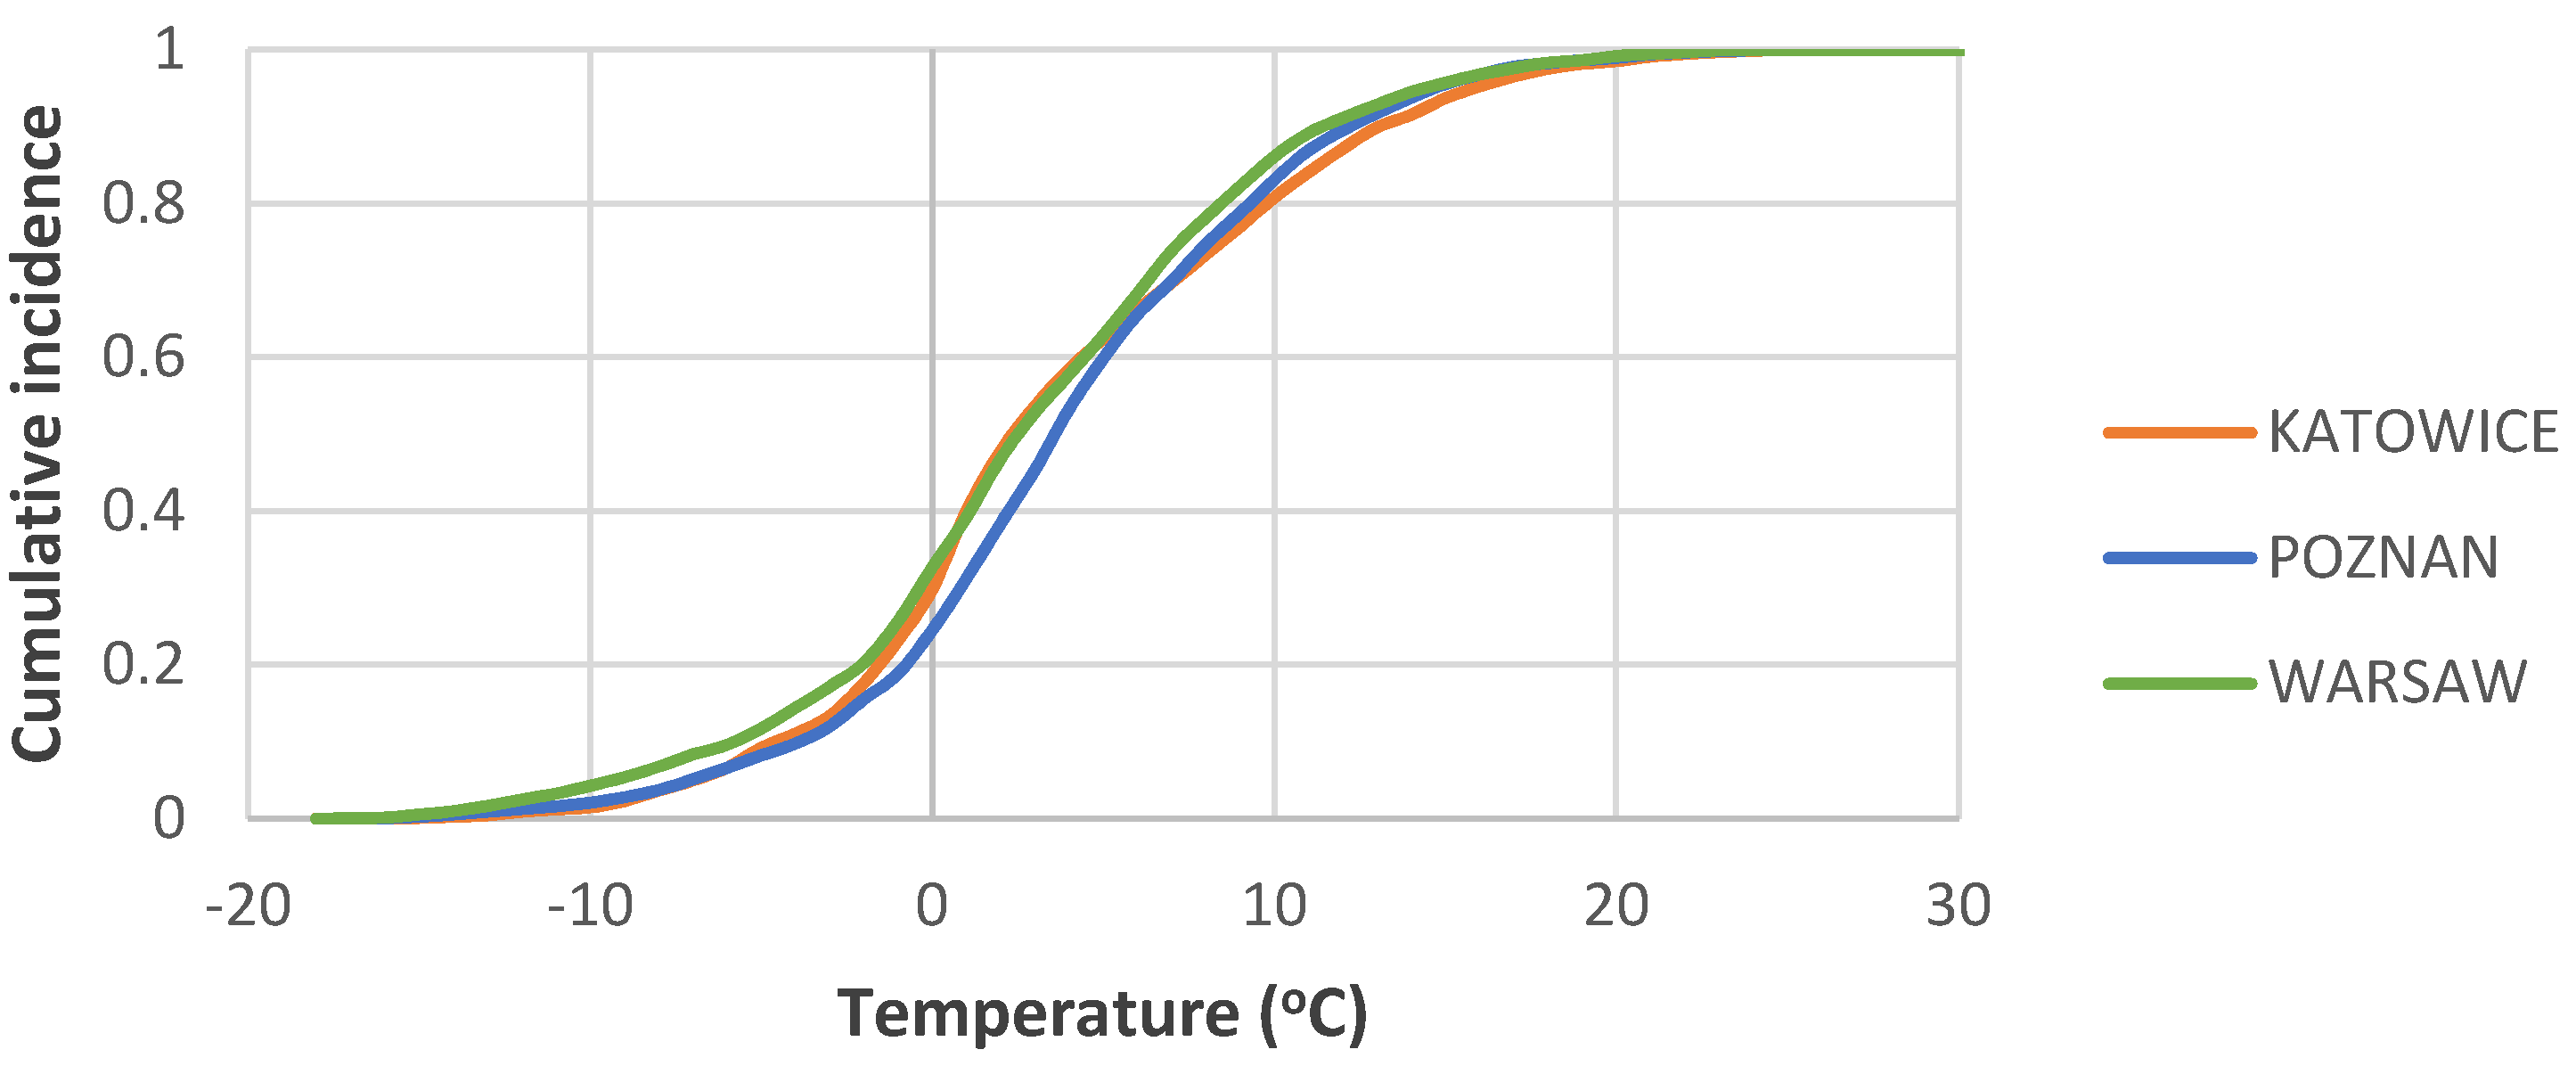
3.2. Local Weather Conditions

The weather-related data adopted for air infiltration analysis are the average hourly values of wind speed and outside air temperature determined for the Typical Meteorological Year (TMY). TMY was prepared for the purpose of energy calculations of buildings using real meteorological databases, developed by the Polish Institute of Meteorology and Water Management. The databases contain source data from the thirty-year period from 1971 to 2000.
TMY data represents hourly values and can be successfully used in a simulation method to determine leakage air flows for selected buildings. In Addition, TMY data allows the calculation of the heating energy demand for ventilation and infiltration separately.
In order to consider the difference in simulation results, it was necessary to compare the characteristic wind data in three selected locations. The data was analyzed due to the dominant wind speeds and directions. The individual towns are located in various wind load zones. The highest wind speeds were in Warsaw and the lowest in Katowice. Comparing the highest wind speeds for individual locations (Figure 1), it was noticed that in the case of Katowice, they reached speeds of 14.5 m/s (from the south-west direction), Warsaw—14.0 m/s (from the north-west direction) and Poznan—14.0 m/s (from the west).
Also, the occurring wind directions in three analyzed locations (Katowice, Poznan, and Warsaw) were compared (Figure 2). It should be noted that there was one dominant direction for each town, and it was the west (W) in the case of Poznan and Warsaw, and the south-west (SW) in the case of Katowice.
There were also visible differences in the dominant wind speeds at individual locations (Figure 3). The data for Katowice (65% of wind speed is below 3.5 m/s) and Warsaw (57% of wind speed was above 3.5 m/s) displays a difference between locations. Out of the three analyzed locations, Katowice seemed to have the highest probability of calm, i.e., wind speeds below 3.5 m/s [42].
Hourly temperature changes during the year for individual locations did not differ significantly. This was confirmed by the results, temperature distributions presented in Figure 4. This means that the dominant parameter differentiating all these three locations due to the energy demand for infiltration will be the wind speed.

3.3. Building Exposure

In dynamic methods, many coupled physical processes can be considered. These include air infiltration, determined by meteorological parameters, such as the influence of wind [9], dependent on the location and the level of sheltering of the building. Heat losses resulting from air infiltration were also analyzed.
Three residential, single-family buildings that differed in the level of airtightness were investigated. The analyses were conducted for two locations (Katowice and Warsaw) with the most extreme weather conditions due to wind speed.
For the calculations, three degrees of sheltering of the building against the wind were assumed, expressed by the coefficient k dependent on the roughness of the ground. According to the information presented in the paper [43], it depended on the type of environment and was respectively, in case of the building:
  • bare (open area, e.g., agricultural area) k = 1.0 (unsheltered),
  • moderately sheltered (wooded area or surrounded by buildings of similar height, e.g., city suburbs) k = 0.8 (semi-sheltered),
  • sheltered (area surrounded by buildings higher than the analyzed building, e.g., city centers) k = 0.5 (sheltered).

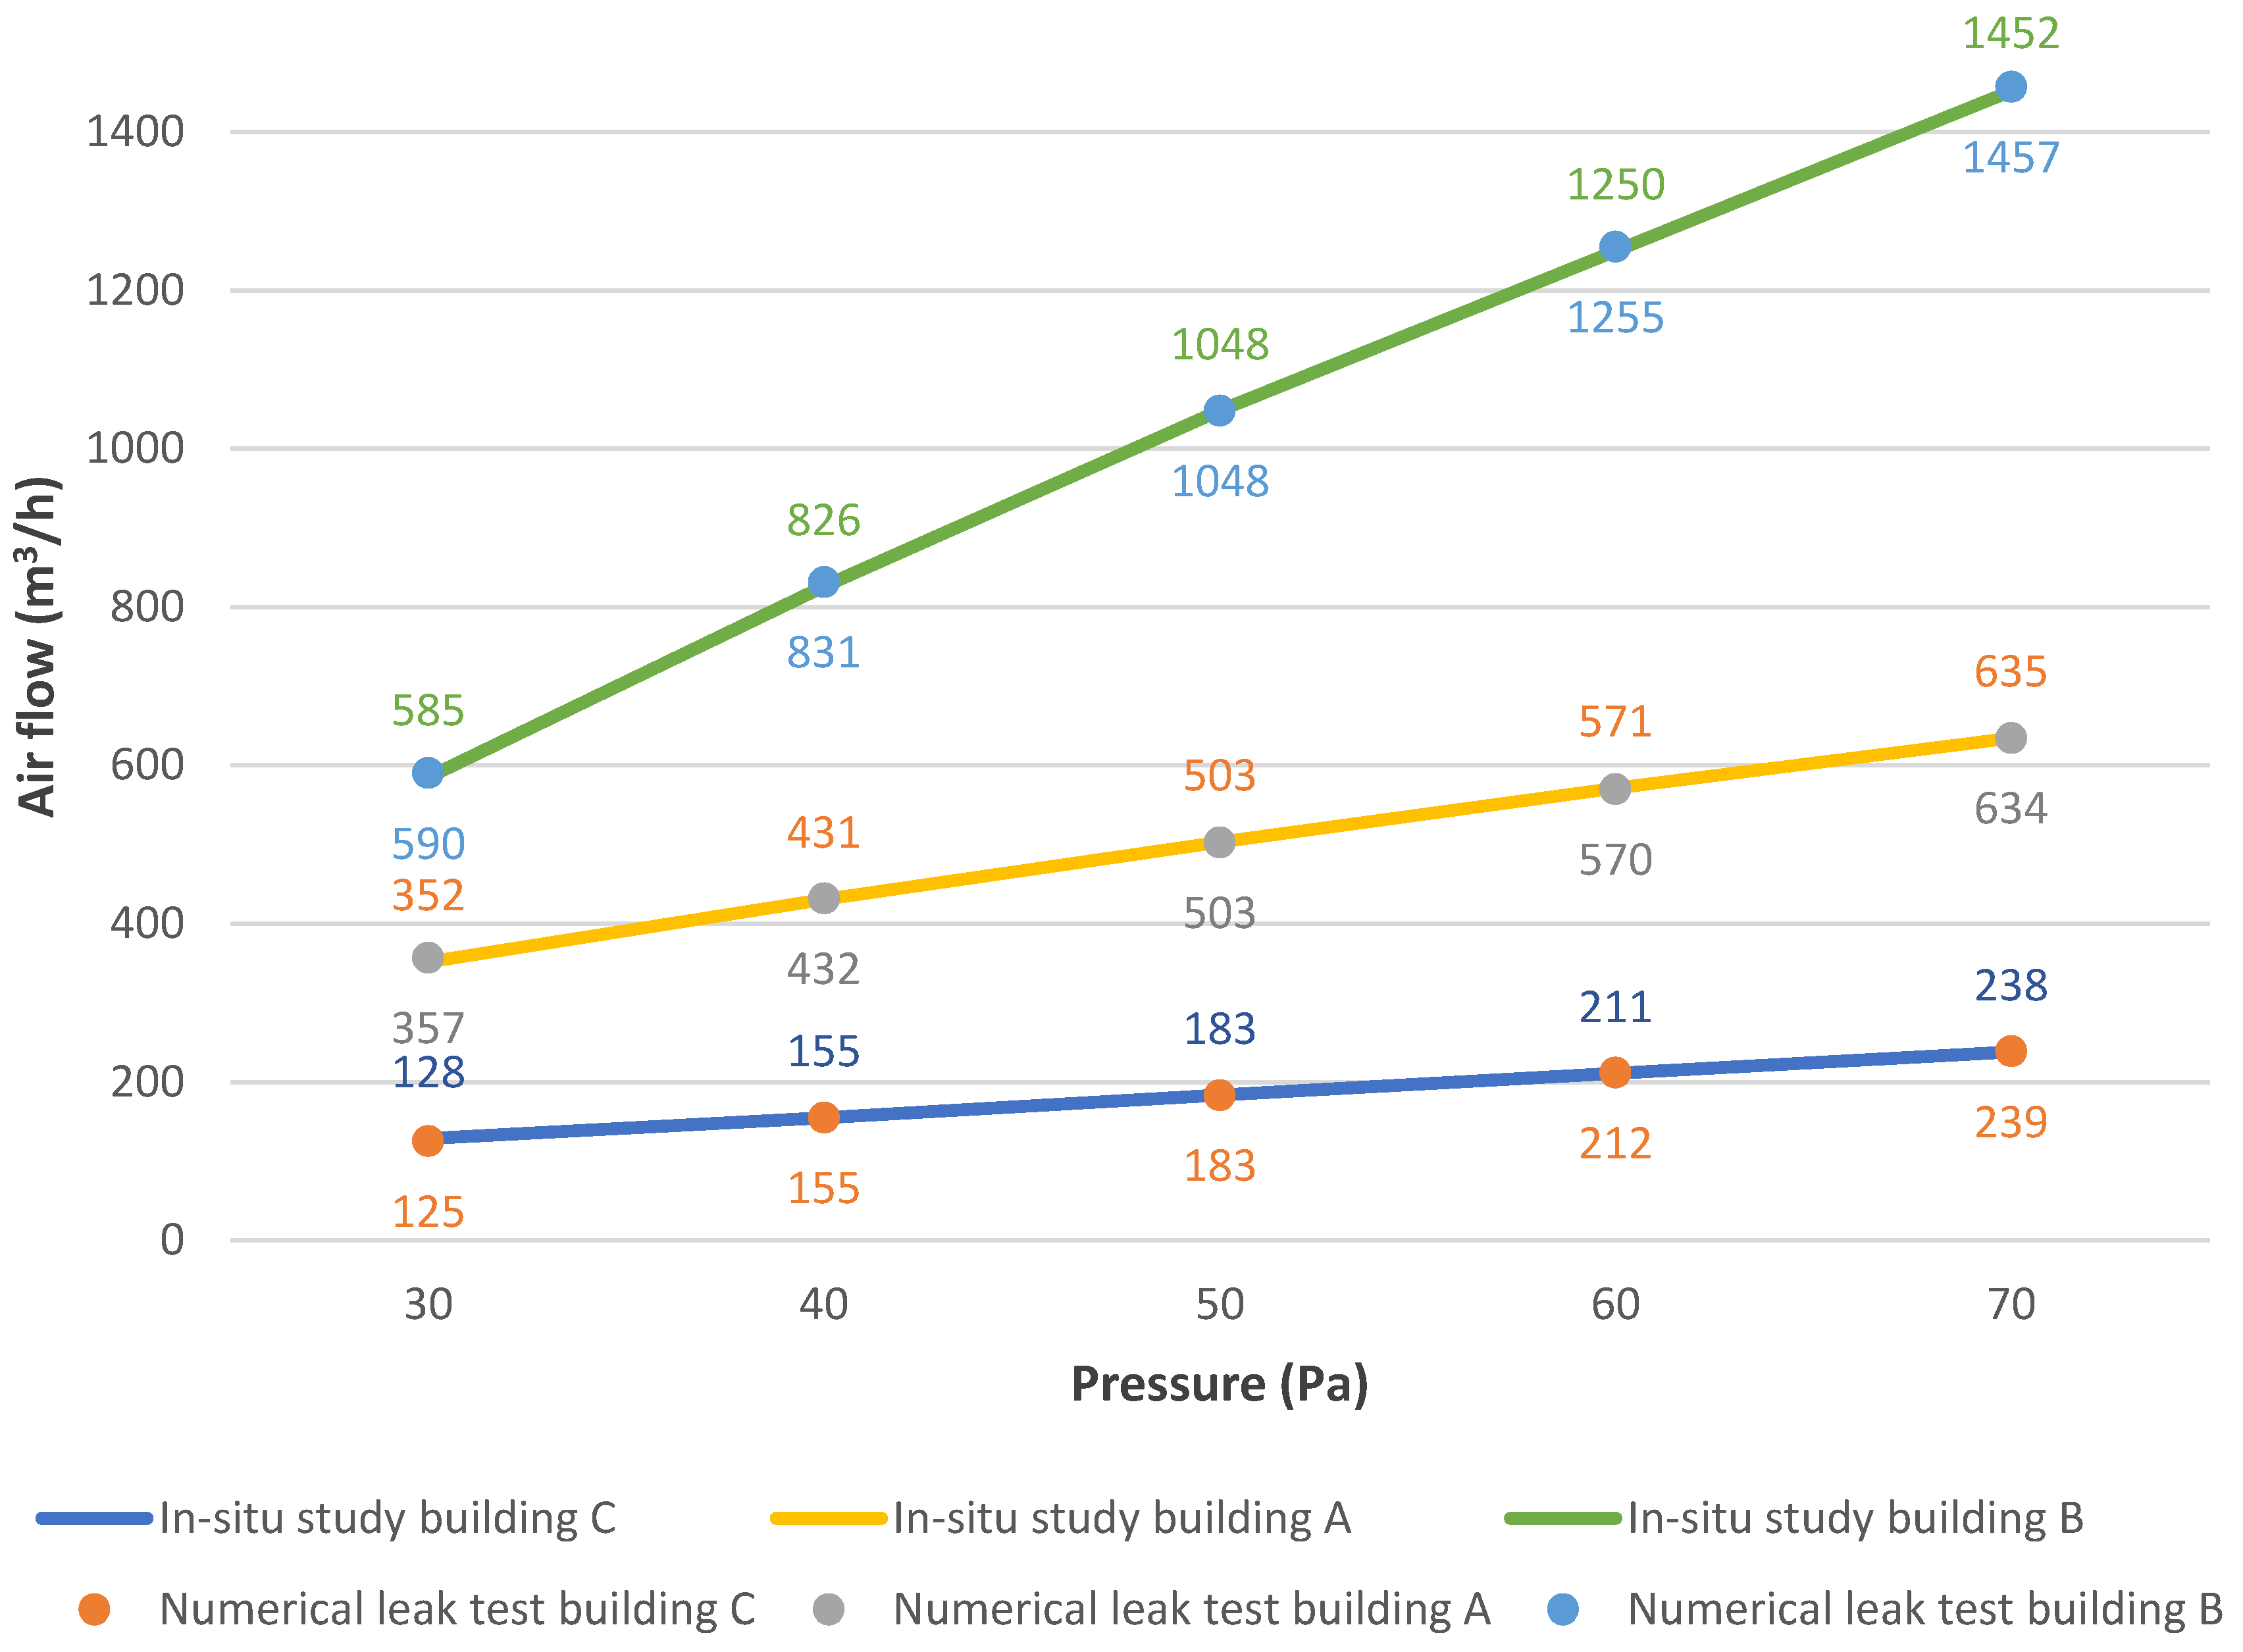
4. Air Flow Modelling and Calibration

The airflow network-building model was developed according to the general assumptions presented in [44]. The basic theory of this approach can be found among others in [45]. The buildings selected for the analyses were developed in the form of a computational model in the ESP-r (Environmental Systems Performance—Research) simulation tool [46]. The building’s space with controlled parameters as well as unheated zones was divided into a control volume represented each specific room. All possible air exchanges between individual zones as well as between zones and external environment were defined, including the type of flow mechanism and its intensity. On the building models, nodes of the airflow network were plotted (Figure 5a–c), and the airflow mechanism and its intensity were determined using the network method.
Calibration of the model was done by a comparison of in-situ measurement results (leaks tests) and the results of airflow obtained from building performance simulations. The results were compared for a pressure difference of 50 Pa only, and the discrepancy between measurements and calculation were determined at different values of overpressure. Based on the results presented in Figure 6, it can be concluded that differences in air flow do not exceed 2.5% (Figure 6). Values of airflows presented under the graph were obtained by the theoretical models, while values located above the graph comes from the field tests.
The n50 index values obtained by the computer simulation were in line with the results obtained from the leak tests, given the following n50, respectively:
  • Building A, n50 = 1.50 h−1
  • Building B, n50 = 1.78 h−1
  • Building C, n50 = 0.63 h−1

5. The Effect of Weather Data and Local Conditions on Simulation Results

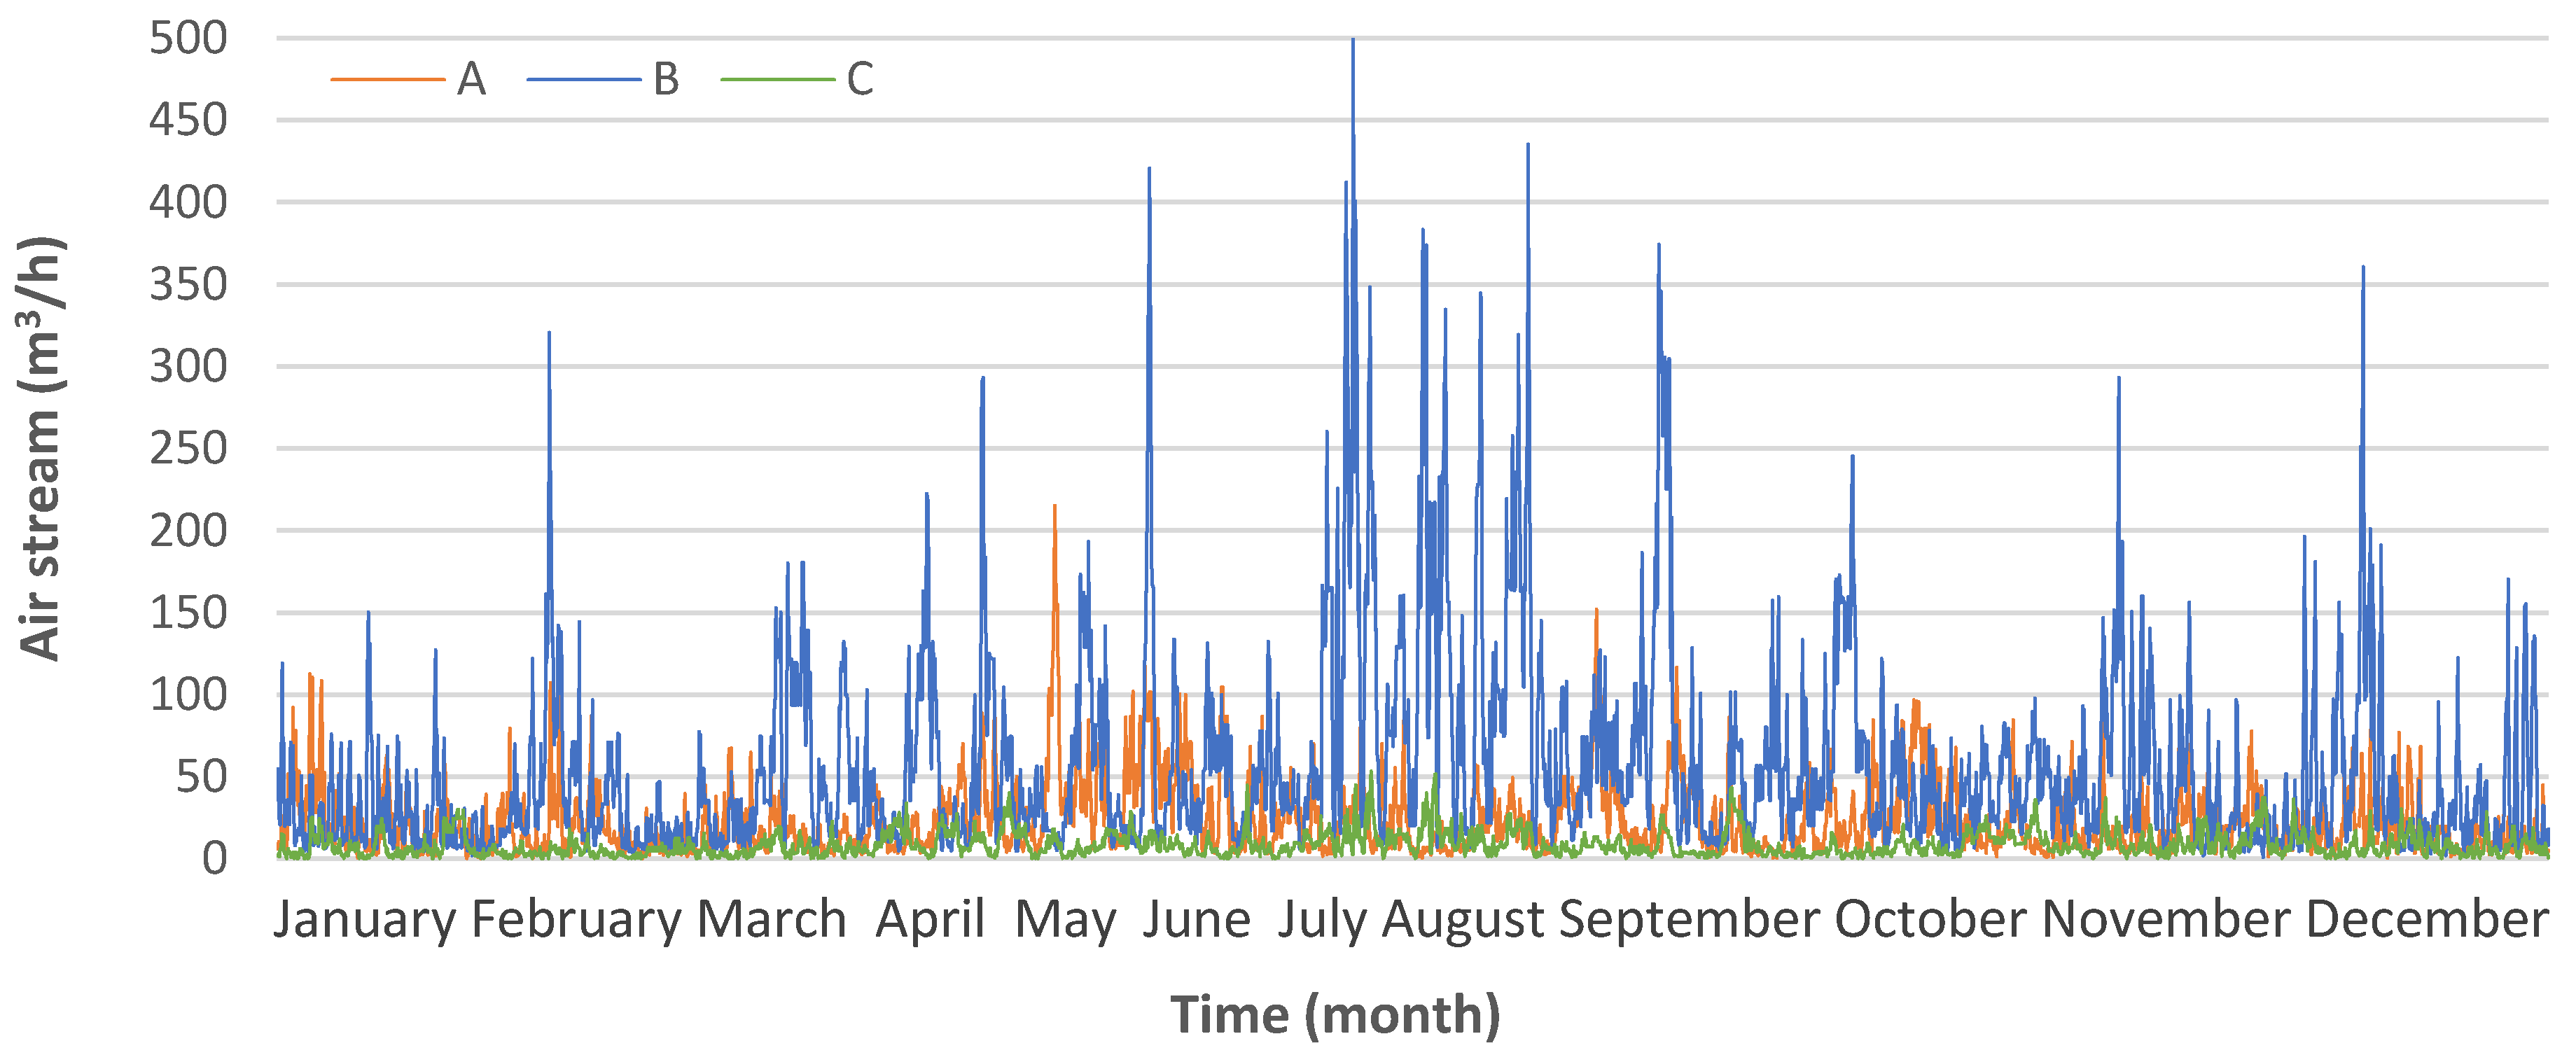
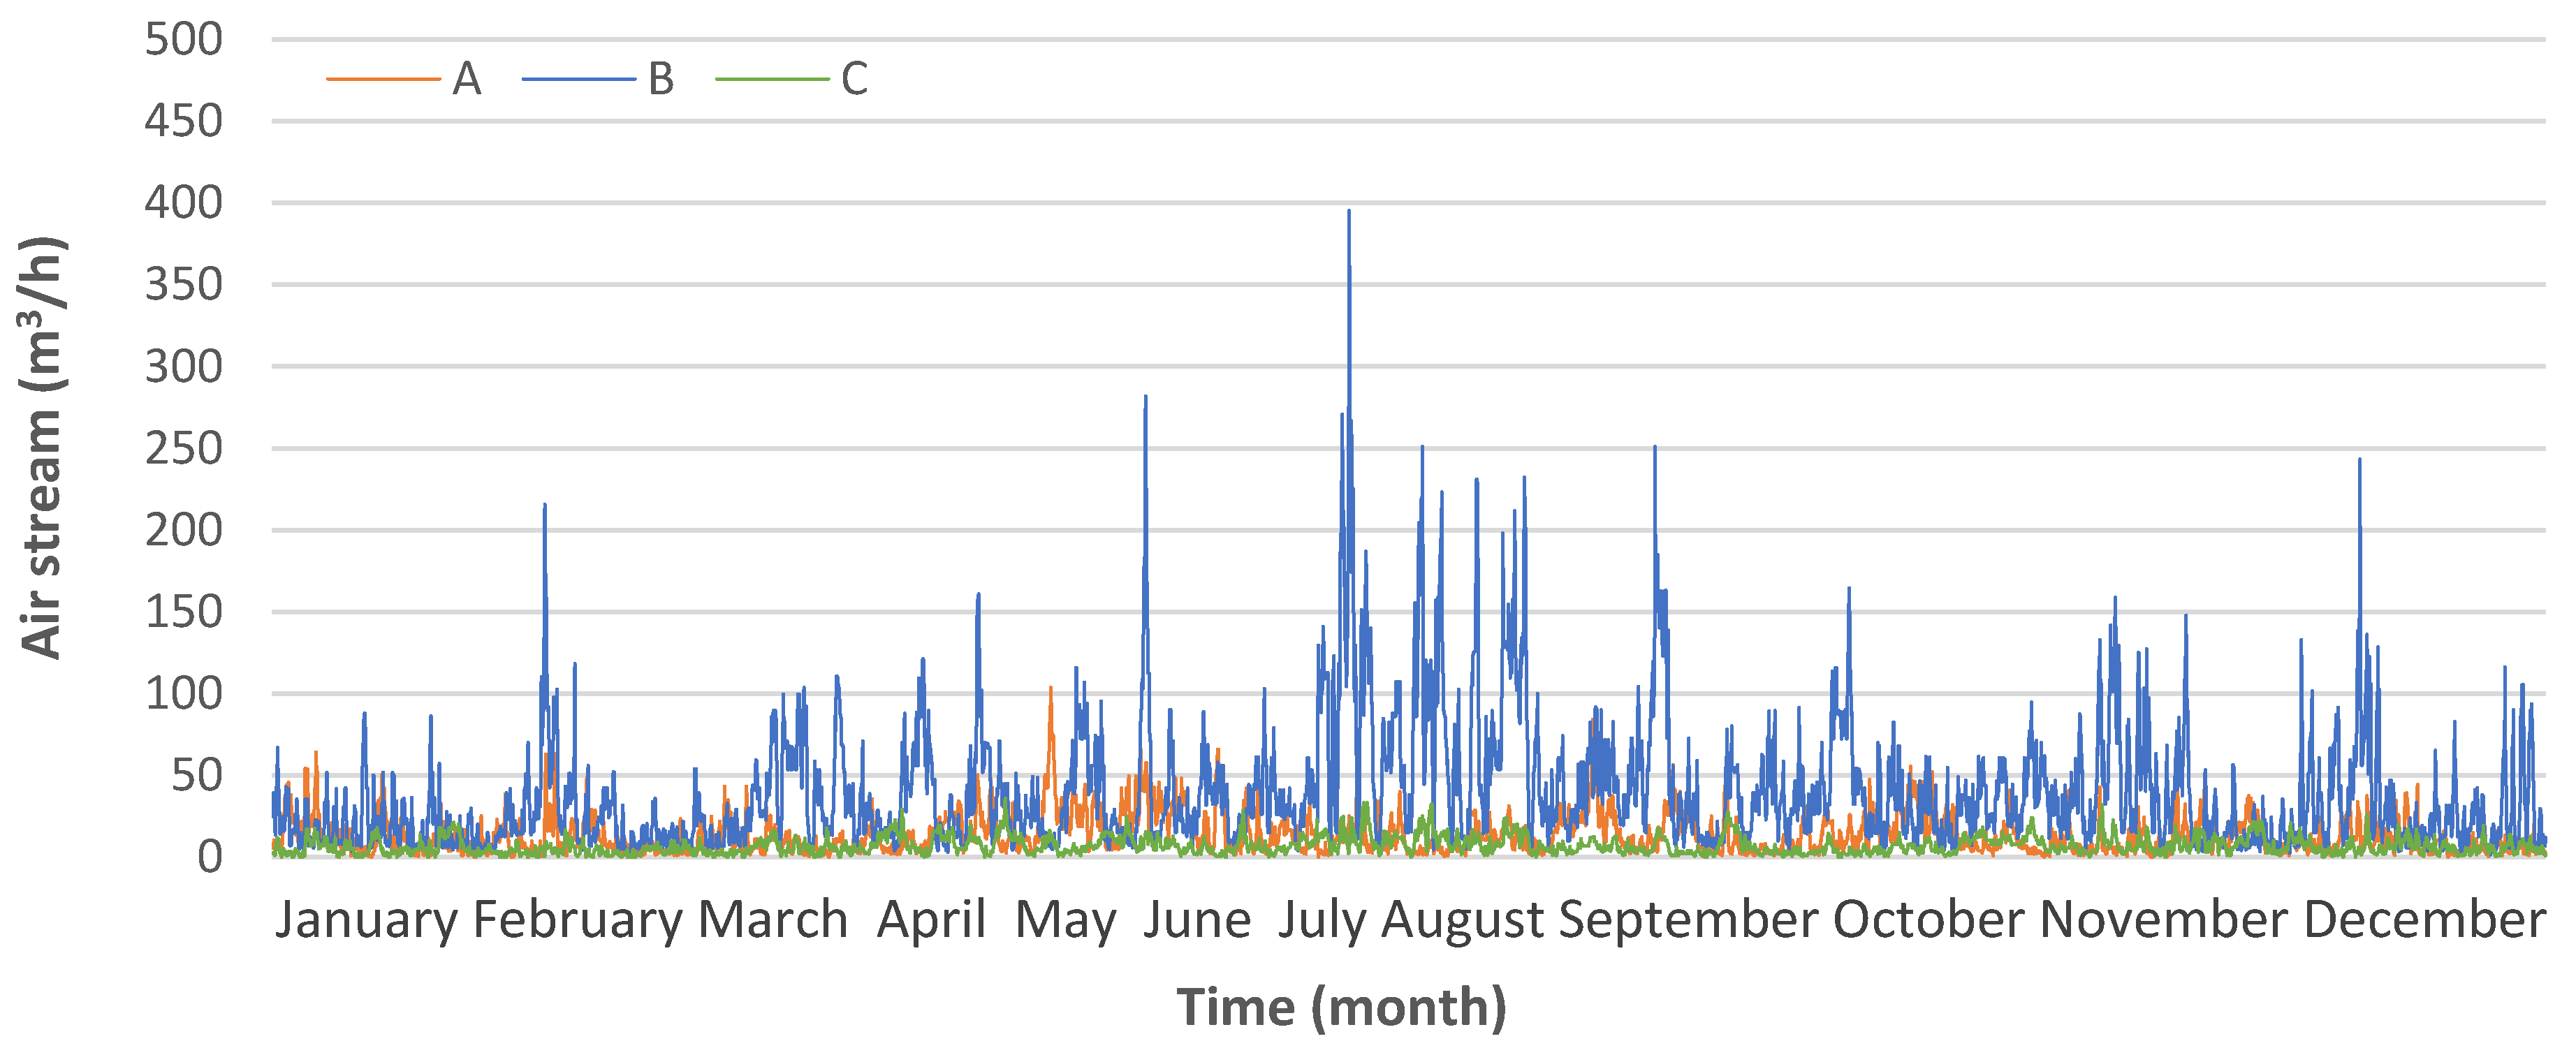
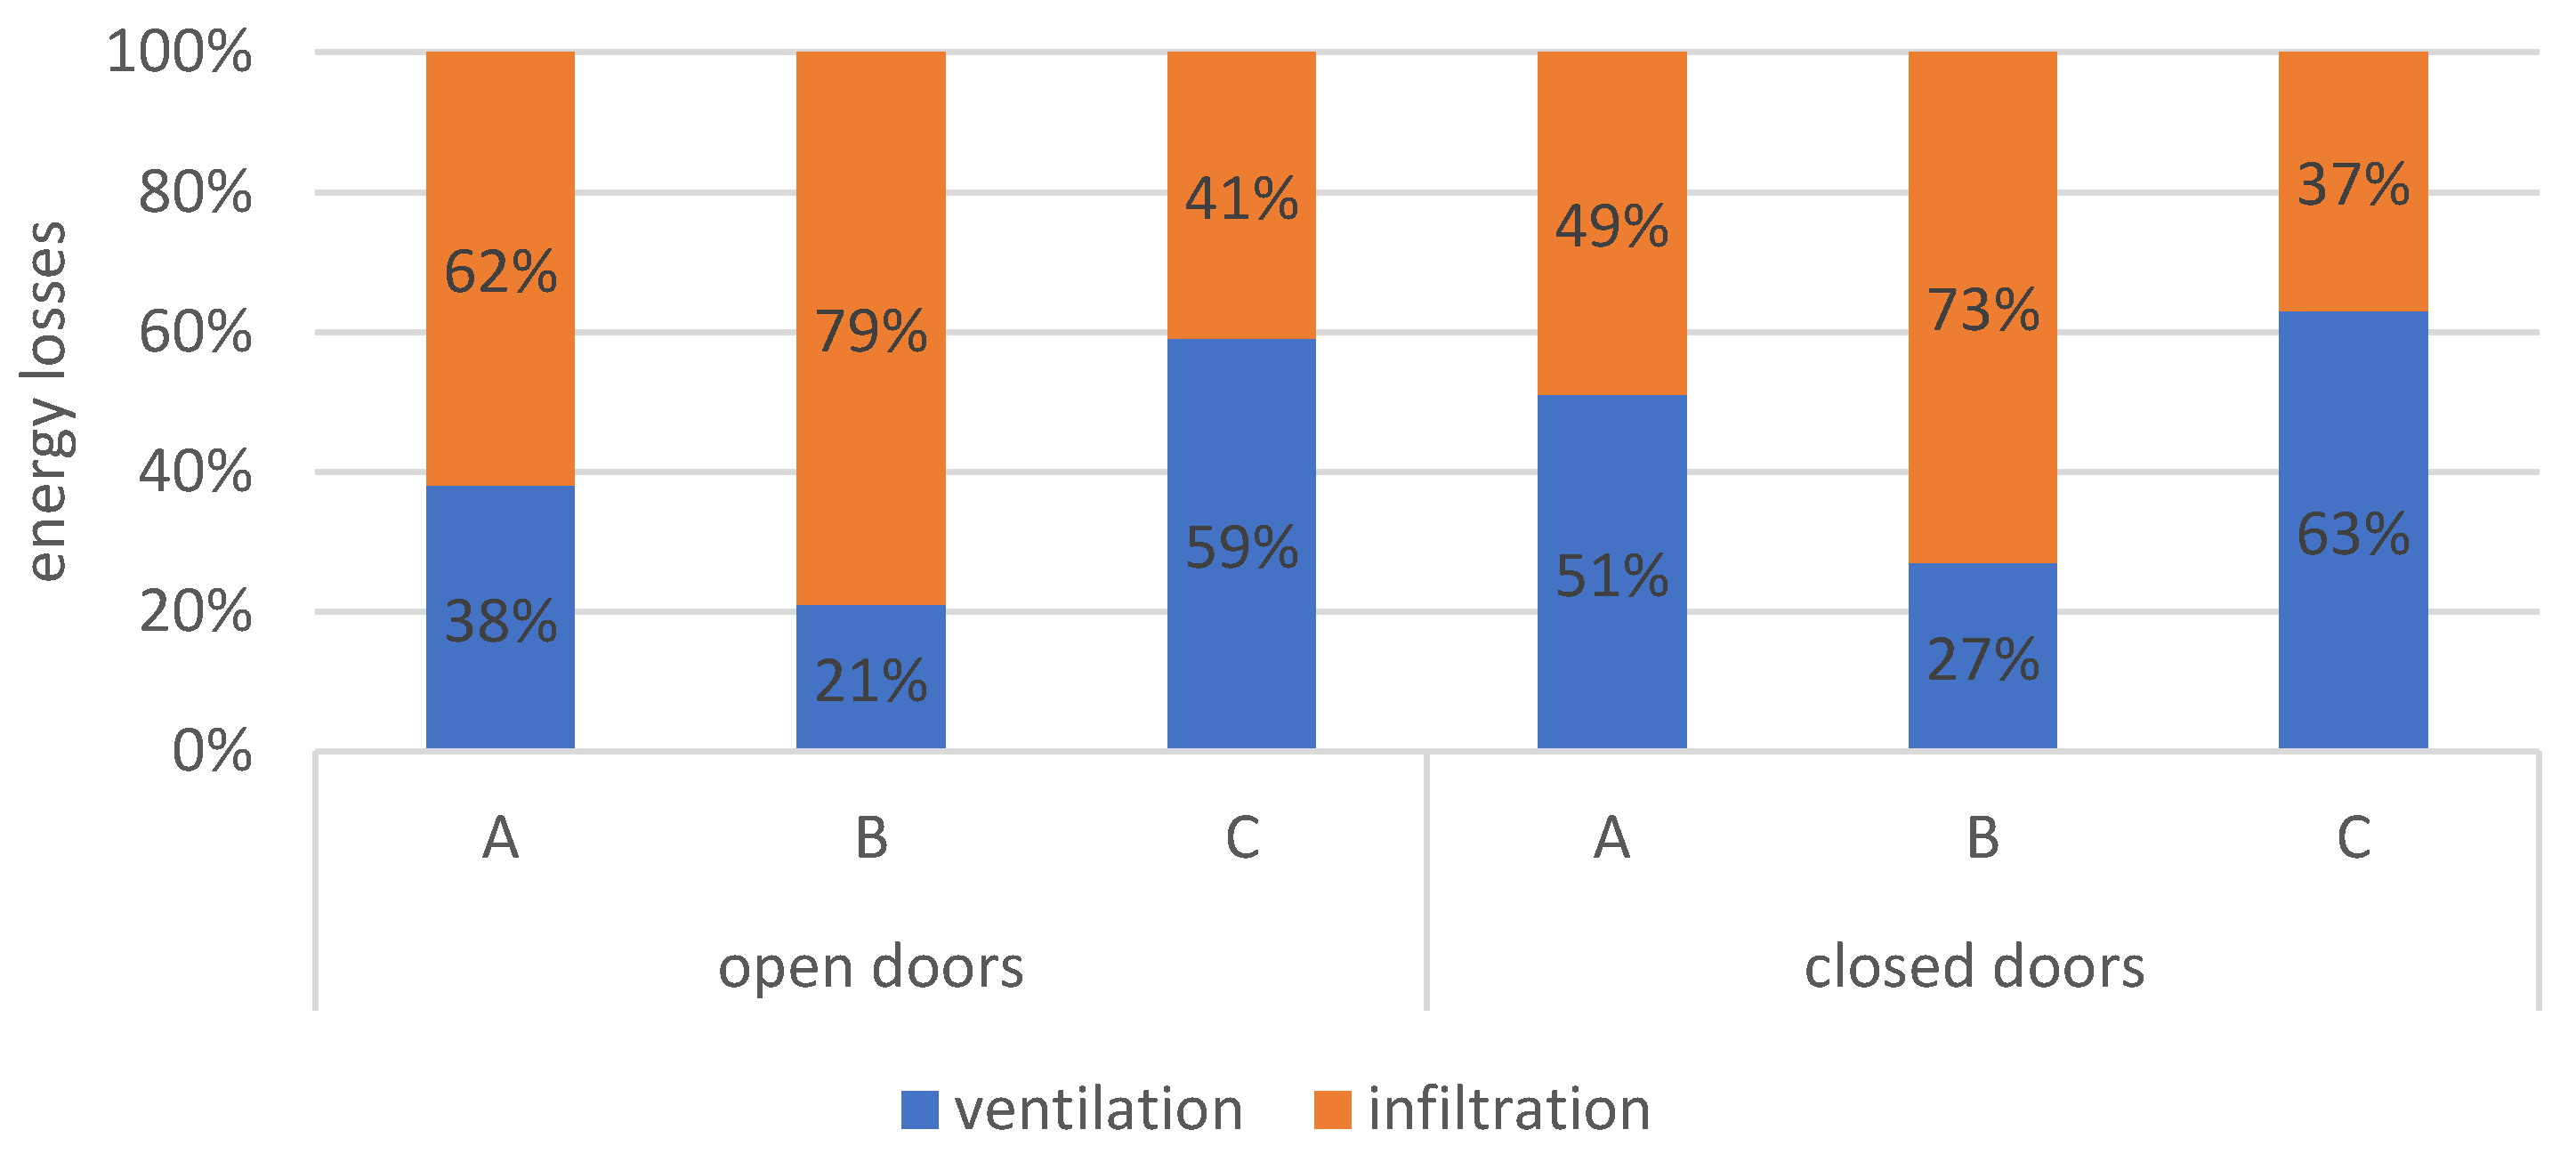
5.1. The Effect of Local Conditions on Infiltrating Air Flow

To determine the real impact of the building’s airtightness on the amount of infiltrating air, simulations were carried out in the conditions of actual building operation. The analyses were carried out for the previously determined heating periods. The simulations concerned the determination of:
  • Airstreams infiltrating through leaks;
  • The energy required to heat up the ventilation and infiltration air.
The analyses carried out compared both the airflow rates and energy losses resulting from infiltration and hygienic ventilation of rooms. It was assumed that ventilation considers heat recovery from the exhaust air (with maximum heat recovery of 90%).
First, calculations were made when the internal doors between the rooms were open. In addition, airflow through leaks was simulated when the internal door was closed. The second analysis was performed since, in residential buildings, the internal doors to individual rooms are often closed, which is a result of generally accepted behavior and habits of residents. The rooms to which the doors were most often closed during their use include bathrooms, toilets, utility rooms, and vestibules. In this paper, two cases of placing all internal doors have been assumed: open to the reveal (airflow, in this case, takes place through the entire door opening) and closed (airflow is possible only through holes/slots made in the lower part of the door). As it should have been expected, closing the inner door causes lowering the airflow through leaks in relation to the case when the inner door is open.
In building B, there were the greatest momentary changes of the infiltrating air stream, exceeding several times in the analyzed period, the value of 400 m3/h (Figure 7). In the remaining analyzed buildings, the maximum value did not exceed 250 m3/h—in the case of building A, and 50 m3/h for building C. Obtained results were the effect of differential tightness n50 and meteorological conditions of a given location. It was characteristic that in the case of building B, practically during the whole heating season, the stream of infiltrating air did not reach the zero value. The total number of hours in which there was no air infiltration was 1 h for building A, 0 h for building B, and 108 h for building C (Figure 7). It resulted directly from climate data characteristics for each location.
Similar changes in the infiltrating airstream were obtained, assuming that the interior doors in the rooms are completely closed (Figure 8). However, the maximum values were, in most cases, lower than for a building where the door remains open (Figure 7). However, this is not a rule, which results directly from the wind direction. If it directly affects the facade with a given leak, the inflow of air into the room will occur regardless of the possibility of its flow to other zones in the building, although it will certainly weaken overall flow.
In Table 4, a list of ventilation and infiltration airstreams was made for the analyzed buildings. The largest total and average seasonal airflows were in building B, and this was the case with both open and closed internal doors. In the analyzed buildings, mechanical ventilation was used, where it is assumed that the stream reaches a constant value independent of weather conditions and the degree of opening of internal doors. Comparing the level of the infiltrating air stream with the ventilation air stream, the size of the latter was higher in all analyzed buildings.
Comparing the average airflow values (Table 4), it was correct that closing the inner door reduced the infiltrating airflow. For building B (which obtained the highest value of n50 among the buildings subjected to simulations), the drop in value was 19.2 m3/h, for building A—10.1 m3/h, and C—1.4 m3/h.
The second analysis concerned the influence of the level of sheltering and location of the building on air infiltration, assuming that the internal doors are open to the reveal. Two buildings (A and C) were used in the simulation: with the lowest and highest degree of tightness. The buildings were in two extreme locations (Katowice and Warsaw) in terms of windiness. There was also a dependence on the airflow level in different locations. In the case of Warsaw, for the unsheltered building B, the extreme value occurred in the case of airflow to the building. However, with the opposite direction of airflow (from the building), the differences were much smaller.
As expected, the flow of infiltrating and exfiltrating air decreased as the shielding increased. The average value of the airflow from building B, during the heating season, for all leaks (in the case of an unsheltered building) was 66 m3/h for Katowice and 101 m3/h for Warsaw, respectively (Table 5). Comparing the air flow for a sheltered building, the average values were respectively—24 m3/h for Katowice and 35 m3/h for Warsaw. It proves that the location of building B had a significant influence on the size of the infiltrating airstream at the same value of n50. Table 5 presents a summary of average airflow values through leaks.
Building C in two locations: Katowice and Warsaw, and three levels of sheltering were also compared. It should be noted that, as in the case of building B, the highest average values occurred in the case of the unsheltered building (Table 5). The change of the building’s shielding from unsheltered (k = 1.0) to medium-sheltered (k = 0.8) resulted in a decrease in the level of air flowing through the leaks by 29% (in case of the location of building C in Katowice) and 31% (in Warsaw). Comparably as in the case of building B, the airflow was even more reduced when the sheltered and unsheltered building was compared. The difference in values was 62% and 66% (Table 5), respectively, in the case of the building’s location in Katowice and Warsaw. The change of the location of building B from Katowice to Warsaw resulted in an increase in the infiltrating air stream by 35 m3/h in the absence of cover and 11 m3/h for the sheltered building.
The average value of the airflow rate, during the heating season, for all leaks in the case of the unsheltered building C located in Katowice was 6 m3/h, and in Warsaw 11 m3/h (Table 5). It proves that the location of the building, similarly to building B, had a significant influence on the size of the infiltrating air stream, with the same level of n50.
The differences between the infiltrating airstreams in the analyzed locations may have been caused by a higher probability of higher wind speeds in Warsaw.

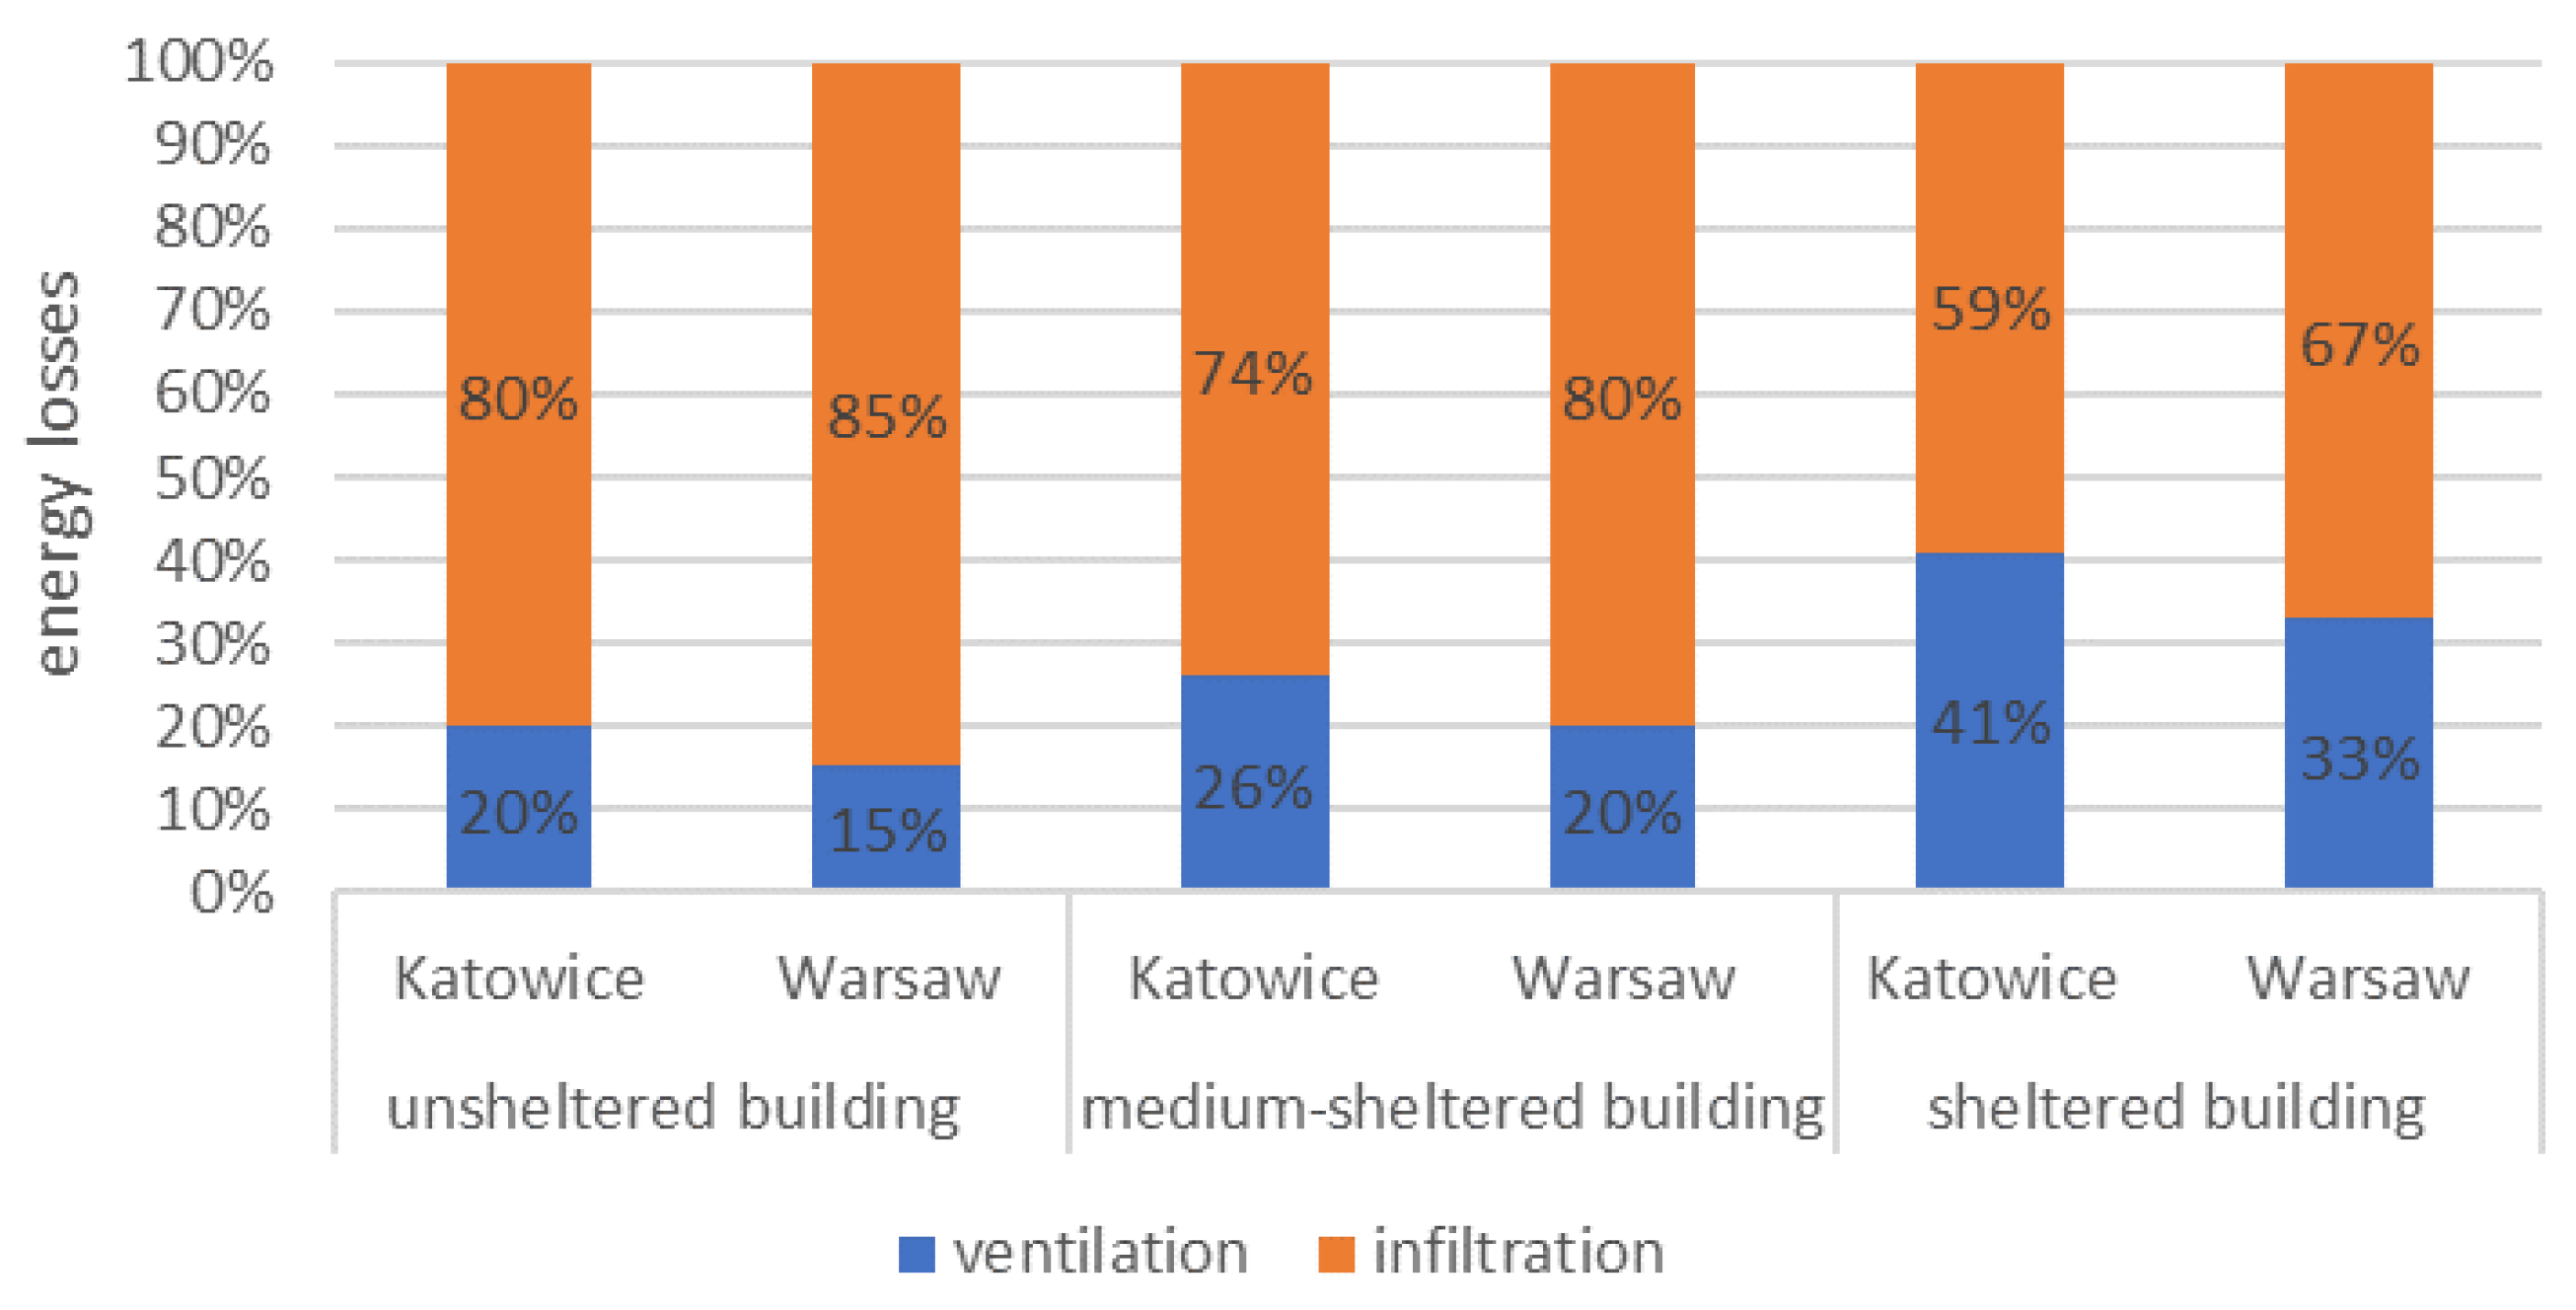
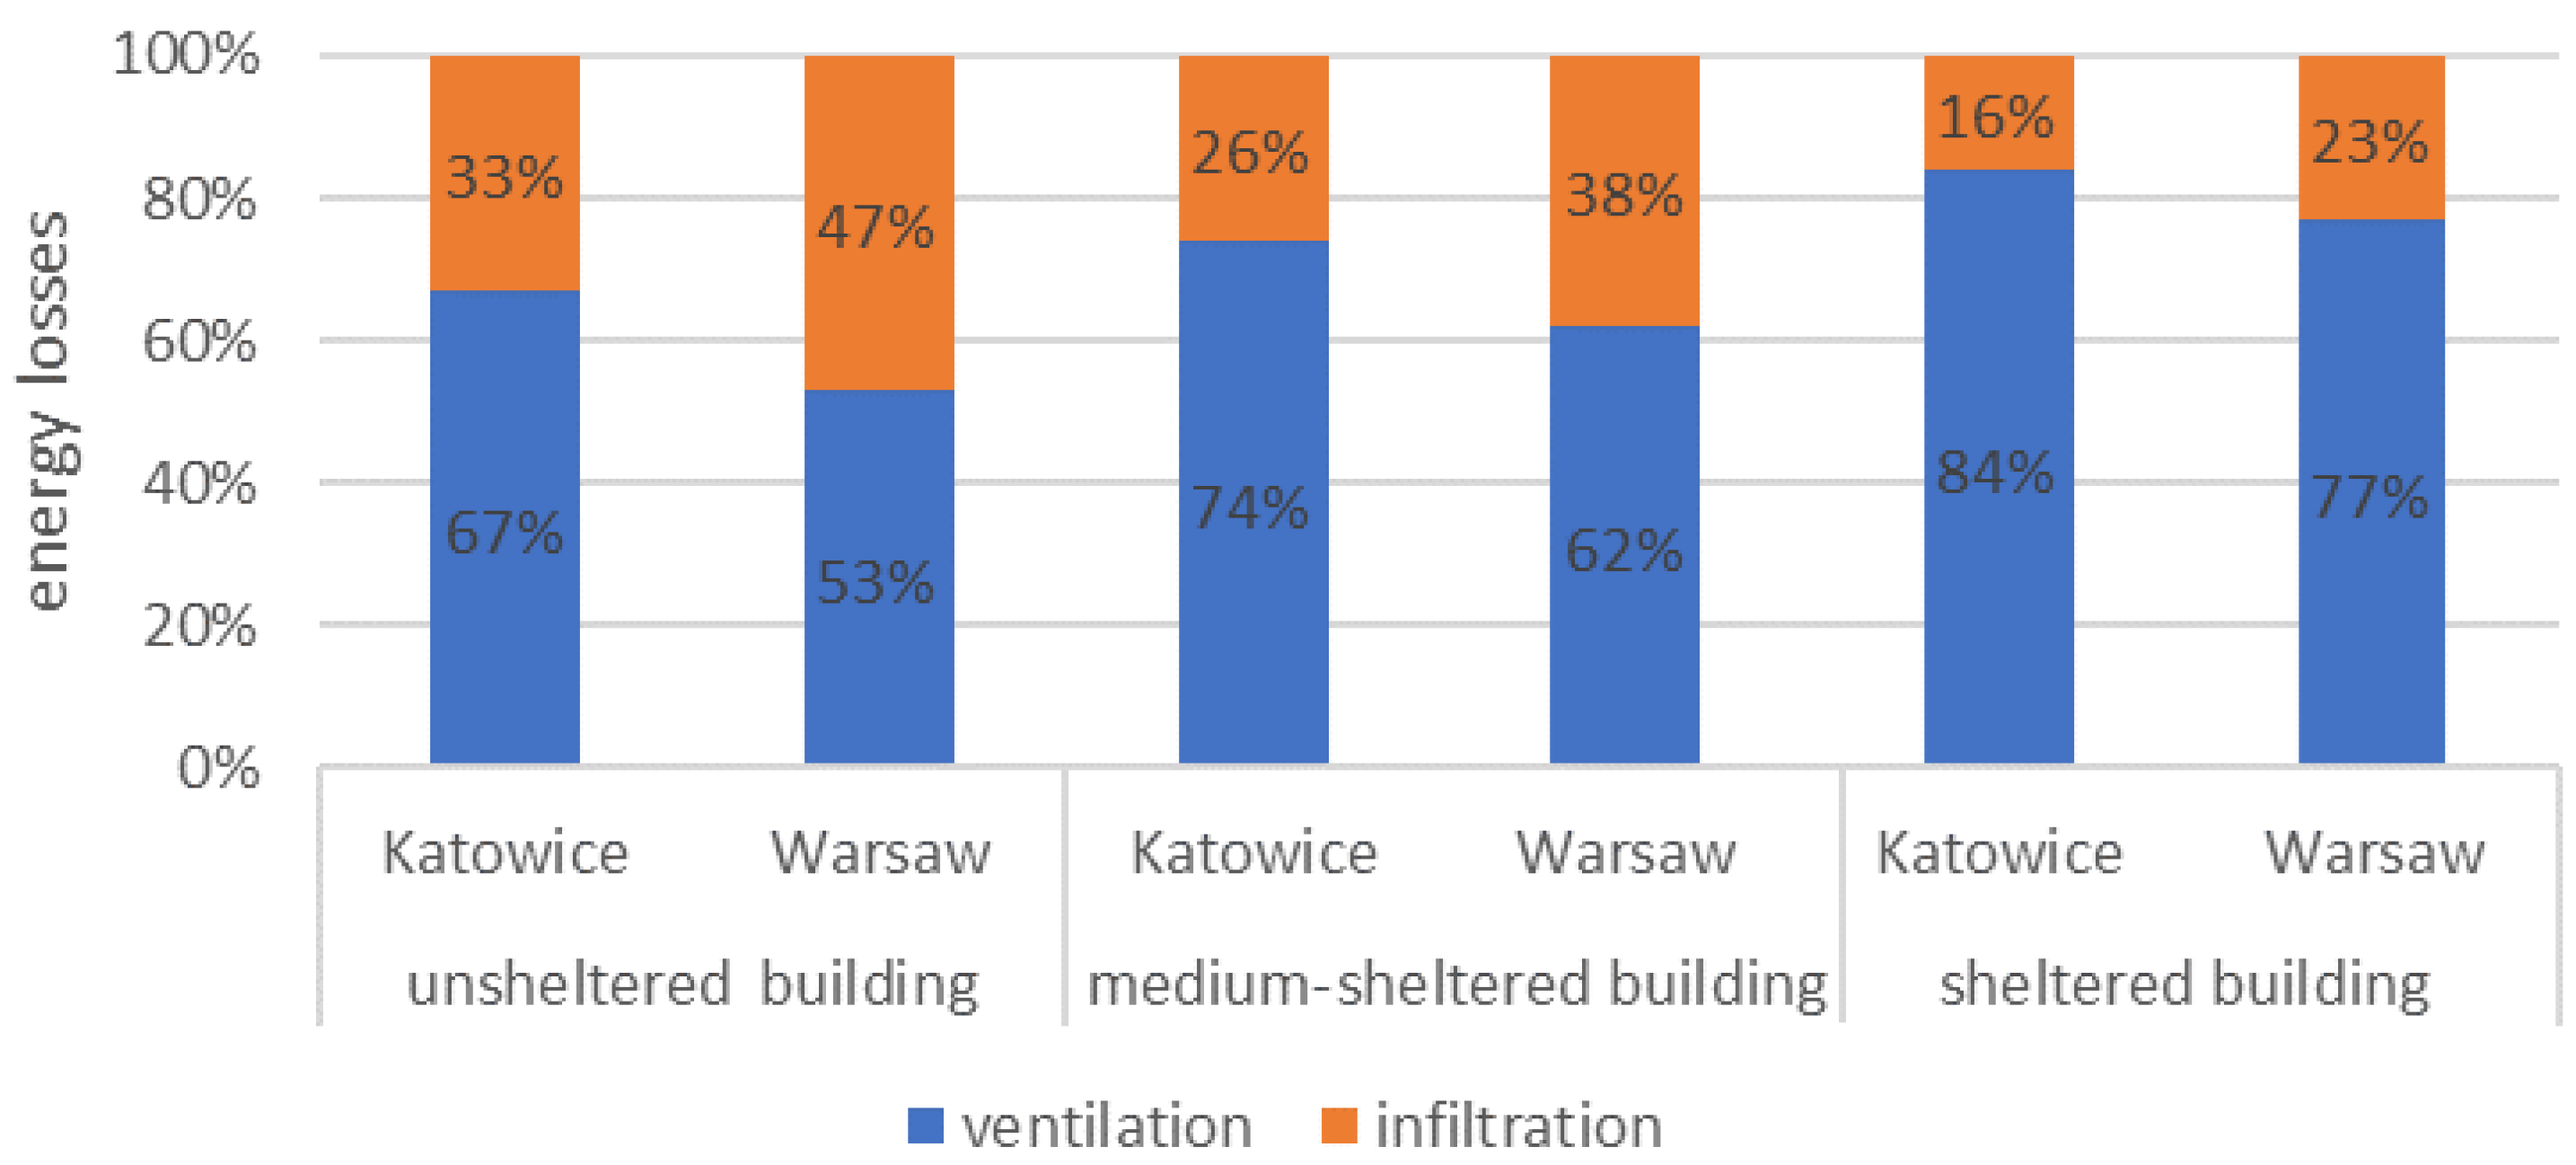
5.2. The Effect of Wind Speed and External Temperature on Energy Demand

To determine the heat demand for ventilation (including infiltration), the maximum efficiency of heat recovery for all buildings was assumed to be 90%. The analyses considered the change of heat recovery efficiency depending on the temperature difference (between the temperature of the internal and external environment).
In Table 6, the total heat losses for individual buildings are listed. The highest losses for infiltration were obtained for the building with the highest value of n50 (building B). When the internal doors were open, the losses were almost 1400 kWh. If the doors were closed, this value decreased by 30%.
Analyzing building C, where the smallest airflows between the indoor and outdoor environments were recorded, the lowest heat losses due to infiltration were also obtained (233 kWh for open doors and 198 kWh for closed doors) (Table 6). They constituted 41% and 37%, respectively, for open and closed internal doors (Figure 9). Building C (in comparison to others) has the lowest losses, although the share for ventilation loss was the largest.
Analyzing heat losses for heating the ventilation air (mechanical ventilation with heat recovery), the energy demand did not depend on whether the inner door is open or closed. The energy demand in the calculation of ventilation depends mainly on the temperature difference between the indoor and outdoor air. The heat demand for building B (n50 = 1.78 h−1) for climate data of Katowice due to infiltration (Table 7) was lower in comparison with the case of building B for climate data of Warsaw. As should have been expected, such a situation occurred regardless of the level of sheltering of the building.
Regardless of the degree of exposure of building B (whose level of tightness of the external partitions was the lowest of all analyzed) and its location, energy losses and power demand related to air infiltration were higher than those resulting from its ventilation (Table 7). The largest share of losses for air infiltration (in total losses for ventilation and infiltration) occurred in an unsheltered building for climate data of Warsaw (it amounted to 85%). If an identical building is considered for the climate data of Katowice, the share of losses was 80% (Figure 10).
The change of the building’s covering from unsheltered to sheltered (Table 7) resulted in the decrease of heat losses for infiltration to 59% in the case of building B located in Katowice and 67% in Warsaw.
In the case of building C, characterized by a high degree of tightness (n50 = 0.63 h−1), the heat demand for heating infiltration air was at a lower level than the losses associated with ventilation (Table 8). This dependence occurred regardless of the level of shelter.
In the case of building C, the biggest change in the share of energy losses for infiltration (in total losses for ventilation and infiltration), with the change in the degree of the building’s exposure (from unsheltered to sheltered), occurred in Warsaw (Figure 11). In the case of building C, the difference was 24% (change from 47% to 23%, respectively). In the situation where the location in Katowice was analyzed, the difference was 17% (change from 33% to 16%). It should be noted that not only the change of the building’s casing but also its location significantly influenced the change of losses related to the heating of infiltration air.

6. Discussion and Conclusions

Building airtightness becomes one of the crucial parameters for a new design or recently modernized energy-efficient buildings. Although this parameter determines only infiltration airflow, in any case, when heat recovering ventilation systems were applied, infiltration heat losses can become dominant. The local and national requirements are generally diversified around the world, but there is a nonrelation between local climatic conditions and airtightness level. Moreover, the requirements are not differentiated between well exposed and sheltered buildings; only in the USA existing requirements specify different levels of n50 for different groups of zones.
The presented analysis revealed that even for the same climatic zone (Poland belongs to Dfb according to the Köppen-Geiger classification), the local differences taking into account long term wind and temperature data could affect the different results on air infiltration rate and energy needs. Similar differences were identified for different levels of building exposure. Based on the results of numerical simulation, it can be noticed that the effect of local conditions depends on the overall airtightness of the building envelope. For relatively well-tight building (n50 = 0.63 h−1), the differences in infiltration heat losses between the two analyzed locations in Poland are from 70 to 90%. The building surroundings affect even more than local climate when energy for infiltration can be even three times higher in the case of an unsheltered building, exposed to wind induce in comparison to the sheltered case.
This leads to the conclusion that any future requirements of building airtightness could consider not only the type of ventilation system (natural or mechanical) but also local climatic conditions as well as building exposure. A similar approach was used in the past in the case of wind effect on building construction (Eurocode 1: Actions on structures—Part 1–4: General actions—Wind actions) and could be successfully adopted in a case of building energy performance analysis. The presented results confirmed that even for the same country, three different locations in a lowland area could differ in wind data and consequently affects air infiltration rate. The way the buildings are positioned and their mutual aerodynamic shading effect has an even greater impact on the results. Regarding the airtightness requirements presented in Section 2, it seems to be justified to diversify the requirements according to the building location. The presented analysis is limited to the heating season only, and it is self-explanatory that the heating season is essential in case of airtightness. An additional analysis which should be done for different locations around the world could determine the climatic zones where airtightness issue could be omitted. For other locations, the requirements could be determined, including building exposure to wind induce. Requirements for buildings located on the seaside or in a mountain should be differentiated from requirements for buildings settled in inland, lowland terrain. The more stringent requirements (lower n50) should be recommended for buildings located on the open space or tall buildings in the urban settlements. The lower restrictions (higher n50) can be permissible for buildings sheltered by others, located in a forest, or in a dense urban development.
Although the analyses were limited to three locations and three single-family houses, the conclusions regarding overall differences in airflow rates and energy needs can be treated as general. However, the detailed results of airflow rate and energy requirements are limited just for three specific buildings and their locations.
Finally, the identified differences in the obtained results were made possible by using a simulation method. In the steady-state method, when the wind effect is not considered, the results of energy demand will display only the effect of external air temperature. Therefore, it is highly recommended to use a simulation method for any analysis of air infiltration in the context of building energy performance.

Author Contributions

Conceptualization, D.H.; methodology, A.M. and D.H.; software, A.M.; validation, A.M. and D.H.; formal analysis, A.M. and D.H.; investigation, A.M. and D.H.; resources, A.M.; writing—original draft preparation, A.M. and D.H.; writing—review and editing, D.H.; visualization, A.M.; supervision, D.H. All authors have read and agreed to the published version of the manuscript.

Funding

This research received no external funding. The APC was funded by the Lodz University of Technology.

Institutional Review Board Statement

Not applicable.

Informed Consent Statement

Not applicable.

Data Availability Statement

Data sharing not applicable.

Acknowledgments

The authors would like to thank Piotr Narowski from the Faculty of Building Services, Hydro and Environmental Engineering, Warsaw University of Technology, for his support in the development of weather data for energy calculations.

Conflicts of Interest

The authors declare no conflict of interest.

References

  1. Etheridge, D. A perspective on fifty years of natural ventilation research. Build. Environ. 2015, 91, 51–60. [Google Scholar] [CrossRef]
  2. Erhorn-Kluttig, H.; Erhorn, H.; Lahmidi, H.; Anderson, R. Airtightness requirements for high performance building envelopes. In Proceedings of the 4th Intern. Symposium on Building and Ductwork Air tightness 30th AIVC Conference “Trends in High Performance Buildings”, Berlin/Germany, Germany, 1–2 October 2009. [Google Scholar]
  3. Miszczuk, A. Influence of air tightness of the building on its energy-efficiency in single-family buildings in Poland. In Proceedings of the XXVI R-S-P Seminar 2017 Theoretical Foundation of Civil Engineering, Warsaw, Poland, 21–25 August 2017; Volume 117. [Google Scholar]
  4. Weston, T.; Nelson, K.; Wissink, K. Whole Building Air Leakage: Testing and Building Performance Impacts; ASTM International: West Conshohocken, PA, USA, 2019; ISBN 978-0-8031-7676-8. [Google Scholar]
  5. Poza-Casado, I.; Cardoso, V.E.M.; Almeida, R.M.S.F.; Meiss, A.; Ramos, N.M.M.; Padilla-Marcos, M.Á. Residential buildings airtightness frameworks: A review on the main databases and setups in Europe and North America. Build. Environ. 2020, 183, 107221. [Google Scholar] [CrossRef]
  6. Han, G.; Srebric, J.; Enache-Pommer, E. Different modeling strategies of infiltration rates for an office building to improve accuracy of building energy simulations. Energy Build. 2015, 86, 288–295. [Google Scholar] [CrossRef]
  7. Younes, C.; Shdid, C.A.; Bitsuamlak, G. Air infiltration through building envelopes: A review. J. Build. Phys. 2011, 35, 267–302. [Google Scholar] [CrossRef]
  8. Allen, E.; Thallon, R.; Schreyer, A.C. Fundamentals of Residential Construction, 4th ed.; John Wiley & Sons: Hoboken, NJ, USA, 2017. [Google Scholar]
  9. Raman, G.; Chelliah, K.; Prakash, M.; Muehleisen, R.T. Detection and quantification of building air infiltration using remote acoustic methods. In Proceedings of the Inter-Noise 2014, Melbourne, Australia, 16–19 November 2014; p. 10. [Google Scholar]
  10. Emmerich, S.J.; Persily, A.K. Energy impacts of infiltration and ventilation in U.S. office buildings using multizone airflow simulation. IAQ Energy 1998, 98, 191–203. [Google Scholar]
  11. Jokisalo, J.; Kurnitski, J.; Korpi, M.; Kalamees, T.; Vinha, J. Building leakage, infiltration, and energy performance analyses for Finnish detached houses. Build. Environ. 2009, 44, 377–387. [Google Scholar] [CrossRef]
  12. Sowa, J. Creation of the indoor environment in office buildings. ASHRAE J. 2020, 62, 64–68. [Google Scholar]
  13. Piasecki, M.; Kostyrko, K. Development of weighting scheme for indoor air quality model using a multi-attribute decision making method. Energies 2020, 13, 3120. [Google Scholar] [CrossRef]
  14. Crawley, J.; Wingfield, J.; Elwell, C. The relationship between airtightness and ventilation in new UK dwellings. Build. Serv. Eng. Res. Technol. 2018, 40, 274–289. [Google Scholar] [CrossRef] [Green Version]
  15. Ala-Kotila, P.; Vainio, T.; Laamanen, J. The influence of building renovations on indoor comfort—A field test in an apartment building. Energies 2020, 13, 4958. [Google Scholar] [CrossRef]
  16. Kisilewicz, T.; Nowak-Dzieszko, K.; Rojewska-Warchał, M. Influence of building airtightness on the internal thermal comfort and air quality in the single family house. In Proceedings of the IOP Conference Series: Materials Science and Engineering, 10th International Conference IAQVEC 2019: Indoor Air Quality, Ventilation and Energy Conservation in Buildings, Bari, Italy, 5–7 September 2019; Volume 609, p. 032064. [Google Scholar]
  17. Firlag, S. Cost-optimal plus energy building in a cold climate. Energies 2019, 12, 3841. [Google Scholar] [CrossRef] [Green Version]
  18. Miszczuk, A. The Level of Airtightness in Energy-efficient Single-family Houses in Poland. Procedia Eng. 2016, 153, 461–466. [Google Scholar] [CrossRef] [Green Version]
  19. Kwiatkowski, J.; Sowa, J.; Trząski, A.; Wiszniewski, A. Dormitory thermal retrofitting to nZEB standard. IOP Conf. Ser. Mater. Sci. Eng. 2018, 415, 12002. [Google Scholar] [CrossRef]
  20. Shrestha, P.M.; Humphrey, J.L.; Barton, K.E.; Carlton, E.J.; Adgate, J.L.; Root, E.D.; Miller, S.L. Impact of low-income home energy-efficiency retrofits on building air tightness and healthy home indicators. Sustainability 2019, 11, 2667. [Google Scholar] [CrossRef] [Green Version]
  21. Basińska, M.; Koczyk, H. Analysis of the possibilities to achieve the low energy residential buildings standards. Technol. Econ. Dev. Econ. 2016, 22, 830–849. [Google Scholar] [CrossRef]
  22. Górzeński, R.; Szymański, M.; Górka, A.; Mróz, T. Airtightness of Buildings in Poland. Int. J. Vent. 2014, 12, 391–400. [Google Scholar] [CrossRef]
  23. Kalamees, T. Air tightness and air leakages of new lightweight single-family detached houses in Estonia. Build. Environ. 2007, 42, 2369–2377. [Google Scholar] [CrossRef]
  24. Ahmed, K.; Carlier, M.; Feldmann, C.; Kurnitski, J. A new method for contrasting energy performance and near-zero energy building requirements in different climates and countries. Energies 2018, 11, 1334. [Google Scholar] [CrossRef] [Green Version]
  25. Hamdy, M.; Hasan, A.; Siren, K. A multi-stage optimization method for cost-optimal and nearly-zero-energy building solutions in line with the EPBD-recast 2010. Energy Build. 2013, 56, 189–203. [Google Scholar] [CrossRef]
  26. Global Wind Atlas 3.0. A Free, Web-Based Application Developed, Owned And Operated By The Technical University Of Denmark (DTU). Available online: https://globalwindatlas.info/ (accessed on 20 November 2020).
  27. Wang, J.-W.; Yang, H.-J.; Kim, J.-J. Wind speed estimation in urban areas based on the relationships between background wind speeds and morphological parameters. J. Wind Eng. Ind. Aerodyn. 2020, 205, 104324. [Google Scholar] [CrossRef]
  28. Allegrini, J.; Lopez, B. The influence of angular configuration of two buildings on the local wind climate. J. Wind Eng. Ind. Aerodyn. 2016, 156, 50–61. [Google Scholar] [CrossRef]
  29. Jamińska-Gadomska, P.; Lipecki, T.; Pieńko, M.; Podgórski, J. Wind velocity changes along the passage between two angled walls—CFD simulations and full-scale measurements. Build. Environ. 2019, 157, 391–401. [Google Scholar] [CrossRef]
  30. Montazeri, H.; Blocken, B.; Derome, D.; Carmeliet, J.; Hensen, J.L.M. CFD analysis of forced convective heat transfer coefficients at windward building facades: Influence of building geometry. J. Wind Eng. Ind. Aerodyn. 2015, 146, 102–116. [Google Scholar] [CrossRef] [Green Version]
  31. Hadavi, M.; Pasdarshahri, H. Quantifying impacts of wind speed and urban neighborhood layout on the infiltration rate of residential buildings. Sustain. Cities Soc. 2020, 53, 101887. [Google Scholar] [CrossRef]
  32. Feng, C.; Gu, M.; Zheng, D. Numerical simulation of wind effects on super high-rise buildings considering wind veering with height based on CFD. J. Fluids Struct. 2019, 91, 102715. [Google Scholar] [CrossRef]
  33. Carpentieri, M.; Robins, A.G. Influence of urban morphology on air flow over building arrays. J. Wind Eng. Ind. Aerodyn. 2015, 145, 61–74. [Google Scholar] [CrossRef] [Green Version]
  34. Klemm, K.; Marks, W.; Klemm, A.J. Multicriteria optimisation of the building arrangement with application of numerical simulation. Build. Environ. 2000, 35, 537–544. [Google Scholar] [CrossRef]
  35. Khoshdel Nikkho, S.; Heidarinejad, M.; Liu, J.; Srebric, J. Quantifying the impact of urban wind sheltering on the building energy consumption. Appl. Therm. Eng. 2017, 116, 850–865. [Google Scholar] [CrossRef] [Green Version]
  36. Narowski, P.; Janicki, M.; Heim, D. Comparison of untypical meteorological years (umy) and their influence on building energy performance simulations. In Proceedings of the BS 2013: 13th Conference of the International Building Performance Simulation Association, Chambéry, France, 26–28 August 2013; pp. 1414–1421. [Google Scholar]
  37. Pernigotto, G.; Walsh, A.; Gasparella, A.; Hensen, J.L.M. Clustering of European Climates and Representative Climate Identification for Building Energy Simulation Analyses. In Proceedings of the 16th IBPSA Conference, Rome, Italy, 2–4 September 2019; pp. 4833–4840. [Google Scholar]
  38. Kottek, M.; Grieser, J.; Beck, C.; Rudolf, B.; Rubel, F. World map of the Köppen-Geiger climate classification updated. Meteorol. Z. 2006, 15, 259–263. [Google Scholar] [CrossRef]
  39. Cóstola, D.; Blocken, B.; Hensen, J.L.M. Overview of pressure coefficient data in building energy simulation and airflow network programs. Build. Environ. 2009, 44, 2027–2036. [Google Scholar] [CrossRef] [Green Version]
  40. Sherman, M.H.; Chan, W.R. Building Airtightness: Research and Practice. In State of the Art in Ventilation; James & James: London, UK, 2003; pp. 8–12. [Google Scholar]
  41. Zheng, X.; Mazzon, J.; Wallis, I.; Wood, C.J. Airtightness measurement of an outdoor chamber using the Pulse and blower door methods under various wind and leakage scenarios. Build. Environ. 2020, 179, 106950. [Google Scholar] [CrossRef]
  42. Sobolewski, A.; Żurański, J.A. Zasoby energetyczne wiatru w Polsce. Biul. Inf. IBMER 1981, 1/204, 70–83. [Google Scholar]
  43. Flaga, A. Wind Engineering; Arkady: Warszawa, Poland, 2008. [Google Scholar]
  44. Heim, D.; Miszczuk, A. Modelling building infiltration using the airflow network model approach calibrated by air-tightness test results and leak detection. Build. Serv. Eng. Res. Technol. 2020, 41, 681–693. [Google Scholar] [CrossRef]
  45. Monari, F.; Strachan, P. Characterization of an airflow network model by sensitivity analysis: Parameter screening, fixing, prioritizing and mapping. J. Build. Perform. Simul. 2017, 10, 17–36. [Google Scholar] [CrossRef] [Green Version]
  46. Clarke, J.A.; Kelly, N.J.; Tang, D. A Review of ESP-r’s Flexible Solution Approach and its Application to Prospective Technical Domain Developments. Adv. Build. Energy Res. 2007, 1, 227–247. [Google Scholar] [CrossRef]
Figure 1. Distribution of maximum wind speeds (m/s) determined for a heating season (from September to April).
Energies 14 00127 g001
Figure 2. Distribution of the prevailing wind directions determined for a heating season (from September to April).
Energies 14 00127 g002
Figure 3. Wind speed (m/s) distribution function determined for a heating season (from September to April).
Energies 14 00127 g003
Figure 4. External air temperatures for the location determined for a heating season (from September to April). The highest probability of positive values of temperatures occurs in Poznan.
Energies 14 00127 g004
Figure 5. Building layout and nodes with components of flow network for buildings (ac) [44].
Energies 14 00127 g005
Figure 6. Results of the numerical and in-situ leak tests for analyzed buildings.
Energies 14 00127 g006
Figure 7. Temporary infiltration of air in the case when internal doors were open.
Energies 14 00127 g007
Figure 8. Temporary infiltration of air in the case when internal doors were closed.
Energies 14 00127 g008
Figure 9. Percentage distribution of total energy losses on ventilation and air infiltration in the analyzed buildings.
Energies 14 00127 g009
Figure 10. Percentage distribution of total heat losses for ventilation and air infiltration with a division into the level of sheltering for building B.
Energies 14 00127 g010
Figure 11. Percentage distribution of total heat losses for ventilation and air infiltration with division into the level of sheltering for building C.
Energies 14 00127 g011
Table 1. Parameters used to determine the permissible level of infiltration.
ParameterDescriptionEquationUnit
naair change rate at a PaVa/Vh−1
waspecific leakage rate at a PaVa/AEm3/h∙m2
qaair permeability rate at a PaVa/AFm3/h∙m2
where: Va (m3/h)—airflow rate at a pressure difference of a Pa. V (m3)—volume of air inside the measured building. AE (m2)—envelope area. AF (m2)—net floor area.
Table 2. Regulations regarding residential building air infiltration in different countries [5,41].
CountryParameterUnitsRequirements
Airtightness mandatory values
Austrian50h−1natural ventilation < 3.0
mechanical ventilation < 1.5
Belgium–Brussels regionn50h−1<0.6
Bosnian50h−1natural ventilation < 3.0
mechanical ventilation < 1.5
Croatian50h−1natural ventilation < 3.0
mechanical ventilation < 1.5
Czech Republicn50h−1natural ventilation < 4.5
mechanical ventilation < 1.5
heat recovery system < 1.0
Denmarkw50l/(s⋅m2)Aenv/Afloor ≤3: <1.0
Aenv/Afloor >3: <0.3
Franceq4m3/(h⋅m2)single-family < 0.6
multi-family < 1.0
Germanyn50h−1natural ventilation < 3.0
(exceptions with active components < 1.5)
mechanical ventilation < 1.5
Icelandq50m3/(h⋅m2)<3
Irelandq50m3/(h⋅m2)<5
Latviaq50m3/(h⋅m2)natural ventilation < 3.0
mechanical ventilation < 2.0
heat recovery system < 1.5
Liechtensteinq50m3/(h⋅m2)new buildings:
  • natural ventilation < 2.4
  • mechanical ventilation < 1.6
renovations:
  • natural ventilation < 3.6
  • mechanical ventilation < 2.4
Lithuanian50h−1class C: < 2.0
class B: < 1.5
class A: < 1.0
class A+ and A++: < 0.6
Luxembourgn50h−1natural ventilation < 3.0
mechanical ventilation < 1.5
heat recovery system < 1.0
Monacoq4m3/(h⋅m2)single-family < 0.6
multi-family < 1.0
Montenegron50h−1natural ventilation < 3.0
mechanical ventilation < 1.5
Netherlandsw10dm3/(s⋅m2)<1.0
Norwayn50h−1<1.5
Russian50h−1natural ventilation < 4.0
mechanical ventilation < 2.0
Slovenian50h−1natural ventilation < 3.0
mechanical ventilation < 2.0
Spainn50h−1compacity
V/AE ≤2: <6.0
V/AE ≥4: <3.0
Swedenq50m3/(h⋅m2)<0,6
Switzerlandq50m3/(h⋅m2)new buildings:
  • natural ventilation < 2.4
  • mechanical ventilation < 1.6
renovations:
  • natural ventilation < 3.6
  • mechanical ventilation < 2.4
United Kingdomq50m3/(h⋅m2)<10
USAn50h−1<3.0 climate zone 3 to 8
<5.0 climate zone 1 and 2
Airtightness recommended values
Polandn50h−1natural ventilation < 3.0
mechanical ventilation < 1.5
Airtightness default values that can be improved
Belgium (Flanders and Wallonia)q50m3/(h⋅m2)12
Canadan50h−13.2 with basic air barrier specifications
2.5 with extra prescriptive details
Estoniaq50m3/(h⋅m2)single-family: 6.0
other buildings: 3.0
Finlandq50m3/(h⋅m2)4.0
No whole building values suggested or no consideration at all
Albania, Andorra, Belarus, Bulgaria, Cyprus, Greece, Hungary, Italy (except Trento and Bolzano regions), Malta, Moldova, North Macedonia, San Marino, Serbia, Ukraine, Portugal, and Slovakia.
Table 3. Air change rate at 50 Pa obtained by the Blower Door Test.
BuildingABC
n50 (h−1)1.501.780.63
Table 4. Summary of infiltration and ventilation air streams, broken down into individual buildings.
BuildingABC
Air StreamSeasonal Total (m3/Season)Seasonal Average (m3/h)Seasonal Total (m3/Season)Seasonal Average (m3/h)Seasonal Total (m3/Season)Seasonal Average (m3/h)
ventilation621,600140576,000160568,800100
infiltrationinternal door open105,71323.8229,88463.946,4768.2
internal door closed60,84413.7160,87644.738,6756.8
total summaryinternal door open727,313163.8805,884223.9615,276108.2
internal door closed682,444153.7736,876204.7607,475106.8
Table 5. Seasonal average infiltration airflow determined from simulation calculations.
Type of Building EnvironmentFactor k (-)Infiltrating Air Stream (m3/h)
Building BBuilding C
KatowiceWarsawKatowiceWarsaw
unsheltered1.065.7100.65.810.7
medium-sheltered0.846.670.54.17.4
sheltered0.523.934.52.23.6
Table 6. Summary of total losses for ventilation and air infiltration, broken down into individual buildings.
BuildingABC
heat for ventilation (kWh) 387.3368.6337.6
heat for infiltration (kWh)internal door open640.61 399.8233.2
internal door closed370.3985.5197.5
total heat for ventilation and infiltration (kWh)internal door open1 027.91 768.4570.8
internal door closed757.61 354.1535.1
Table 7. Summary of total losses for ventilation and air infiltration, including the different levels of sheltering of building B.
LocationKatowiceWarsaw
heat for ventilation (kWh) 385397
heat for infiltration (kWh)unsheltered building14972311
medium-sheltered building10681 626
sheltered building554808
total heat for ventilation and infiltration (kWh)unsheltered building18822708
medium-sheltered building14532023
sheltered building9391205
Table 8. Summary of total losses for ventilation and air infiltration with division into the different level of sheltering of the building C.
LocationKatowiceWarsaw
heat for ventilation (kWh) 326338
heat for infiltration (kWh)unsheltered building157300
medium-sheltered building114209
sheltered building60101
total heat for ventilation and infiltration (kWh)unsheltered building483638
medium-sheltered building440547
sheltered building386439
Publisher’s Note: MDPI stays neutral with regard to jurisdictional claims in published maps and institutional affiliations.

