Article

Planform Geometry and Excitation Effects of PVDF-Based Vibration Energy Harvesters

1
Department of Mechanical, Aerospace and Civil Engineering, The University of Manchester, Manchester M1 3BB, UK
2
Aerospace Engineering Department, Faculty of Engineering, Cairo University, Giza 12613, Egypt
*
Author to whom correspondence should be addressed.
Energies 2021, 14(1), 211; https://doi.org/10.3390/en14010211
Submission received: 27 November 2020 / Revised: 18 December 2020 / Accepted: 29 December 2020 / Published: 3 January 2021

Abstract

:
In the present paper, we report a systematic investigation of planform geometry and excitation level effects on the dynamics and power generation characteristics of polyvinylidene difluoride (PVDF)-based cantilevered vibration energy harvesters. Piezoelectric vibration energy harvesters provide a promising energy harvesting solution for widespread use of wireless sensors in remote locations. Highly flexible PVDF polymers offer resonant frequencies at suitable range for harvesting mechanical energy within low-frequency applications, though information on the efficient sizing of these devices is currently limited. We test the response of a set of eight harvesters to typical vibration sources excitation levels in the range 0.2–0.6 g. This set comprises four widths and two lengths, incrementing each time by a factor of two. The selected range of dimensions is sufficient to identify optimal power output versus width for both lengths tested. This optimal width value depends on excitation amplitude in such a way that narrower harvesters are more suited for small excitations, whereas wider harvesters perform better upon experiencing large excitations. Non-linear effects present in longer harvesters are demonstrated to significantly reduce performance, which motivates the selection of planform dimensions inside the linear range. Finally, we explore the correlation of performance with various geometric quantities in order to inform future design studies and highlight the value of using the second moment of planform area to measure harvester efficiency in terms of power density. This points towards the use of harvesters with non-rectangular planform area for optimal performance.

Graphical Abstract

1. Introduction

Wireless sensor networks typically comprise a series of dedicated, autonomous, and spatially distributed sensor nodes to monitor physical parameters, such as temperature, pressure, humidity, sound level, chemical concentration, wind speed, etc. They are currently used in everyday life across a broad range of applications including industrial process monitoring and control [1,2,3], health monitoring and damage detection in machines/structures [4,5], air pollution and water quality monitoring [6,7,8,9], and wildfire detection and natural disaster prevention [10,11,12]. In addition to the sensor itself, a sensor node normally includes a basic processing unit, a radio transceiver, and a power source usually in the form of a battery. When sensors are deployed in remote or harsh locations, or when the sensor network comprises a large number of sensor nodes, periodic replacement of batteries becomes challenging or even impractical. This is because of the difficulty of physically accessing remotely located sensors, due to safety concerns with accessing sensors located in harsh environments, or simply due to the time required to service a large number of sensors. For small sensors with modest power requirements there is an opportunity to replace these batteries by energy harvesting modules, which generate electrical power from ambient energy sources; whether this is mechanical, thermal, or electromagnetic in nature.
Due to the ubiquitous presence of ambient vibrations, considerable attention has been devoted to harvesters that convert mechanical vibration energy into electric power [13,14,15]. The three basic methods of converting mechanical vibration energy into electric power are electromagnetic induction, electrostatic generation, and the piezoelectric effect [16]. With electromagnetic induction, the relative motion between a coil and a magnetic field causes an electric current to flow in the coil. Electrostatic generation relies on capacitors, where the two conductors and the dielectric that separates them can move relative to one another: as the capacitor deforms the conductors move, and the energy stored in the capacitor changes correspondingly. Finally, the deformation of a piezoelectric material induces an electric charge accumulation and a corresponding voltage difference across the material. The piezoelectric effect provides higher energy density and is therefore normally preferred over electromagnetic or electrostatic induction for harvesting ambient vibrations [16,17].
Piezoelectric vibration energy harvesters incorporate thin layers of piezoelectric material and typically have a thin and flat geometric shape to promptly react to the motion of the host structure. To date, the cantilever geometry is by far the most frequently used structural design in piezoelectric vibration energy harvesters [18]. The choice of the piezoelectric material, ceramics such as PZT (lead zirconate titanate) or polymers such as PVDF (polyvinylidene difluoride), essentially depends on the frequency of the ambient vibration of interest. Piezoelectric ceramics are rigid and have high resonant frequencies, making them suitable for high frequency applications; e.g., 50–100 Hz or higher [18]. They also have higher electromechanical coefficients and are more efficient in generating electric energy output from a given input mechanical energy. However, they have some significant drawbacks including high brittleness, low elastic deformation, high unit cost, and possibly high lead content, though lead-free piezoceramics are also available. Piezopolymers, on the other hand, have lower electromechanical coupling coefficients, but are tougher with high elastic deformation, are more environmentally friendly, and have high power density to cost ratio [19]. Since piezopolymers have lower resonant frequencies, they are also better suited to applications with low vibration frequency; up to 50 Hz [19,20,21]. Some piezoelectric composites with higher flexibility also do exist, such as macro fiber composites (MFCs). MFCs are composed of piezoelectric fibers rather than sheets, which explains their reduced brittleness, but their Young’s modulus typically remains an order of magnitude higher than piezopolymers such as PVDFs. Note that there are other piezoelectric options that can be employed for energy harvesting within low-frequency applications. For example, aluminum nitride (AlN)-based harvesters have been widely employed within microelectromechanical systems (MEMSs) [22,23] and as bio-compatible energy harvesters for implants [24,25]. Another example is zinc oxide (ZnO), which is also employed within MEMS energy harvesters and has demonstrated suitability for low-frequency applications [26,27]. For a comprehensive review on piezoelectric materials used for low-frequency applications, the reader is referred to [28].
The present study is focused on PVDF-based vibration energy harvesters of cantilever design. This class of harvesters is characterized by its high flexibility and wide range of deformation, from small up to large values relative to its length. As will be shown in this study, this enables a more comprehensive analysis of the planform and excitation effects, whilst considering both linear and non-linear responses. A number of previous studies have considered using PVDF-based vibration energy harvesters, summarized as follows. Jiang et al. fabricated and tested a harvester by laminating one PVDF layer with a polyester layer and reported a maximum power output of 16 μW at an excitation frequency of 17 Hz and amplitude of 1.2 g [29]. With the aim of assessing the effect of air damping on the performance of low-frequency (about 100 Hz) cantilever PVDF harvesters, Cao et al. carried out tests in both air and in vacuum [30]. They showed superior (almost twice) output power generation in vacuum and recorded a peak power of ~101 μW at 4.31 g acceleration in vacuum. Rammohan et al. constructed an array of three bimorph harvesters, each comprising a copper foil between two PVDF layers, yielding a power output of 2.8 μW at 33 Hz with input acceleration of 0.8 g [31]. Song et al. reported a bimorph harvester comprising two PVDF films bonded together with an adhesive layer and a load mass at the free end of the beam, measuring a power output of 112.8 μW and power density of 8.61 mW/cm3 for an excitation with frequency of 35 Hz and amplitude of 0.5 g [32]. Tsukamoto et al. tested a bimorph harvester comprising a flexible 3D meshed-core elastic layer sandwiched between two PVDF layers, recording a maximum power of 24.6 μW under resonance conditions at 18.7 Hz and 0.2 g acceleration amplitude [33]. Chandwani et al. investigated multi-band harvesters, measuring an average power of 6 μW for the frequency band 21–35 Hz and an average power of 7.7 μW for the frequency band 45–60 Hz [34]. Wang et al. reported on bimorph harvesters comprising a flexible stainless-steel foil sandwiched between two PVDF layers, focusing on the possibility of including flexible solar panels onto the harvesters as active tip masses for reducing the resonant frequency (within 22.7–43.5 Hz) [20].
In summary, prior investigations clearly demonstrate the potential of PVDF-based vibration energy harvesters of cantilever design for low-frequency applications. A systematic study of the influence of planform geometry and excitation input remains absent from the literature, to demonstrate in detail how these factors affect the dynamics and power generation. This provides the motivation for the present work; such a study can help inform future design and optimization. As such, we manufactured eight cantilever harvesters of variable length (78 mm and 155 mm) and width (22 mm, 44 mm, 66 mm, and 88 mm), and carried out experiments under single-frequency excitation (3–18 Hz) of variable amplitude (from 0.2 g to 0.6 g) to investigate how the dynamics and power generation vary with geometry and excitation amplitude. Acceleration magnitude and frequency of various sources of vibrations, such as vibrating machinery, engines, and building components, typically vary within 0.02 g–1.2 g and 1–200 Hz [35], so that the operating conditions explored here can be regarded as informative for low-frequency applications. Moreover, previous experiments on PVDF-based vibration energy harvesters (e.g., [20,31,32,33]) considered similar but single excitation amplitude values within 0.2 g–0.8 g. Here, we decided to stop our experiments at 0.6 g, as this was sufficient to demonstrate the intended range of response from our harvesters.

2. Materials and Methods

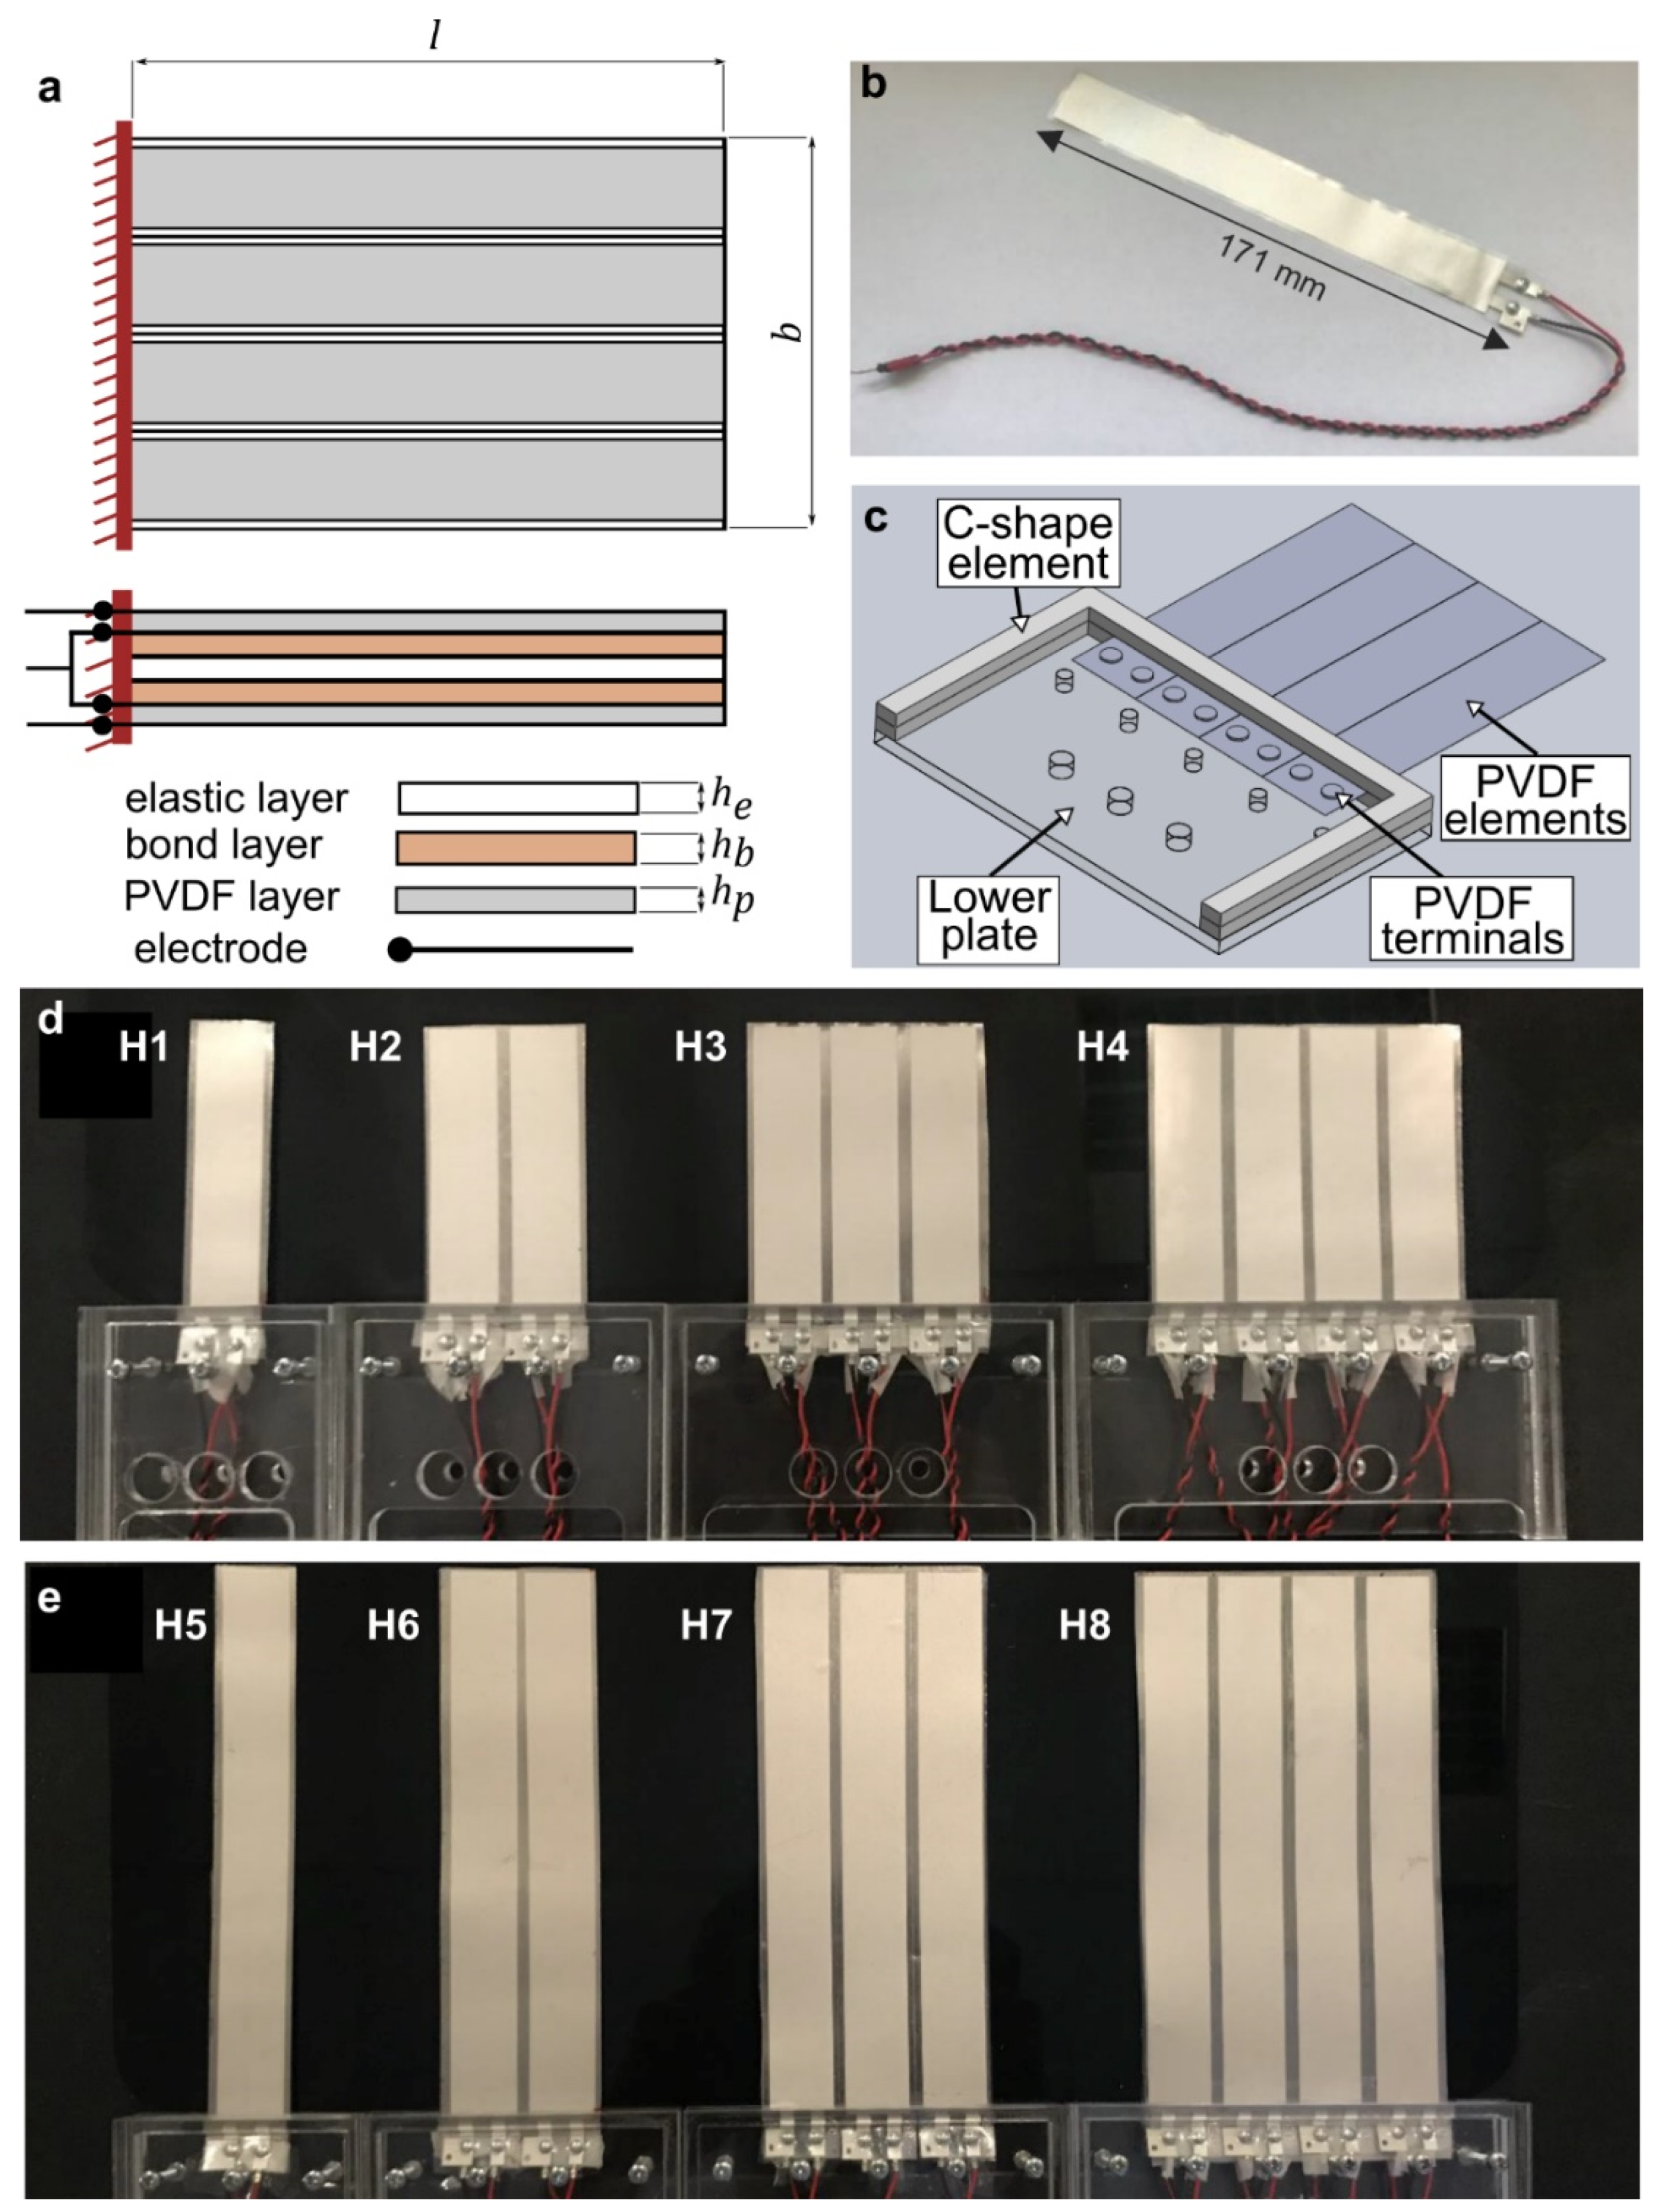
2.1. Harvesters’ Design and Realization

As schematically shown in Figure 1a, the present harvesters are cantilever bimorphs that include a passive elastic layer and two active piezoelectric layers in a sandwich arrangement. The elastic layer is a stainless-steel shim by Precision Brand (density: ρ e = 7900 kg/m3; Young’s modulus: Y e = 180 GPa; thickness: h e = 0.1 mm), whilst the two active piezoelectric layers are made from discrete PVDF elements that are bonded to the core metal shim using double-sided adhesive tape by Tesa (density: ρ b = 1100 kg/m3; thickness: h b = 0.1 mm). The PVDF elements employed (Figure 1b) are from TE Connectivity-model DT4-028K (density: ρ p = 2280 kg/m3; Young’s modulus: Y p = 2.8 GPa; piezo strain constant: d 31 = 23 × 10−12 C/N; capacitance: C = 11 nF; thickness: h p = 0.064 mm). Each element comprises a PVDF film covered with silver ink screen-printed electrodes, all contained within a thin plastic coating for protection. Note that these PVDF elements are so flexible that a more rigid elastic layer is introduced as a passive substrate to provide a meaningful structure. As evident from the large difference between the value of the Young’s modulus of the stainless-steel substrate (180 GPa) and that of the PVDF strips (2.8 GPa) reported above, the structural rigidity and elasticity of the present harvesters are largely controlled by the stainless-steel substrate. The high flexibility of the PVDF strips is instrumental to follow the deformation of the stainless-steel substrate. The present harvesters do not employ tip masses because there was no need to do so. Tip masses are typically employed when the harvester’s resonant frequency needs to be lowered so as to match the vibration of the source of excitation. As explained later, the resonant frequencies of the present harvesters are small enough so that tip masses are not required. This is clearly an advantage in terms of design simplicity. Moreover, whilst effective at reducing the resonant frequency, tip masses may also accelerate the mechanical degradation of the harvesters [19]. As such, the absence of need for a tip mass may, in fact, be viewed as an advantage of the present harvesters. For testing, the harvesters were attached to the shaker (described later) using a laser-cut acrylic clamp, designed and manufactured in-house (Figure 1c).
The PVDF elements used come with dimensions of 171 mm × 22 mm × 0.064 mm (length × width × thickness; see Figure 1b) and were the longest commercially available at the time. In order to produce harvesters of different lengths, the PVDF elements were cut down to the desired length, taking care to avoid conduction of internal piezoelectric layers from exposed edges. Each element was cut using a new scalpel to avoid contamination which could result in damage to the PVDF element. Overall, we produced eight harvesters: four with a length of 78 mm (harvesters H1–H4, Figure 1d), and four with a length of 155 mm (harvesters H5–H8, Figure 1e). The main geometric characteristics of the eight harvesters are summarized in Table 1. The width value was adjusted by including additional PVDF elements, up to four, resulting in a range of values (22 mm, 44 mm, 66 mm, and 88 mm). Whilst our harvesters are made from multiple PVDF elements, these PVDF elements are all firmly attached to the elastic metal layer through the bonding layers; therefore, resulting in a single composite structure. Note that the fraction of the harvester that rests within the clamp cannot deform and is thus inactive as it does not produce any power. After each PVDF element was individually tested to ensure expected operation, all PVDF elements within each harvester were connected in parallel to supply a load resistor. Following common practice, the value of the load resistance (provided in Table 1) was empirically determined to maximize the power output of each harvester. This involved conducting an experimental power scan with different resistance values and identifying the resistance value that allowed for maximum power generation. Note that Table 1 also includes values for aspect ratio and second moment of planform area as these geometric characteristics will be used later in Section 3.3 in assessing the performance of the harvesters.

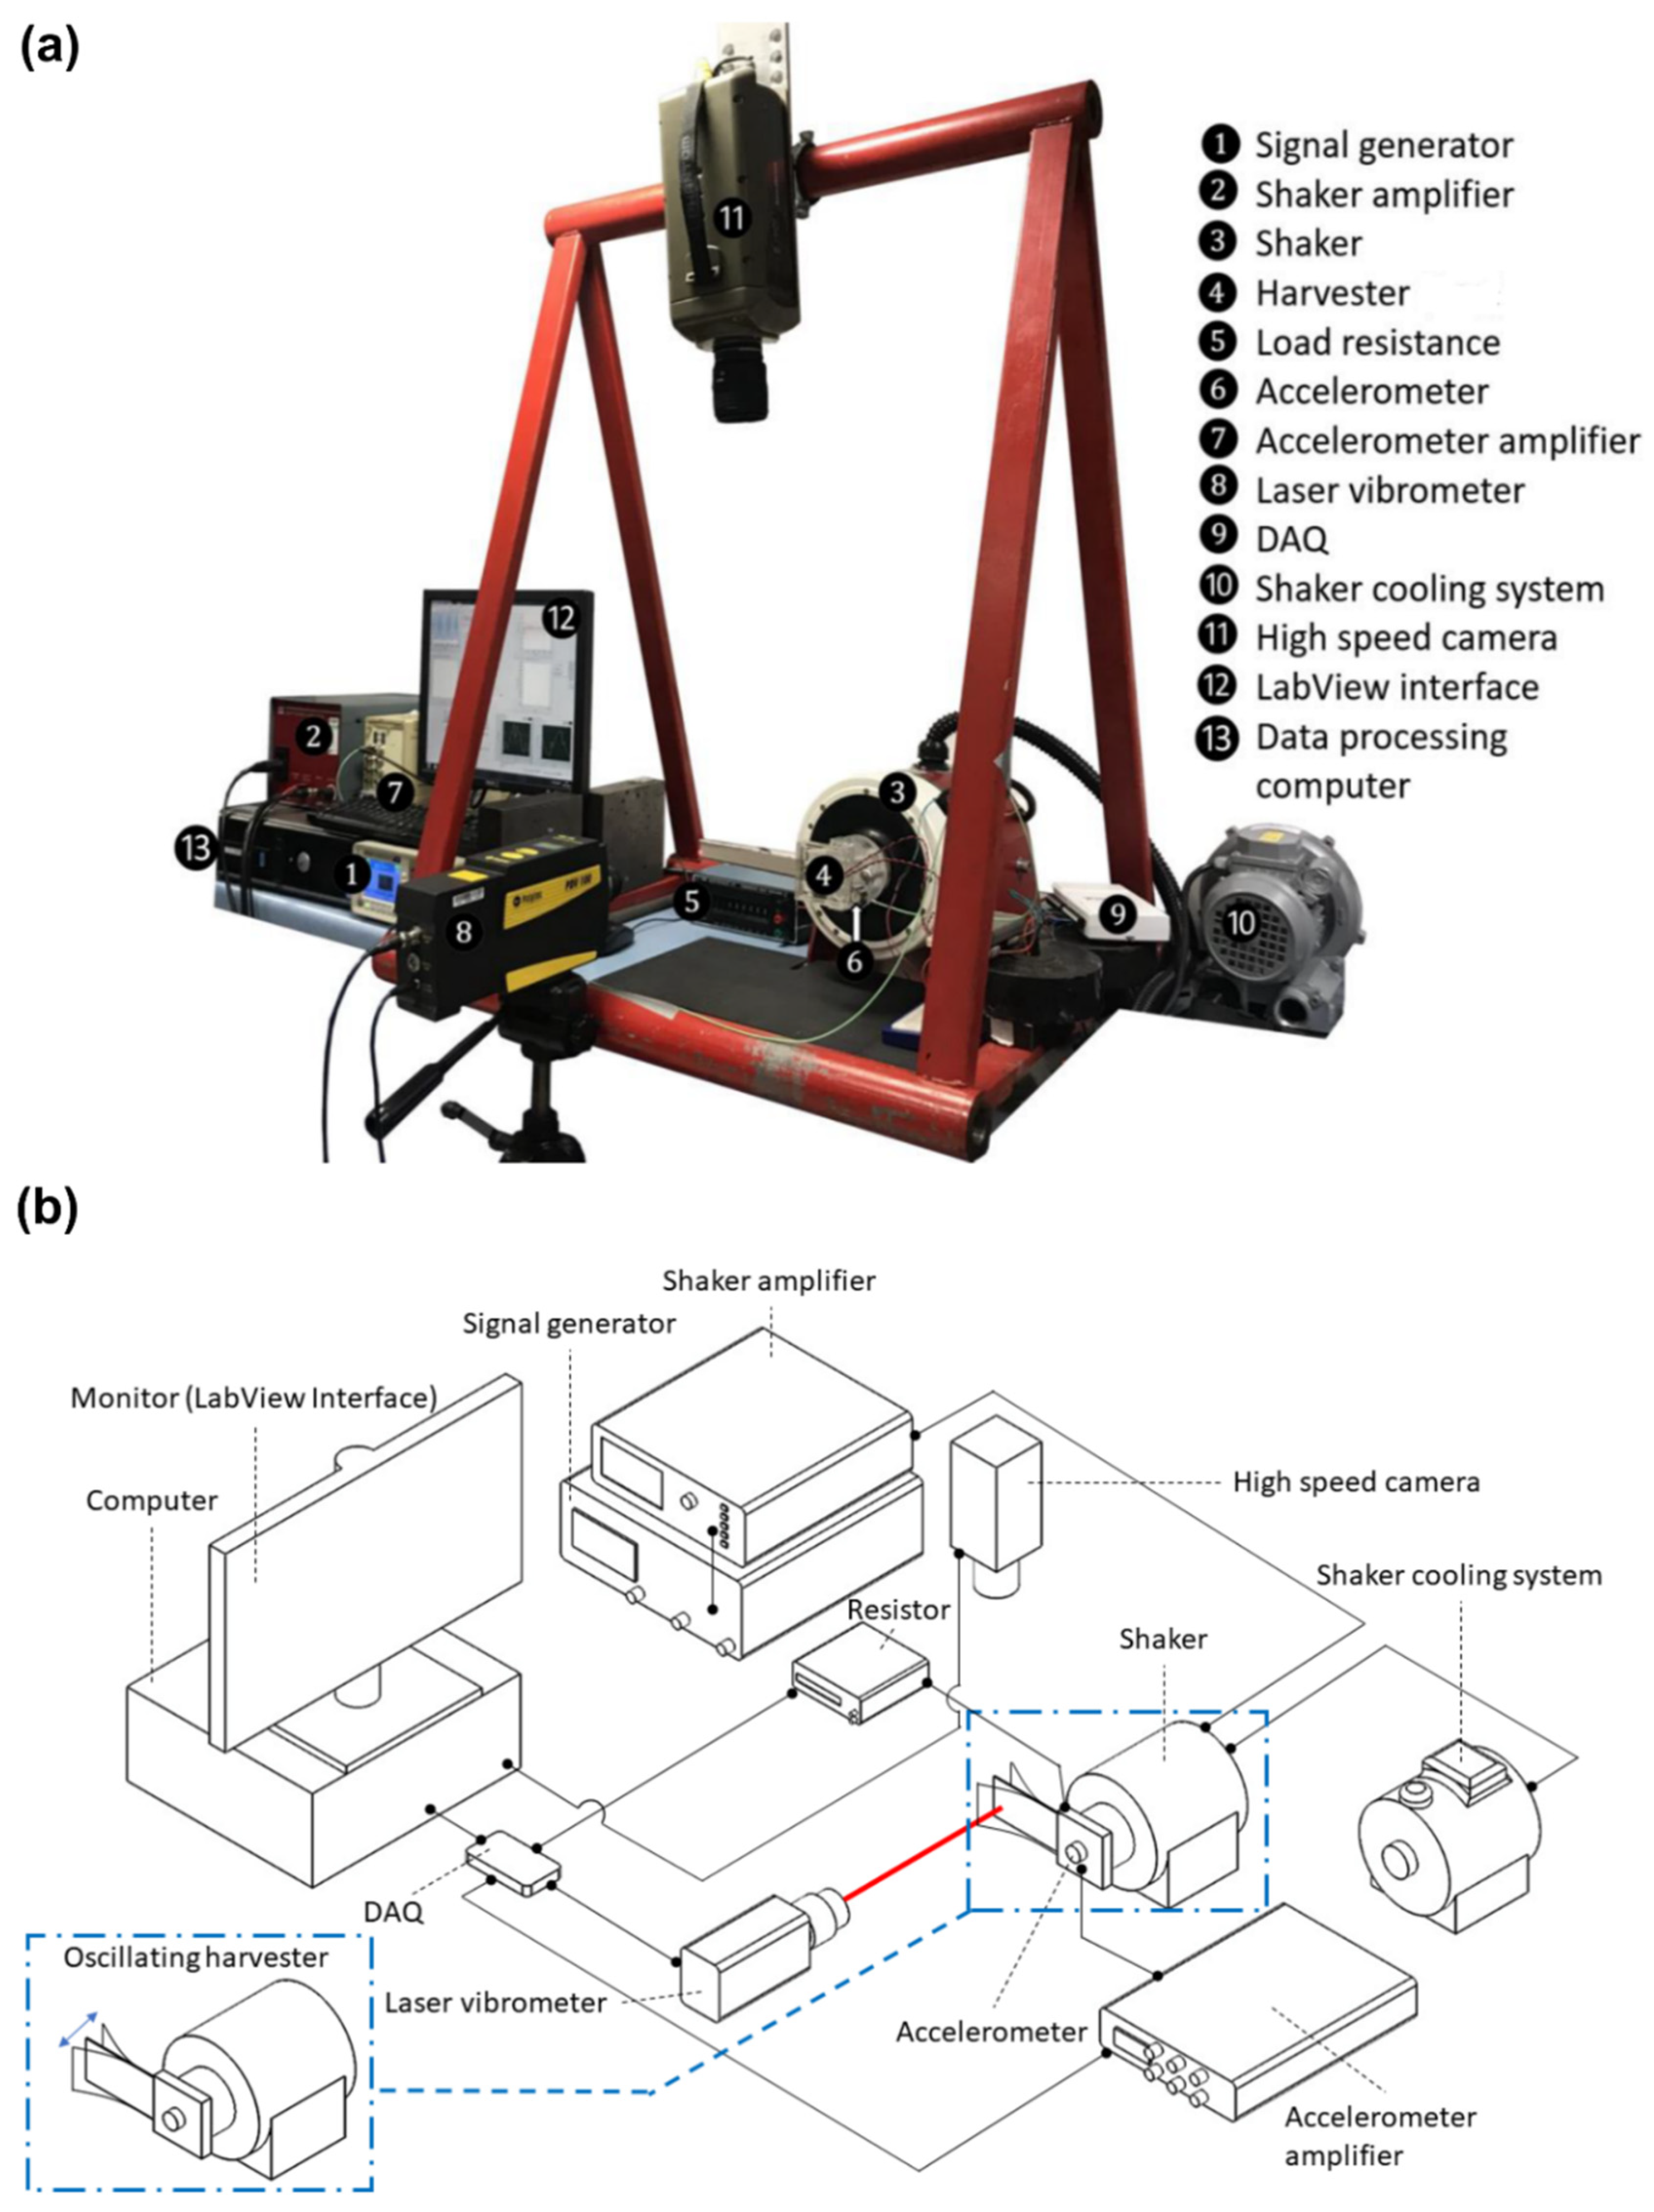
2.2. Experimental Setup

The experimental setup is shown in Figure 2a, whereas a schematic of this setup (included for better clarity of components) is shown in Figure 2b. As shown in Figure 2b, the harvester was vertically oriented during testing, and was connected to the shaker at its root. The signal generator (by Tektronix, model AFG1022, Beaverton, OR, USA (www.tek.com)) was operated in sine-wave mode, so that the displacement transmitted by the shaker to the harvester root was a periodic sinewave and aligned along the horizontal direction. The signals from the signal generator controlled the shaker (by Data Physics, model V55, San Jose, CA, USA (www.dataphysics.com)) through a power amplifier (by Data Physics, model PA300E). The acceleration transmitted from the shaker to the base of the harvesters was monitored with an accelerometer (by PCB Piezotronics, model PCB 336M13, Depew, NY, USA (www.pcb.com)) attached to the shaker close to the base excitation point of the harvesters. A laser vibrometer (by Polytec GmbH, model PDV-100, Waldbronn, Germany (www.polytec.com)) was used to measure the tip displacement of the harvesters. When the tip velocities exceeded the full-scale output of the vibrometer (500 mm/s), the tip displacement was measured optically with a high-speed camera (by Phantom, model v310, equipped with a Nikon AF Micro-Nikkor 60 mm f/2.8D lens). The camera was operated at 3200 frames per second with 1280 × 800 spatial resolution and an exposure time of 310 μs. The videos were postprocessed with the free, open source video analysis software Tracker version 5.0.7 (https://physlets.org/tracker/).
It would have been possible to use the high-speed camera, instead of the vibrometer, during all tests. However, the high-speed camera is more accurate for large displacements and becomes less accurate for small displacements. It was therefore preferred to use the vibrometer for low displacement measurements, and resort to the high-speed camera only when the displacements were beyond the resolution of the vibrometer. It should be also noted that post processing of the videos was relatively time consuming compared with measurements obtained from the laser vibrometer. As our experiment involved a wide range of geometries and excitations to be measured, high-speed camera measurements were only adopted for large displacement measurements to ensure time efficiency. That said, it is important to stress that we have cross-checked and validated the measurements of the high-speed camera against those from the vibrometer to ensure consistency and accuracy of the obtained measurements.
The power output from the harvesters, as well as the accelerometer and vibrometer signals, was collected through an external DAQ device (by National Instruments, model NI-USB-6225, Austin, TX, USA (www.ni.com)) and processed through LabVIEW 2017. The sampling rate was set at 1 kHz to allow sufficient resolution of data through a vibration cycle. The data acquisition program, which was written as a Virtual Instrument (VI) in LabVIEW 2017 using the standard DAQ-mx library, gathered, saved, and displayed the data in real time during the tests.
The tests were conducted under single-frequency excitation for frequencies in the range of 3–18 Hz (low enough to excite a mode-1 vibration in the harvesters) and base acceleration levels ranging from 0.2 g up to 0.6 g. While the energy spectrum of typical ambient vibration sources is generally broadband, vibration energy is often concentrated over a few, rather narrow peaks [36]. As such, the results presented here can be considered to be generally relevant to energy harvesting from low-frequency ambient sources. The testing was carried out in air at ambient conditions (0.1 MPa and 300 K). Due to the large difference between the density of air (about 1 kg/m3) and that of the harvesters (7900 kg/m3 for the stainless-steel substrate, 1100 kg/m3 for the adhesive tape, and 2280 kg/m3 for the PVDF strips), the effect of the fluid added mass (accounting for the fluid mass accelerated/decelerated along by the vibrating structure) in the present case is negligible.

2.3. Characterization of Harvesters

A series of static deflection tests was conducted to measure the elastic restoring force, whilst a combination of both forced and free vibration tests was used to determine the damping ratio of the harvesters. Static deflection tests were conducted by applying sets of known masses at the tip and measuring the deflection caused by the corresponding load. Forced vibration tests were conducted to determine the mode-1 damping ratio, ζ 1 , of the short harvesters (H1–H4) based on the half-power bandwidth method [37,38]:
ζ 1 = ( ω h p 2 ω h p 1 ) 2 ω 1
where ω h p 1 and ω h p 2 are the half-power point frequencies, where the response amplitude is 1 / 2 of the peak amplitude, and ω 1 is the mode-1 natural frequency. Forced vibration tests were made at 0.2 g, 0.3 g, 0.4 g, 0.5 g, and 0.6 g excitation levels and the mode-1 damping ratio was evaluated.
The values of elastic restoring force and damping ratio obtained from these tests are provided in Figure 3, as a function of the tip displacement, which is the perpendicular displacement of the free edge of the harvester with respect to its rest position. In Figure 3, the x-axis values are limited to the range of tip displacement obtained for the excitation levels adopted in the current study (tip displacement results will be shown in Section 3.1). It is evident that the range of tip displacements for the short harvesters (left column) is around a quarter of that for the longer harvesters (right column). It should also be noted that the fitting lines for the elastic restoring force panels in Figure 3 are developed based on the full set of measured data which are provided in Figure A1 in Appendix A.
For lightly damped systems such as those considered in the present work, the half-power bandwidth method provides convenient damping estimates from the spectrum, as well as being simple and time efficient to use [37,38]. We were unable to apply the same method to characterize damping for the set of long harvesters (H5–H8), since the signal generator we were using had a minimum resolution of 0.5 Hz, which is insufficient for these purposes. As an alternative, we estimated the damping ratio of the long harvesters based on the classical logarithmic decrement deduced from free vibration tests in stagnant air [39], a method known to provide reliable damping ratio estimates for unforced single degree of freedom decay [37]. During the vibration tests, the PVDF elements were connected to the resistive load, so that the damping ratio values provided in Figure 3 represent the total damping of the harvesters (inclusive of the structural damping, the fluid damping, and the electrical damping).
As is evident from the top panels of Figure 3, the trend of the elastic restoring force versus tip displacement is initially linear but becomes non-linear at higher values of displacement; particularly for the longer and wider harvesters tested. More details on the range of linearity of these results and the comparison to linear beam theory are included in Appendix A. As noted from the bottom panels of Figure 3, the damping ratios of the short harvesters exhibit no appreciable variation with the tip displacement. However, since the range of points considered in this test is relatively narrow, we cannot extrapolate beyond them. This is not the case for the long harvesters where the damping ratios show clear variation with the tip displacement, such that the resulting damping force is non-linear, as is expected for large amplitudes [40]. In particular, as tip displacement increases, the damping ratio of the long harvesters is first observed to increase, before slowly saturating towards a constant value: a trend consistent with available observations for wing sections [41]. In addition, note that the damping ratio results for both sets of harvesters share a common feature that the damping ratio increases with width of the harvester, indicating increased damping as the surface area of the harvesters increases. Damping ratios measured during preliminary tests (not documented here) for the metal substrate alone, i.e., without the PVDF elements, were significantly lower than the values reported in Figure 3 (damping ratios on the order of 0.02 for a tip displacement of 10 mm), indicating that the inclusion of the PVDF elements and the bonding layers significantly increase the structural damping of the harvesters.

3. Results and Discussion

3.1. Dynamics and Power Generation Measurements

Tip displacement and root mean square (RMS) power output measurements are shown in Figure 4, for all harvesters, plotted as a function of the non-dimensional frequency of excitation (i.e., excitation frequency divided by the mode-1 resonant frequency of the harvester) for different amplitudes of the level of excitation. Table 2 provides the mode-1 resonant frequency values for all harvesters at the different excitation levels. As can be seen, the resonant frequency of the short harvesters (H1–H4) is around 13–14.5 Hz, whilst that of the longer harvesters (H5–H8) is around 3.5–4 Hz. As expected, when the excitation frequency approaches the resonant frequency of the harvester, the tip displacement increases, reaching a maximum that is proportional to the amplitude of the excitation. The power output follows a trend similar to that observed for the tip displacement, consistently indicating that larger tip displacement leads to larger deformation and therefore a larger strain, which yields a higher power. The power clearly varies with the number of PVDF elements embedded within the harvesters, and therefore is related to the harvester width (more discussions on this point will follow later).
To assist in assessment of the linearity of harvester response, a simple linear electro-mechanical model is introduced for comparison. Details of the linear model are provided in Appendix B. It is important to stress that the purpose of the linear model is not to faithfully reproduce the dynamics of the present harvesters; this would require a non-linear model, which goes beyond the scope of the present work. Rather, the linear model is employed to help interpret the linearity of our measurements. The predictions of the linear electro-mechanical model are included in Figure 4 for the short harvesters (H1–H4) only (the reason for not including the model predictions for the long harvesters is explained below). The agreement between measurements and linear model prediction is good, indicating that non-linear effects are negligible. For these harvesters, in fact, the tip displacement never exceeds 13 mm (i.e., maximum tip displacement to length ratio of 17%), which is small enough to approximate the elastic restoring force as linear (see Figure A1 in Appendix A). Figure 4 shows that the short harvesters have relatively broad appearance of the peaks. Though not ideal for power generation, broad peaks yield a more robust harvester design for final applications: frequency matching between harvester and host structure is easier, and the power penalty from frequency mismatch becomes less severe. Furthermore, looking at the resonant frequency values in Table 2, a decrease in resonant frequency is generally observed with the increase in oscillation excitation amplitude, which is consistent with the known behavior of similar oscillating beams (e.g., see [42,43]).
For the long harvesters (H5–H8), we did not include the model predictions as the linear model significantly overpredicts the response resulting in a non-meaningful comparison; linear predicted peak power values range from twice up to an order of magnitude larger than measured values. This is further confirmed in Appendix A where it is evident that the displacement range of the long harvesters is large enough so that the elastic force can no longer be approximated as linear. In fact, for the long harvesters, the tip displacement reaches as high as 55 mm (i.e., maximum tip displacement to length ratio of 35%), which is large enough to make the non-linear effects apparent. The lower measured values compared to the linear model predictions demonstrates that high deflection of the present PVDF harvesters is not beneficial for energy harvesting. However, non-linear effects are not necessarily detrimental. Quite the opposite: non-linear effects can be exploited to improve the performance of energy harvesters [44,45,46], notably to broaden the frequency bandwidth [47,48,49] or increase the response amplitude [50].
It is worth mentioning that harvester beams with the same length and thickness (but different width) should all have the same resonant frequency. The agreement is good for the long harvesters but for the short harvesters a discrepancy in having the same resonant frequency of up to 1.5 Hz is observed. This is attributed to manufacturing imperfections and/or experimental measurement error and is considered small enough to be of minor concern for practical applications. Sources of manufacturing imperfections originated from the mechanical tolerances in the off-the-shelf components used to realize the harvesters and/or the human factor during the manual assembly of these components, particularly when bonding the layers, as well as whilst trimming components to the required dimensions. As such, the impact of these errors is stronger on shorter harvesters since the relative change in length is higher. Note, also, that predictions from the linear electro-mechanical model results are based on the experimentally observed resonant frequency values and thus inherit the same variation.

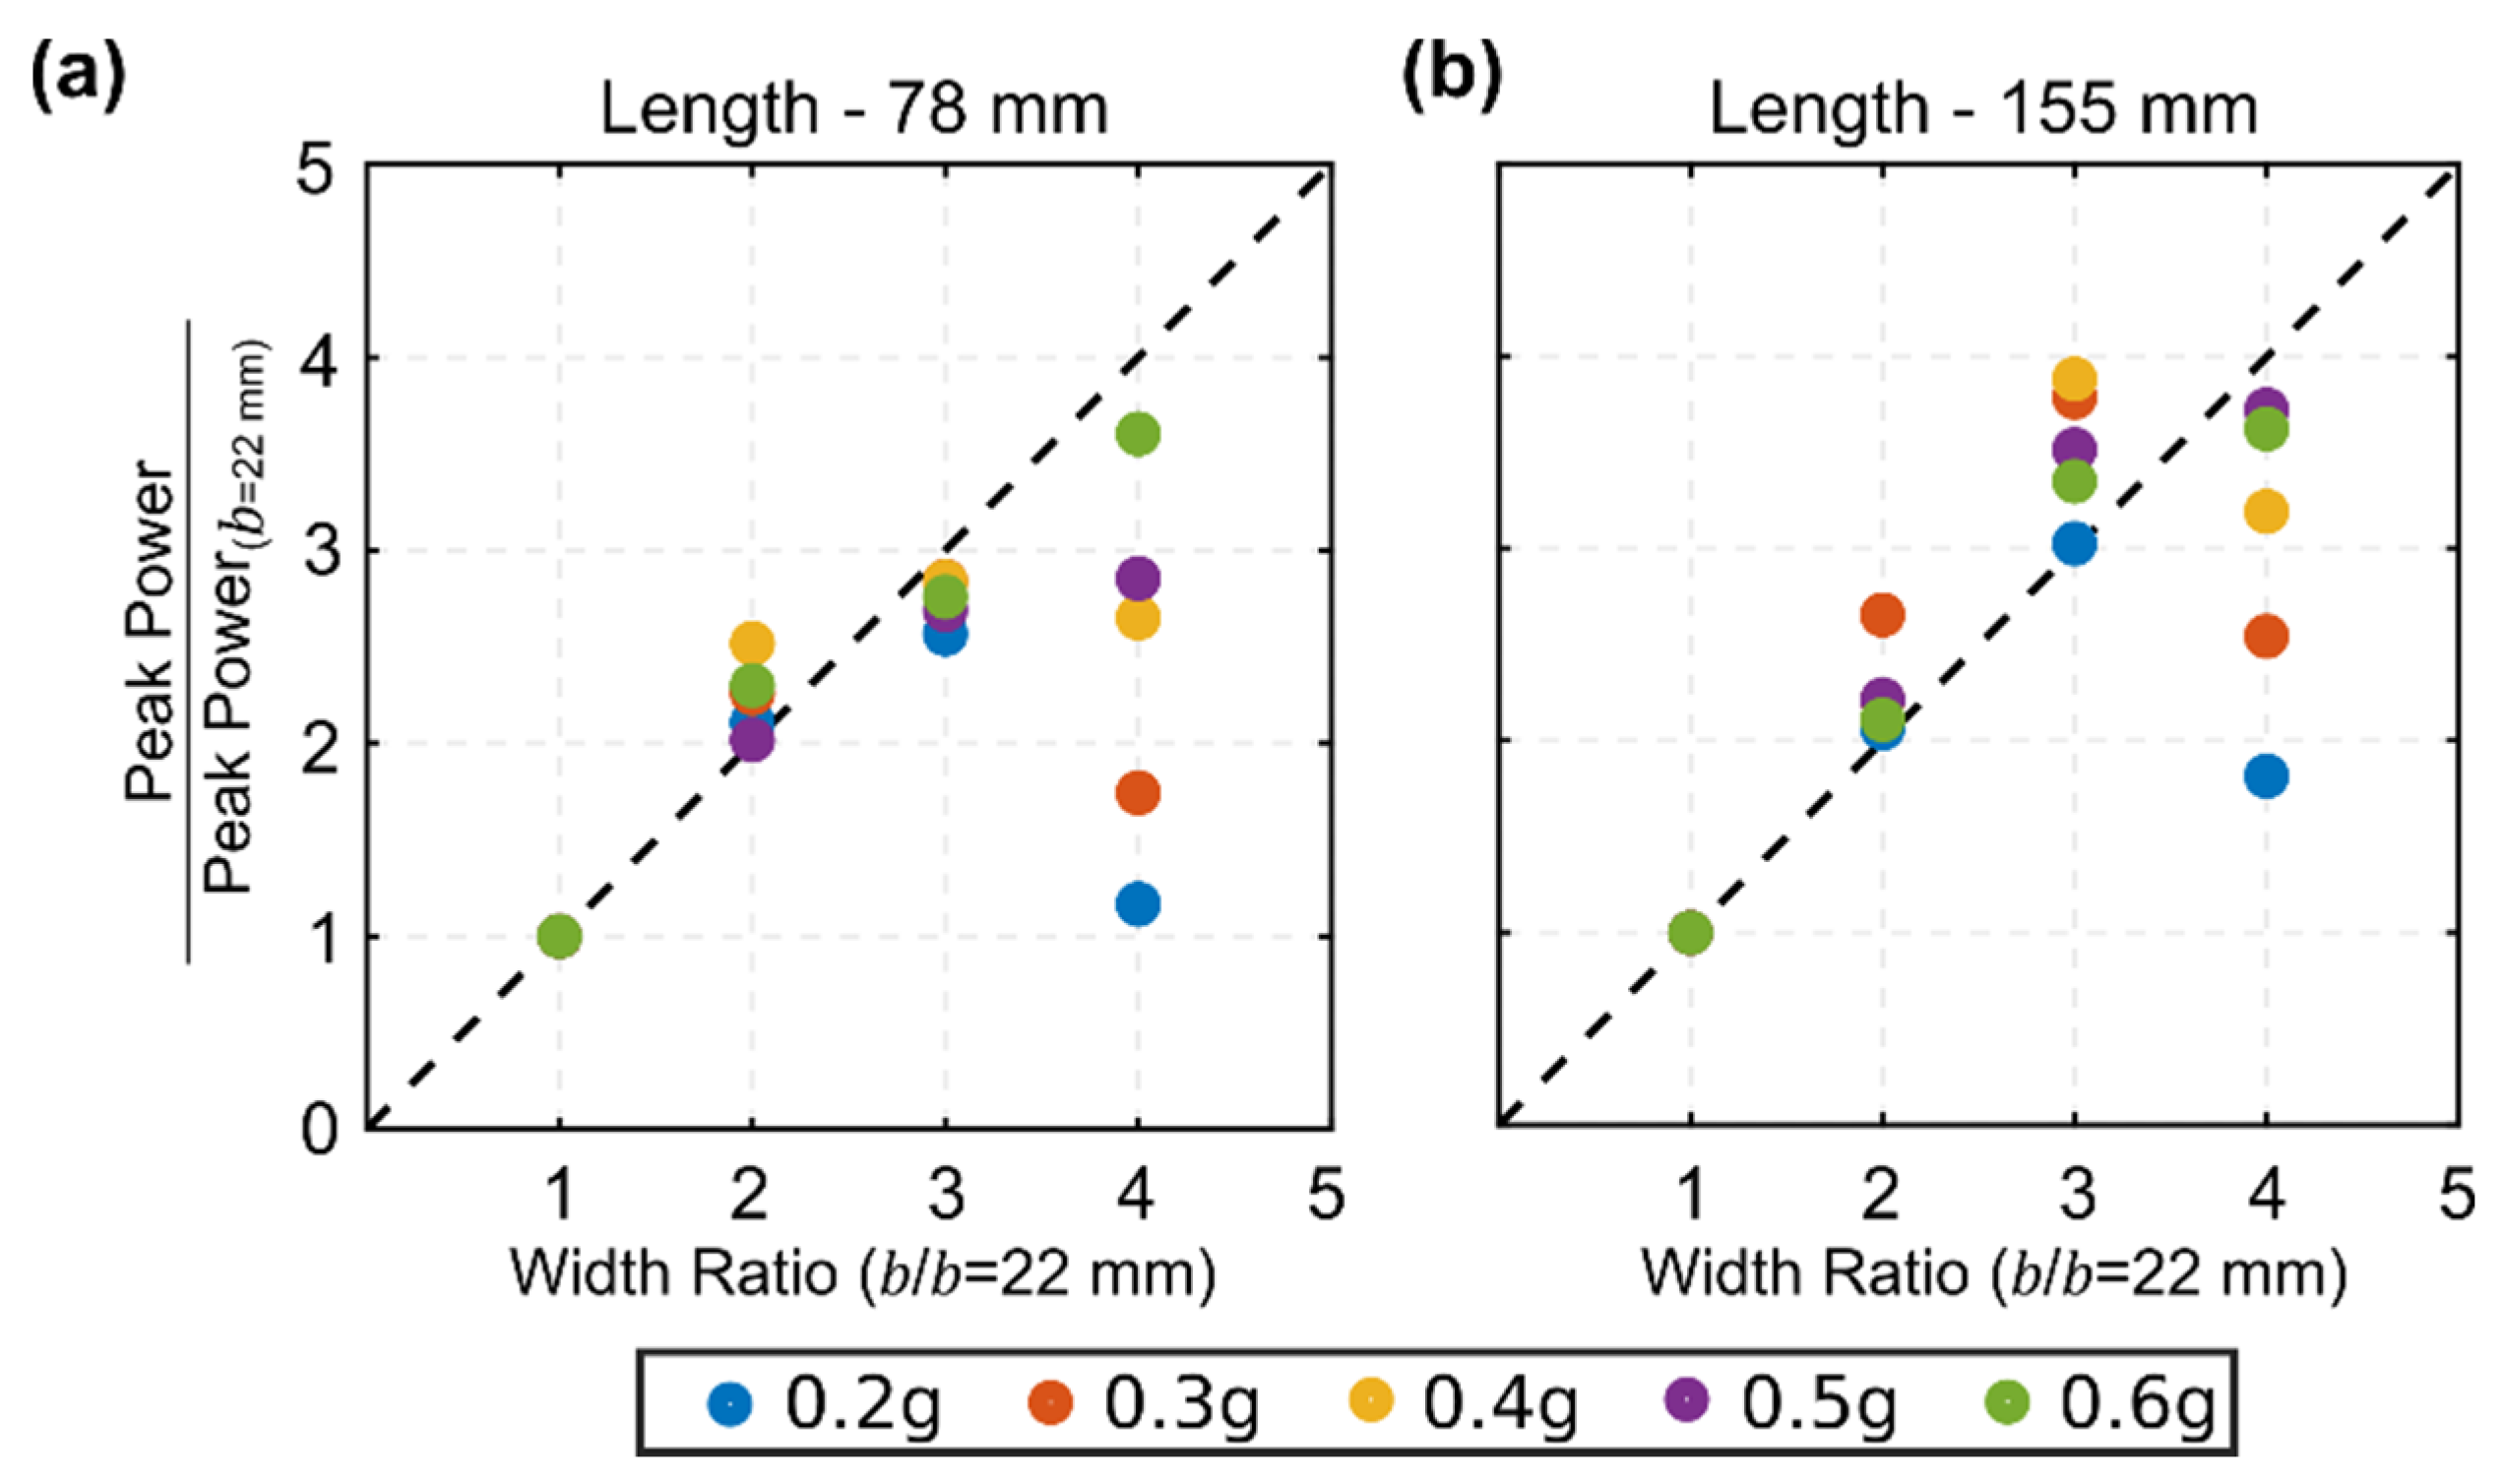
3.2. Planform Effects

Peak power levels measured for all harvesters are presented in Figure 5 as a function of the width of the harvester, with excitation amplitude as a variable parameter. Peak power refers to the power value at the first resonant frequency measured with optimum load resistance. At low excitation amplitude (0.2 g–0.4 g), a maximum is observed in the trend of the peak power versus harvester width for all harvesters, after which the power decreases. At high excitation amplitude (0.5 g–0.6 g), the trend increases monotonically throughout the range of values tested, though in most cases the trend appears to be saturating. Whilst beyond the range of values tested, the continual growth of peak power with harvester width does not seem physically plausible, since increasing width-to-length ratio will ultimately prevent reasonable harvester deformation and so the results for 0.5 g and 0.6 g are expected to also reach maxima before subsequently reducing, though this has not been verified. This trend indicates that optimum harvester width depends on the excitation amplitude, such that narrower harvesters are more efficient under smaller excitations whilst wider harvesters reach optimal power at higher excitations.
Figure 6a presents the gain of power from long harvesters to short harvesters. It is notable that at low excitation amplitude (0.2 g) the maximum peak power of the long harvesters (length of 155 mm) is approximately twice as large as that of the short ones (length of 78 mm). This is no longer the case at higher excitations: at 0.6 g excitation amplitude, the peak power of long and short harvesters is comparable in magnitude. As the excitation level increases, the gain reduces from a factor of 2–3 for excitation at 0.2 g, to around 1 for excitations levels of 0.4 g and above, where there is essentially no gain. This indicates that a longer cantilever may only provide additional power during its near-linear operation. This is further clarified in Figure 6b which presents peak power density, where only the active volume of the harvester (i.e., volume of the PVDF layers) is included in the calculation. Note that Figure 6b shows the ratio of short to long harvesters, i.e., the reverse of Figure 6a, to highlight superior efficiency of short harvesters. Given that most of the energy is generated at the root, one may expect the use of two short harvesters to provide around double the total energy of one long harvester—where the total volume of PVDF is constant in both cases—since in the former there are two roots as opposed to only one in the latter. However, where the values in Figure 6b exceed a factor of two, for high excitation and low widths in particular, it is clear that this expectation is exceeded, demonstrating the beneficial impact of retaining dynamic response in the linear range.
Figure 7 compares the peak power of the different harvesters to the peak power of the thinnest harvester (i.e., width = 22 mm) at different base excitation levels. This comparison is instructive because it allows one to assess whether it is better to employ one wider harvester or multiple narrower harvesters with the same total volume and cost. We observe that for both the short and long sets of harvesters at all excitation levels, the 44 mm-wide harvester produces more than double the peak power from two separate 22 mm-wide harvesters. For the case of three harvesters, the short 66 mm-wide harvester produces slightly less than that from three of the 22 mm-wide harvesters, whereas for the long 66 mm-wide harvester, a higher peak power is produced than would be obtained by individual devices. For the width ratio of four, both the short and long harvesters show less power output than that obtainable from four individual harvesters. As such, in the present work we may conclude that having one wider harvester instead of multiple narrow harvesters would be beneficial, in terms of peak power generation, only for width ratios up to two–three. The results in Figure 5 indicate that there is an optimum harvester width where the peak power is maximized, and that the optimum harvester width increases with excitation level. The results in Figure 7 further indicate that it is convenient to size the harvester at this optimum width only for low excitation levels (0.2 g–0.4 g), whereas at high excitation levels (0.5 g–0.6 g) multiple narrower harvesters would outperform one single harvester sized at the optimum width.
In summary, the present results indicate that in order to maximize the peak power generation the harvester should be sized based on the acceleration level that is being targeted. In particular, the length of the harvester should be sized to ensure a linear response, whilst the width of the harvester should not exceed the optimum width at low excitation.

3.3. Power Indicator Parameter
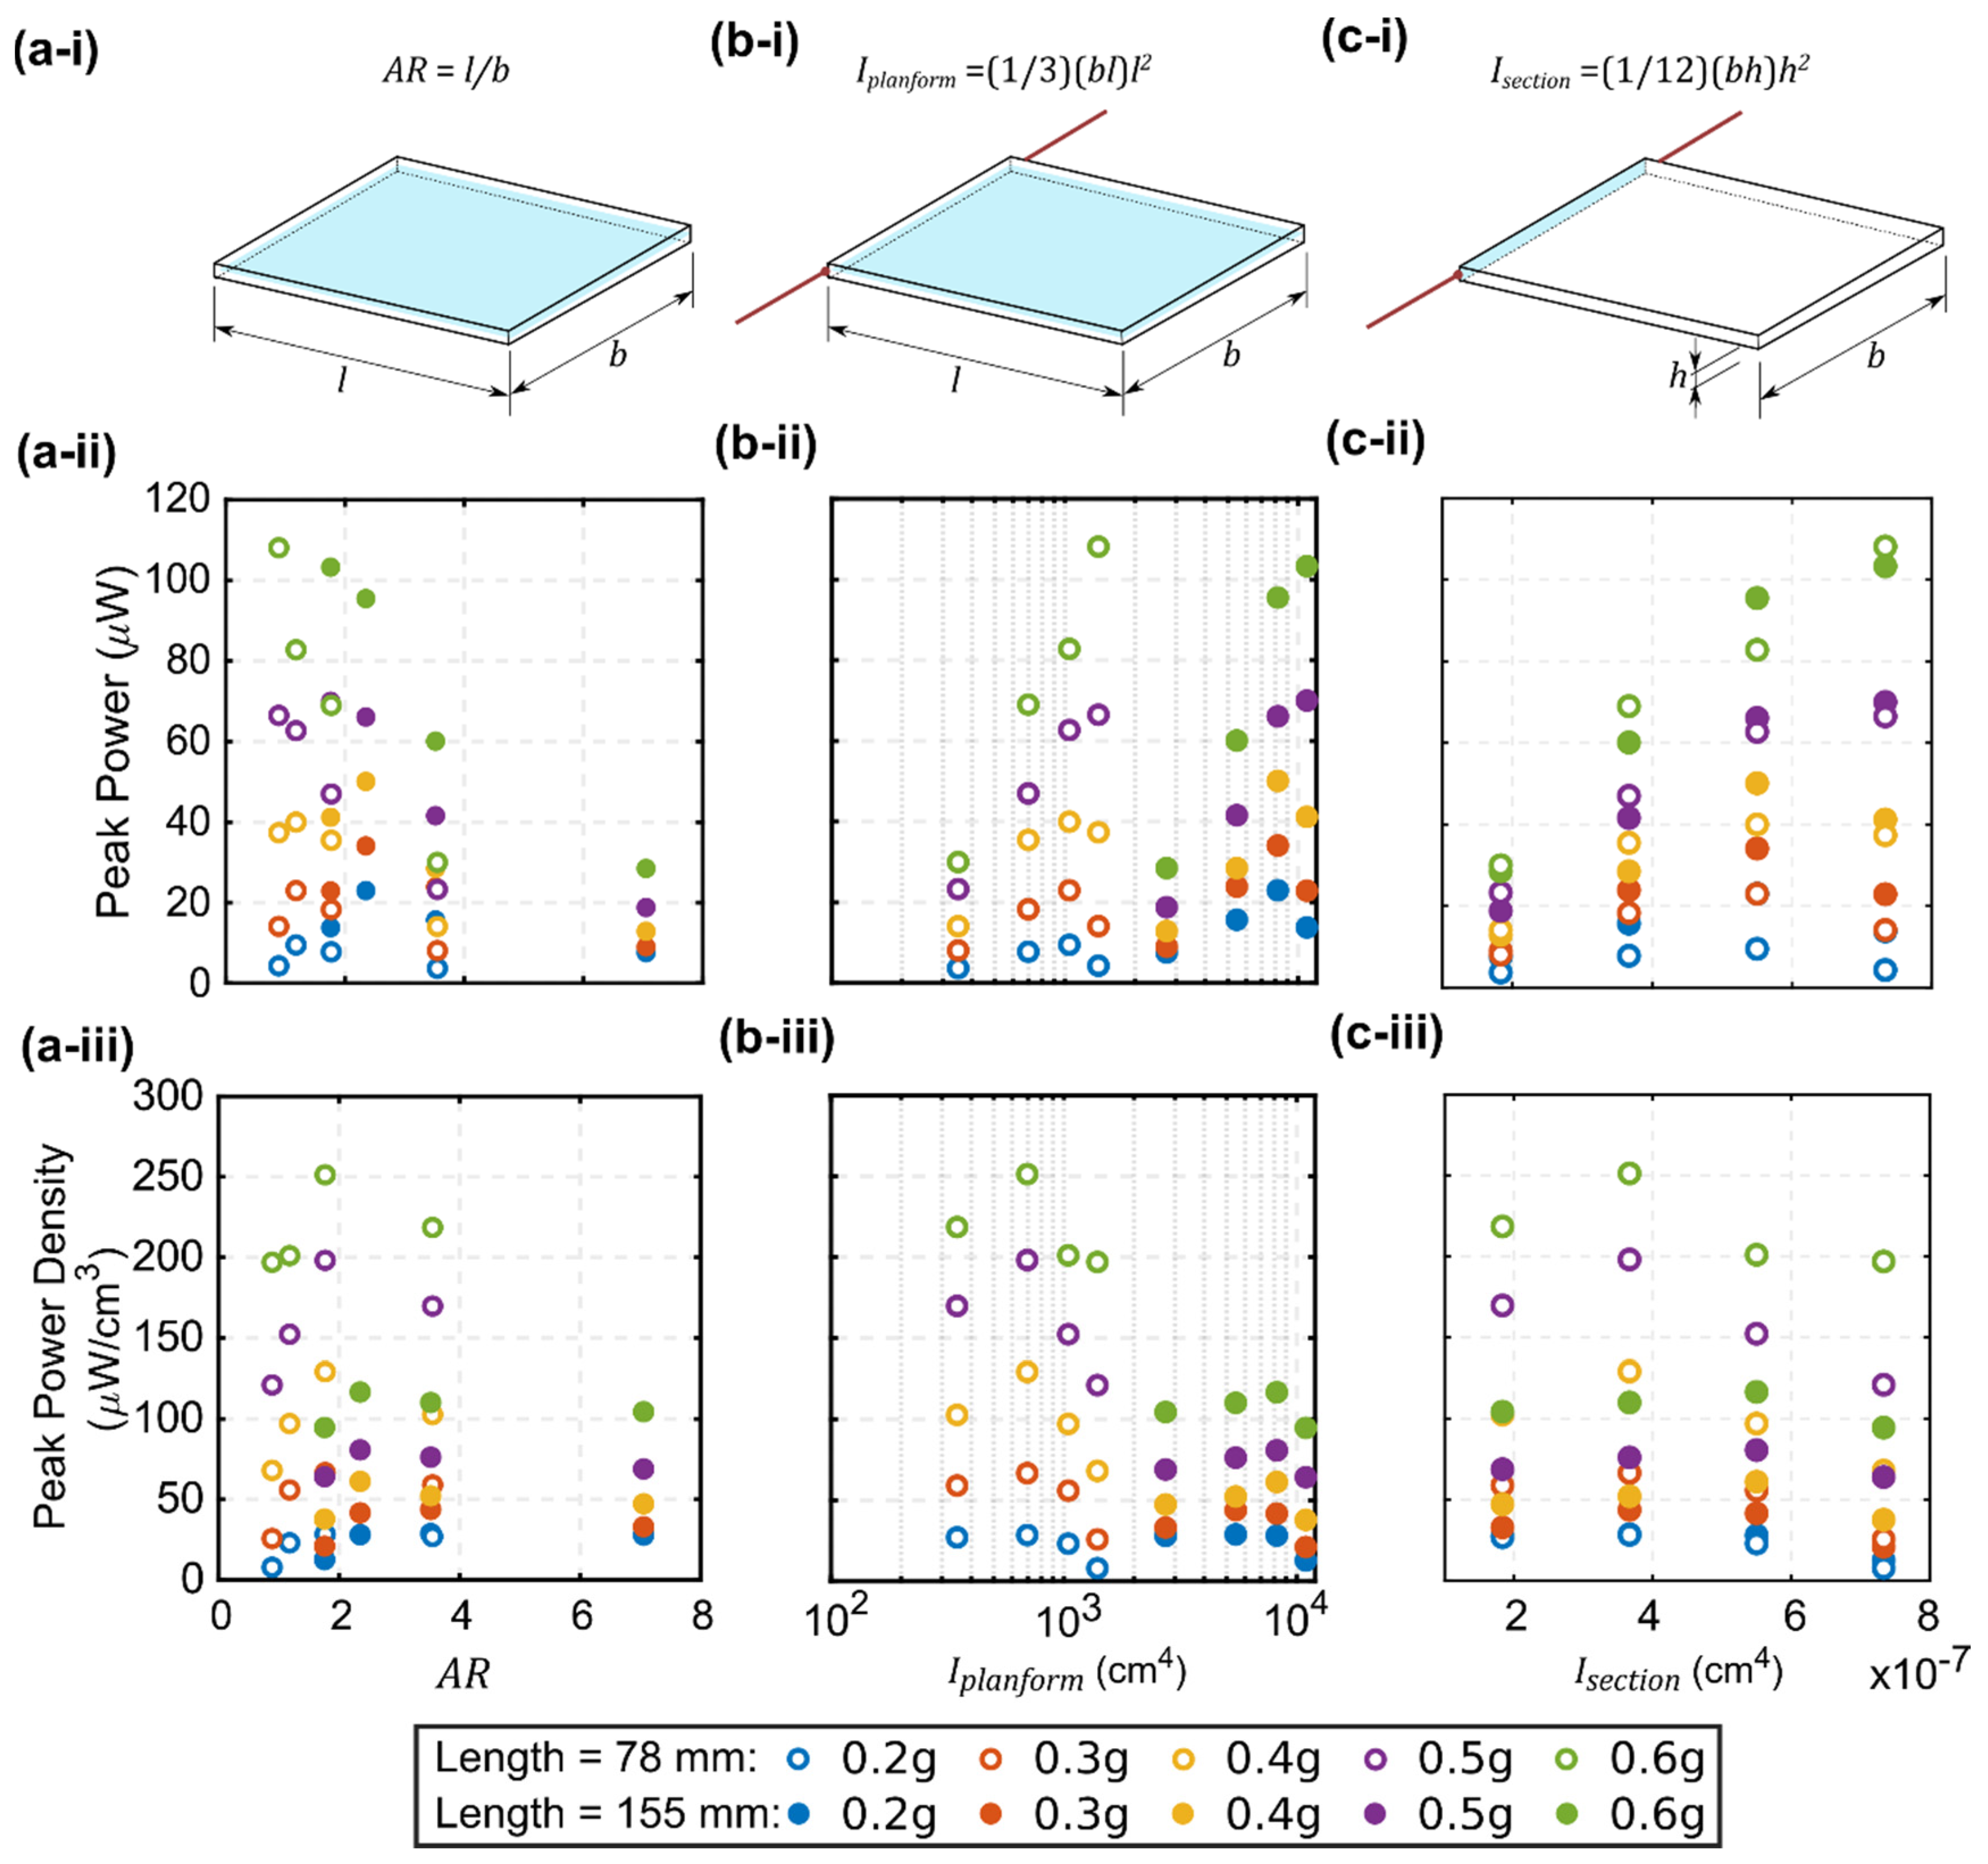
To inform future design studies on vibration energy harvesters, it is convenient to identify a power indicator parameter that can provide preliminary insights into the impact of its dimensions on overall power generation. As such, we consider the correlation of performance against three easily obtainable geometric parameters: the aspect ratio and the second moment of area for the two different planes of the harvester.

3.3.1. Aspect Ratio

Motivated by wind energy harvesting, the aspect ratio, defined as the ratio of the harvester length, l , to width, b , has previously been demonstrated to provide correlation with power for both the interaction of wings [51,52] and PVDF-based inverted flag energy harvesters under wind excitation [53,54,55,56]. Note that this definition of the aspect ratio differs from the normal practice within vibrations literature, where the same term is used to denote the length to thickness ratio.
Peak power and peak power density are presented as functions of the aspect ratio in Figure 8a. Note that in all subplots within Figure 8 open circle markers represent the set of short harvesters, whereas filled circle markers represent the set of long harvesters. Considering clusters of results as a function of excitation amplitude, a general inverse trend of peak power with aspect ratio is observed, although the strength of the correlation varies with excitation amplitude. For peak power versus aspect ratio (Figure 8a-ii), there is a general trend holding reasonably well for all excitation levels. For peak power density versus aspect ratio (Figure 8a-iii), the trend has been reduced and the difference between long and short harvesters is stark, particularly for high excitation levels. This is because the aspect ratio accounts for the relative shape but not the size of the harvester, so it is less well equipped to define a quantity such as power density, which by definition is a function of the harvester planform area. Put another way, the efficiency of two harvesters of different lengths but similar aspect ratio, e.g., H1 and H6, cannot be discerned by aspect ratio alone. Instead, we investigate parameters that incorporate additional geometric information, such as the second moment of area.

3.3.2. Second Moment of Area

For relevant loading cases, i.e., cantilever beam with a tip force load, it is well known that the strain is highest close to the root and gradually decreases as the distance to the root increases. Being proportional to the strain, the local piezoelectric power generation follows a similar trend and gradually decreases as the distance to the root increases. This suggests that a power indicator parameter for this class of harvesters should be constructed in such a way that each portion of the harvester area is weighted based on its distance to the harvester root. Clearly, any function of the type b l n with n > 1 would be a potential power indicator candidate. There is intrinsic value in picking n = 3 since this corresponds to the definition of the second area moment; which leverages existing theory and provides a general framework for incorporating non-rectangular shapes. It is worth highlighting that the second moment of area can be computed around an arbitrary axis and so in three dimensions there are three possible values. Here, we consider just two since the third would be a function of length only: the quantities I p l a n f o r m and I s e c t i o n , as defined in Figure 8b-i,c-i, respectively. Note that I s e c t i o n is extensively used in elastic beam theory and should not be confused with I p l a n f o r m . As our eight harvesters have the same thickness, the values of I s e c t i o n , shown in Figure 8c-ii, are directly proportional to the widths alone, and thus display the same variations already reported for power versus width (shown in Figure 5).
Turning instead to Figure 8b, where the peak power and the peak power density are plotted as functions of I p l a n f o r m , the data points are now separated, stratified as a function of the excitation amplitude. For a given length, the existence of an optimum harvester width that maximizes the peak power output (Figure 8b-ii) is clearly recognizable. Similarly, the power penalty arising from non-linear response at high excitation amplitude is evident in Figure 8b-iii, from the drop in peak power density of the long harvesters in comparison with the short ones. Interestingly, in contrast to our conclusion at the end of Section 3.3.1 on aspect ratio, the correlation with power density is stronger because I p l a n f o r m contains the planform area.
This finding demonstrates the potential for I p l a n f o r m to provide a useful indication of power efficiency, particularly for non-rectangular shapes. For example, this suggests that for a given length, the efficiency of a harvester can be increased by broadening the root and narrowing the tip, i.e., yielding a lower value of I p l a n f o r m . This is not in itself unexpected since, as discussed at the start of this section, power is generated predominantly at the root. Nevertheless, it provides motivation for future investigation of non-rectangular harvesters as a useful means of enhancing power generation efficiency further.

4. Concluding Remarks

In this paper, we conducted a systematic experimental investigation into the effect of planform geometry and excitation level on the energy harvesting performance of PVDF-based low-frequency vibration energy harvesters. Eight rectangular energy harvesters (with two different lengths: 78 mm and 155 mm, and four different widths: 22 mm, 44 mm, 66 mm, and 88 mm) have been realized and tested for excitation frequencies around the first resonant bending frequency (within 3–18 Hz), and this was repeated for different base excitation acceleration levels ranging from 0.2 g up to 0.6 g. The harvesters were bimorph cantilevers and were realized employing a passive elastic layer and two active piezoelectric layers arranged in a sandwich arrangement. All harvesters had the same cross-sectional geometric shape and material properties. This provided sufficient data to assess the planform geometry and excitation effects on tip displacement dynamics and power generation performance. It was found that the set of short harvesters has linear tip displacement and power generation as well as broader frequency response functions. The set of longer harvesters, on the other hand, exhibited non-linear displacement and power response, attributable to the variation of the elastic restoring force and damping ratios at the larger tip displacement motion of these harvesters. For both sets of harvesters, it was confirmed that the displacement response is independent of width, whereas the power values have clear dependency on the width value. A number of useful insights were obtained, summarized as follows:
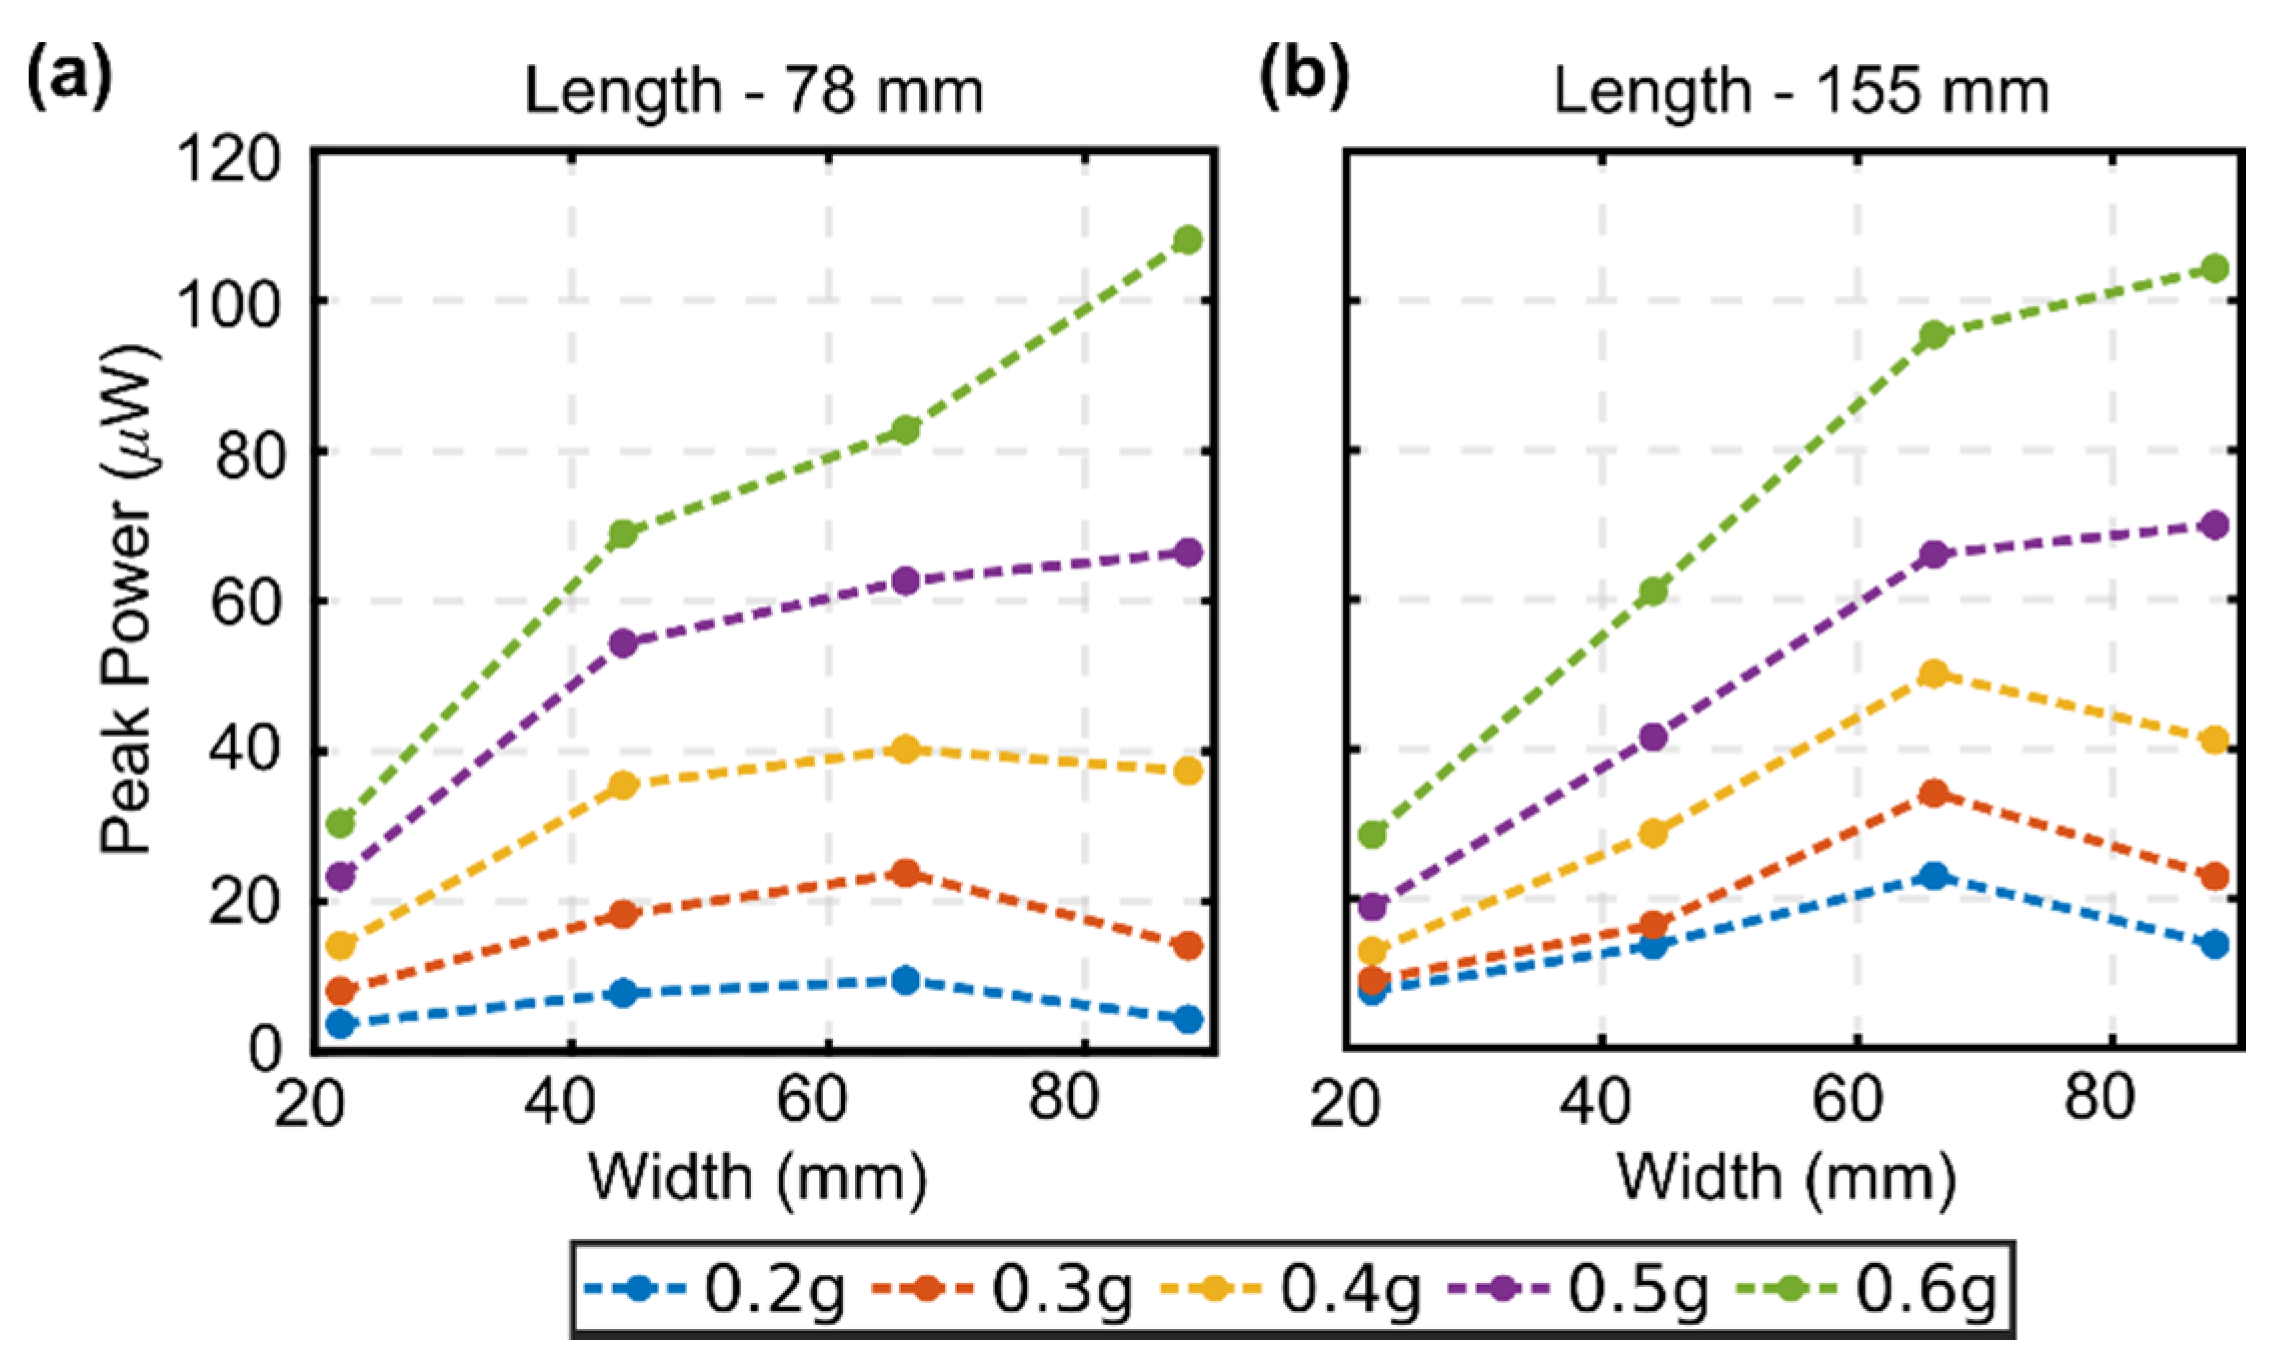
  • We show that there is an optimal width for this class of harvesters where the output power is maximized. This optimal width value depends on the excitation amplitude in such a way that narrower harvesters are more suited for small excitations, whereas wider harvesters perform better upon experiencing large excitations. Whilst this conclusion may well be anticipated, this work provides confirmation of this behavior for this class of harvesters through detailed, quantitative measurements;
  • We show that for low excitation levels it is convenient to size the harvester at the optimum width, whereas at high excitation levels, multiple narrower harvesters would outperform one single harvester sized at the optimum width;
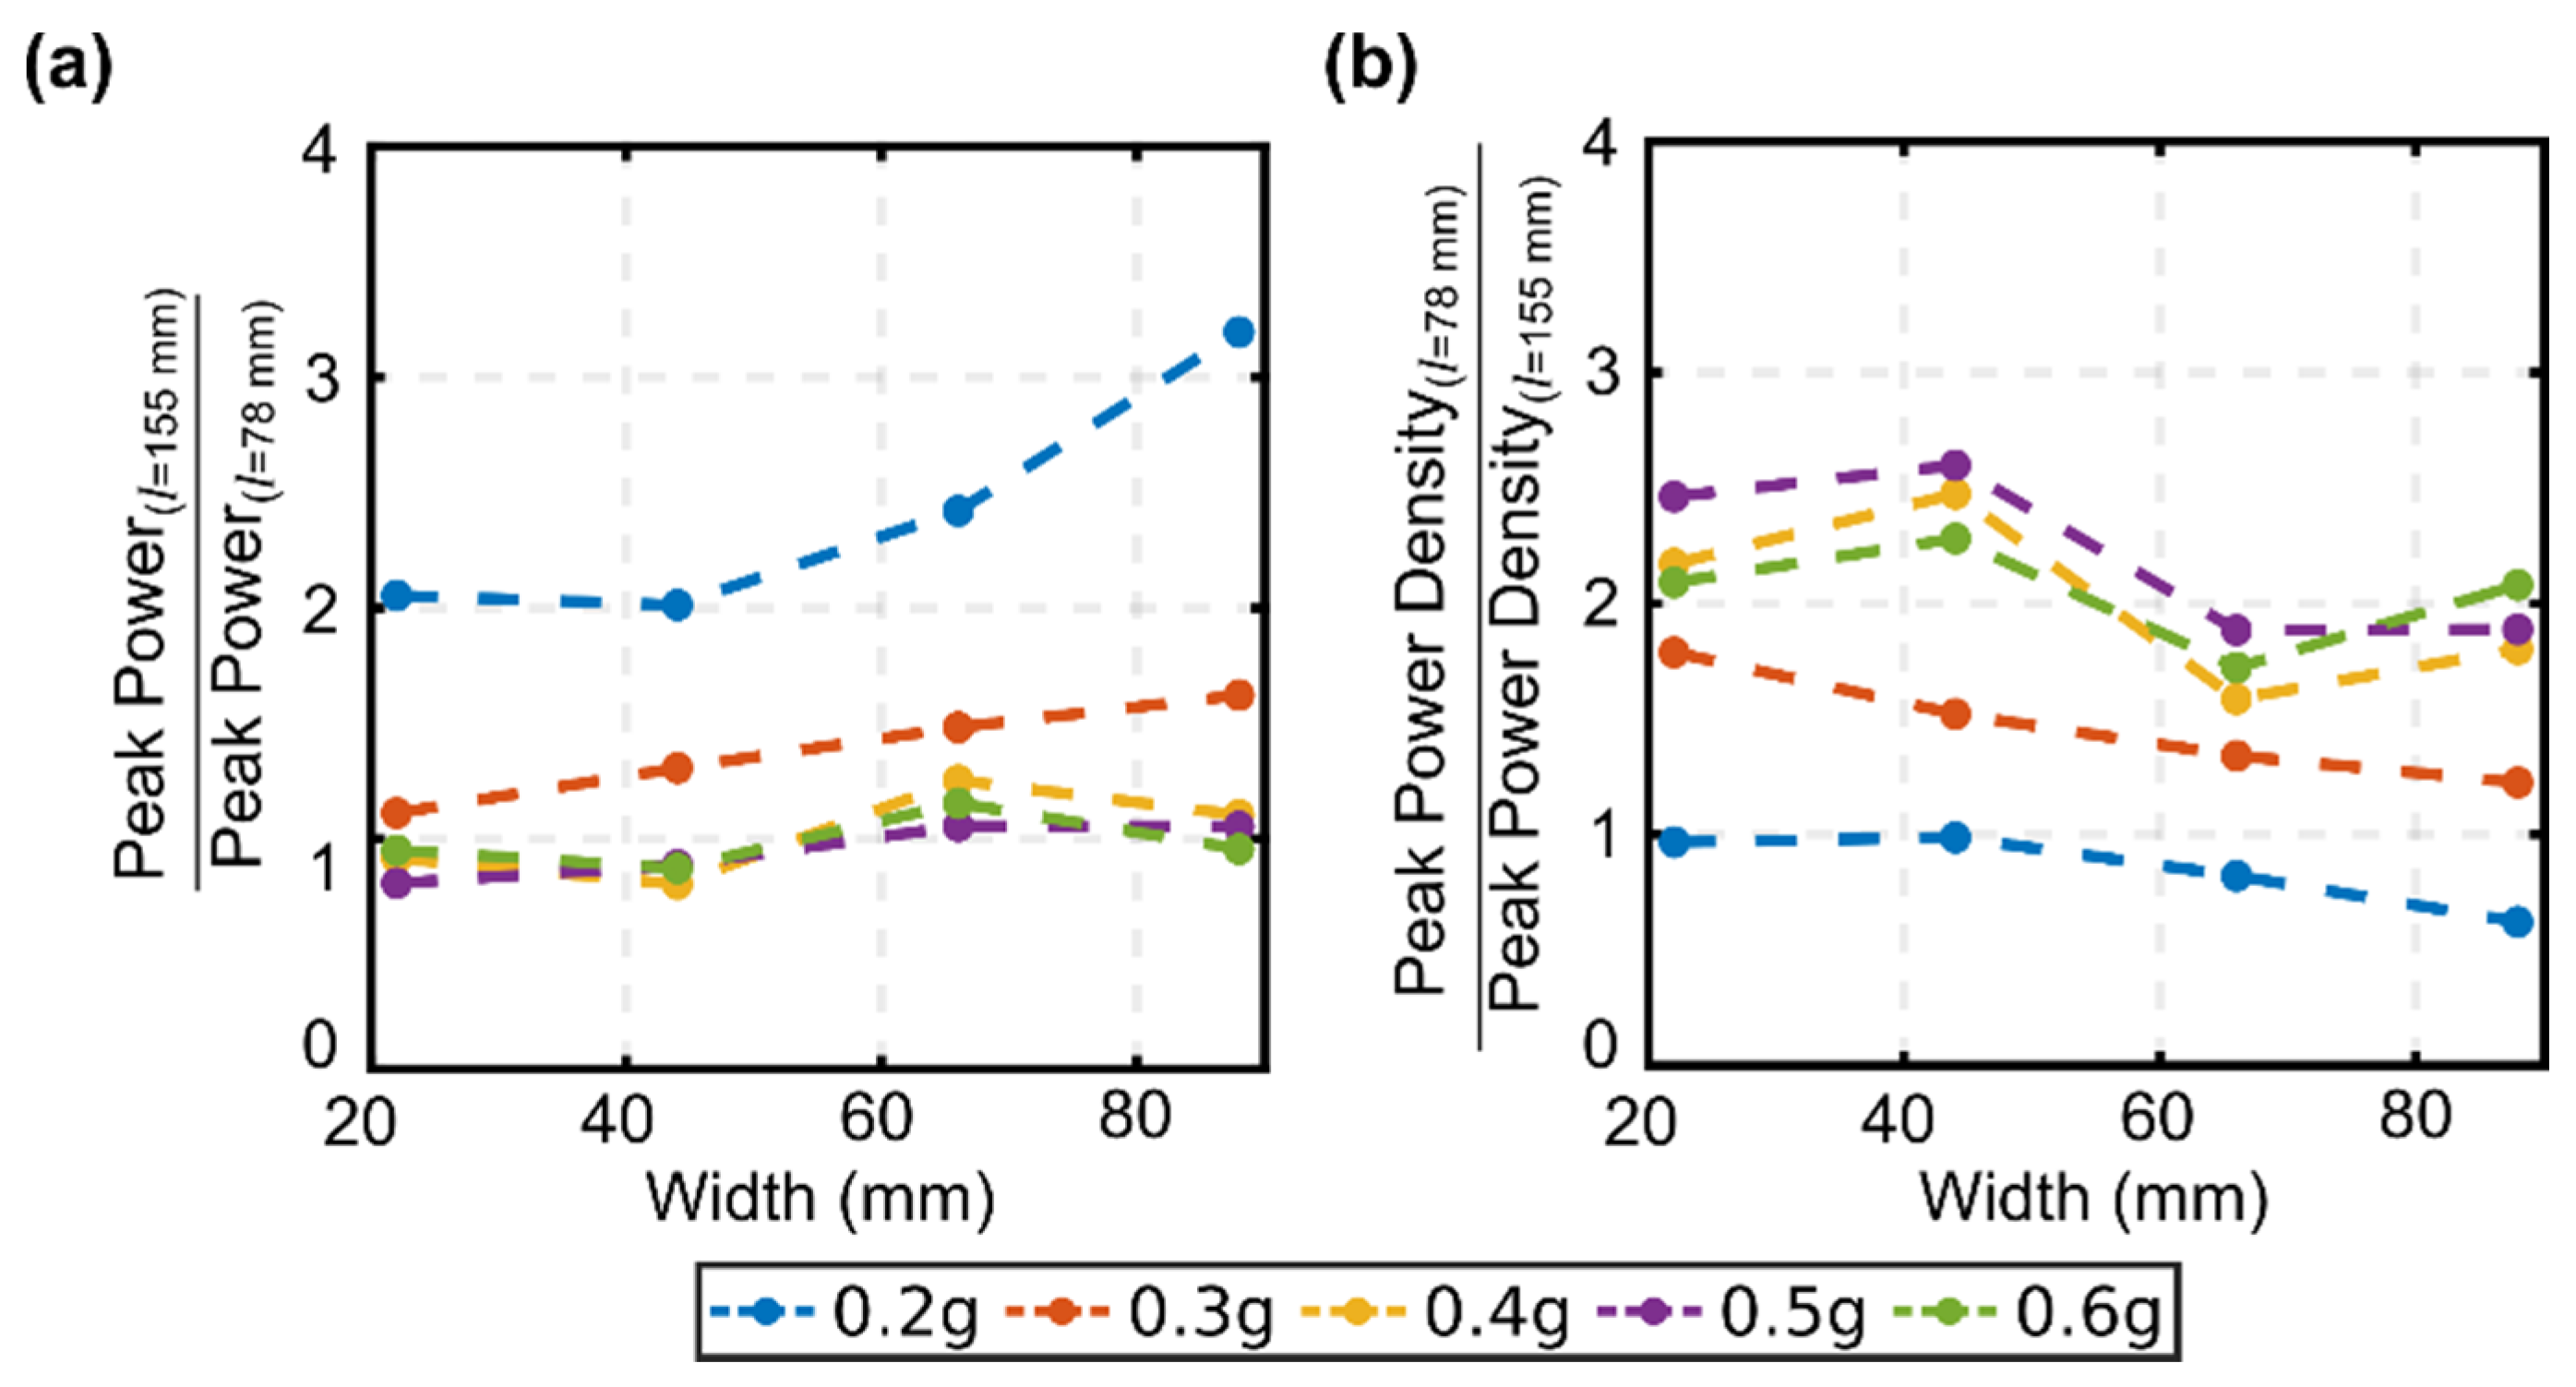
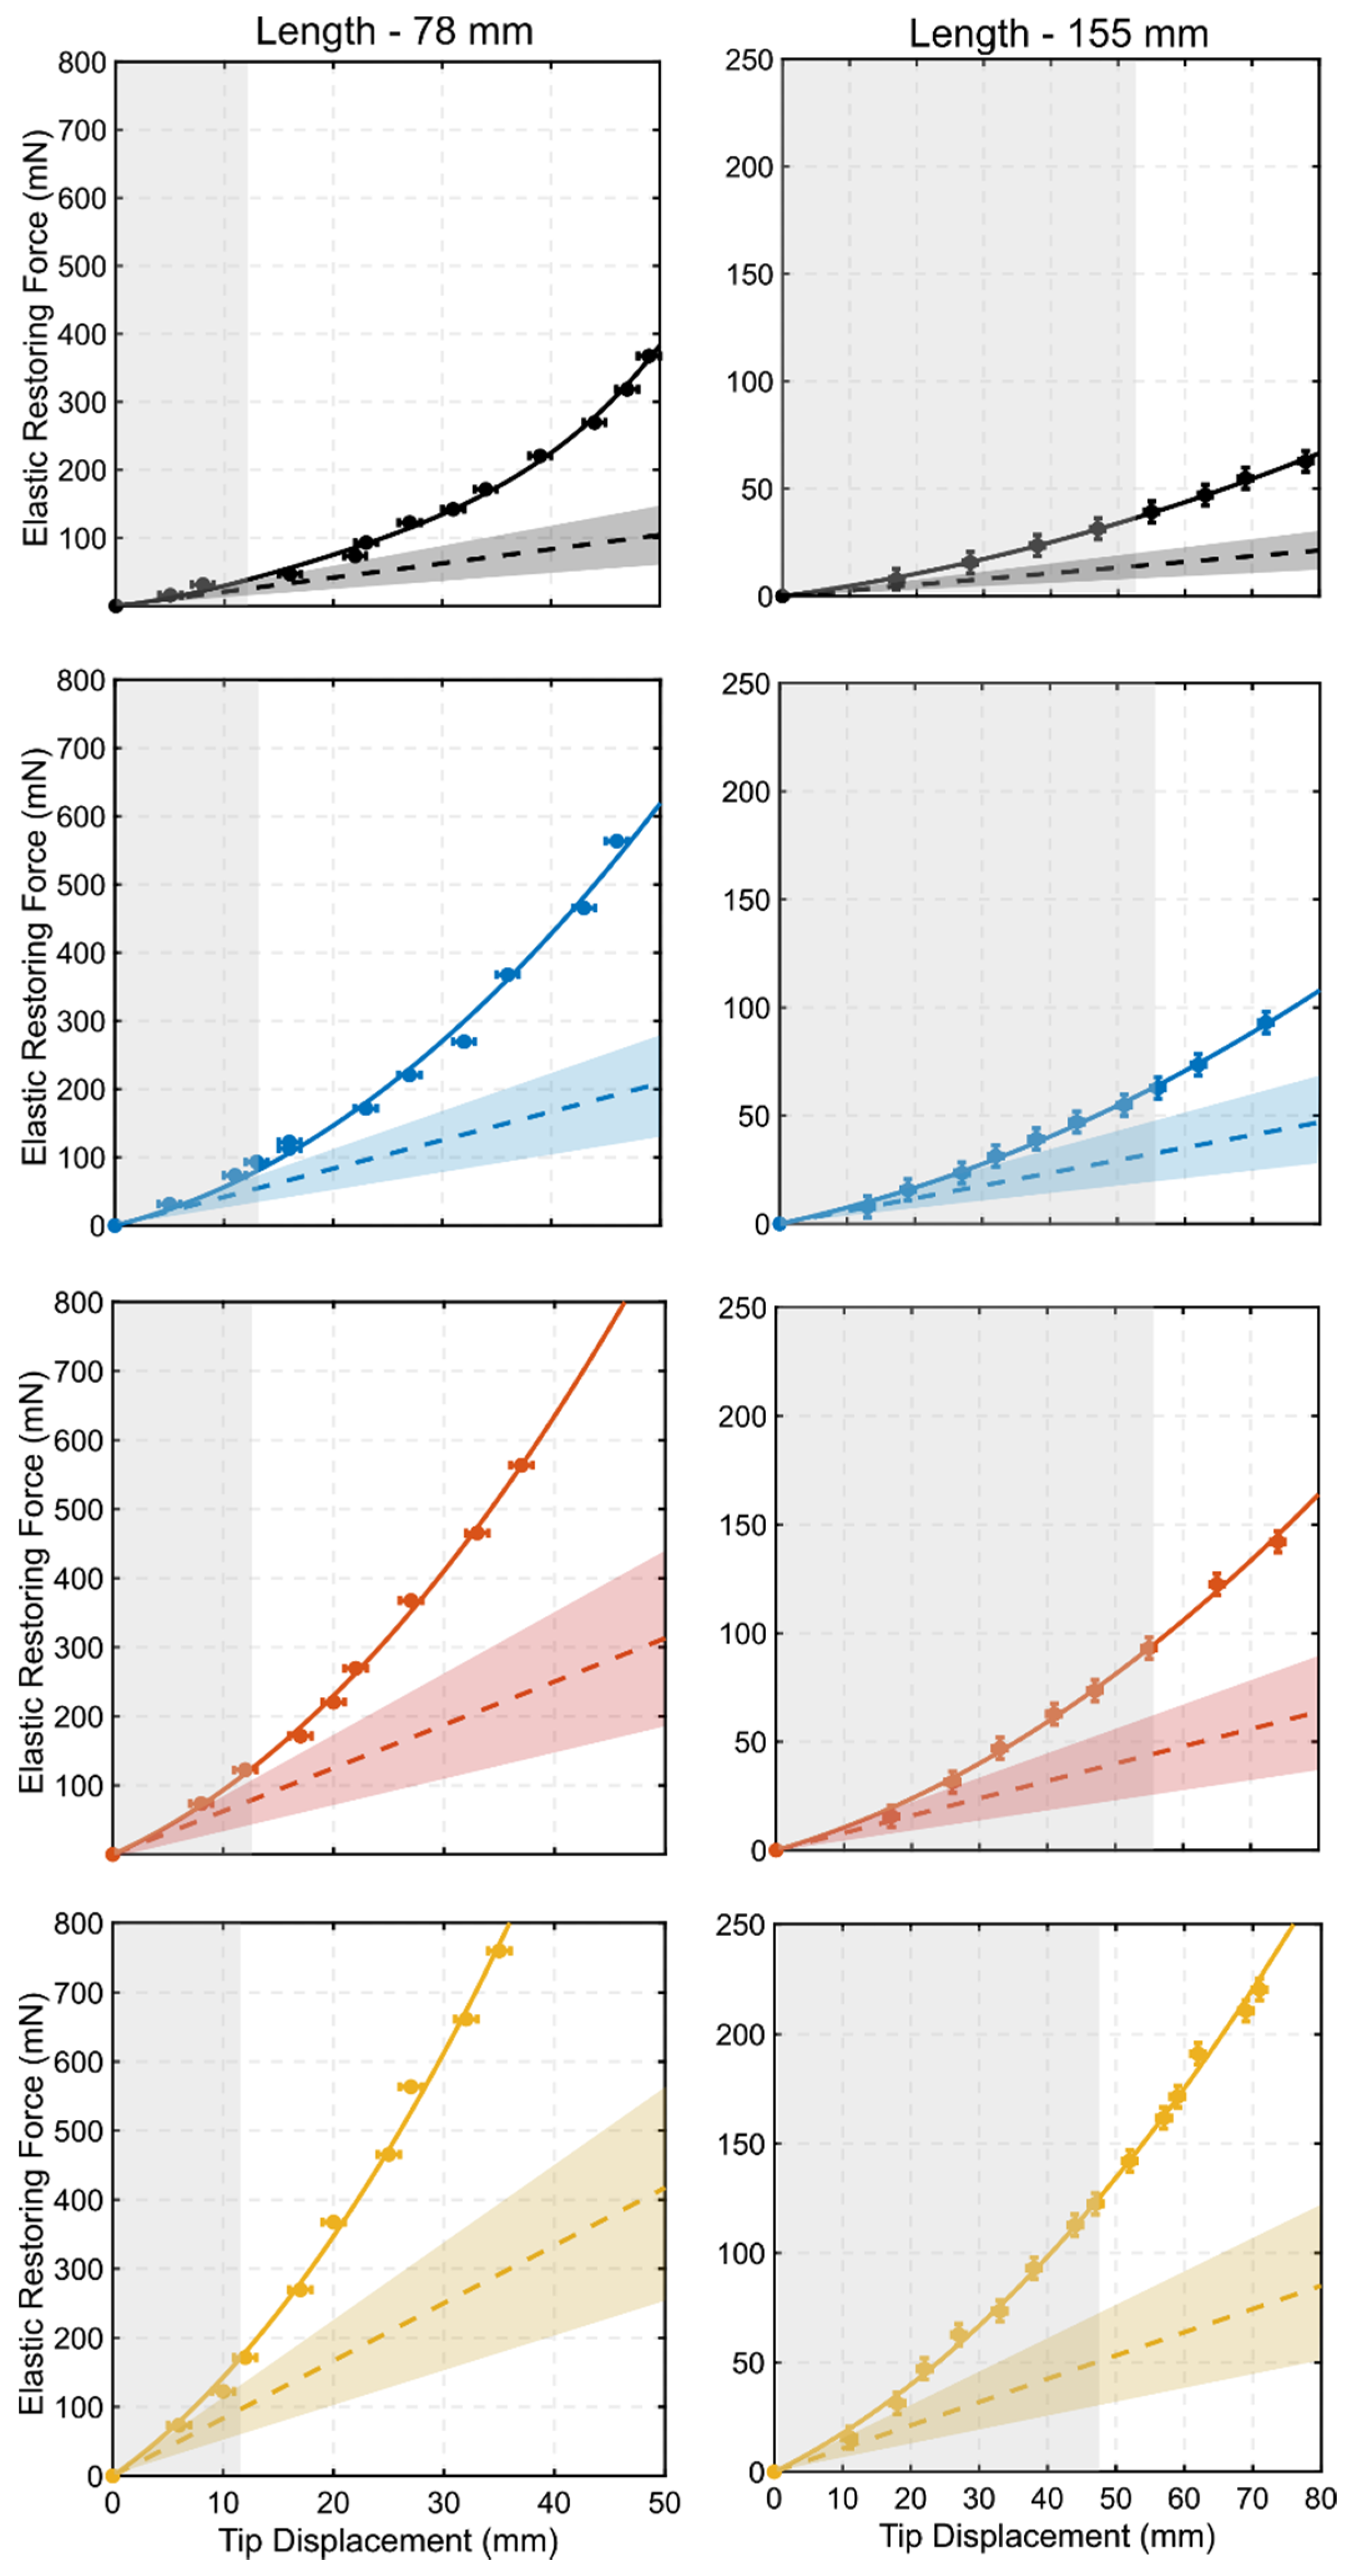
  • We show that the selection of the harvester length is critical and should be determined to ensure a linear device response to the operation excitation, as if non-linear effects are triggered, they will drastically deteriorate the power density performance;
  • We demonstrate the value of using the second moment of planform area to capture the geometric effect on the power density, i.e., to inform design/optimization studies. This is of significant importance from a practical perspective, in sizing such a class of harvesting devices for low-frequency vibration applications, and can open the door for further investigation and uptake of this metric when assessing harvester performance.

Author Contributions

Conceptualization, J.W., M.R.A.N., A.C. and A.R.; methodology, J.W., M.R.A.N., A.C., A.R. and S.W.; software, M.R.A.N.; validation, J.W. and M.R.A.N.; formal analysis, M.R.A.N.; investigation, J.W., M.R.A.N., A.C., A.R. and S.W.; resources, M.R.A.N.; data curation, J.W. and M.R.A.N.; writing—original draft preparation, M.R.A.N.; writing—review and editing, J.W., M.R.A.N., A.C., A.R. and S.W.; visualization, J.W. and M.R.A.N.; supervision, M.R.A.N., A.C. and A.R.; project administration, M.R.A.N., A.C. and A.R. All authors have read and agreed to the published version of the manuscript.

Funding

This research received no external funding.

Institutional Review Board Statement

Not applicable.

Informed Consent Statement

Not applicable.

Data Availability Statement

Data is contained within the article.

Acknowledgments

The authors are grateful to Andrew Kennaugh, Tunde Oyadiji, Hector Iacovides, and Steve Burley from the Department of Mechanical, Aerospace and Civil Engineering of the University of Manchester for their technical and equipment support during the realization of the experimental set-up.

Conflicts of Interest

The authors declare no conflict of interest.

Appendix A. Static Deflection Testing of Harvesters

The full set of static deflection tests data of the present harvesters is provided in Figure A1, where the elastic restoring force (measurement accuracy ± 5 mN) is plotted as a function of the tip displacement (measurement accuracy ± 1 mm). The predictions of standard Euler–Bernoulli beam theory for the metal shim substrate alone (without considering the PVDF strips and the adhesive tape) are also included in Figure A1 for comparison:
F = 3   E   I l 3 δ ;   I = I s e c t i o n = b   h e 3 12
where F is the elastic restoring force, δ is the tip displacement, E is the Young’s modulus (180 GPa for SS AISI 302), and l (78 mm or 155 mm), b (22, 44, 66, or 88 mm), and h e (0.1 mm) are the length, width, and thickness of the metal shim substrate (see Figure 1a). Note that the slope of the beam theory plotted in Figure A1 has an error of ± 40%, which originates from the tolerance on the thickness of the metal shim substrate (±0.012 mm as per manufacturer data sheets).
The deviation of harvester deflection from the theory in Figure A1 is expected since the theory neglects the presence of the PVDF and bonding layers. As noted in Figure A1, the present harvesters clearly behave as stiffening elastic springs. However, in the asymptotic limit of small tip displacement (i.e., δ → 0+), measured deflections appear consistent with beam theory predictions of the metal shim substrate, which indicates that for small deflections the elastic behavior of the present harvesters is essentially determined by the metal shim substrate alone, according to standard Euler–Bernoulli beam theory.
Note that the shaded areas in grey within Figure A1 indicate the displacement range of each harvester in our study, corresponding to the measurements shown in Figure 4. It is, therefore, evident that the short harvesters operate within a range where their elastic restoring force can be deemed quasi-linear or where the elastic stiffening is still too mild to appreciably affect their mechanical response, whereas the long harvesters, particularly the two widest models, operate within a range where the stiffness behaves in a non-linear fashion. Finally, for a given tip displacement, the measurements in Figure A1 indicate that the elastic restoring force increases when the width of the harvester is increased and decreases when the length of the harvester is increased, which are the same qualitative trends predicted by standard beam theory.
Figure A1. Measured elastic restoring force versus tip displacement. Markers represent the measured quantities from the experimental tests, with associated error ranges. The continuous lines are fitting lines to help visualize the trend in the experimental data. The dashed lines are the predictions from linear beam theory for the metal shim alone. The colorful shaded regions around the dashed lines are to indicate the potential ±40% error due to tolerance on the thickness of the metal shim substrate. The vertical shaded regions in grey correspond to the range of tip displacement values reported in this work.
Energies 14 00211 g0a1

Appendix B. Linear Electro-Mechanical Dynamic Model

The model adopted here is a distributed parameter linear model based on the Euler–Bernoulli beam theory, which is applicable in this context because the present harvesters qualify as slender structures, since the length to thickness ratio is well in excess of 20 [18,42,57]. Given that in some cases the aspect ratio (length to width ratio) is quite low, towards and up to around unity, a more appropriate modelling framework would require the consideration of our harvesters as plates. This is particularly relevant in the extremities of this parameter. As shown in Figure 4, our model, based on beam theory, shows good agreement with the experimental measurements for the short set of harvesters. This agreement is, in fact, not unexpected as deformation angles are small: within about 10° for the short harvesters, and it is established that the use of beam theory is valid for plate-like symmetric harvesters subjected to base excitation as long as the bending stiffness is correctly represented [18]. Indeed, in our model, we have used stiffness values based on our experimental measurements. For simplicity, the piezoelectric layers are represented as continuous media in the span-wise direction, an approximation considered acceptable for the present scope, and shown to be acceptable in a previous study [20]. The characteristic equation for a cantilever beam is well known as [18,42,57]:
1 + cos λ n cosh λ n = 0
which can be solved for the dimensionless n th eigenvalue, λ n . The corresponding eigenfunction (mode shape) is:
X n ( x ) = A n [ cos λ n x l cosh λ n x l + sin λ n sinh λ n cos λ n + cosh λ n ( sin λ n x l sinh λ n x l ) ]
where A n is the modal amplitude. The displacement with respect to base, w , along the harvester length x at time t is, thus, obtained from:
w ( x , t ) = n = 1 ψ n X n ( x ) 1 ω n 2 ( 1 ( ω ω n ) 2 ) 2 + ( 2 ζ n ω ω n ) 2 A b cos ω t
where ω is the operation angular frequency, ω n is the undamped natural frequency of the n th vibration mode, ζ n is the damping ratio of the n th vibration mode, and A b is the base excitation acceleration amplitude. The expression for ψ n specific to our current harvester configuration takes the form:
ψ n = b ( ρ e h e + 2 ρ b h b + 2 ρ p h p ) 0 l X n ( x ) d x
Given that the interest here is in the tip displacement of the harvesters around the first mode, Equation (A4) simplifies to:
w ( l , t ) = ψ 1 X 1 ( l ) 1 ω 1 2 ( 1 ( ω ω 1 ) 2 ) 2 + ( 2 ζ 1 ω ω 1 ) 2 A b cos ω t
The parallel connection steady state voltage response, v p , can be evaluated based on an expression presented in [18,20]:
v p = | j ( ω R o p t κ n ) ( 1 + j ω R o p t C p ) X n ( l ) | w ( l )
where κ n is the modal coupling term, which for the current harvester configuration of this study is evaluated as:
κ n = 2 d 31 Y p b p 2 ( h p + 2 h b + h e ) d X n ( x ) d x | x = l
and C p is the internal capacitance given by:
C p = 2 ε b p l h p
where ε is the permittivity, and b p is the effective width of the PVDF layer, which, in our case, is the number of PVDF elements on one side of the harvester multiplied by the effective width of the active part of each element (19 mm for the DT4-028K model). The RMS value of the power could, thus, be evaluated from:
P = v p 2 2 R o p t

References

  1. Zhao, G. Wireless sensor networks for industrial process monitoring and control: A survey. Netw. Protoc. Algorithms 2011, 3, 46–63. [Google Scholar] [CrossRef]
  2. Aponte-Luis, J.; Gómez-Galán, J.A.; Gómez-Bravo, F.; Sánchez-Raya, M.; Alcina-Espigado, J.; Teixido-Rovira, P.M. An efficient wireless sensor network for industrial monitoring and control. Sensors 2018, 18, 182. [Google Scholar] [CrossRef] [PubMed] [Green Version]
  3. Iqbal, Z.; Kim, K.; Lee, H. A cooperative wireless sensor network for indoor industrial monitoring. IEEE Trans. Ind. Inform. 2017, 13, 482–491. [Google Scholar] [CrossRef]
  4. Whelan, M.; Janoyan, K. Design of a robust, high-rate wireless sensor network for static and dynamic structural monitoring. J. Intell. Mater. Syst. Struct. 2008, 20, 849–863. [Google Scholar] [CrossRef]
  5. Avci, O.; Abdeljaber, O.; Kiranyaz, S.; Hussein, M.; Inman, D. Wireless and real-time structural damage detection: A novel decentralized method for wireless sensor networks. J. Sound Vib. 2018, 424, 158–172. [Google Scholar] [CrossRef]
  6. Yi, W.; Lo, K.; Mak, T.; Leung, K.; Leung, Y.; Meng, M. A survey of wireless sensor network based air pollution monitoring systems. Sensors 2015, 15, 31392–31427. [Google Scholar] [CrossRef] [Green Version]
  7. Kingsy Grace, R.; Manju, S. A comprehensive review of wireless sensor networks based air pollution monitoring systems. Wirel. Pers. Commun. 2019, 108, 2499–2515. [Google Scholar] [CrossRef]
  8. Adu-Manu, K.; Tapparello, C.; Heinzelman, W.; Katsriku, F.; Abdulai, J. Water quality monitoring using wireless sensor networks. ACM Trans. Sens. Netw. 2017, 13, 1–41. [Google Scholar] [CrossRef] [Green Version]
  9. Lin, Y.P.; Mukhtar, H.; Huang, K.T.; Petway, J.R.; Lin, C.M.; Chou, C.F.; Liao, S.W. Real-time identification of irrigation water pollution sources and pathways with a wireless sensor network and blockchain framework. Sensors 2020, 20, 3634. [Google Scholar] [CrossRef]
  10. Bouabdellah, K.; Noureddine, H.; Larbi, S. Using wireless sensor networks for reliable forest fires detection. Procedia Comput. Sci. 2013, 19, 794–801. [Google Scholar] [CrossRef] [Green Version]
  11. Silvani, X.; Morandini, F.; Innocenti, E.; Peres, S. Evaluation of a wireless sensor network with low cost and low energy consumption for fire detection and monitoring. Fire Technol. 2015, 51, 971–993. [Google Scholar] [CrossRef] [Green Version]
  12. Erdelj, M.; Król, M.; Natalizio, E. Wireless sensor networks and multi-UAV systems for natural disaster management. Comput. Netw. 2017, 124, 72–86. [Google Scholar] [CrossRef]
  13. Harne, R.L.; Wang, K.W. A review of the recent research on vibration energy harvesting via bistable systems. Smart Mater. Struct. 2013, 22, 023001. [Google Scholar] [CrossRef]
  14. Zuo, L.; Tang, X. Large-scale vibration energy harvesting. J. Intell. Mater. Syst. Struct. 2013, 24, 1405–1430. [Google Scholar] [CrossRef]
  15. Twiefel, J.; Westermann, H. Survey on broadband techniques for vibration energy harvesting. J. Intell. Mater. Syst. Struct. 2013, 24, 1291–1302. [Google Scholar] [CrossRef]
  16. Wei, C.; Jing, X. A comprehensive review on vibration energy harvesting: Modelling and realization. Renew. Sustain. Energy Rev. 2017, 74, 1–18. [Google Scholar] [CrossRef]
  17. Liu, D.K.C.; Friend, J.; Yeo, L. A brief review of actuation at the micro-scale using electrostatics, electromagnetics and piezoelectric ultrasonics. Acoust. Sci. Technol. 2010, 31, 115–123. [Google Scholar] [CrossRef] [Green Version]
  18. Erturk, A.; Inman, D. Piezoelectric Energy Harvesting; John Wiley and Sons, Ltd.: West Sussex, UK, 2011. [Google Scholar]
  19. Hirst, J.; Wang, J.; Nabawy, M.R.A.; Cioncolini, A. Long-term power degradation testing of piezoelectric vibration energy harvesters for low-frequency applications. Eng. Res. Express 2020, 2, 035026. [Google Scholar] [CrossRef]
  20. Wang, J.; Nabawy, M.R.A.; Cioncolini, A.; Revell, A. Solar panels as tip masses in low frequency vibration harvesters. Energies 2019, 12, 3815. [Google Scholar] [CrossRef] [Green Version]
  21. Li, S.; Yuan, J.; Lipson, H. Ambient wind energy harvesting using cross-flow fluttering. J. Appl. Phys. 2011, 109, 026104. [Google Scholar] [CrossRef] [Green Version]
  22. Jackson, N.; O’Keeffe, R.; O’Neill, M.; Waldron, F.; Mathewson, A. CMOS compatible low-frequency aluminium nitride MEMS piezoelectric energy harvesting device. In Proceedings of the SPIE Microtechnologies, Smart Sensors, Actuators, and MEMS VI, Grenoble, France, 17 May 2013; p. 87631I. [Google Scholar]
  23. Sharma, A.; Olszewski, O.Z.; Torres, J.; Mathewson, A.; Houlihan, R. Fabrication, simulation and characterisation of MEMS piezoelectric vibration energy harvester for low frequency. Procedia Eng. 2015, 120, 645–650. [Google Scholar] [CrossRef] [Green Version]
  24. Shadoufa, M.; Emad, A.; Ghoneima, M.; Mahmoud, M.A.; Dessouky, M. Structure optimization for efficient AlN piezoelectric energy harvesters. In Proceedings of the IEEE International Conference on Electronics, Circuits, and Systems (ICECS), Cairo, Egypt, 6–9 December 2015; pp. 527–530. [Google Scholar]
  25. Heidrich, N.; Knöbber, F.; Sah, R.E.; Pletschen, W.; Hampl, S.; Cimalla, V.; Lebedev, V. Biocompatible AlN-based piezo energy harvesters for implants. In Proceedings of the IEEE International Solid-State Sensors, Actuators and Microsystems Conference, Beijing, China, 6–9 June 2011; pp. 1642–1644. [Google Scholar]
  26. Li, Y.; Çelik-Butler, Z.; Butler, D.P. An integrated piezoelectric zinc oxide nanowire micro-energy harvester. Nano Energy 2016, 26, 456–465. [Google Scholar] [CrossRef]
  27. Poulin-Vittrant, G.; Oshman, C.; Opoku, C.; Dahiya, A.S.; Camara, N.; Alquier, D.; Lethiecq, M. Fabrication and characterization of ZnO nanowire-based piezoelectric nanogenerators for low frequency mechanical energy harvesting. Phys. Procedia 2015, 70, 909–913. [Google Scholar] [CrossRef] [Green Version]
  28. Li, H.; Tian, C.; Deng, Z.D. Energy harvesting from low frequency applications using piezoelectric materials. Appl. Phys. Rev. 2014, 1, 041301. [Google Scholar] [CrossRef] [Green Version]
  29. Jiang, Y.; Hamada, H.; Shiono, S.; Kanda, K.; Fujita, T.; Higuchi, K.; Maenaka, K. A PVDF-based flexible cardiorespiratory sensor with independently optimized sensitivity to heartbeat and respiration. Procedia Eng. 2010, 5, 1466–1469. [Google Scholar] [CrossRef] [Green Version]
  30. Cao, Z.; Zhang, J.; Kuwano, H. Vibration energy harvesting characterization of 1 cm2 poly(vinylidene fluoride) generators in vacuum. Jpn. J. Appl. Phys. 2011, 50, 09ND15. [Google Scholar] [CrossRef]
  31. Rammohan, S.; Ramya, C.; Kumar, J.; Jain, A.; Pratap, R. Low frequency vibration energy harvesting using arrays of PVDF piezoelectric bimorphs. J. Intell. Mater. Syst. Struct. 2014, 3, 18–27. [Google Scholar]
  32. Song, J.; Zhao, G.; Li, B.; Wang, J. Design optimization of PVDF-based piezoelectric energy harvesters. Heliyon 2017, 3, e00377. [Google Scholar] [CrossRef]
  33. Tsukamoto, T.; Umino, Y.; Shiomi, S.; Yamada, K.; Suzuki, T. Bimorph piezoelectric vibration energy harvester with flexible 3D meshed-core structure for low frequency vibration. Sci. Technol. Adv. Mater. 2018, 19, 660–668. [Google Scholar] [CrossRef] [Green Version]
  34. Chandwani, J.; Somkuwar, R.; Deshmukh, R. Multi-band piezoelectric vibration energy harvester for low-frequency applications. Microsyst. Technol. 2019, 25, 3867–3877. [Google Scholar] [CrossRef]
  35. Roundy, S.; Wright, P.; Rabaey, J. A study of low level vibrations as a power source for wireless sensor nodes. Comput. Commun. 2003, 26, 1131–1144. [Google Scholar] [CrossRef]
  36. Boisseau, S.; Despesse, G.; Seddik, B. Nonlinear H-shaped springs to improve efficiency of vibration energy harvesters. J. Appl. Mech. 2013, 80, 061013. [Google Scholar] [CrossRef] [Green Version]
  37. Casiano, M.; Marshall, G. Extracting Damping Ratio from Dynamic Data and Numerical Solutions; NASA Technical Memorandum No 218227; NASA Langley Research Center: Hampton, VA, USA, 2016.
  38. Inman, D. Engineering Vibration; Prentice-Hall, Inc.: Upper Saddle River, NJ, USA, 1996. [Google Scholar]
  39. Blevins, R. Flow-Induced Vibration, 2nd ed.; Krieger Publishing Company: Malabar, FL, USA, 2001. [Google Scholar]
  40. Elliott, S.; Tehrani, M.; Langley, R. Nonlinear damping and quasi-linear modelling. Philos. Trans. R. Soc. A Math. Phys. Eng. Sci. 2015, 373, 20140402. [Google Scholar] [CrossRef] [PubMed] [Green Version]
  41. Fearnow, D. Investigation of the Structural Damping of a Full-Scale Airplane Wing; NACA Research Memorandum No L51A04; National Advisory Committee for Aeronautics: Washington, DC, USA, 1951. Available online: https://digital.library.unt.edu/ark:/67531/metadc58765/m1/ (accessed on 1 January 2021).
  42. Nabawy, M.R.A.; Parslew, B.; Crowther, W.J. Dynamic performance of unimorph piezoelectric bending actuators. Proc. Inst. Mech. Eng. Part I J. Syst. Control Eng. 2014, 229, 118–129. [Google Scholar] [CrossRef]
  43. Dagdeviren, O.; Miyahara, Y.; Mascaro, A.; Enright, T.; Grütter, P. Amplitude dependence of resonance frequency and its consequences for scanning probe microscopy. Sensors 2019, 19, 4510. [Google Scholar] [CrossRef] [PubMed] [Green Version]
  44. Jia, Y. Review of nonlinear vibration energy harvesting: Duffing, bistability, parametric, stochastic and others. J. Intell. Mater. Syst. Struct. 2020, 31, 921–944. [Google Scholar] [CrossRef]
  45. Tran, N.; Ghayesh, M.; Arjomandi, M. Ambient vibration energy harvesters: A review on nonlinear techniques for performance enhancement. Int. J. Eng. Sci. 2018, 127, 162–185. [Google Scholar] [CrossRef]
  46. Zhang, H.; Corr, L.; Ma, T. Issues in vibration energy harvesting. J. Sound Vib. 2018, 421, 79–90. [Google Scholar] [CrossRef]
  47. Ramlan, R.; Brennan, M.; Mace, B.; Kovacic, I. Potential benefits of a non-linear stiffness in an energy harvesting device. Nonlinear Dyn. 2009, 59, 545–558. [Google Scholar] [CrossRef]
  48. Wang, C.; Zhang, Q.; Wang, W. Low-frequency wideband vibration energy harvesting by using frequency up-conversion and quin-stable nonlinearity. J. Sound Vib. 2017, 399, 169–181. [Google Scholar] [CrossRef]
  49. Zhang, L.; Abdelkefi, A.; Dai, H.; Naseer, R.; Wang, L. Design and experimental analysis of broadband energy harvesting from vortex-induced vibrations. J. Sound Vib. 2017, 408, 210–219. [Google Scholar] [CrossRef]
  50. Gammaitoni, L.; Neri, I.; Vocca, H. Nonlinear oscillators for vibration energy harvesting. Appl. Phys. Lett. 2009, 94, 164102. [Google Scholar] [CrossRef] [Green Version]
  51. Nabawy, M.R.A.; Crowther, W.J. Is Flapping Flight Aerodynamically Efficient? In Proceedings of the 32nd AIAA Applied Aerodynamics Conference, AIAA Aviation and Aeronautics Forum and Exposition, Atlanta, GA, USA, 16–20 June 2014; pp. 2014–2277. [Google Scholar]
  52. Nabawy, M.R.A.; ElNomrossy, M.M.; Abdelrahman, M.M.; ElBayoumi, G.M. Aerodynamic shape optimisation, wind tunnel measurements and CFD analysis of a MAV wing. Aeronaut. J. 2012, 116, 685–708. [Google Scholar] [CrossRef] [Green Version]
  53. Cioncolini, A.; Nabawy, M.R.A.; Silva-Leon, J.; O’Connor, J.; Revell, A. An experimental and computational study on inverted flag dynamics for simultaneous wind–solar energy harvesting. Fluids 2019, 4, 87. [Google Scholar] [CrossRef] [Green Version]
  54. Ojo, O.; Tan, D.; Wang, Y.; Shoele, K.; Erturk, A. Aspect ratio effects in wind energy harvesting using piezoelectric inverted flags. In Proceedings of the SPIE 10967, Active and Passive Smart Structures and Integrated Systems XIII, Denver, CO, USA, 27 March 2019; p. 109670Q. [Google Scholar]
  55. Orrego, S.; Shoele, K.; Ruas, A.; Doran, K.; Caggiano, B.; Mittal, R.; Kang, S. Harvesting ambient wind energy with an inverted piezoelectric flag. Appl. Energy 2017, 194, 212–222. [Google Scholar] [CrossRef]
  56. Silva-Leon, J.; Cioncolini, A.; Nabawy, M.R.A.; Revell, A.; Kennaugh, A. Simultaneous wind and solar energy harvesting with inverted flags. Appl. Energy 2019, 239, 846–858. [Google Scholar] [CrossRef] [Green Version]
  57. Nabawy, M.R.A.; Crowther, W.J. Dynamic electromechanical coupling of piezoelectric bending actuators. Micromachines 2016, 7, 12. [Google Scholar] [CrossRef]
Figure 1. The harvesters considered in this study: (a) design schematics (the example shown includes four polyvinylidene difluoride (PVDF) elements on each side); (b) one PVDF element; (c) schematic representation of the custom-made mounting system to connect the harvester to the shaker (the upper plate is removed to show internal details); (d) harvesters H1–H4 with length of 78 mm; (e) harvesters H5–H8 with length of 155 mm.
Energies 14 00211 g001
Figure 2. (a) Experimental setup used to test the harvesters. (b) Schematic of the experimental setup arrangement.
Energies 14 00211 g002
Figure 3. Measured elastic restoring force (top) and damping ratio (bottom) of the harvesters (the continuous lines are fitting lines included to help visualize the trend in the data). Markers represent the measured quantities from the experimental tests, error bars in the top panels reflect the measuring errors in the elastic restoring force and tip displacement (as discussed in Appendix A), whereas those in the bottom-right panel represent the standard deviation of repeated measures.
Energies 14 00211 g003
Figure 4. Tip displacement and root mean square (RMS) power measurements versus excitation non-dimensional frequency. Markers represent the measured responses; dashed lines are added to help visualize the experimental trends. Continuous lines represent the linear model predictions for the set of short harvesters.
Energies 14 00211 g004
Figure 5. Peak power as a function of harvester width for different base excitation levels; (a) set of short harvesters (H1–H4); (b) set of long harvesters (H5–H8). Dashed lines are added to help visualize the trends but do not imply a linear variation between measurement points.
Energies 14 00211 g005
Figure 6. Relative performance of the two sets of harvesters across a common range of harvester widths; (a) peak power ratio of long to short harvesters; (b) peak power density ratio of short to long harvesters. Dashed lines between measurements are added to help visualize trends.
Energies 14 00211 g006
Figure 7. Peak power ratio of harvesters relative to that of the thinnest harvester with 22 mm width for different base excitation levels; (a) set of short harvesters (H1–H4); (b) set of long harvesters (H5–H8).
Energies 14 00211 g007
Figure 8. Variation of the peak power and the peak power density against: (a) aspect ratio; (b) and (c) different definitions of the second moment of area. Panels designated with (i) provide schematics of the different geometric characteristics considered including aspect ratio, the second moment of planform area, and the second moment of sectional area. Panels designated with (ii) provide peak power variations. Panels designated with (iii) provide peak power density variations. For simplicity, in the calculation of I s e c t i o n , the h value is taken as 0.1 mm of the metal shim substrate.
Energies 14 00211 g008
Table 1. Characteristics of the harvesters considered in this study.
HarvesterLength,
l (mm)
Width,
b (mm)
Aspect Ratio, l / b   ( - ) Second Moment of Plan-form Area, I p l a n f o r m   ( cm 4 ) Optimum Load Resistance,
R o p t   ( kOhm )
H178223.553481000
H278441.77696600
H378661.181044400
H478880.891392250
H5155227.0527312400
H6155443.5254621200
H7155662.358192800
H8155881.7610,923600
Table 2. Resonant frequency in Hz for the harvesters considered in this study.
ExcitationH1H2H3H4H5H6H7H8
0.2 g13.5131314.543.53.53.5
0.3 g13.51312.513.543.53.53.5
0.4 g131312.5133.53.53.53.5
0.5 g131312.5133.53.53.53.5
0.6 g1313.512.5133.53.53.53.5
Publisher’s Note: MDPI stays neutral with regard to jurisdictional claims in published maps and institutional affiliations.

