1. Introduction
The number of different electrical appliances in households keeps rising. As such, it is becoming increasingly important to recognize the potentials for energy savings and demand side management, i.e., the possibility to defer power consumption in order to improve the stability of the power grid. For these purposes, it is not only vital to have complete knowledge about the appliances present in a building, but also their individual energy demands and operational times. Monthly electricity bills only provide insufficient information to accomplish this task, however, as the required information can only be estimated from the household total. Even current-generation smart meters are incapable of providing a detailed and unambiguous itemization of energy consumption, so more fine-grained means for load monitoring in a home are needed to provide enhanced consumption feedback and accomplish energy savings (which were documented to reach up to 12% in [
1]).
Two fundamentally different approaches exist for the collection of the required data at appliance level. One the one hand, Intrusive Load Monitoring relies on the installation of power sensing devices for each appliance under consideration (or at least every electrical circuit in the home). The advantages of being able to attribute power consumption to individual devices, however, come at a high cost for instrumenting the environment with sensors, and maintaining their operability during their lifetime. On the other hand, Non-Intrusive Load Monitoring (NILM) methods collect the electrical information of a whole building or apartment and use algorithms to disaggregate the total power demand into the contributions of individual devices. The non-intrusive approach is often preferred due to lower costs and installation efforts. However, current NILM methods do not always succeed in accurately and unambiguously disaggregating power data from households [
2].
Most current methods for appliance recognition and load disaggregation consider electrical consumption data (e.g., active power) [
2,
3]. When data are available at a sufficient resolution, however, more complex features like spectral components can be computed and used supplementally. Using more, especially more complex, features has been shown to improve the rate of correct device recognitions [
4]. Confusion may still exist between certain appliance types, and some appliances have been reported to be “hard to disaggregate” [
5,
6] based on their electricity consumption alone. One potential candidate to alleviate the current limitations of NILM is the additional use of contextual information, as documented in [
7,
8,
9]. For example, the distributions of On- and Off-durations as well as dependencies between device usages are modeled into a Factorial Hidden Markov Model (FHMM) in [
7]. The resulting performance shows a marked improvement, even for a larger number of active appliances, and reaches improvements of up to 25%.
A similar approach based on user presence and time constraints was presented in [
3]. The application of time constraints alone was shown to achieve a small improvement of about 3%. However, as soon as indicators of the user presence were included in combination with time constraints, improvements of about 14% were reported.
But there are more parameters besides the aforementioned attributes. It is well-known that many electrical devices generate acoustic, magnetic, or optical emissions, or dissipate the consumed energy as heat during their activity. The potentials of using such information in the appliance recognition task have been investigated in [
5,
10,
11] and further studies presented in
Section 2. We, however, believe that our work is first to present a holistic and comprehensive study that determines the information gain of a range of additional sensing modalities. A thorough understanding of the importance of ambient sensing features is vital to optimally support appliance recognition (e.g., by lowering the number of candidate devices for the classification task). We strongly expect monitoring systems to profit from a deeper understanding of the features that characterize the operation of electrical appliances. System operators could then decide to specifically collect data based on the importance of certain sensor types, i.e., their usefulness, to better evaluate if costs outweigh possible benefits. Costs typically arise from hardware purchases and the device deployment in their optimum locations (e.g., luminosity sensors need to be mounted next to the light-emitting parts). However, non-monetary costs may also play a role, e.g., when sensors have the potential to compromise on user security or privacy. Understanding the importance of ambient sensing features will thus ease the considerations which sensor types to deploy. Accordingly, our work seeks to establish the foundation to enable further work in this context by providing an answer to the following question: Which ambient sensors can lead to improved appliance recognition results, and what are the most useful sensor types to facilitate the categorization of electrical consumers by their types?
In order to answer this question, we design a study to be conducted in two sequential steps. The first step, the design and implementation of a comprehensive data acquisition setup, is essential due to the unavailability of publicly released data that contains information beyond electrical power consumption data. In our second step, data analysis, we assess the contribution of each sensing modality to the overall appliance recognition task. Beyond the recognition of specific appliances, we also determine the set of features to facilitate the detection of appliance classes (i.e., the distinction between devices of different categories). Ultimately, the analyses presented in this work allow us to derive recommendations for future data collection campaigns, similar to the set of guidelines for electrical datasets presented in [
12].
Our manuscript is organized as follows. In
Section 2 we provide an overview of further studies which considered additional ambient sensing and illustrate how these works were considered for the design of our study. In
Section 3 we present our system design to collect data from eight ambient parameters, both during appliance operation and inactivity. The concept for our subsequent evaluation and its parameter choices are detailed in
Section 4. We evaluate to what extent devices could be recognized and what ambient sensors carried the most information in
Section 5, and we summarize the insights gained in our study in
Section 6.
2. Related Work
A number of studies have considered further data besides electrical information sources to improve the device identification and accordingly improve the disaggregation process: Acoustic sensors, light, temperature, vibration, electro-magnetic fields, or acceleration data [
5,
10,
11,
13,
14,
15,
16]. Remarkedly, however, the aforementioned works have considered these parameters largely in isolation, as shown in
Table 1. Opposed to this, we present a comprehensive study that relies on all sensor types in this work.
The sensor deployment methodologies differ as well. The authors of [
5,
11,
13,
14] use a small number of sensors, which are not fixed to the appliances under consideration, but rather monitor the ambient conditions in general. As such, they can collect information from appliances that are operating simultaneously. In contrast to this, the collection setups presented in [
10,
15,
16] use separate sensors for each appliance, thus recorded values can be unambiguously attributed. These sensor placements are mostly related to the different concepts of the respective studies. The authors of [
11,
13,
17] present different sensing platforms and concepts, but only briefly evaluate the possibility to identify electrical devices. In [
14] the authors introduce a system which solely includes ambient audio information, collected on a per-room granularity. The system is considered as a load monitoring system and uses different collected audio features as a first disaggregation layer. Only if the audio features do not allow for disaggregation, the electrical features are evaluated and can overwrite the decision. The authors of [
18] follow a similar approach, albeit they implement a smartphone-based system to detect household activities. Through the annotation of activities with corresponding energy consumption data, the authors enable basic load monitoring based on audio information. Lastly, the authors of [
10] present the appliance-agnostic usage of “multi-modal signatures” through the common evaluation of all sensor data and their changes that allow for device identification. They recognize the potential of closely correlated environmental data as trusted sources of appliance activations, allowing NILM systems to validate or re-train themselves. While the general usefulness of multimodal signatures is proven in [
10], the used sensor types are not evaluated concerning their individual usefulness. Aligned with these insights, the authors of [
19] have also remarked the potential of environmental sensors in disaggregation tasks.
Bearing these related findings in mind, we present our data acquisition concept and its evaluation in the following sections. As the related studies did use approaches with and without consideration of electrical data for the recognition process, our study will accordingly include evaluations for both approaches.
3. Data Acquisition Concept
A number of datasets are widely used in related research on energy data analytics so far (e.g., [
20,
21,
22,
23,
24]). Collecting such datasets, however, is often motivated by the desire to capture a large continuous stream of electrical energy consumption readings for data processing tasks like pattern recognition or forecasting. Ambient features or user-specific details (e.g., presence) are not part of most datasets, and there is no dataset available that comprises electrical signals as well as the full set of ambient conditions we consider in this work. As a result of this shortcoming of published datasets, it was necessary to run our own data collection campaign. We have decided to design a collection system for both electrical and ambient sensor data and use it to collect a dataset for the data analysis we conduct in
Section 4. We describe our rationales behind the design of the system as well as the data preprocessing steps we apply in the following subsections.
3.1. Selection of Appliances
As we aim for a generalizable evaluation of device types and their emissions of non-electrical signals, the first decision to make is the selection of the set of appliances under consideration. Our goal is to determine a representative set of electrical devices, that will be operated in a controlled environment in order to collect the input dataset for all further analyses. To make an informed choice of devices, we have consulted studies on electrical appliance ownership worldwide [
25,
26,
27]. Through considering the appliance types reportedly owned by at least
of the households, we have been able to identify a set of 13 appliances that are present in many households in developed countries. Minor household devices are typically not part of the aforementioned surveys due to their large diversity and the negligible contributions to the monthly energy bill. Still, several use cases for their recognition in load data are conceivable, e.g., the identification of user activities that are tightly bound to the use of these devices. Accordingly, we have chosen eight additional devices related to cooking (e.g., a mini oven), personal hygiene (such as a hair dryer), and office activities (e.g., a printer). The full set of all 21 appliances under consideration is provided in
Section 4.
3.2. Selection of Monitored Parameters
Having selected the appliances under consideration, their (expected) ambient influences need to be determined, in order to derive the sensors required to capture these parameters. For the evaluation of possible ambient influences we have extracted possible emissions from the devices’ data sheets, the general construction of devices (thus implicitly considering the laws of physics), and moreover inspected the devices under test manually during their operation. The complete list of all eight captured sensor parameters is given in
Table 2.
3.3. Data Collection System Design
Based on the derived set of requirements pertaining to the parameters to monitor, a collection system was prototypically designed and implemented. As it was our intention to collect the sensor measurements as close to the Test (DuT) as possible, most of the ambient sensors were wired up to an embedded microcontroller system, based on the PJRC Teensy 3.2 board. Its compact size offered the possibility to be mounted very close to the DuT. Sensors for the parameters of interest were interfaced to the board either via a digital two-wire (I
C) interface, or through analog signals that were converted into the digital domain by the microcontroller’s integrated 16-bit Analog-to-Digital Converter (ADC). The microcontroller system was programmed to use a periodic sampling schedule, and capture the considered parameters as synchronously as possible. Retrieved sensors values (e.g., digitized temperature readings) are scaled in order to report their data in SI units (e.g.,
). The data sampling rates are shown alongside the sensor types in
Table 2. They were selected such that the microcontroller system could perform data processing and transmit them (across its USB-serial connection) in real-time. The choice of 400
for vibration measurements aligns well with typical rotational speeds of the evaluated internal motors (e.g., internal motors of DVD and CD players typically spin at 200
to 570
).
The sensor platform was connected to a personal computer in charge of centrally collecting all sampled data, to which two more sensors were attached. First, electrical signals for both voltage and current are collected at 10 through a USB-interfaced PicoScope 4444 oscilloscope, equipped with a Hall effect current probe and a passive differential measurement voltage probe. Second, the collection of audio information and the determination of the most dominant frequency was accomplished through a connected USB microphone, sampling audio at . Temporal synchronization between the data recorded from the heterogeneous sensing modalities is ensured through inter-process signaling on the data collecting system. The raw data is collected into a file containing electrical information, an audio file, and a CSV file containing the ambient measurements.
3.4. Measurement Environment
With the exception of large and immobile appliances (washing machine, dryer, refrigerator), measurements were collected in the same ambient conditions of an office environment. The remaining measurements were collected in-situ, i.e., a kitchen (for the fridge) and the laundry room (for washing machine and dryer). The ambient sensors were placed directly on the DuT, oriented according to the expected maximum emission strength for each captured feature. As such, e.g., light sensors were placed in front of light emitting devices and magnetic flux density sensors were placed close to motors wherever possible. While such a placement may not be realistic for real-world deployments, note that the intention of our approach is to determine importance of such features in the first place, for which as detailed information as possible are required. An example of the sensor placement for the mini oven is shown in
Figure 1. Unless practically impossible, measurements were collected for full working cycles of devices. Each measurement was succeeded by a phase of appliance inactivity, in order to allow for sensor offset calibration. Data from devices with continuously variable power demand or without deterministic operation durations (e.g., computer monitors, lamps) were collected for two to five minutes. The only device measured for shorter duration was the food hand mixer, as it could only be operated for up to one minute before requiring a cool-off period, according to its user manual.
At least two operational cycles were recorded for each DuT in order to permit cross-checking the recorded sensor data. All measurements were manually checked for correctness before storage, in order to ensure consistency regarding the collected data. In the rare occasion of obviously inconsistent data, the data collection was repeated, and the faulty data trace discarded. For devices that could be operated in different states (such as the hair dryer or fan), measurements were collected for each of the states individually, and treated as the same device during the evaluations.
3.5. Data Postprocessing and Dataset Creation
For the feature evaluation presented in
Section 4, we only consider a simplified feature subset, consisting of either the maximum changes or a binary activation indication for the ambient features under evaluation. These simplified features were chosen because they could easily be determined locally on the low-power sensing device. Besides their fast computation, omitting raw data from collection also caters to user privacy protection [
28]. Additionally, findings based on such simple features are also reproducible on systems using higher sampling rates. All three points were vital to allow the results of this study to be used as a guideline for a wide range of practical systems, some of which are expected to only provide low data resolutions.
To compute these features, each data collection period
was succeeded by an offset calibration phase
. Both were designed to have approximately the same duration (i.e., 2–5
, cf.
Section 3.4). A clear delineation between both phases was easily possible due to the corresponding changes in electrical current consumption. Changes to the ambient humidity and temperature values were detected using additional temperature and humidity values, collected through a secondary measurement device in the room. During the manual evaluation of each trace, the steady-state value of each ambient sensor readings was determined for
, and used as the baseline value for the uninfluenced ambient readings. For each of the used sensor types, the difference between both values in
and the baseline is used as a feature in our analysis. In addition to the use of absolute values by which each parameter has changed, we also consider them in a binary form, according to the following rule set:
T, H, Ultraviolet (UV): A change was reported when the values recorded during differed by at least 1 ( , %, or UV step) from the values recorded during .
Infrared (IR): We observed the IR sensor’s readings to oscillate by a maximum of ± 5 ADC steps during . A change of the IR signal was thus logged when the average of the IR samples recorded during differed by at least 1 step from the highest non-singular value in .
Visible light (LDR): Readings collected from the Light Dependent Resistor (LDR) were determined to fluctuate by ± 15 ADC steps. A change was thus logged when collected measurements differed by at least 50 ADC steps from the average value during .
Magnetic flux density (B): To account for naturally occurring variations, a change in the magnetic flux density was detected if the mean values during the steady phase of and differed by at least .
Vibration (Vib): To minimize the impact of spurious vibration signals, the mean value seen during was required to differ by at least ± 15 ADC steps from readings seen during .
Audio information (Aud): The recorded audio files were checked manually to ensure that no undesired ambient noise would affect the evaluations. During this check it was furthermore verified that the device actually produced sound emissions. This approach was chosen because an algorithmic threshold solution would not have accounted for possible undesired sound collections from the collection environment.
We would like to note that supplementally collected electrical features (voltage, current, power) were not translated into a binary form, given that voltage readings remained constant and current samples always showed variations during a device’s operation. Instead, the electrical features used in this paper were chosen such that they represent electrical information already used during load monitoring, at a complexity similar to the considered ambient features. This enables a comparison between use cases only using ambient data and use cases combining ambient data with the already present electrical data. All electrical features are calculated during a 40 (i.e., two mains periods) long section of the measurement, selected such that the appliance’s current consumption is maximal, and requiring that its value is identical in both successive mains periods. Based on the data from this excerpt, the RMS voltage (U) and current (I) as well as the active power (P) are calculated.
Based on the collected and post-processed data, we have generated four variations of the dataset to serve as the foundation for our evaluations. All datasets contain a total of 144 traces. Their details are given as follows.
Ambient Parameters; binarized (Abin): Changes in the sensor measurements were evaluated in a binary way in order to evaluate if the corresponding ambient characteristic is influenced by the device’s activation. The resulting data consisted of a binary value for each sensor, which we use in our evaluation as indicators whether the DuT’s operation had an impact on the corresponding characteristic.
Ambient and Electrical Parameters; binarized (AEbin) is an extension to Abin that makes the (numerical) electrical readings (U, I, P) available to the evaluation system in addition to the (binary) indicators of changes in the ambient data.
Ambient Parameters; differences (AΔ): In contrast to the previously described Abin dataset, the maximum change is used now, i.e., the difference between the maximum sensor value during and the average of the values collected during . While most sensor values could be evaluated on the raw data, the vibration and audio measurements where evaluated in the frequency spectrum. As such the measured time sequence was transformed into the frequency spectrum and the strongest frequency was chosen.
Ambient and Electrical Parameters; differences (AEΔ): Analogous to AEbin, the AEΔ dataset is comprised of the (numerical) values from AΔ in conjunction with the (numerical) values for the three electrical features.
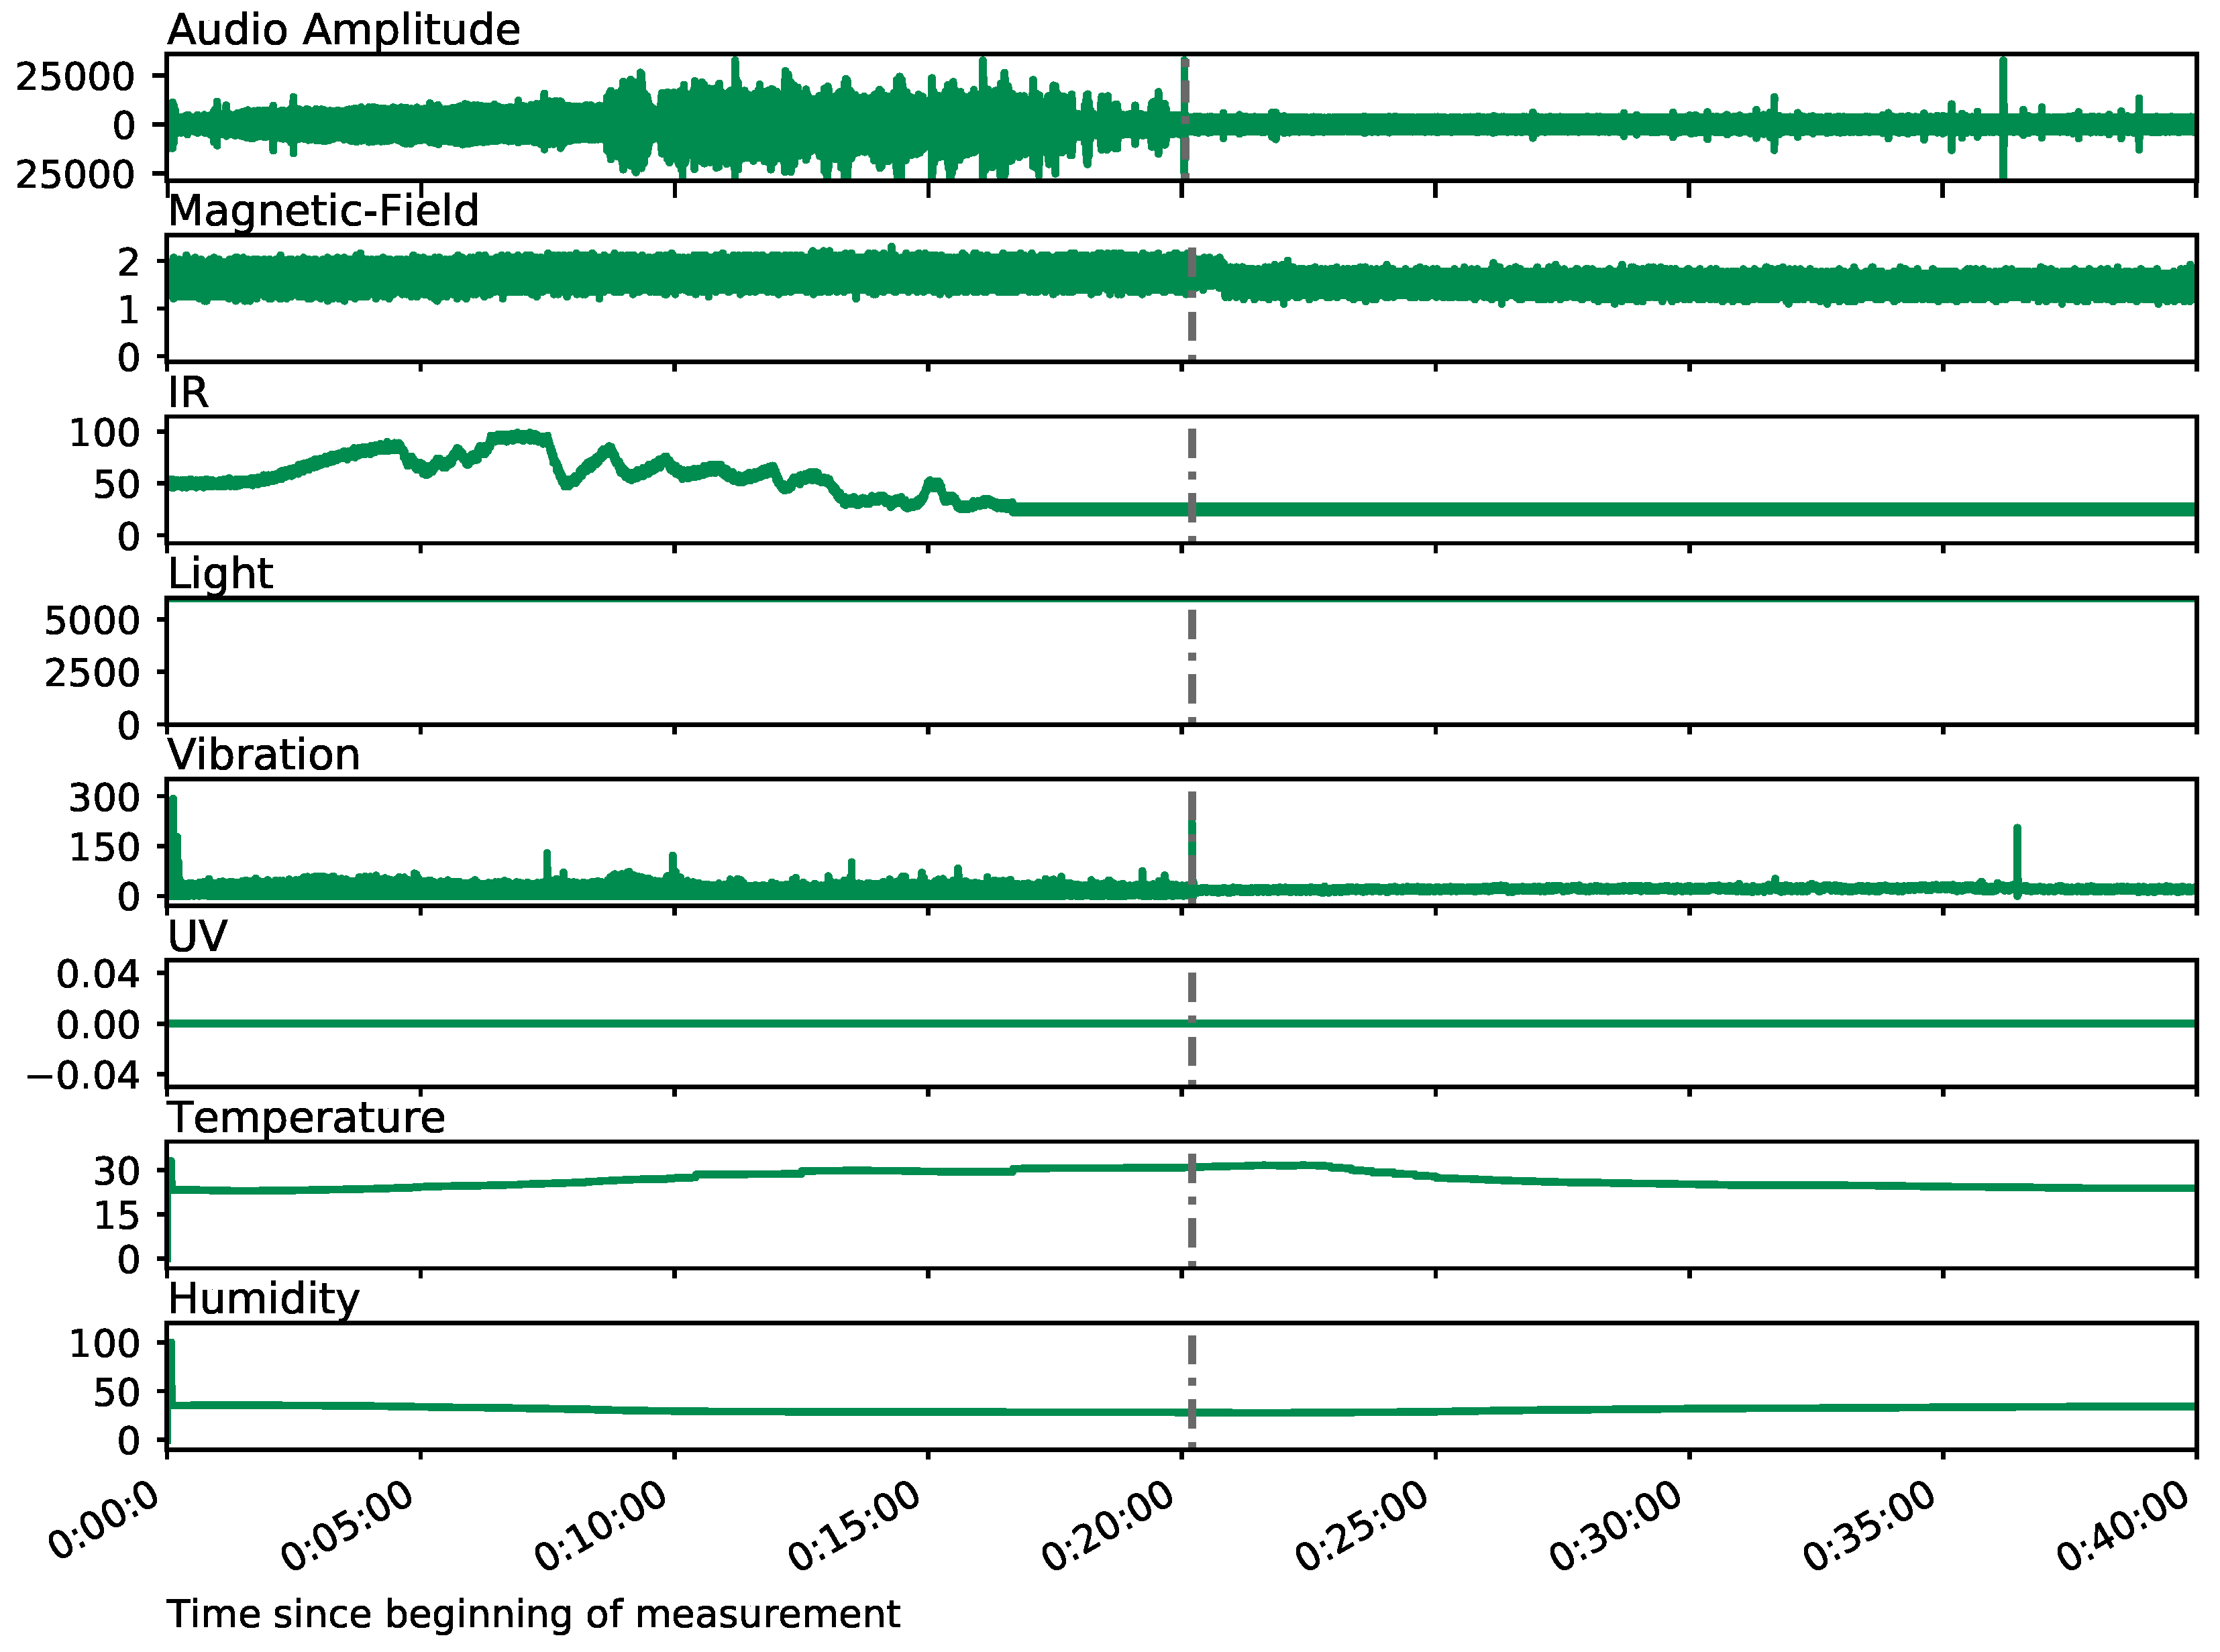
Let us consider an example of the data collection and processing sequence for the mini oven appliance as follows. The mini oven was equipped with the sensors according to
Figure 1. Sensor data was collected during the mini oven’s operation twice, with sufficient time between measurements to allow for a cooling down. Raw environment sensor data for one of the measurement run are plotted in
Figure 2. The average sensor values during
and from ambient measurements are then postprocessed to create the four aforementioned variants of the dataset. In the figure, the first 20 min of the sample, during which an electrical current flow was recorded, constitute
. The remaining about 20 min of the collected trace constitute
. The postprocessing is applied as described, a visualization of the process is included in
Figure 3. The resulting entries for the four datasets introduced above are computed. They are shown for reference in
Table 3.
4. Data Evaluation Concept
Our research objective is to assess how knowledge of the ambient conditions in an appliance’s environment can support the recognition of electrical appliances. A total of eleven attributes are available for analysis (cf.
Section 3): Eight ambient sensor attributes and three electrical quantities (voltage, current, and power). Instrumenting residential environments with sensing devices to capture all of these parameters, however, has several drawbacks. Besides the monetary costs for purchasing and installing sensors as well as ensuring their continuous operability, the continuous collection of data may be perceived as an intrusion into user privacy.
We hence conduct a methodological evaluation how each of the sensed attributes impact the appliance recognition rate, in order to determine the most information-rich subset of features.
We begin our evaluations with a determination of the importance of the contributions of each of the collected features when used to distinguish between the 21 appliance types listed in
Table 4. In subsequent evaluations, however, we also present three evaluations considering the categorization of appliances into classes, as well as appliance recognition results when the appliance class is known a priori. Through this set of evaluations, guidelines on the best-suited feature subsets for different appliance recognition scenarios are derived.
4.1. Determining the Feature Importance for Appliance Recognition and Classification
Determining the usefulness of features for classification purposes is a task that occurs across many research domains [
29]. Considering the appliance recognition and classification case of this study, the usefulness of features is considered to allow cost-efficient data collection through the exclusion of features that carry little or no information. Additionally, feature selection methods allow for the comparison of the usefulness of features or subsets of features for different use cases. Note that the usefulness of a feature is highly specific to a given use case. For our contribution, we have chosen appliance recognition as a use case, i.e., the classification of appliances by their types, depending on the values of the available feature set. Appliance recognition is a typical classification use case from the field of energy data analysis: Based on a set of features, the single most likely appliance type should be returned. As follows, we assess the importance of the features we have described in
Section 3.5 for the task at hand. Instead of conducting a single study on the general feature importance, however, we proceed in a more fine-grained fashion by considering several subsets of appliances (cf.
Table 4). This way, we seek to provide a more detailed picture of the feature relevance for different use cases.
4.2. Methodology for Determining the Distinctiveness of Features
For the evaluations we conduct below, two pieces of information are of primary interest:
A score to describe the importance of each feature, and
the most expressive subset of features, referred to as the optimal subset.
While the individual determination of a feature’s importance helps in assessing to what extent each feature can reduce the chance of misclassification, it generally cannot identify the feature combination that leads to the best classification result overall. In order to find such combinations, the determination of an optimal subset is required. This feature subset considers which features work best together, indicating an ideal set of features to be used for the considered use cases [
29]. When combined, both methods (individual feature relevance and best feature subset) allow for the development of better appliance monitoring systems.
4.2.1. Feature Importance
The usefulness of each feature is determined through the usage of a Random Forest of Trees. A decision tree is a structure which continuously divides the whole input data into subsets, such that the new subsets become more pure, i.e., features that lead to different output values become divisive elements [
30]. In other words, the features that enable the cleanest division of input data into categories are considered the most important. In contrast to a simple decision tree, the Random Forest of Trees generates multiple trees for randomly selected subspaces of the total feature space. Only a subset of the input sets of the feature values is evaluated in each tree, and the resulting trees are then combined by averaging the determined probabilities. This ultimately allows for greater classification accuracy improvements as compared to a singular decision tree [
30].
The Gini Impurity is defined as the rate of misclassification when an additional decision element is added to an existing decision tree [
31]. It is widely used for the feature selection in Random Forests of Trees in order to annotate each division of input data into new subsets with an importance score. Only the decision that yields the greatest reduction of the Gini impurity is maintained, which corresponds to a decrease in the probability of misclassification. The averaged Gini impurity scores are used as feature importance scores in our present study.
4.2.2. Optimal Feature Subset
To confirm that attained results can be generalized and allow to determine an optimal feature subset, we rely on the Recursive Feature Elimination [
29]. The algorithm starts with the full set of features and greedily excludes the least informative feature after each evaluation iteration. A ranking criterion is calculated for all features, and the feature with the lowest ranking criterion is eliminated. This process is repeated until the desired size of the feature subset is reached [
32]. If the size of the optimal subset is unknown in advance, a performance rating for the trained classifier results can be introduced. For this study, the accuracy was chosen as a performance rating for the trained classifier, such that the subset with the greatest overall accuracy result is chosen as the optimal feature subset.
4.2.3. Avoiding Overfitting
Small subsets of data can be prone to overfitting their input data, i.e., adapting to their characteristics too well. Cross-validation is a methodology which allows to counteract overfitting, as the available data of input features and known correct output classifications is not simply divided into disjunct subsets of training and testing data, but broken down into multiple smaller sets, so-called folds. The classifier is then trained in a leave-one-out manner: Each fold is once used as the test subset, while all other folds are used for training. The results of these training phases are averaged and given as the Cross-Validation Score (CVS) [
29,
32].
4.2.4. Implementation
All aforementioned feature selection methods were implemented in Python using the
scikit-learn library [
33]. The Recursive Feature Elimination is implemented using a Support Vector Classification and uses the accuracy as its performance rating. We specify the average accuracy in percent, with an accuracy of 100% indicating that all input samples could be correctly categorized. As the collected datasets are rather small, only a 2-fold cross-validation is conducted. The 2-fold validation is stratified to ensure that the class distributions between the test and training sets remain comparable to the full set of data.
4.3. Device Categorization
Let us next introduce the device categorization used during our evaluation studies. A complete overview of the appliances under consideration and their corresponding classes according to the three categorization approaches are given in
Table 4. Categorizing appliances by their classes allows us to not only run analyses on the entire dataset, but also on subsets of the data in which all devices share a commonality (e.g., an inductive load curve). For example, the device of type mini oven is a member of the Single-State devices class, belongs to the large consumers (classified by its power consumption), and is an ohmic appliance (due to the load type of its heating rods).
4.3.1. Categorization by Number of Operational States
Classifications by an appliance’s number of operational states can be found in works considering load monitoring [
2,
34,
35]. The typical device classes listed in the context of Non-Intrusive Load Monitoring (NILM), based on the complexity of their consumption patterns, are given as follows.
Single-State Devices: Also known as On/Off appliances, such devices exhibit one steady electrical power consumption value during their activity.
Multi-State Devices: These devices have multiple states of usually different power consumption levels, that occur in defined (usually sequential) patterns.
Infinite-State and/or Continuously Variable Devices: This class of devices exhibits constantly variable power consumption values.
We included this categorization for two reasons: First, different works in load monitoring have reported that Single-State appliances are often easier to disaggregate [
2]. Second, we expect greater differences in the importance of ambient features when appliances exhibit multiple operational states.
4.3.2. Categorization by Power and Energy Consumption
We wish to note at this point that NILM is not the only use case for energy data analysis. For example, applications like demand side management favor the availability of loads with a large energy consumption. As large energy consumers typically emit more excess heat and generate stronger magnetic fields, differences in the feature importance are likely to occur. Finding the optimal feature subset for such application cases is thus a prerequisite for the realization of such services. Hence, we classify the appliances under consideration by their power consumption, which we define as follows:
Large Consumer: Devices surpassing 1 of consumption or 10 per year consumption, which was determined based on the data sheet information concerning expected annual consumption.
Small Consumer: All electrical devices that do not count as large consumers.
4.3.3. Categorization by Load Type
Finally, we consider device classification according to their load type, according to the classification scheme proposed in [
34]. The load type is determined by the phase shift between mains voltage and an appliance’s current consumption as well as the presence of non-linear loads within devices. To allow to determine the load type for the devices in our evaluation, we followed the definition and examples given in [
34], and evaluated the devices’ data sheets.
Ohmic Consumers: Devices that have neither recognizable reactive power nor exhibit harmonics beyond the fundamental mains frequency
Inductive Consumers: Devices whose inductive component dominates their current intake (e.g., transformers).
Switched-Mode Power Supplies (SMPS): Devices with a large amount of harmonic content, whose characteristics may moreover vary depending on the currently exhibited power demand.
It needs to be noted that we excluded the “composite load” class proposed in [
34], as for our test only the washing machine and dryer could have fit the corresponding definition. Furthermore, the proposed “Capacitive Consumers” presented in [
34] do not have a representation in our set of devices, as they are not typically found in residential spaces.
4.4. Conducted Evaluations
We evaluate the ambient features with respect to three general use cases:
First and foremost, we assess how well the feature set allows for correctly determining the type of the appliance. This appliance recognition test is conducted for each of the datasets Abin, AΔ, AEbin, and AEΔ. The available features are provided at the input, and the system trained to correctly categorized them into the corresponding (known) output, i.e., the device type, reporting an overall accuracy score eventually.
We assess the correct recognition of an appliance’s device class. This evaluation group considers the usage of features calculated from ambient sensor data for the classification of devices according to their operation state, energy consumption, and load curve (as introduced in
Table 4).
We assess how well the system can distinguish between device type that are confirmed to belong to the same class. To this end, we train the system with data from all appliances of a single class only, and verify which features allow to distinguish between the remaining electrical devices best. Using the evaluations in this scenario, we seek to find out if and to which degree ambient information is informative if a device class is already known, but the devices inside the class are supposed to be distinguished.
5. Evaluation of the Feature Importance
As follows, we present the results of the different evaluation settings introduced in
Section 4.4. Unless noted otherwise, we present the Cross-Validation Score (CVS) and optimal feature subset for each of the four sets of input data (cf.
Section 3.5). The symbol notations for the sensed modalities introduced in
Table 2 are used in the results.
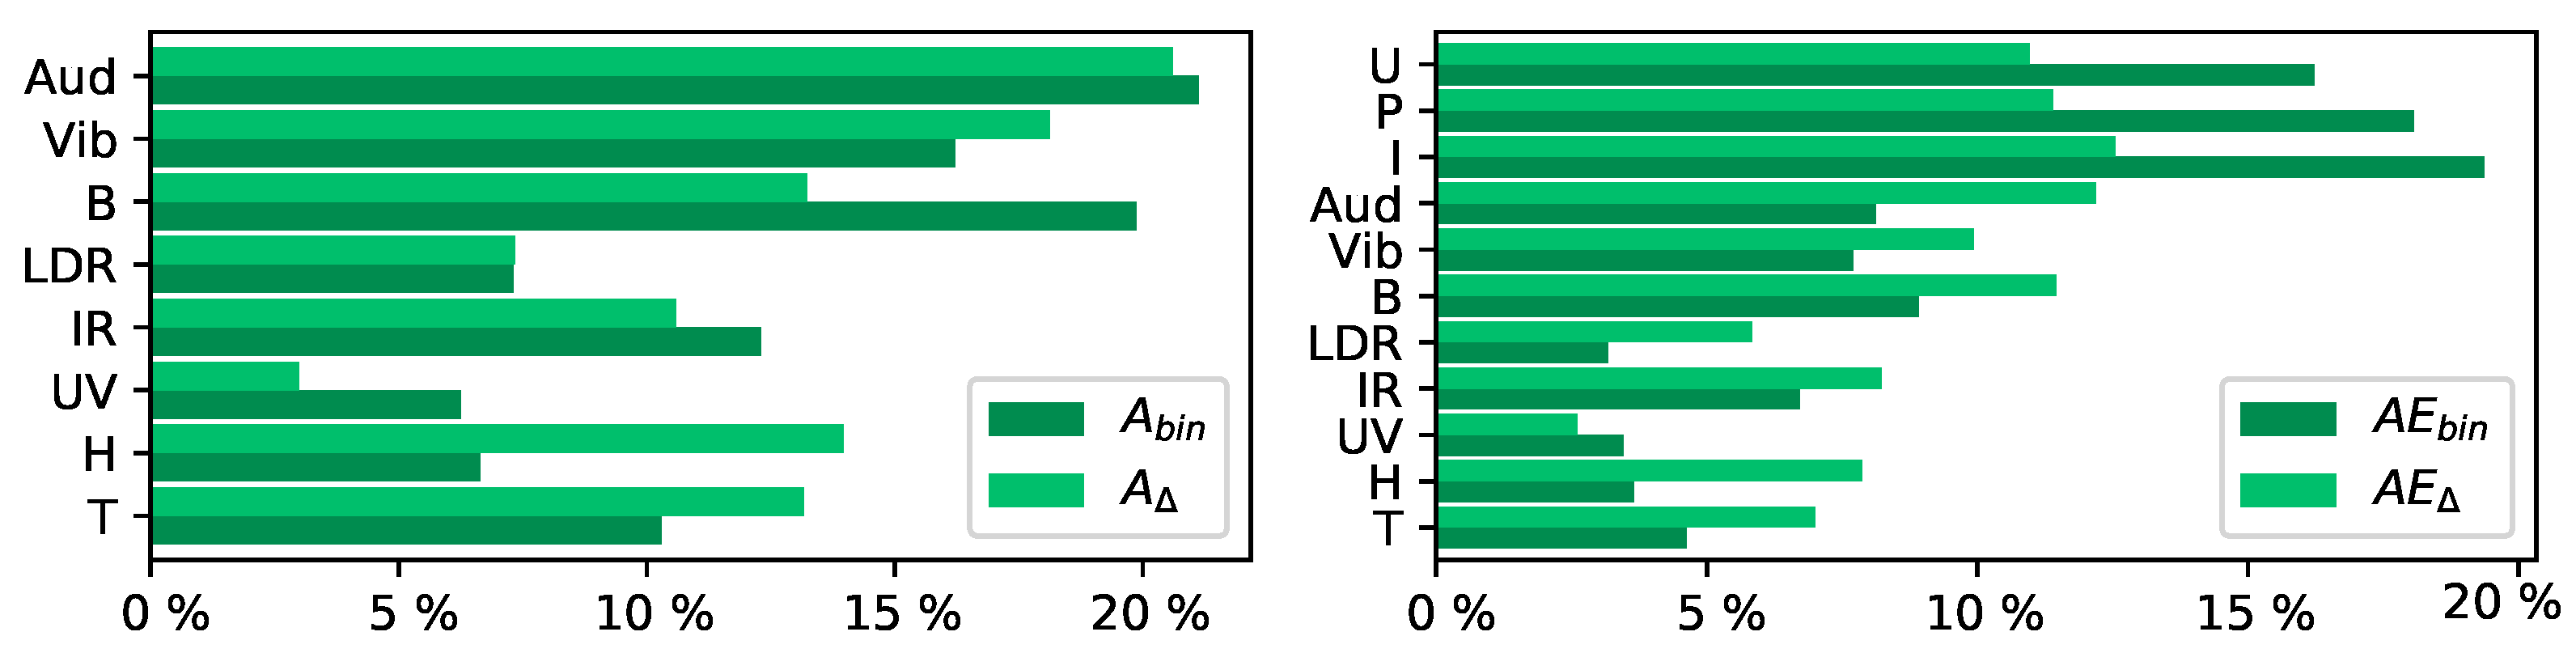
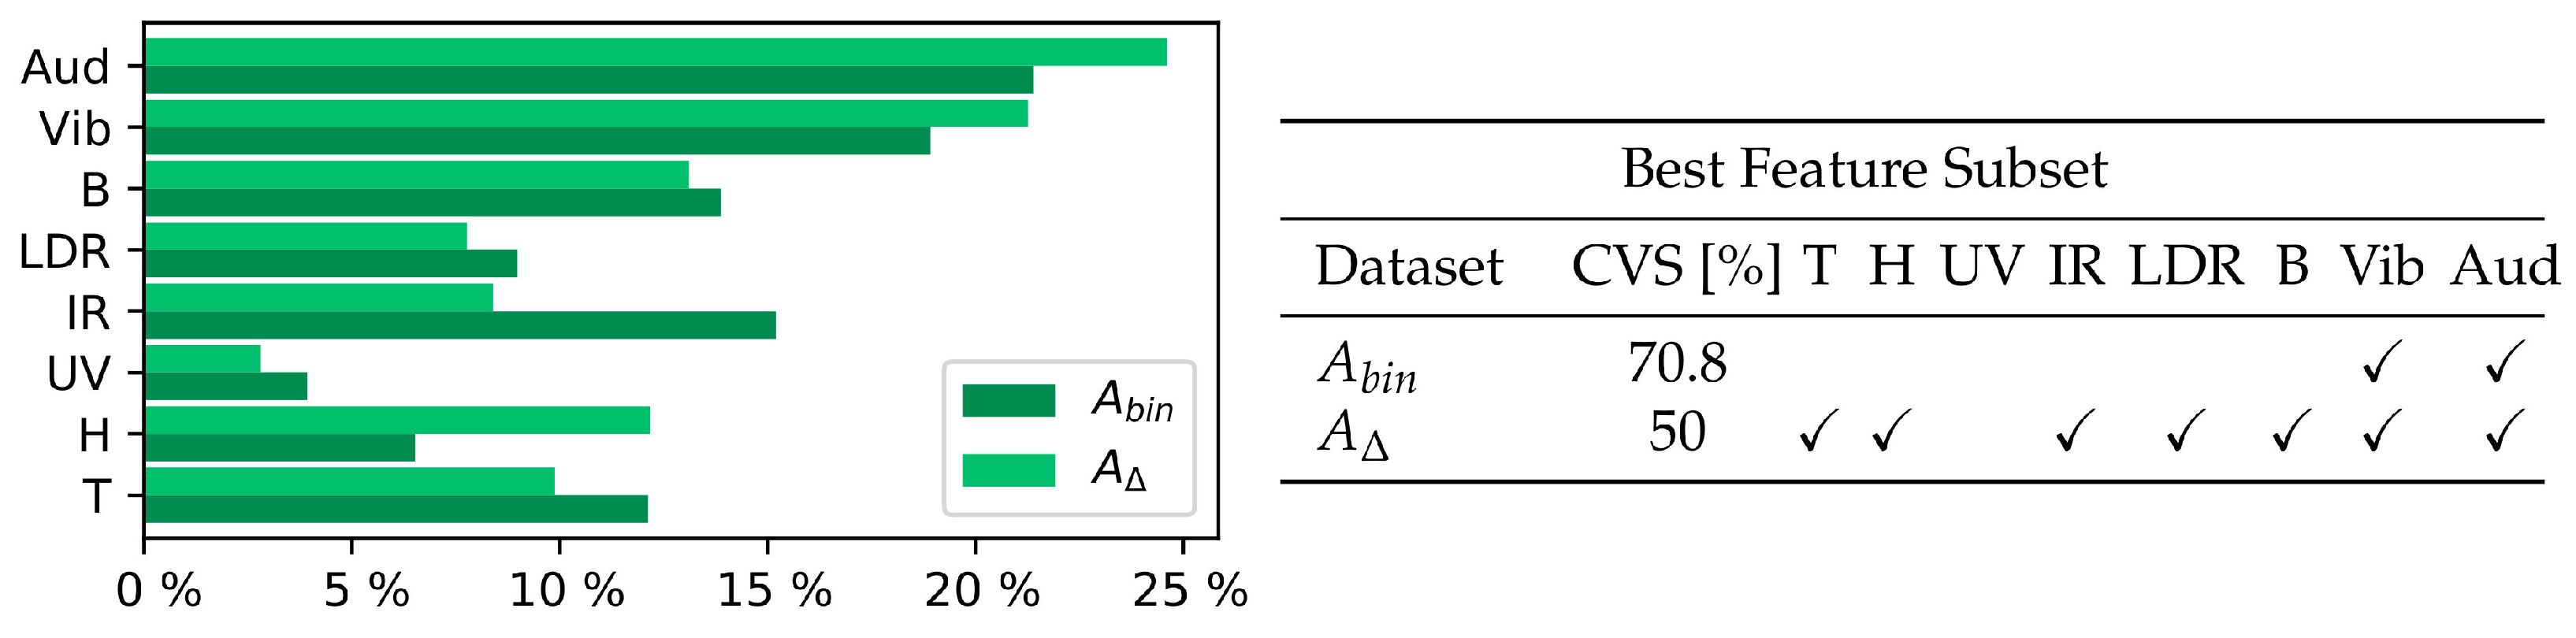
5.1. Evaluation Results for the Distinction between Devices on the Full Dataset
Our first evaluation was conducted on the whole generated datasets and considered the device types as output. The results for the Random Forest of Trees method are displayed in
Figure 4, whereas the results for the Recursive Feature Elimination are documented in
Table 5. The bar graphs indicate the calculated feature importances, wherein the y-axis denominates the feature, while the x-axis denominates the corresponding feature importance in percent.
The Random Forest of Trees method indicates a high usefulness for the vibrations and sound measurements. For the case of using binary change indicators, the magnetic flux density is deemed similarly important. The inclusion of electrical parameters slightly equalizes the importance levels, yet the addition of electrical parameters only leads to slight improvements of the results when compared to the use of ambient sensors alone. This result is confirmed through the Feature Elimination, which shows that the inclusion of electrical parameters allows for slightly improved Cross-Validation Scores, but the best feature subset does still require nearly all features. The UV and visible light emissions are only useful for a very small number of devices; the UV readings exclusively for lamps. While this indicates that the sensor type is not of interest for most evaluations, it furthermore shows that there is potential to improve lamp recognition by means of only a single sensor type. Furthermore, audio frequency features can be considered to be highly informative, as they are not only present for most devices, but distinctly different between them. The maximally observed sensor changes, as collected in AΔ and AEΔ, enable more fine-grained assessments of the impact of observed signal changes. While the subsequent measurements on a device did generally not exhibit strong variations, variations did exist between different devices of the same type. The differences in ambient influences between two devices of the same type can, however, be high. For example measurements from two different microwaves resulted in consistent dominant audio frequencies for each of the devices across measurements. Nonetheless, one microwave exhibited a dominant frequency of 172 , whereas the other had a dominant frequency of 344 . This indicates that setups evaluating ambient data need to consider the similarity of devices of the same type and if multiple devices of the same type are present. Such findings must be considered during training, as they indicate that training done on one household may not be transferable to other environments.
5.2. Evaluation Results for Device Categories
The following evaluations were conducted such that, based on the ambient measurements, each DuT was classified into its corresponding class for each categorization presented in
Section 4.3. Each presented evaluation provides the feature importance considering the Random Forest of Trees method and the optimal feature subset determined through the Recursive Feature Elimination, as well as the CVS achieved with the optimal subset.
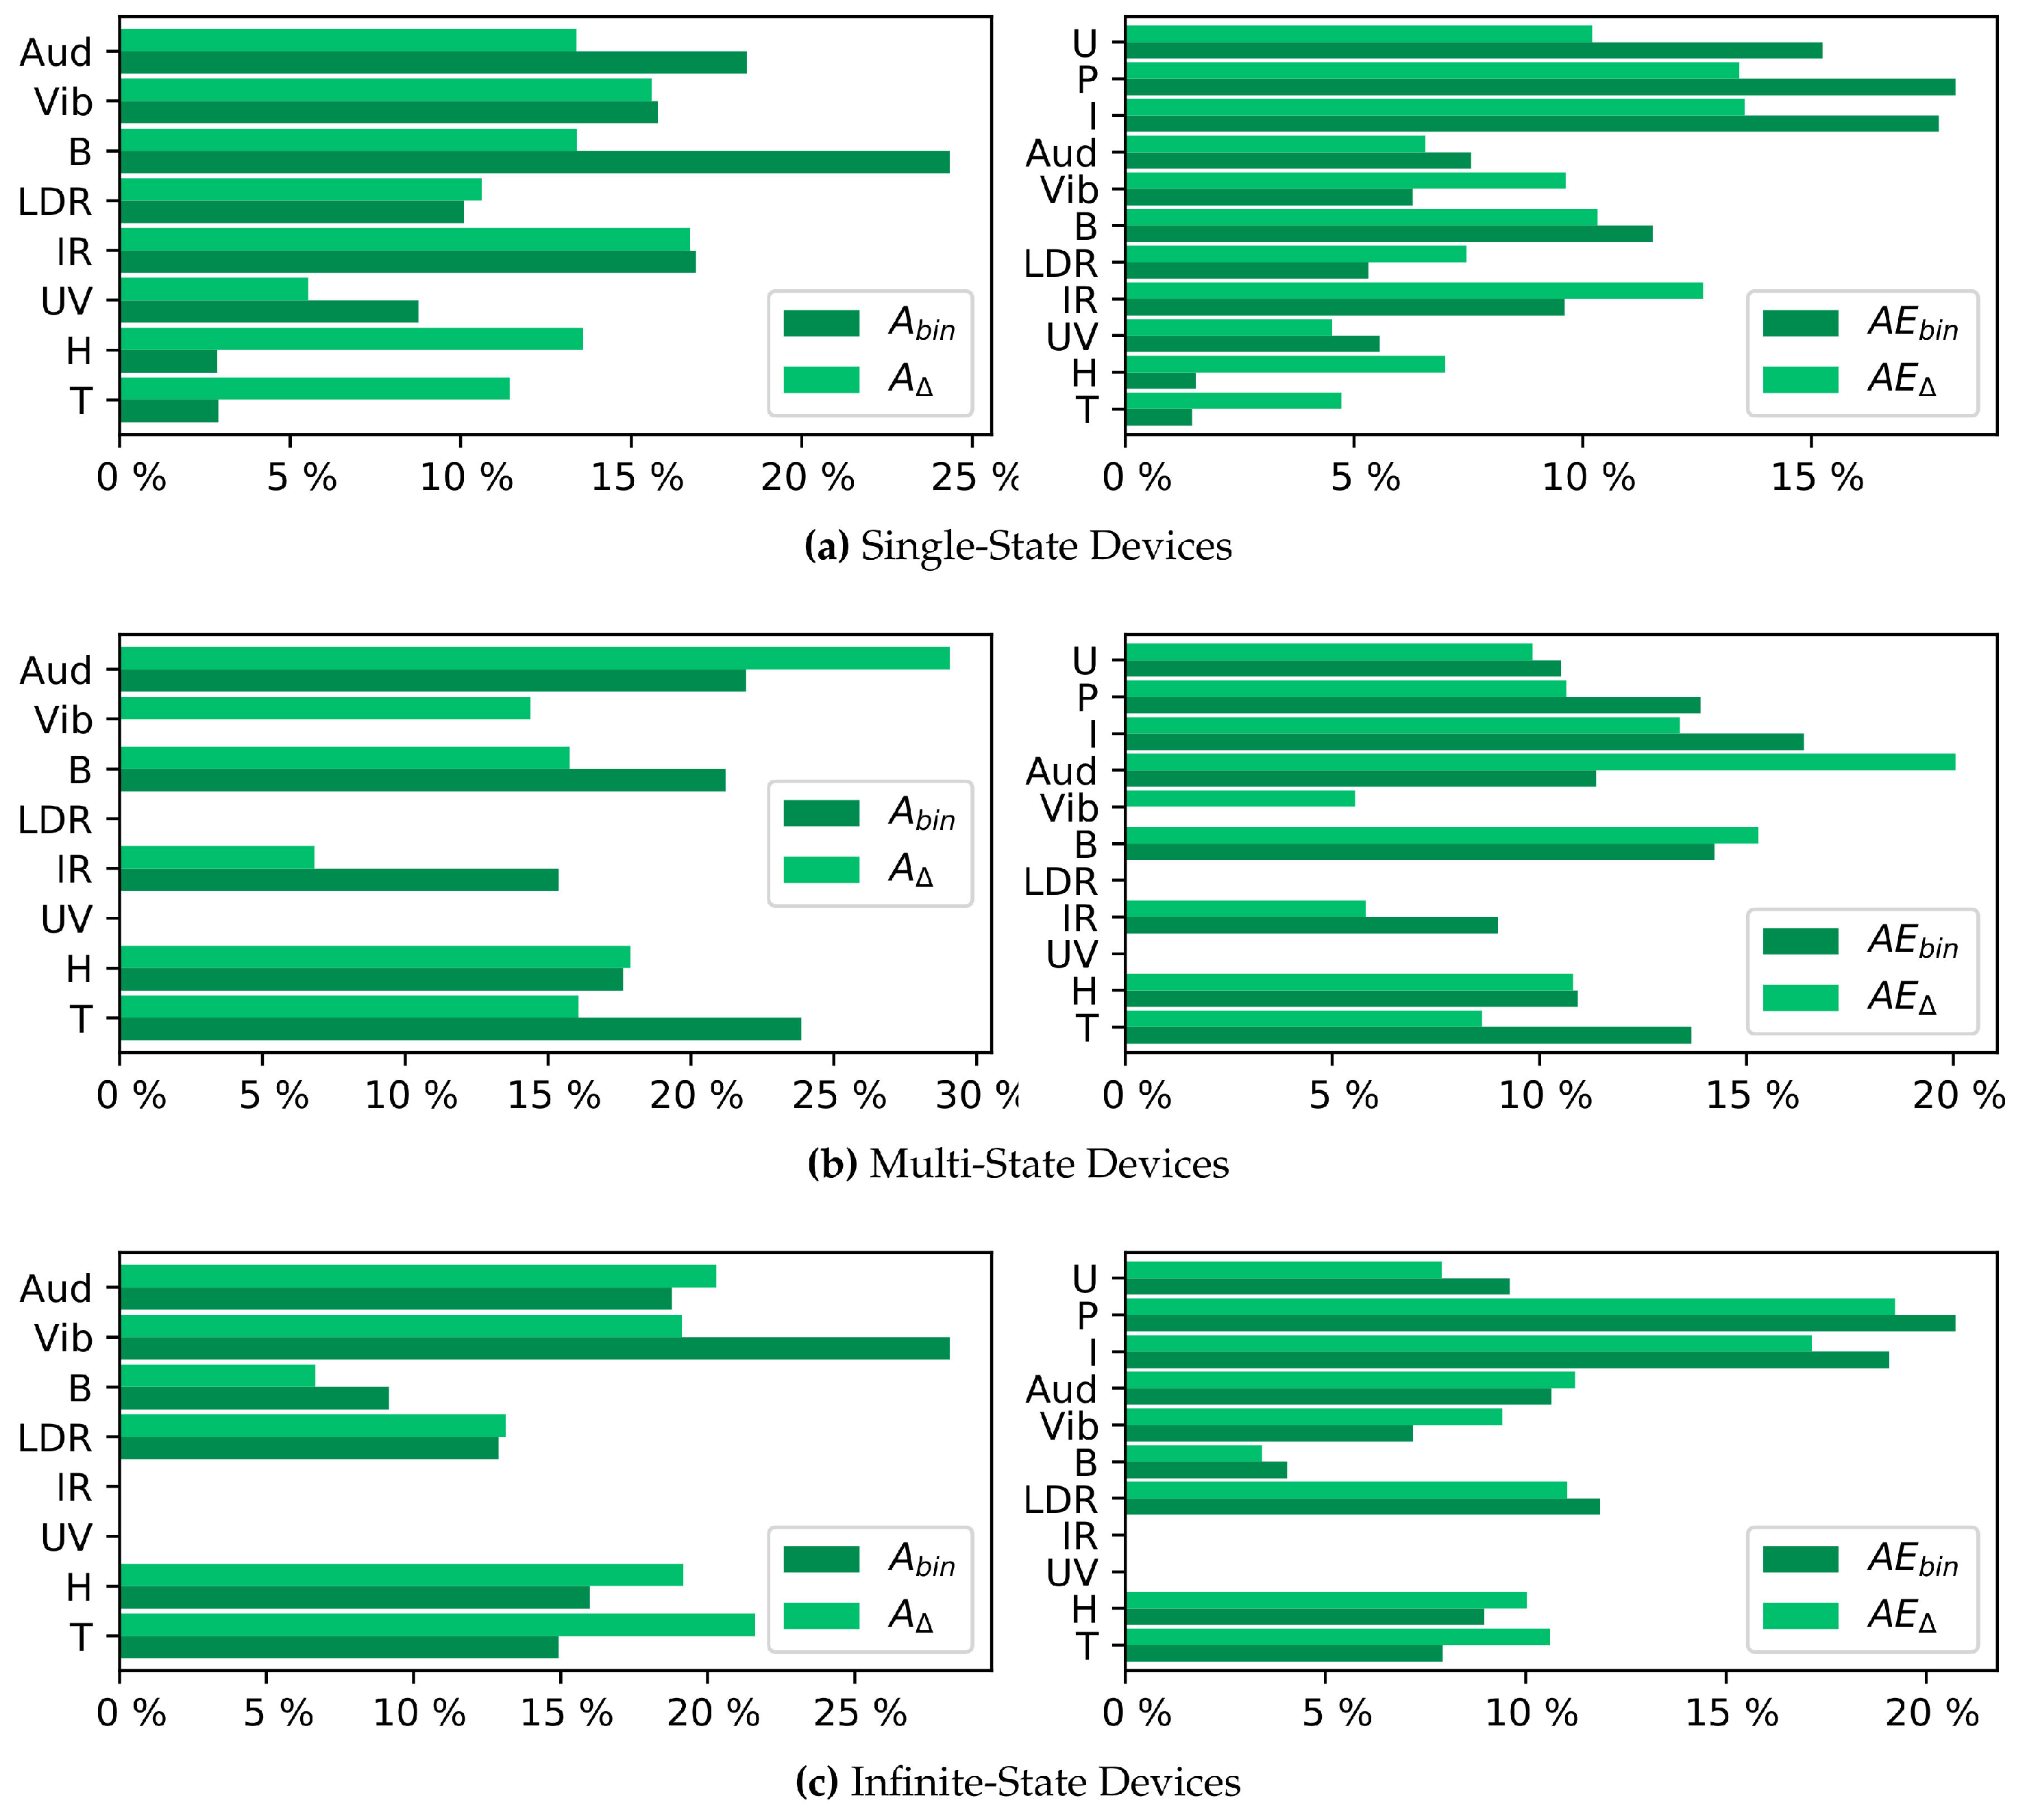
5.2.1. Classification According to the Number of States
In this evaluation each measurement was classified as belonging to either a Single-State, Multi-State or Infinite-State appliance. The results are listed in
Figure 5. Both evaluated algorithms show a high importance of audio and vibration features for the classification into Single-State, Multi-State and Infinite-State Appliances. The binary evaluation achieves a better Cross-Validation Score, indicating that the simple presence of sound or vibrations could provide relevant contextual information for this classification. However, both CVS values are low, such that a classification based on the ambient features alone may not be fruitful.
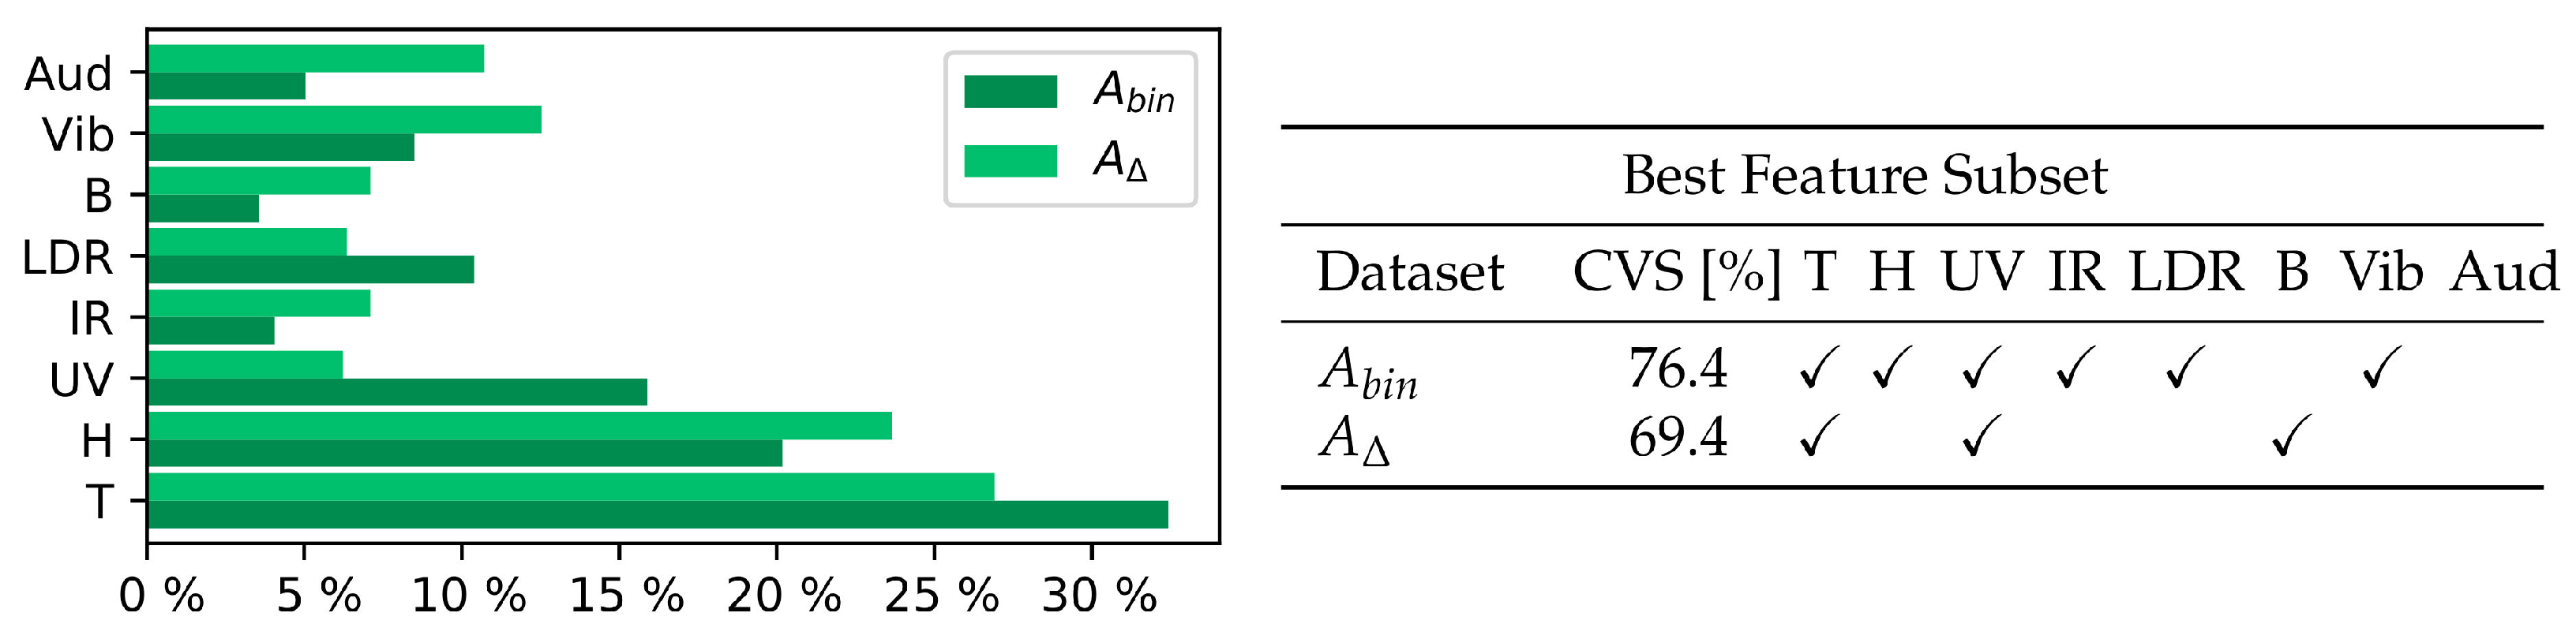
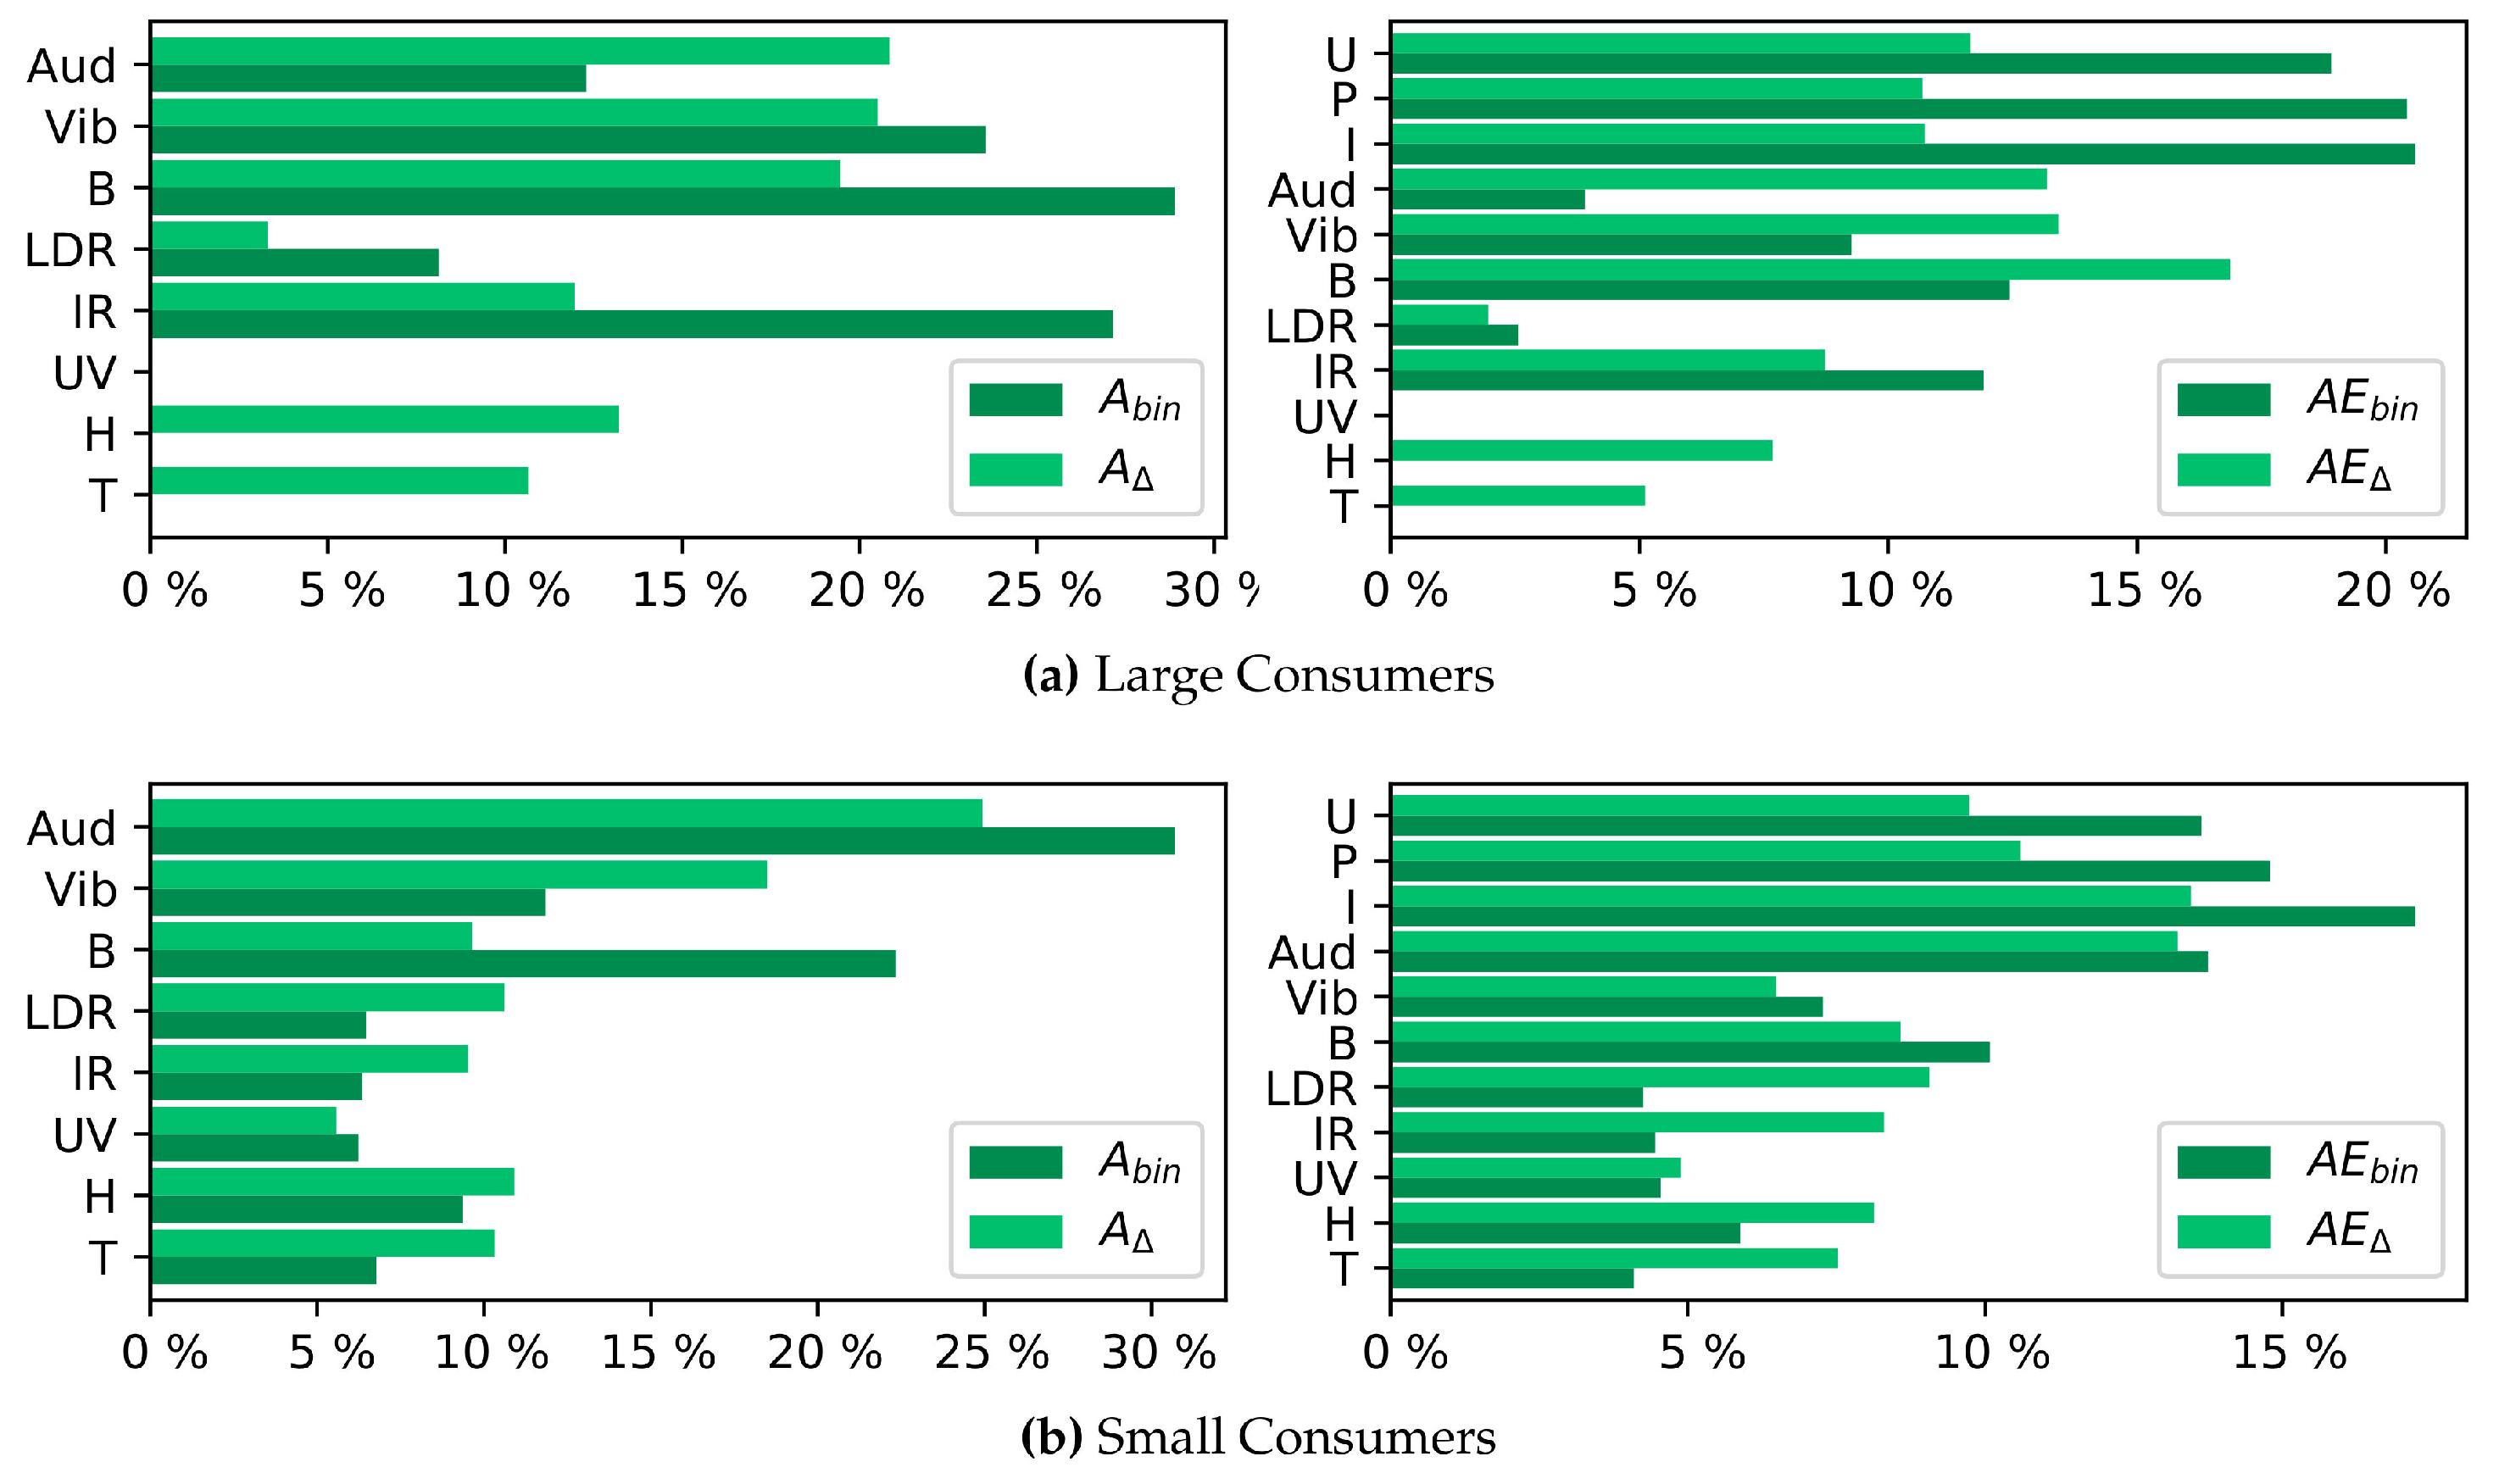
5.2.2. Classification According to Electrical Power Consumption
This evaluation considers the feature usefulness to determine if a set of ambient measurements belongs to a large consumer or small consumer appliance. Its results are given in
Figure 6. The evaluation according to consumption ranks the temperature and humidity sensors as most relevant for this distinction. This is unsurprising, as appliances designed to significantly heat or cool the environment generally exhibit a high power consumption. However, the Feature Elimination furthermore reveals that the UV radiation is a relevant feature for this distinction, which is reasonable considering that only the light installations under evaluation emitted UV radiation, all of which belong to the class of small consumers.
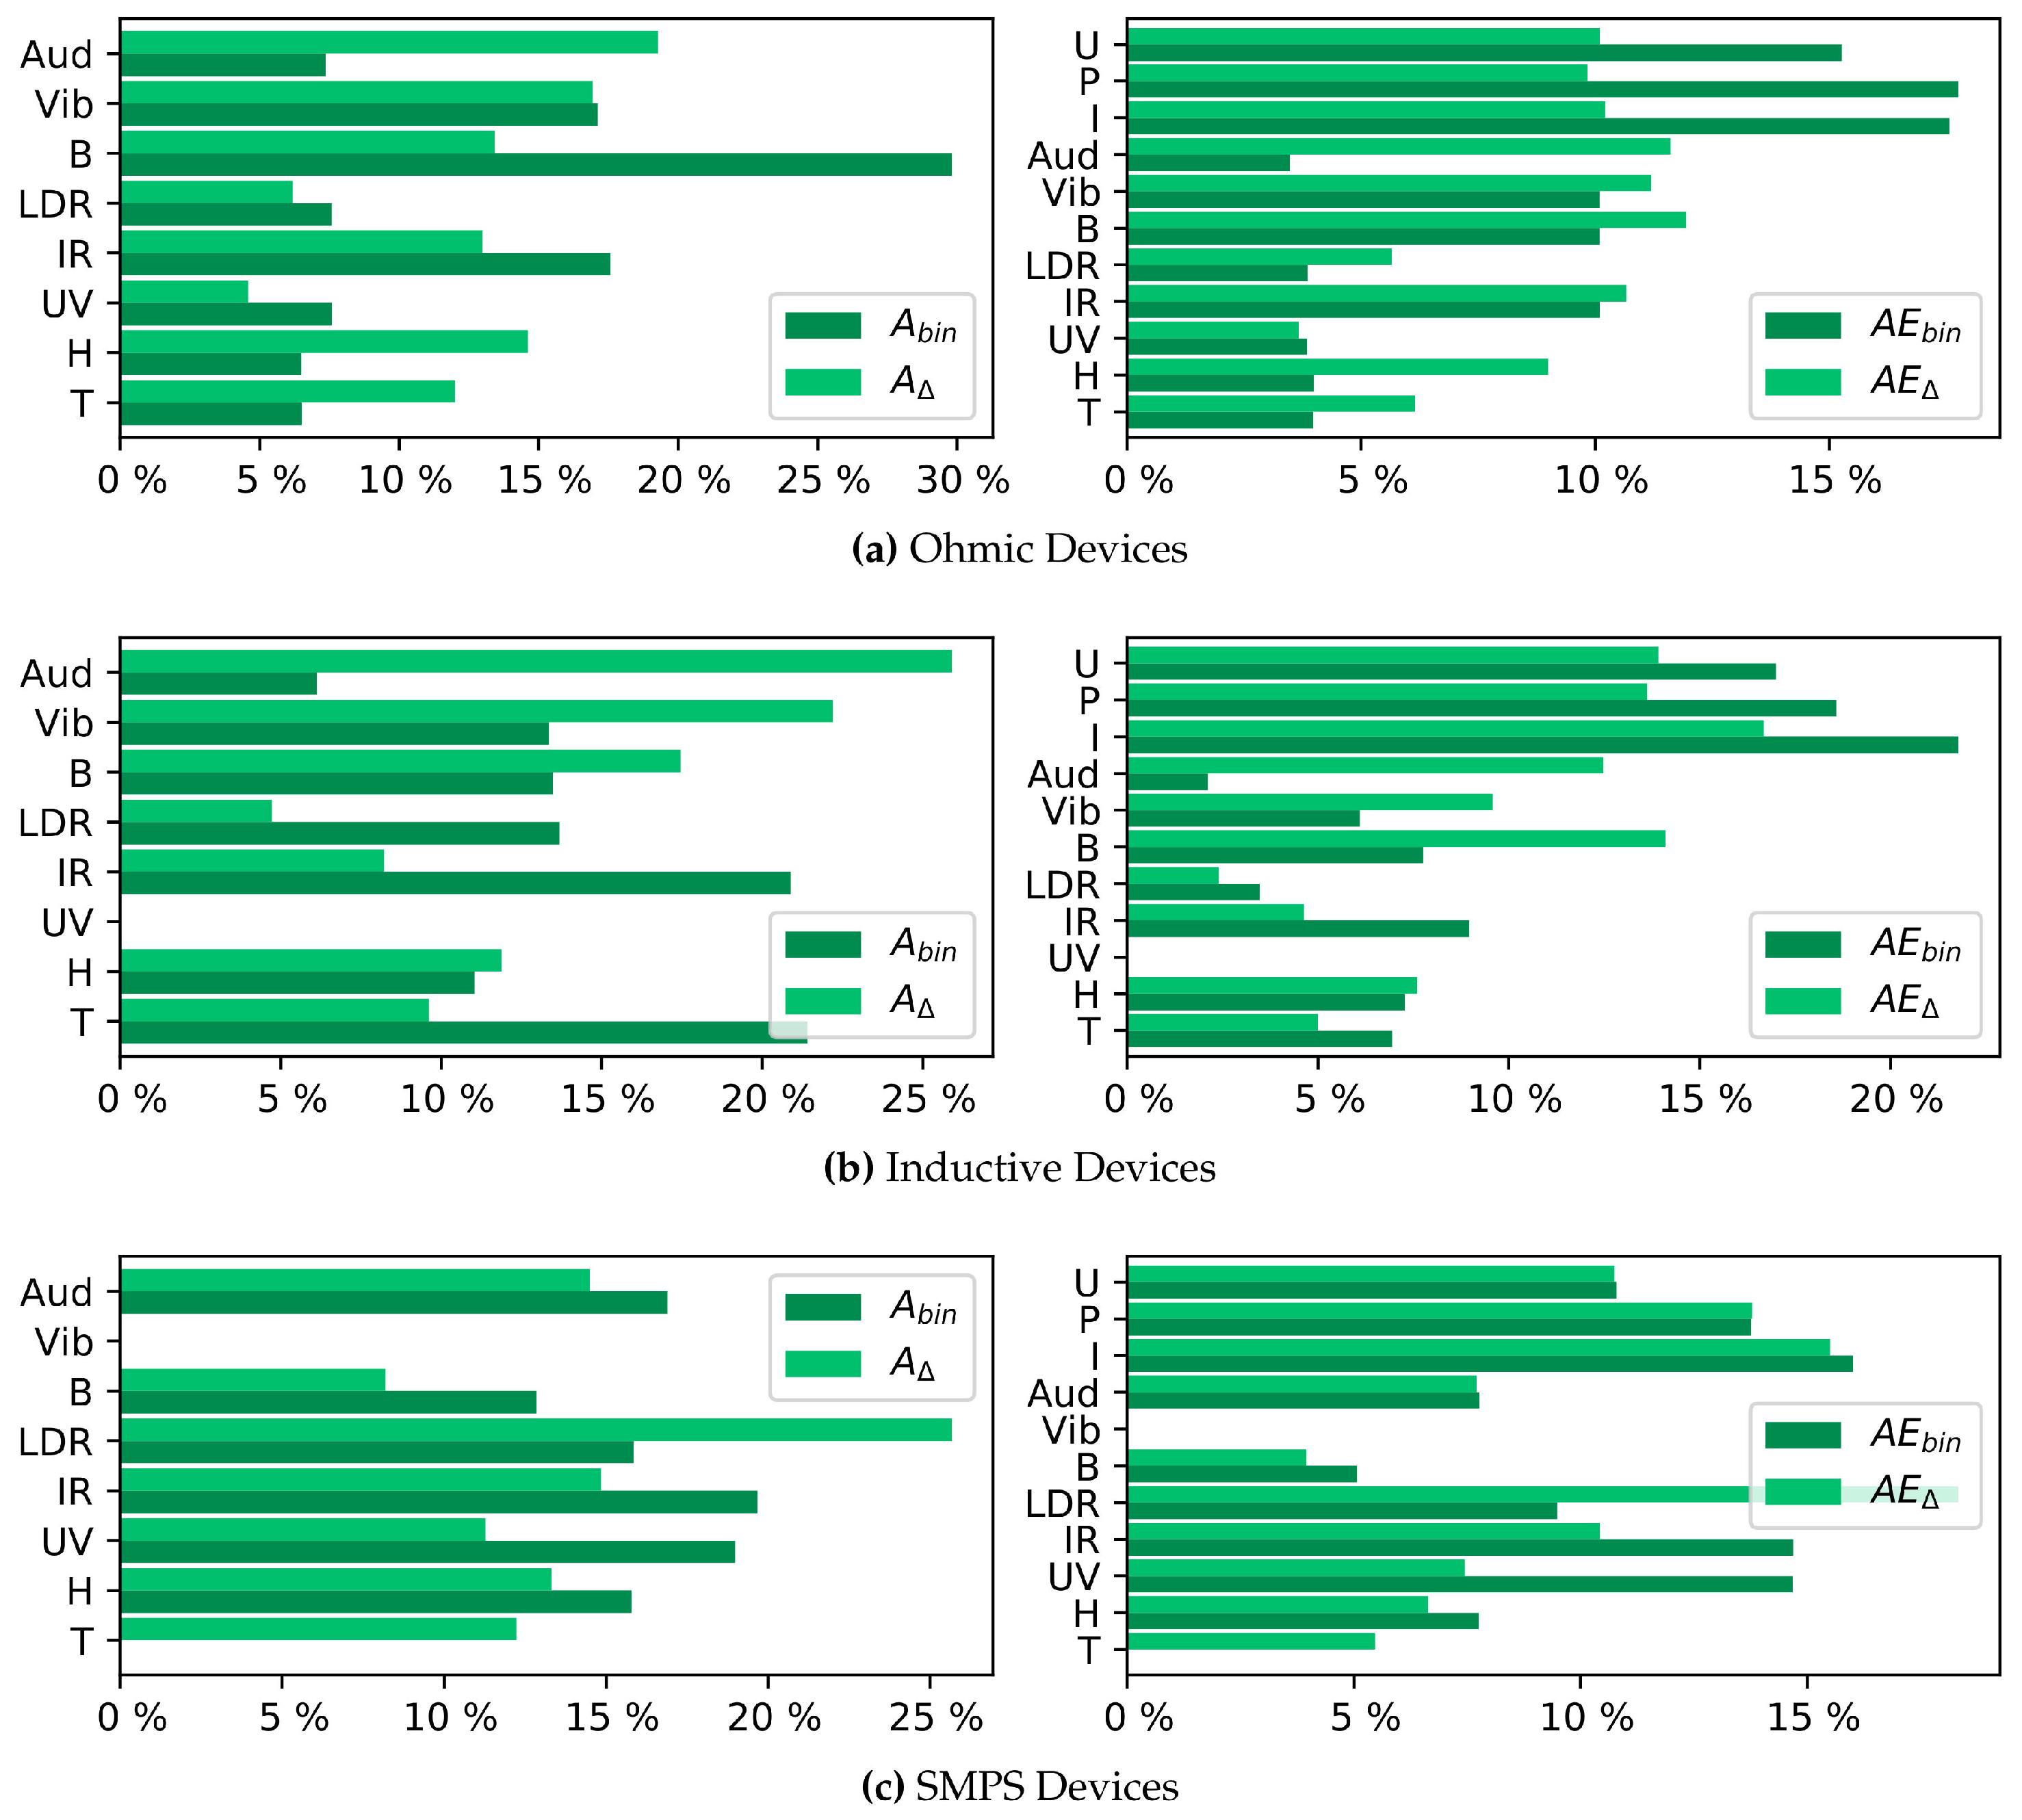
5.2.3. Classification According to Load Curves
The evaluation considering load types evaluates feature usefulness to determine if measurements were taken from an ohmic, inductive or SMPS appliance. The results are contained in
Figure 7. To classify devices according to their load curves, the Feature Elimination indicates that maximum changes are more effective. However, the results for the two applied methods differ considerably. This indicates that the combination of features is a lot more informative than singular features. The similar usefulness of most features determined through the Random Forest of Trees matches this finding. However, it needs to be remarked that the CVS for the binary evaluation is very low, indicating that this evaluation is not well-suited for a classification into load types.
5.3. Device Type Distinction within Different Device Catgetories
The following evaluations consider if and to which degree ambient information is informative if a device class is already known, but the instances of the device type within the given class shall be distinguished. Such an evaluation allows us to identify the device classes whose instances can be distinguished algorithmically. In contrast to the classification task considered in the previous section, the evaluations were not run on the full datasets with a target output from the set of device classes. Instead, we have run them on subsets of the full data, divided such that only one class of devices is part of the subset. The results are recorded in
Table 6 and
Table 7 and presented in the following subsections.
5.3.1. Distinguishing between Devices Sharing the Same Number of States
Recall that the device classes categorization used in this paper divides the set of considered appliances into Single-State, Multi-State and Infinite-State appliances. Again, we have computed the best feature subset within each of these categories, as well as ranking the feature importances. The Feature Elimination results can be found in
Table 6 and
Table 7, in the first to third row, while the results for the Random Forest of Trees are depicted in
Figure 8.
Concerning the recognition of device types from measurements of either only Single-State or only Multi-State Appliances, a rather large set of ambient measurements is required for best results. None of the features are particularly indicative of a specific appliance when considered on its own. However, the visible light and UV radiation are not present in Multi-State appliances, as none of the considered Multi-State devices emitted light. The distinction of Infinite-State devices differs as their distinction reaches the maximal Cross-Validation Score, in the case of maximum change evaluations, with a small dataset which only contains changes in temperature, humidity, and vibration. Sound emissions were identified as similarly important through the Random Forest of Trees method. The inclusion of electrical features was found to be useful for all three intra-category distinctions (as visible in the columns on the right-hand side of the tables).
5.3.2. Distinguishing between Devices of the Same Consumption Class
For the following evaluations, the datasets of ambient features were divided, such as to create datasets that only contain measurements from either large or small consumers. The resulting datasets were evaluated to assess to what extent the device type of a measurement can be determined based on the data. The Feature Elimination results are documented in
Table 6 and
Table 7 in the fourth and fifth row, and the results for the Random Forest of Trees are visualized in
Figure 9.
Considering the large consumers (see
Table 4), most appliances include a heating or cooling element, and multiple of them a motor, all of which can be expected to generate magnetic fields, vibrations, and sounds. Accordingly, both feature selection methods identify the magnetic flux density, vibrations, and audio features as important. The presence of IR radiation is furthermore shown to be distinctive. Small consumers do show low Cross-Validation Scores when only considering the presence of emissions, however maximum change evaluation scores indicate adequate results. Two findings are of special interest: First, the maximum change evaluation reaches better Cross-Validation Scores for feature subsets only including ambient features. Additionally, the feature subsets are quite large, but the majority of sensors is present for the recognition of only small and for the recognition of only large consumers.
5.3.3. Distinguishing between Devices of the Same Load Type
To allow to evaluate the usefulness of ambient feature information for appliance recognition for appliances belonging to a certain load type, the whole datasets were split to only contain measurements of devices belonging to one load type and than evaluated such that for each measurement the device type should be distinguished. The Feature Elimination results are documented in
Table 6 and
Table 7 in the sixth to ninth row, whereas the results for the Random Forest of Trees are depicted in
Figure 10.
While the intra-class distinction for inductive and SMPS devices generates small optimal feature subsets for AEΔ with three or less features, the distinction of ohmic appliances always requires bigger subsets. While acknowledge that our results for SMPS might be potentially biased, given that many of these devices were emitting light and thus the great importance of the LDR is not surprising. Still, the differences between ohmic and inductive appliances indicate that systems using features best-suited for ohmic devices could gain additional information to ease the distinction of inductive devices with low additional data requirements.
5.4. Interpretation and Discussion
We evaluated a set of features calculated from ambient sensor readings considering their usefulness and importances for different decision scenarios. All selected and evaluated features were shown to be relevant for at least one of the considered evaluations. However, the UV radiation was found to ease the distinction of different lamps, but could not be detected for any other appliance. Accordingly, its usefulness is restricted to scenarios involving such appliances.
To enable further consideration of the usefulness of individual features, we have accumulated how often each feature was part of an optimal feature subset. The sums are displayed in
Table 8 and reconfirm the restricted usage potentials for the UV measurements. It can be furthermore seen that the audio and vibration data have an overall high importance, and were marked especially useful if only binary ambient information is available (i.e., if operating devices leads to the presence of acoustic signals or vibrations). A comparably high usefulness can be attributed to the temperature, magnetic flux density, and humidity measurements; they are included in more than half of the optimal feature subsets. Their importance is even higher when only ambient features are available for evaluation. This evaluation of emissions and feature selection methods illustrates that multiple ambient features might be necessary to properly distinguish electrical devices.
Considering the usage of electrical and ambient features, our results show that the inclusion of electrical features allows to achieve distinction with less ambient sensors and generally achieves higher Cross-Validation Scores. This indicates that systems integrating ambient information in the decision process should consider electrical and ambient feature at the same time and not within different decision mechanisms.
During the evaluation of the usefulness for different scenarios, this work also considered the possibility to use ambient sensor data to assign device classes. While the classifications specific to the appliance’s internal workings, based on the number of appliance states (Single-State, Multi-State, or Infinite-State appliances) or based on the load curves (ohmic, inductive, or Switching Power Supplies), achieved low Cross-Validation Scores, the distinction between smaller and larger consumers could be shown to be feasible based on the easy-to-calculate features evaluated in this study from a small set of ambient sensors. Considering the classification according to load types or number of states, the use of binary features (indicating the change of an ambient parameter) is outperformed by the use of amplitude information from the audio and vibration sensors. As other studies have shown the feasible usage of more complex audio features (e.g., [
5,
14]), the additional information gain through such features could be investigated in future work to improve the results for the usage of ambient data for appliance classification even further.
Lastly, we conducted evaluations on two kinds of features: A binary change evaluation, and the evaluation of the maximum changes of sensor values. Considering the results, we have observed that binary features of ambient influences typically yield lower Cross-Validation Scores and often contain more features in the resulting optimal feature subsets. The usage of maximum change information resulted in a rise of 15.3 percentage points in the CVS, with a maximum improvement of nearly 30 percentage points for appliance recognition scenarios using only ambient information. A further 5.1 percentage points increase in CVS could be observed when including electrical information in appliance recognition scenarios.
We expect the results of this work to be a useful guideline for the creation of future energy data collection systems. Our careful analysis of the information gains of sensor types beyond the traditionally used electrical signals showcases the great potentials of using ambient information in conjunction with electrical data. We are convinced that the analyzed scenarios regarding certain classes of devices and the usefulness of ambient sensor types can help developers to advance and improve existing systems and algorithms based on our findings.
6. Conclusions and Outlook
In this work, we have conducted an evaluation of ambient sensor data and its possible uses in the context of electrical appliance recognition and load signature analysis in general. Based on two feature selection and ranking methods, we have demonstrated that sensor data for temperature, humidity, audio, vibrations, the magnetic flux density and IR radiation are useful for nearly any load monitoring use case. It could additionally be shown that a single measure for the change of ambient features during an appliance’s operation is often sufficient to reach decent Cross-Validation Scores, indicating that such a data collection with low resource usage can already improve load monitoring systems. By considering different evaluation scenarios, we were able to show that the combination of both electrical and ambient sensor data has been proven to provide the best benefits. We would like to reiterate at this point that our work is not primarily contributing to the field of NILM, i.e., the disaggregation of aggregate load data. Rather than that, we have methodologically determined the most information-rich sensor parameters that can improve energy data analysis methods (such as NILM) in a more general and algorithm-independent way.


