Article

Techno-Economic Feasibility Analysis of Grid-Connected Microgrid Design by Using a Modified Multi-Strategy Fusion Artificial Bee Colony Algorithm

1
Department of Electrical Engineering, Manipal University Jaipur, Janpur 303007, India
2
Department of Electronics and Computer Science, Koszalin University of Technology, 75-453 Koszalin, Poland
3
School of Engineering and Applied Science, Aston University, Birmingham B4 7ET, UK
*
Author to whom correspondence should be addressed.
Energies 2021, 14(1), 190; https://doi.org/10.3390/en14010190
Submission received: 27 October 2020 / Revised: 15 December 2020 / Accepted: 25 December 2020 / Published: 1 January 2021
(This article belongs to the Section F: Electrical Engineering)

Abstract

:
The present work investigates the techno-economic solution that can address the problem of rural electrification. To maintain a continuous power supply to this village area, a grid-connected microgrid system was designed that consists of solar photovoltaic (SPV) and battery energy storage systems (BESS). The recently introduced multi-strategy fusion artificial bee colony (MFABC) algorithm was hybridized with the simulated annealing approach and is referred to as the MFABC+ algorithm. This was employed to determine the optimal sizing of different components comprising the integrated system as well as to maximize the techno-economic objectives. For validation, the simulation results obtained by the MFABC+ algorithm are compared with the results obtained using HOMER software, the particle swarm optimization algorithms and the original MFABC algorithm. It was revealed that the MFABC+ algorithm has a better convergence rate and the potential ability to provide compromising results in comparison to these existing optimization tools. It was also discovered through the comprehensive evaluation that the proposed system has the potential capability to meet the electricity demand of the village for 24 × 7 at the lowest levelized cost of electricity.

1. Introduction

In recent years, energy consumption has been significantly affected by globalization and the rapid pace of industrialization. The growing world population is another factor that contributes to increased energy consumption. Traditionally, fossil fuels and other non-renewable energy sources were used to meet the majority of the energy demand of the population. However, the dependency on fossil fuels to meet energy demand grows with two serious issues i.e., their depletion and increasing levels of carbon dioxide into the atmosphere which adds to the global warming potential. The traditional power sources, such as coal, natural gas, and nuclear, and load demand, are connected to the grid across India. Although the aforementioned structure is convenient to meet energy demands at various places, rural areas face power availability challenges. Some of those rural areas only have power for limited hours and others have no power at all. Also, fossil fuels are not available near those rural areas. Therefore, building electrical infrastructure in these rural areas would be expensive and the low demands for energy generate other concerns [1].
Renewable energy sources (RESs) of electricity, therefore play a quintessential role in such areas because of the associated advantages such as their availability, low maintenance cost and negligible pollution to the environment. It was also estimated by the International Energy Agency (IEA) [2] that around 30% of the power would be available from the different RESs. India has an agrarian-based economy and rural areas are its backbone. In these areas, most of the populace is engaged in the agriculture sector. The electricity supply is necessary at the time of different agriculture activities such as water pumping, crop cutting, etc. This demand is in addition to the regular household demand. It was analyzed in one of the studies that around 18% of the rural population in India does not have access to the electricity that is regular and reliable at the same time [3]. Power cuts are one of the major issues in rural areas, although the aforementioned challenges can be met through the availability of RESs. The integration of renewable sources of energy is one such solution that can provide eco-friendly, cost-effective and continuous power supply to the rural areas [4,5]. However, they have inherent intermittent power generation and as such the desired reliability cannot be guaranteed. To cope up with this problem associated with RESs, integrated RES (IRES) microgrid is suggested. This system is modelled using a battery energy storage system (BESS), RESs and time-constrained grid. Some other relevant studies aiming to find the optimal sizing of the microgrid systems using hybrid optimization model for electric renewable (HOMER) software and metaheuristic techniques are presented in [6,7,8]. Other parameters such as Levelized cost of electricity (LCOE), renewable fraction (RF) and total net present cost (TNPC) were taken into consideration while carrying out the aforementioned studies.
Optimal sizing of different components in IRES microgrid systems and cost-effective solutions are obtained where grid extension is critical to manage [9,10]. Load profiles for the off-grid system are developed in [11]. HOMER software was adopted by many researchers to obtain reliable and cost-effective secure energy systems [12,13,14,15]. A study on microgrids for rural electrification is done in [16] and investigated the possibility of reducing the overall cost of electricity through the employability of RESs within a stand-alone microgrids. A hybrid energy system is proposed in [17] and optimal sizing of the components within the proposed hybrid energy systems is obtained for the non-electrified rural areas located in Uttarakhand, India. In addition, to finding out the optimal sizing of the different components, the investigation is also carried out to provide uninterrupted power supply at the lowest possible cost. A hybrid system for supplying electrical power in Namin, Ardabil, Iran is suggested in [18] considering fuel cell as one of its critical components. A genetic algorithm-based multi-objective optimization algorithm is proposed in [19] for analysis of the grid-independent hybrid energy system. Ramli et al. [20] carried out an economic analysis of a hybrid electrification system comprising solar photovoltaic (SPV) and diesel generator (DG). The proposed electrification hybrid system is analyzed with the aid of a tri-objective-based algorithm. Different objectives considered for this study are to reduce the life-cycle cost of the proposed hybrid system, the emissions from the hybrid system and also the total dump energy associated with the hybrid system, if any. Similarly, a study for hybrid system comprising of 30 kW photovoltaic system, 25 kW DG set, a 40 kW wind system and a storage system is carried out for one of the rural village areas situated in Sri Lanka [21].
Singh and Fernandez [22] employed a cuckoo search algorithm to find out the optimal sizing of the different components of a proposed hybrid system. In another study [23], the optimal sizing associated with the proposed off-grid system is determined using a linear programming model. This study developed an approach that consists of the monitoring of the battery dilapidation process. The electrical storage system is introduced in [24] with the objective to provide flexibility to the off-grid system. Various researchers proposed and developed different size optimization algorithms and also carried out the economic analysis for hybrid energy systems [25,26,27]. A review of size optimization techniques is presented for the microgrid systems in [28]. A grid-connected photovoltaic energy system for a dairy farm in Algeria was investigated for economic and technical requirements [29].
In India, rural electrification is plagued by a limited supply of electricity for a few hours of the day. Hence the major challenge lies into optimal designing of the microgrid system with respect to the annualized system cost that can meet the load demand for the area under consideration 24 × 7. Therefore, the main goal of the proposed work is to investigate the feasibility of an integrated renewable energy system to meet the electricity demand of a village. The proposed system is optimized to meet the electricity demand 24 × 7 and to find the lowest possible LCOE. Moreover, the present study also attempts to investigate an improvised version of the MFABC algorithm that may lead to a more precise result in fewer solution cycles. The reason for employing the new version of artificial bee colony optimization algorithm over the other algorithms such as particle swarm optimization, genetic algorithm, etc., is because of the involvement of lesser number of control variables. The main contributions of this study are listed below:
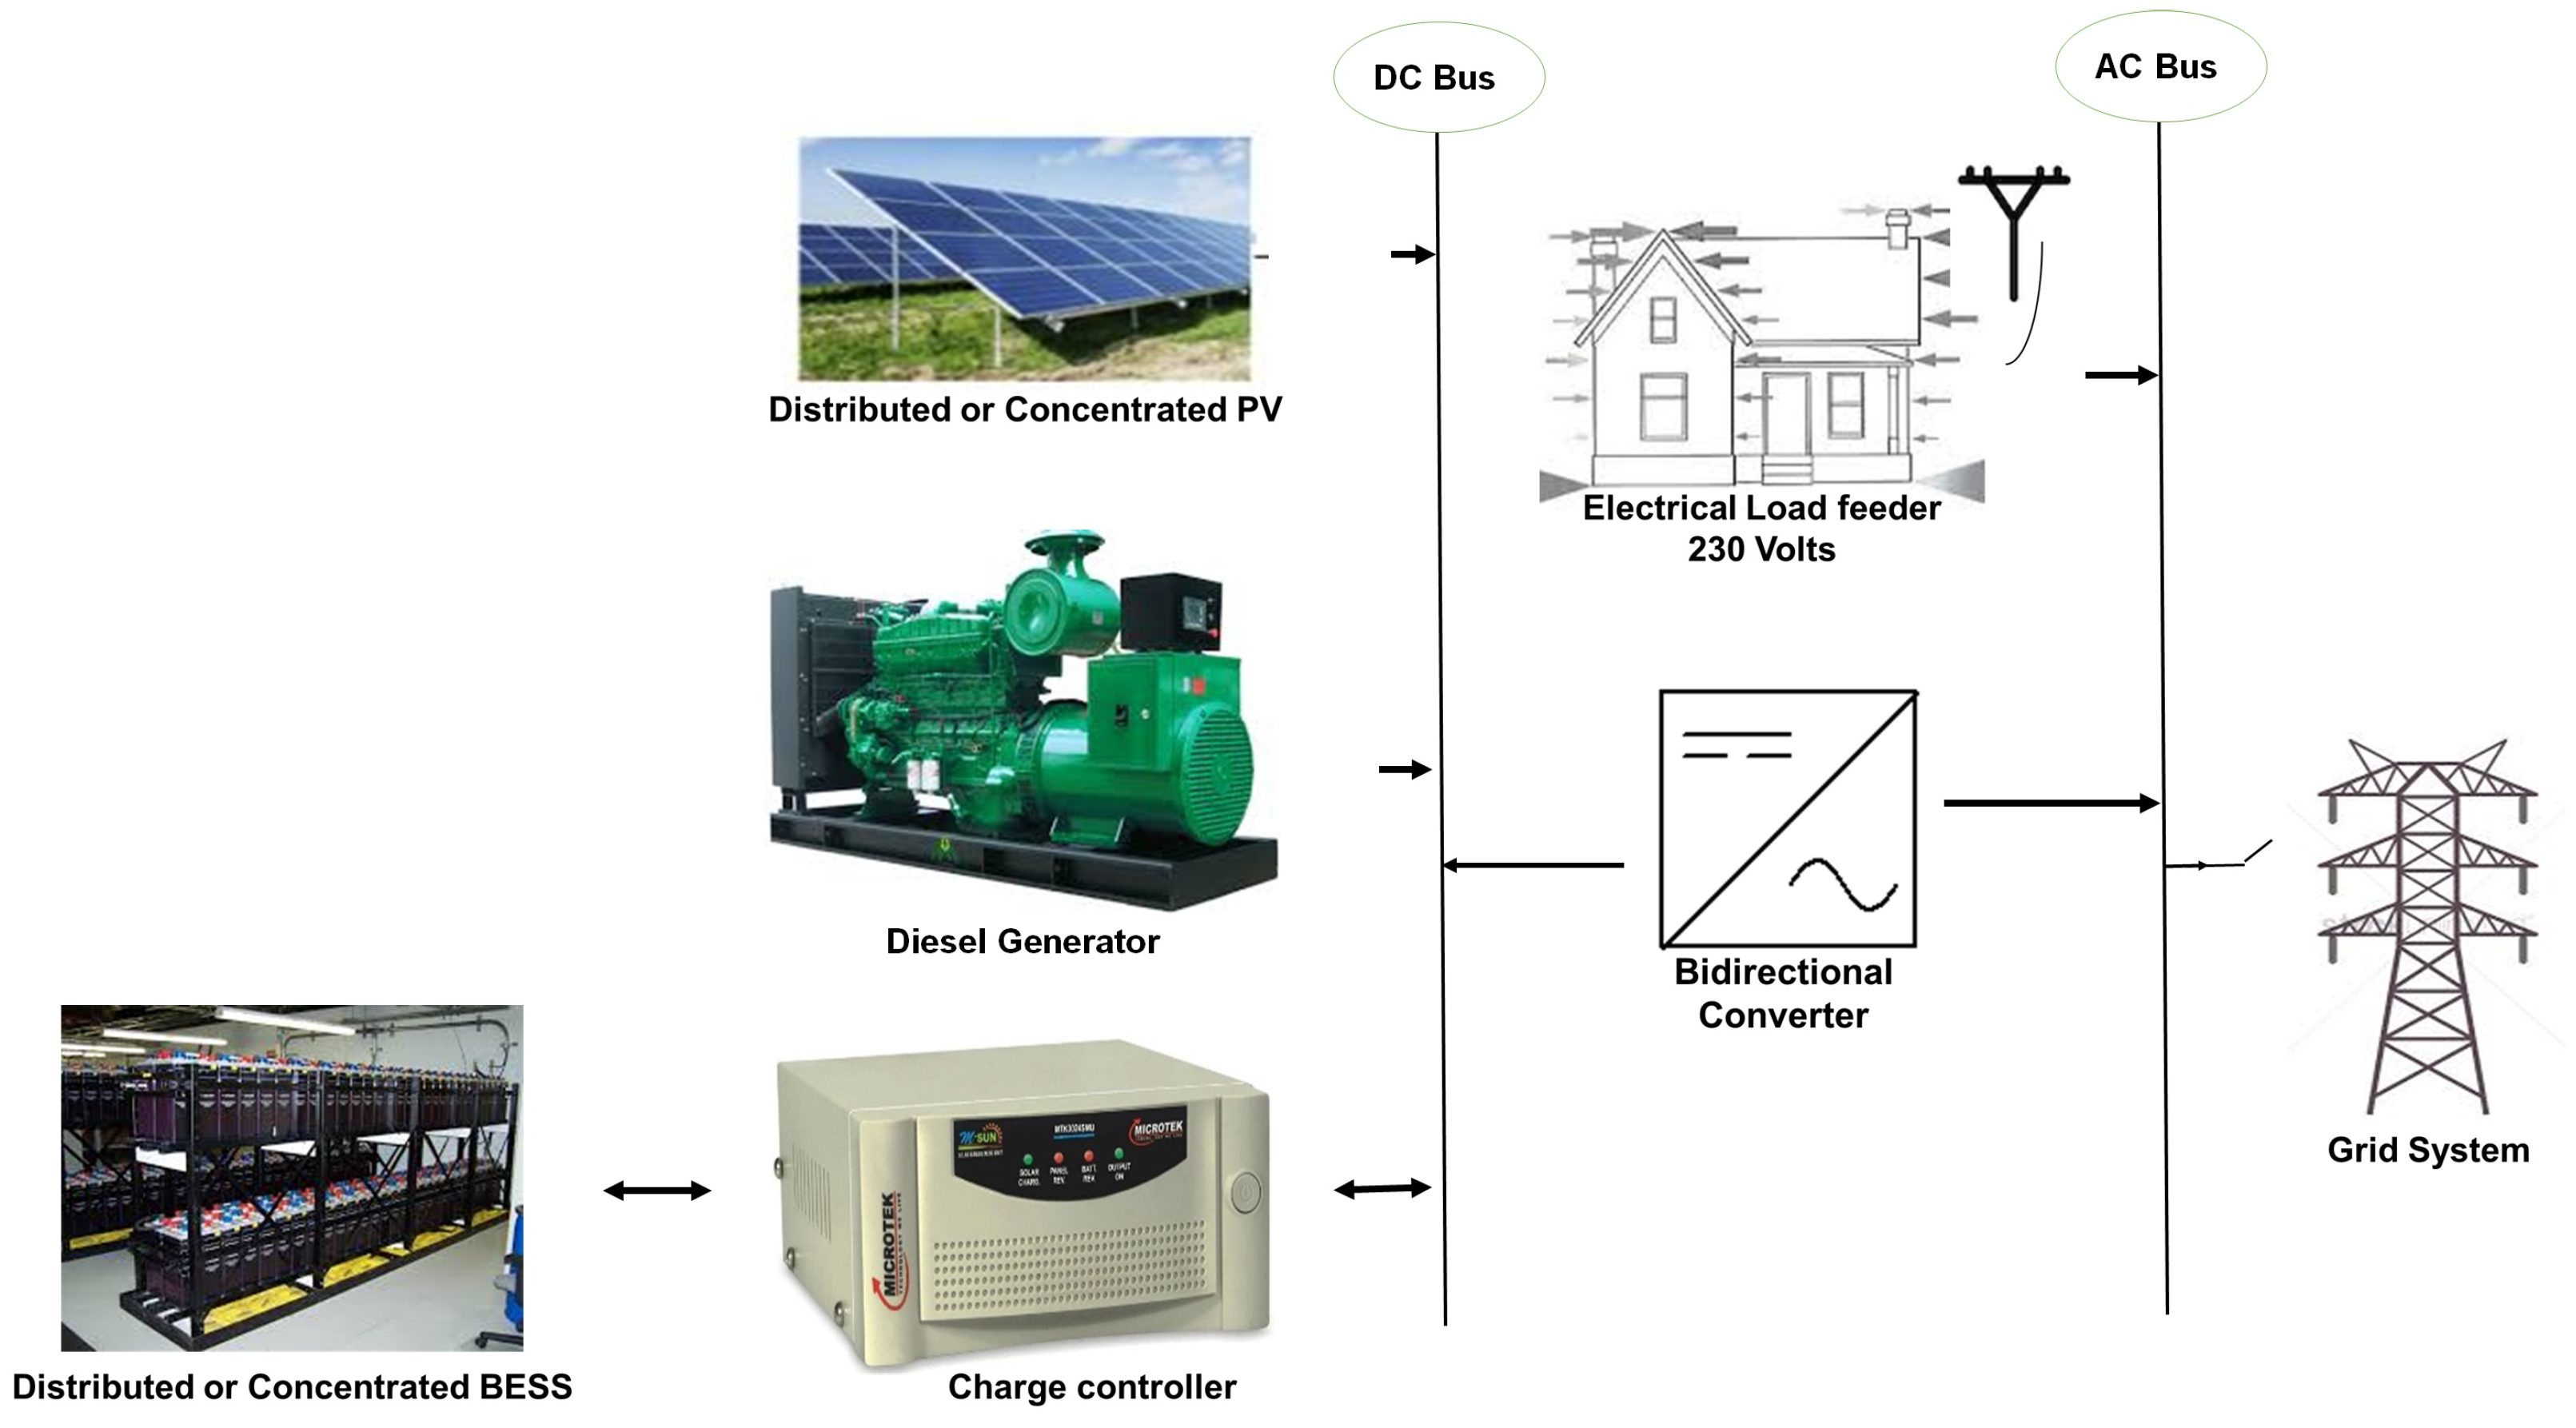
  • Hybrid system design is proposed for rural electrification in a rural village that comprises of SPV system with limited grid power supply and BESS.
  • The modified multi-strategy fusion artificial bee colony (MFABC+) algorithm is proposed and its feasibility and superiority demonstrated in comparison to MFABC and other optimization method.
  • The optimal capacity of the system components is determined using the proposed MFABC+ algorithm.
  • An integrated renewable energy-based microgrid system is proposed for lowest possible LCOE.
The work is structured as follows: Section 1 presents the background as well as the introduction. The targeted area of investigation is described in Section 2. This section provides an overview of the area to be investigated with various statistical as well as the geographical parameters. The load assessment as well as the resource assessment are presented in this section. Section 3 depicts the mathematical modelling of different components used in proposed microgrid. The problem formulation as well as associated constraints are explained in Section 4. The overview of the used optimization methodology was also discussed in this section. Section 5 presents the results derived from the study. The work finally terminates with the concluding remarks in Section 6.

2. Study Area

Assam is a state lying in the north-eastern region of India. The total area covered is 78,438 km 2 . Cachar is one of the 33 districts of Assam that has two subdivisions: Lakhipur and Silchar. Sildubi is one of the gram panchayats and Bariknagar Pt II is one of the villages in the Sildubi gram panchayat of Silchar block. It is located at 24 45 09.6 north latitude and 92 47 29.1 east longitude. The village under investigation has a total geographical area of around 151.92 hectares. As per the census of 2011, Bariknagar Pt Ii village has 847 households.

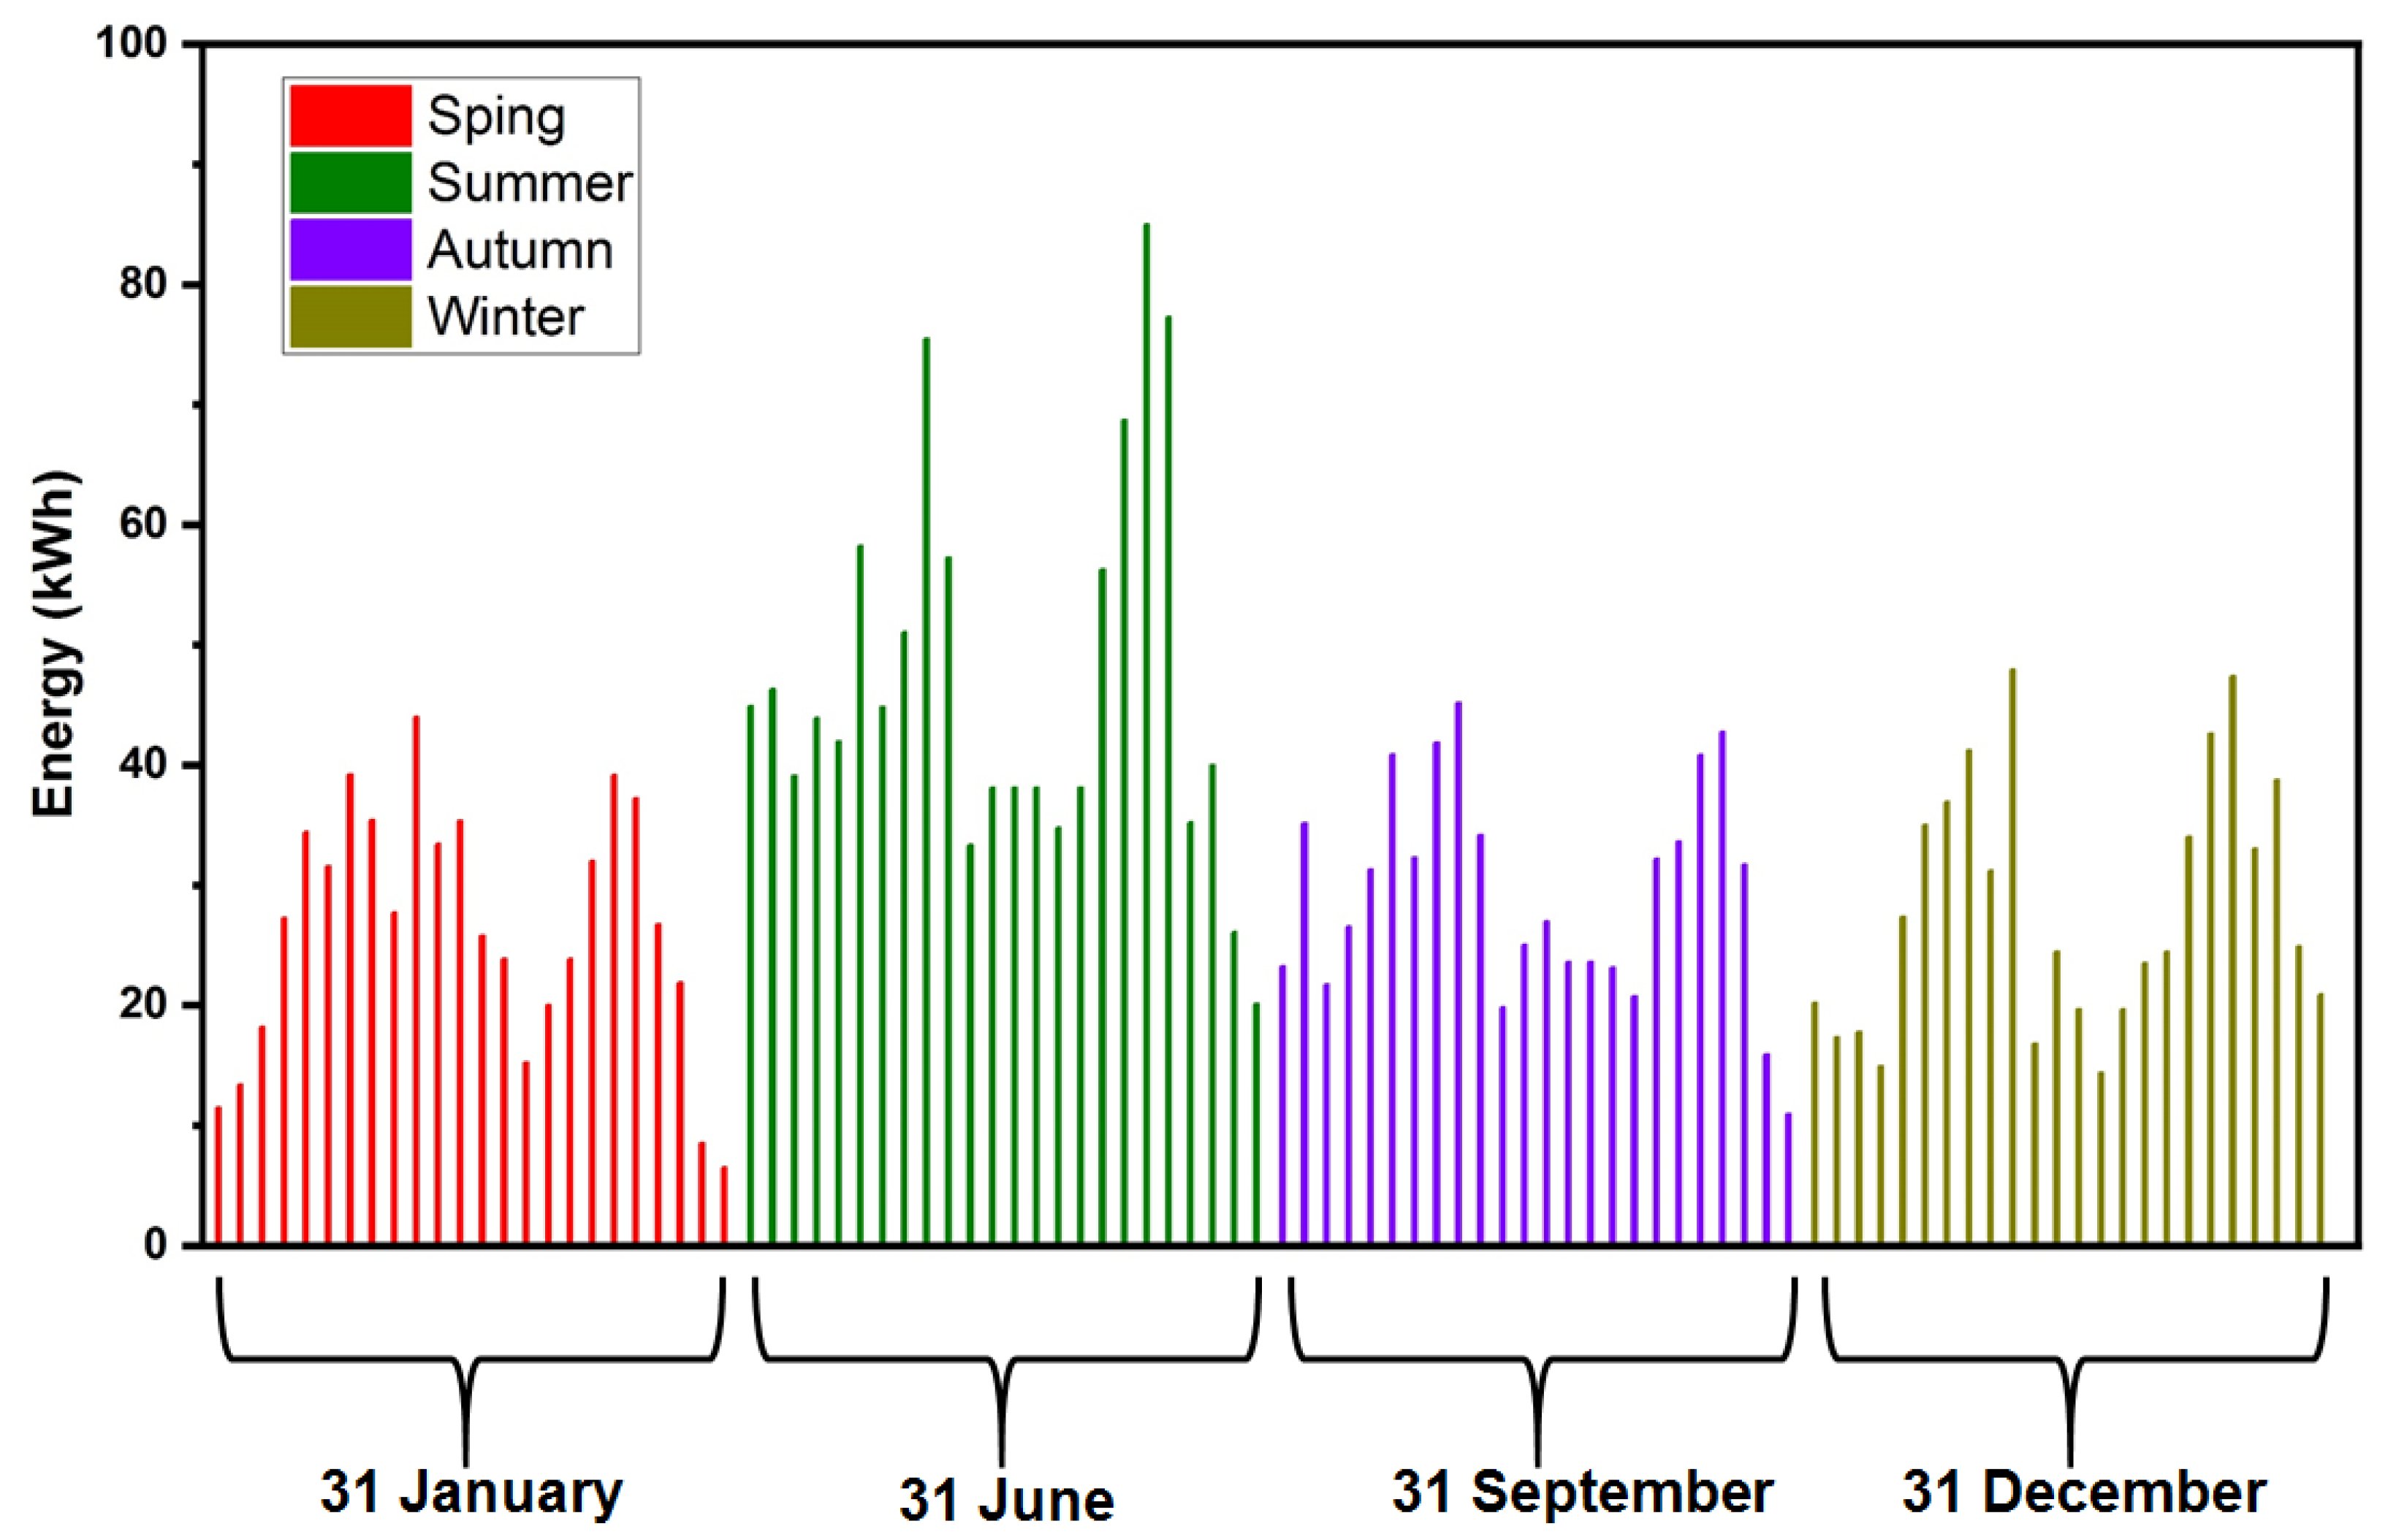
2.1. Load Estimation

A questionnaire-based field survey was conducted to estimate the load demand of the households in Bariknagar Pt Ii village. A total of 45 households were considered for conducting the field survey. The operating hours as well as the power ratings of the appliances used during the questionnaire-based field survey. A total of 45 household’s 24 h period was taken into account to arrive at the projected total power consumption. The load variation was considered for four different seasons of the year i.e., summer, autumn, winter, and spring. The load demand for the different seasons is presented in Figure 1. The detailed load demand is delineated in Table 1 based on survey. The estimated net assessed load of the village area under investigation for one year is 860 kWh approximately.

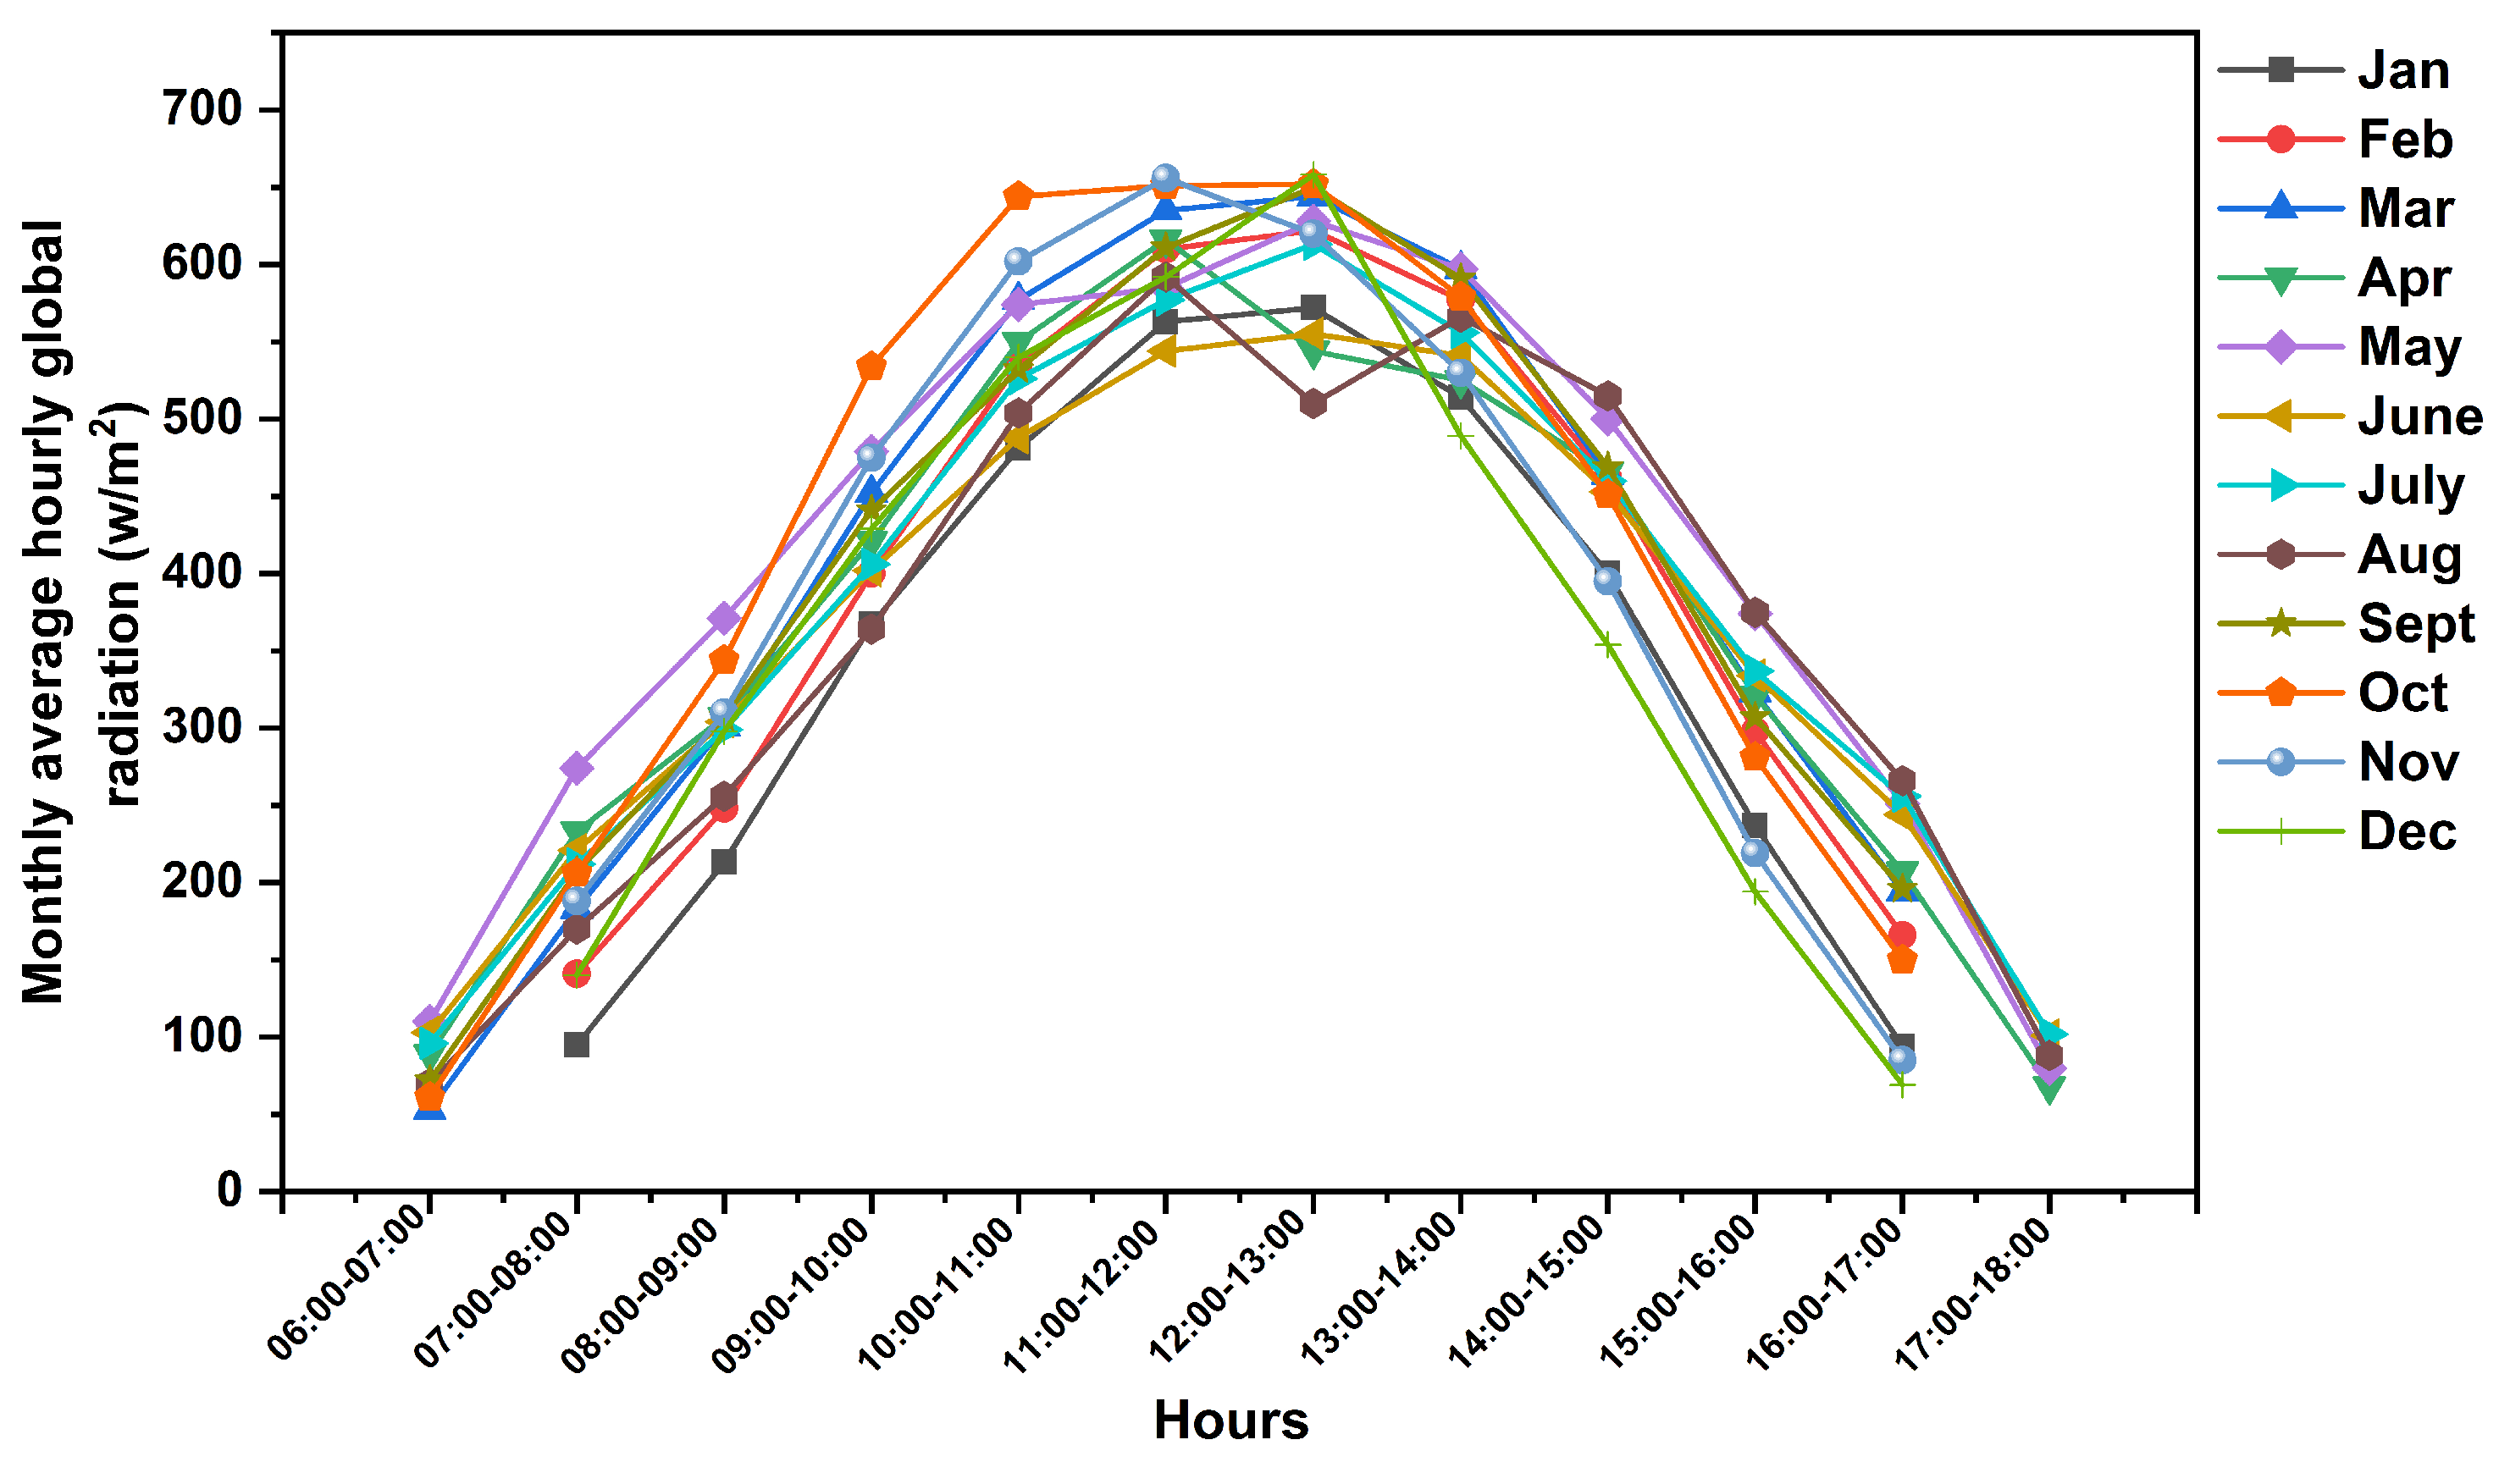
2.2. Estimation of Resources

The major sources of renewable energy in India that were employed by the researchers as different components of their proposed hybrid systems of electrification are wind energy, biogas, SPV, small hydro systems, biomass, etc. In the system proposed for the village area in this study, the hydro energy and the wind energy systems have not been considered, due to the unavailability of these sources in this area. However, the availability of SPV system as a primary source of energy and BESS as a storage system was considered in proposed area. An illustration of the proposed hybrid system is shown in Figure 2. As shown in the figure, the inverter connects the SPV to the radial AC bus. A bi-directional converter, on the other hand, connects the BESS to the AC bus. Table 2 delineates the economic and technical data associated with the different components used. Monthly average hourly global solar radiation for the considered area [30] over a year are presented in Figure 3. The estimated solar energy potential is 3.65 kWh/m 2 /yr.
A flat plate type photovoltaic panel was considered in the present study. BESSs are characterized by fast response, replacement, feasibility, easy maintenance, and operations. Due to these major advantages, it is used in the proposed microgrid system. The unit size and associated round trip efficiency of battery employed within the proposed system is 2.06 kWh and 88%, respectively. A lifetime of five years is assumed for the unit battery.

3. Mathematical Modeling

3.1. SPV Panel

The solar radiation on SPV panel determines its power output. Equation (1) provides the relationship for the power output from SPV module.
P 0 = P s r f l o s s G h ( t ) G ( s )
where P 0 is the power output of the solar PV, P s r is the rating of the solar PV, f l o s s is the derating factor, G h ( t ) is the solar radiations incident hourly onto the solar panel and G s is the standard incident radiation.

3.2. Power Converter

The power converter is employed in the present hybrid system owing to the presence of both the AC and DC components within the system. In the present work, SPV panel and BESS generate DC power output, whereas AC power is required in considered load. Converter size is selected based on peak load demand as shown in Figure 1. Equation (2) describes the relationship between peak load and inverter efficiency.
P c o n ( t ) = P p L m ( t ) η i n v
where P c o n ( t ) is the rating of inverter, P p L m ( t ) is the peak load demand and η i n v denotes the inverter efficiency.

3.3. Battery Bank

The excess energy generated by RESs other than load demand is stored in batteries. The stored energy is discharged when power from renewable system is not enough to meet the electricity demand. State of charge (SOC) is basically the level of charge of a battery relative to its capacity. SOC is a function of time and can be expressed using (3).
S O C ( t ) = S O C ( t 1 ) + T 1 T P b t ( t ) η b t V b s d t
where SOC is the state of charging of the battery, V b s is the voltage of the bus, P b t is the battery’s input/output power and e t a b t is the round trip efficiency of the battery. The battery is charged if is positive otherwise it is discharged. The round trip efficiency associated with the battery is determined using (4)
η b t = η b t c η b t d
η b t is calculated using charging ( η b t c ) and discharging ( η b t d ) efficiencies associated with the battery system and found to be equal to 89.50%. It is worth noting here that and both are different and considered to be 80% and 100%, respectively. SOC m x is the maximum value associated with the state of charge of the battery system. It is equivalent to the aggregate capacity of the battery bank which can be determined using (5).
C n = N b t N b t s C b
where C b is the parameter that represents the capacity of a single battery, N b t is total number of batteries and N b t s is number of batteries connected in series. The batteries are connected in series to ensure the desired bus voltage. Equation (6) is used to determine the number of batteries that are required to be connected in series.
N b t s = V b s V b t
where V b s shows bus voltage and V b t is voltage associated with a single battery. One important factor that is required to be defined for the battery system is the maximum charge or discharge power associated with the unit battery. Equation (7) is used for determining the maximum capacity of a battery.
P b t m x = N b s V b t I m x 1000
where I m x is the maximum charging current of the battery.

3.4. Diesel Generator (DG)

DGs are used to provide backup in case the load demand is not met by the SPV panels and BESSs. It supplies the desired excess load. A 30 kW DG was assumed to be connected with the system. By assuming P D G , t ( t ) power from DG, the diesel fuel coefficient can be determined using (8).
F D G ( t ) = α D G P D G , g ( t ) + β D G P D G , r ( t )
F D G ( t ) represents the rate at which the diesel fuel is consumed by DG in (L/h), P D G , g ( t ) is the output power from DG and P D G , r ( t ) is the rated capacity of the DG in kW. The fuel curve intercept coefficient is denoted by α D G (L/hr/ k W r a t e d ) and the diesel curve intercept coefficient is denoted by β D G (L/hr/ k W o u t p u t ).

4. Problem Formulation

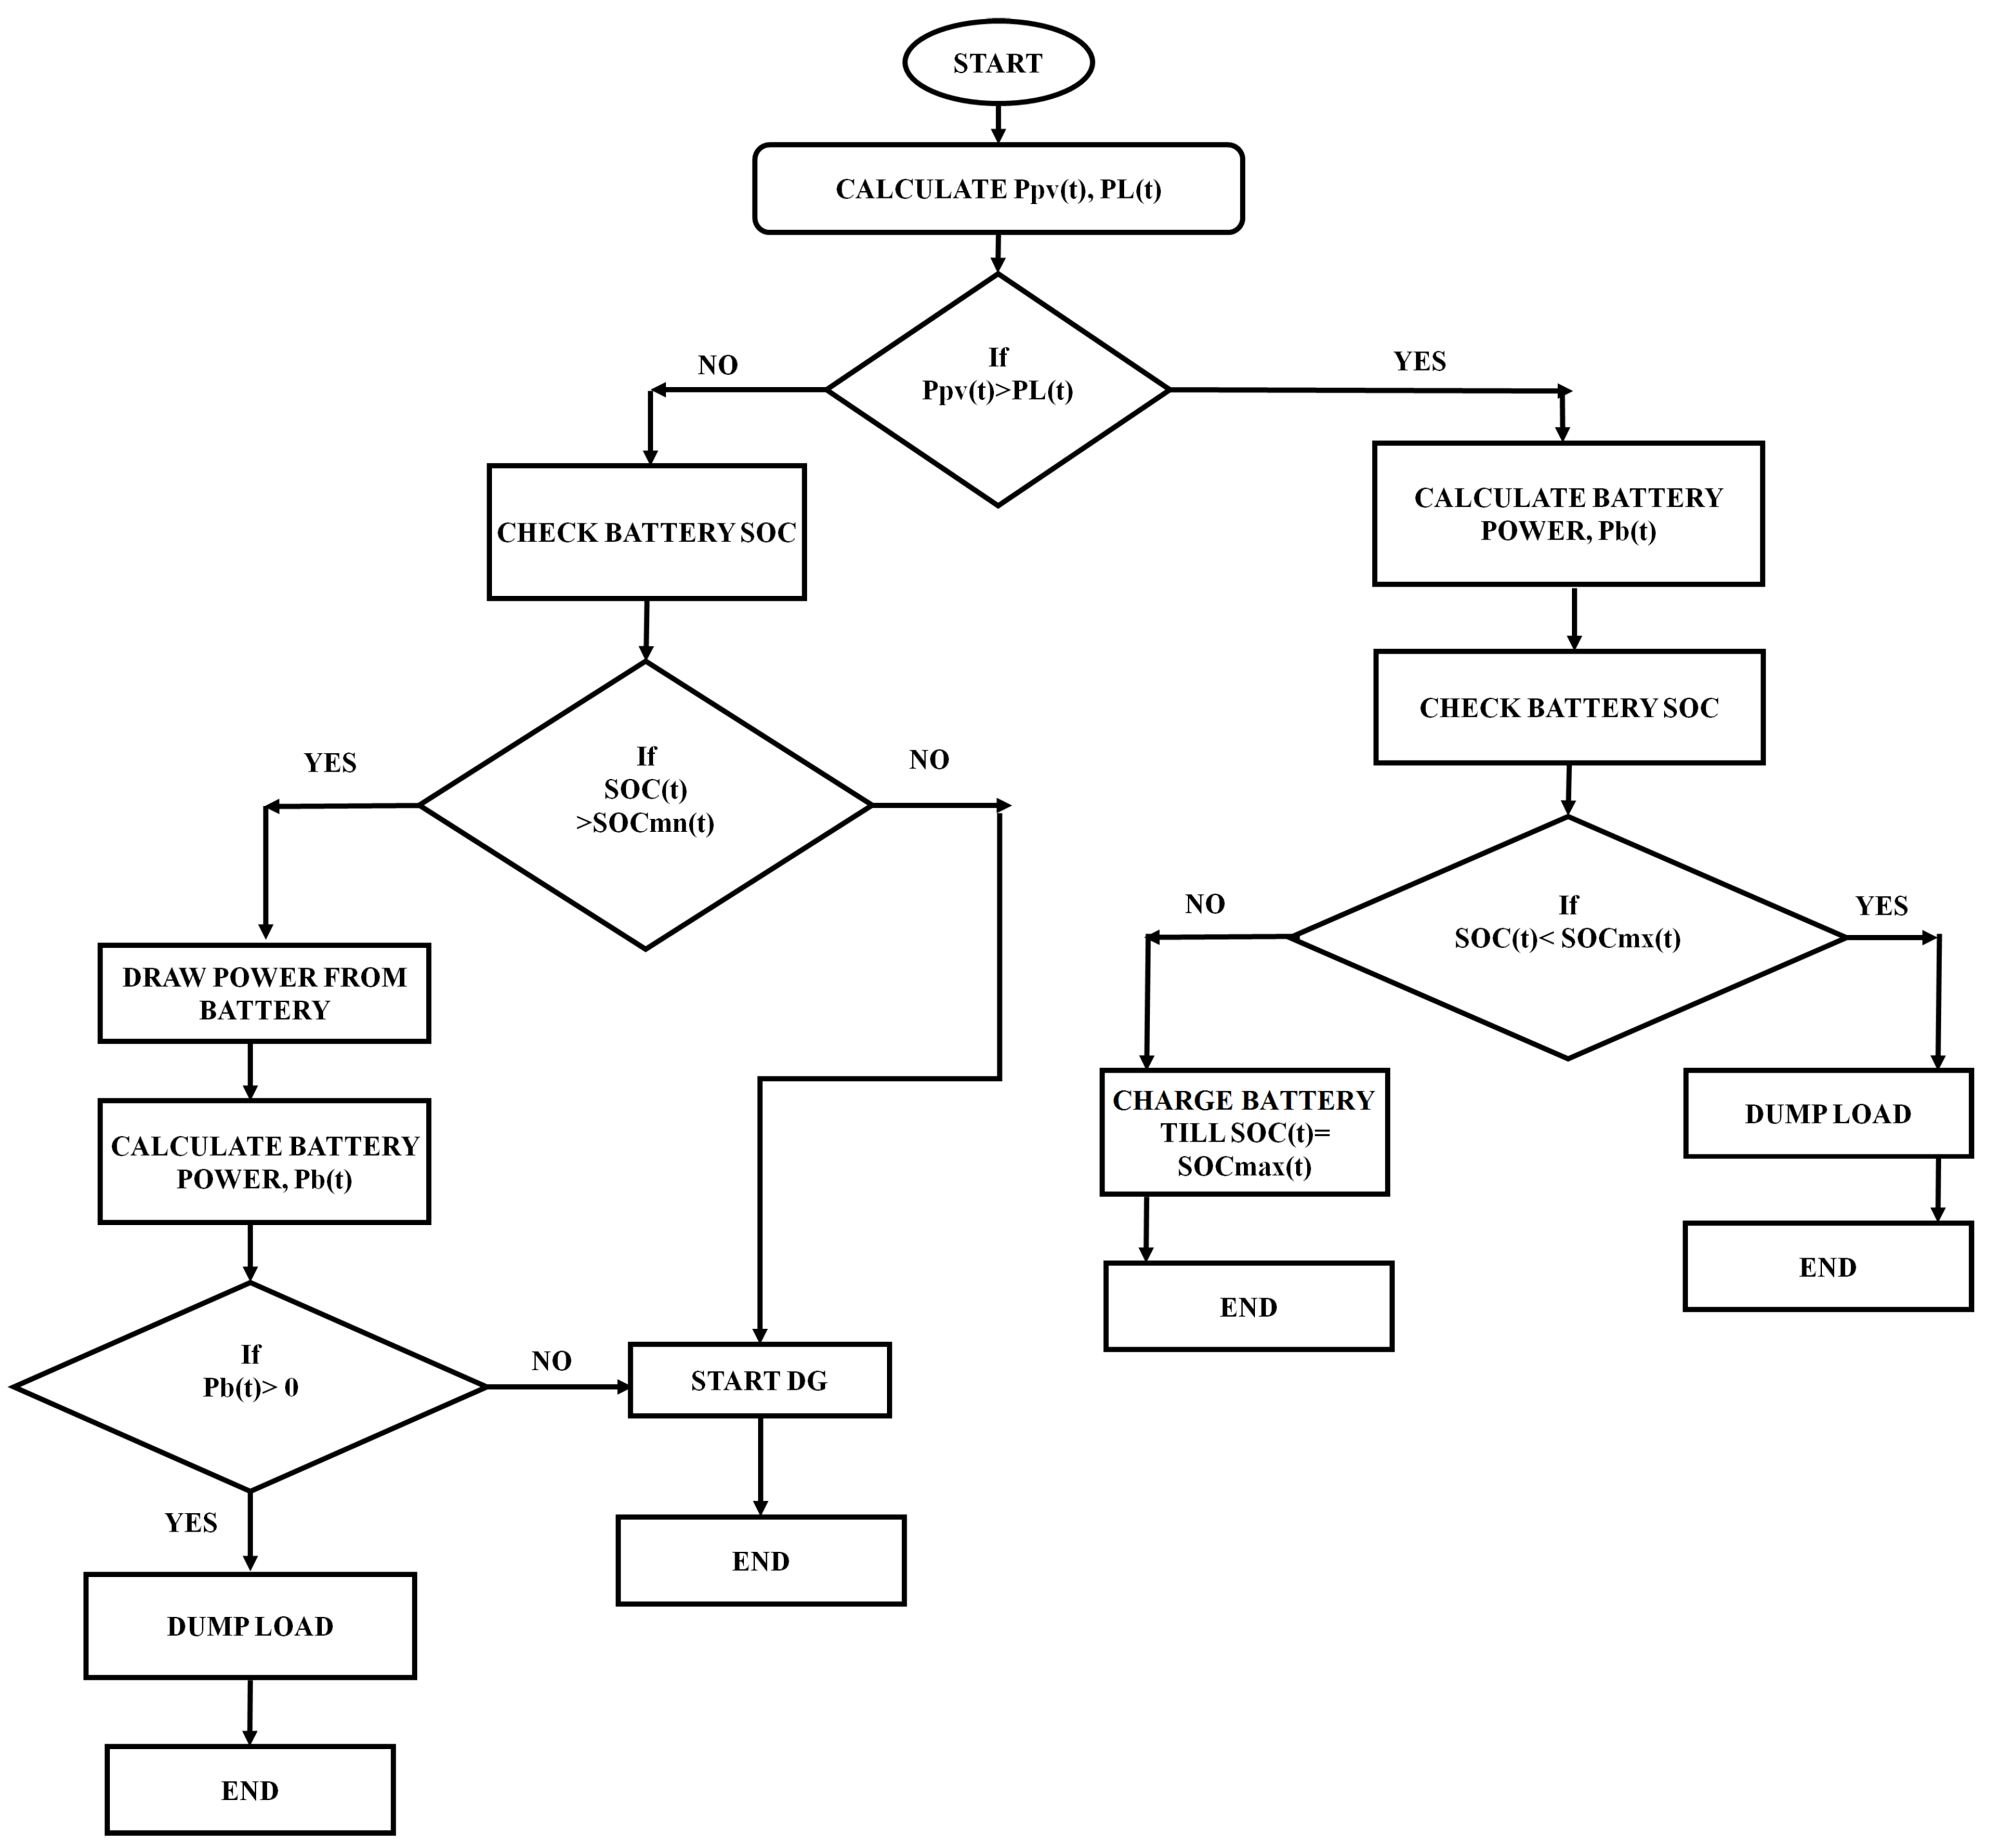
4.1. Operational Strategy

In proposed hybrid microgrid system, the balancing of power demand was achieved by reliability of the system. For this system DG is used only when the solar and BESS are unable to meet the power demand, means DG kept at the least priority. In the case of maximum demand is fulfilled by solar RESs then the surplus energy generated by solar is stored in the battery as shown by (9).
P b t ( t ) = P P V S ( t ) P p L ( t ) η i n v
where P p L ( t ) denotes the peak power demand with respect to the time. The total power produced by the SPV system is calculated using the total number of solutions N 0 ( t ) and total power P 0 ( t ) produced as shown by (10).
P P V S ( t ) = P 0 ( t ) × N 0 ( t )

4.2. Objective Function

The objective of the present integrated RES design is to minimize the annualized system cost (ASC) and hence the LCOE which is the ratio of ASC to the energy extracted from the system annually. This is achieved under certain constraints such as CO 2 emission, reliability and renewable fraction. LCOE determines the unit cost of energy. The associated LCOE of the system can be expressed in $/kWh. The objective function, i.e., ASC, can be calculated using (11).
M i n i m i z e A S C = F [ N 0 C 0 + N b t C b t + N c o n C c o n ]
C 0 = C 0 a c p + C 0 r p + C 0 a m + C 0 a c C 0 s l v g
C b t = C b t a c p + C b t r p + C b t a m + C b t a c C b t s l v g
C c o n = C c o n a c p + C c o n r p + C c o n a m + C c o n a c C c o n s l v g
where C 0 , C b t and C c o n are the cost involve in SPV panel, cost of the battery and inverter cost, respectively. There are several components associated with the ASC such as capital and installment cost C a c p , replacement cost C r p , operational cost C a c , salvage cost C s l v g and annual maintenance cost C a m . Each cost component of (11) can be calculated using (12)–(14).
The relationship between ASC and the LCOE can be expressed using (15).
L C O E = A S C × C R F ( γ , τ ) E g e n ( t )
CRF represents Capital Recover Factor which is a function of the annual discount rate ( γ ) and life of the plant ( τ ) and can be described using (16).
C R F = γ ( 1 + γ ) τ ( 1 + γ ) τ 1

4.3. Constraints

A constraint is a condition of any problem that must be satisfied before obtaining any feasible solution for any objective function. The following mentioned constraints should be satisfied to obtain the desired objective of power demand and annualized cost.

4.3.1. Economic Criteria

The economic constraints pertains to the installment cost, replacement cost, operational and maintenance cost. The cost incurred from the start of the project till its commissioning is the installment cost. The operation and maintenance cost includes the replacement cost incurred due to replacement of any component of the microgrid system as well as the cost incurred during the operation of the microgrid system. ASC can be calculated, considering all these costs, using (17), where i is the interest rate.
A S C = C a c p + t = 1 N ( C r p + C a m + C a c ) ( 1 + i ) t C s l v g

4.3.2. Power Balance Criteria

The power demand of the rural village that is under consideration must be satisfied by the total power generated by the proposed hybrid system. This is required to be satisfied for each hour of operation as presented by (18).
P P V S ( t ) + P g r i d ( t ) + P b t ( t ) + P N S ( t ) = l o a d η i n v
Here P P V S , P g r i d and P b t are the power output from photovoltaic, grid and battery, respectively. The power that remains not supplied is represented by PNS.

4.3.3. Power Output Limit

The limit associated with the power output from the SPV panel can be obtained using (19)
P p c f ( t ) = P s n { G ( t ) } G s t d G ( t ) > R c P s n G ( t ) 2 G s t d R c
where 0 < G ( t ) < R c ( t ) , P p c f is the power conversion function associated with the SPV system, the solar radiation is represented by G(t), G s t d represents the standard solar radiations and is considered to be 1000 W/m 2 , R c is the cut in radiation point and the rated power output of the SPV system is denoted by P s n .

4.3.4. Battery Constraints

The constraint for the battery can be represented using following formulations:
State of charge (SOC): The conditions associated with the discharge as well as over-discharge of the battery should be taken care of appropriately. Therefore, the BESS limit can be determined by (20), based on the charging and discharging of the battery.
S O C m n ( t ) S O C ( t ) S O C m x ( t )
where S O C m n and S O C m x are system charging limits associated with energy storage in the microgrid system. S O C m n describes the minimum SOC that shows that a battery cannot discharge below a certain limit. S O C m x is the maximum value associated with the state of charge of the battery system. The SOC of the battery at any given tth hour, SOC(t), should remain in the maximum and minimum defined limits.
Another major constraint associated with the battery is the power limit. It should be limited by defined minimum and maximum limits as shown in (21).
P b t , m n P b t P b t , m x

4.4. Optimization Methodology

In this work, a modified MFABC algorithm is suggested and known as MFABC+ algorithm. The original MFABC algorithm [31] makes use of three search strategies that involve different characteristics of ABC/best, Plus Half ABC (PHABC) and Constrained ABC (CABC) algorithms. The PHABC as well as ABC/best are mixed within the candidate pool with the associated probability for initial selection. In MFABC, the search equation is selected randomly following the associated selection probabilities before the searching process of each artificial bee is initiated. The selection probability update rule is suggested in MFABC+ to improve its selection criterion and it is designed based on Metropolis criteria [32]. The MFABC+ pseudocode is presented in Algorithm 1. The selection probabilities considered for PHABC and ABC/best in MFABC+ is depicted in (22) and (23), respectively. A flowchart for the working of the proposed hybrid microgrids system in Figure 4.
S e l e c t p r o b a b i l i t y P H A B C = e f ( x ) f ( x ) T × ( 1 U R ) + N o r m a l i z e d E v o l u t i o n R a t i o P H A B C × U R
S e l e c t p r o b a b i l i t y A B C / b e s t = ( 1 S e l e c t p r o b a b i l i t y P H A B C )
where UR is the update ratio and lies in the interval [0,1] and T is the temperature and significantly affects the selection probability. Initially, the value is set to some initial temperature T ( i ) and it decreases in successive generation in accordance with the following formulation (24):
T ( i + 1 ) = α T ( i )
where the cooling coefficient is reflected in α . The main significance of modifying the selection probability using Equations (22)–(24) are as follows: (1) It gives faster convergence compared to the standard MFABC algorithm, (2) Better quality of the solution is obtained and (3) It has universal applicability.
Algorithm 1 Pseudo-code of proposed MFABC+ method
Energies 14 00190 i001

5. Results and Discussion

The methodology depicted in the present work is designed to fulfill the optimal electricity demand for a rural village. The electricity demand was met through the design of small stand-alone PV-battery hybrid system. This work considers peak load demand for 45 households in a small microgrid. The evaluated peak load demand is 100.02 kW and the associated load factor is 0.415. Four different load profiles were considered for four distinct seasons. The summer, autumn, winter and spring seasons are assumed to be presented from May to August, September to October, November to February and February to April, respectively, as shown in Figure 1. The availability of solar radiation is throughout the year and the maximum radiation occurs in the month of May. The estimated data reveals an average solar radiation of 3.45 kWh/m 2 /day, as given in Figure 3. The detailed load demand of the small community with forty five households was delineated in Table 1. Table 2 depicts the technical and economical parameters associated with the different components employed in the present study. The life time of 20 years and interest rate of 6% are assumed for the SPV renewable system which were assumed for the considered area.

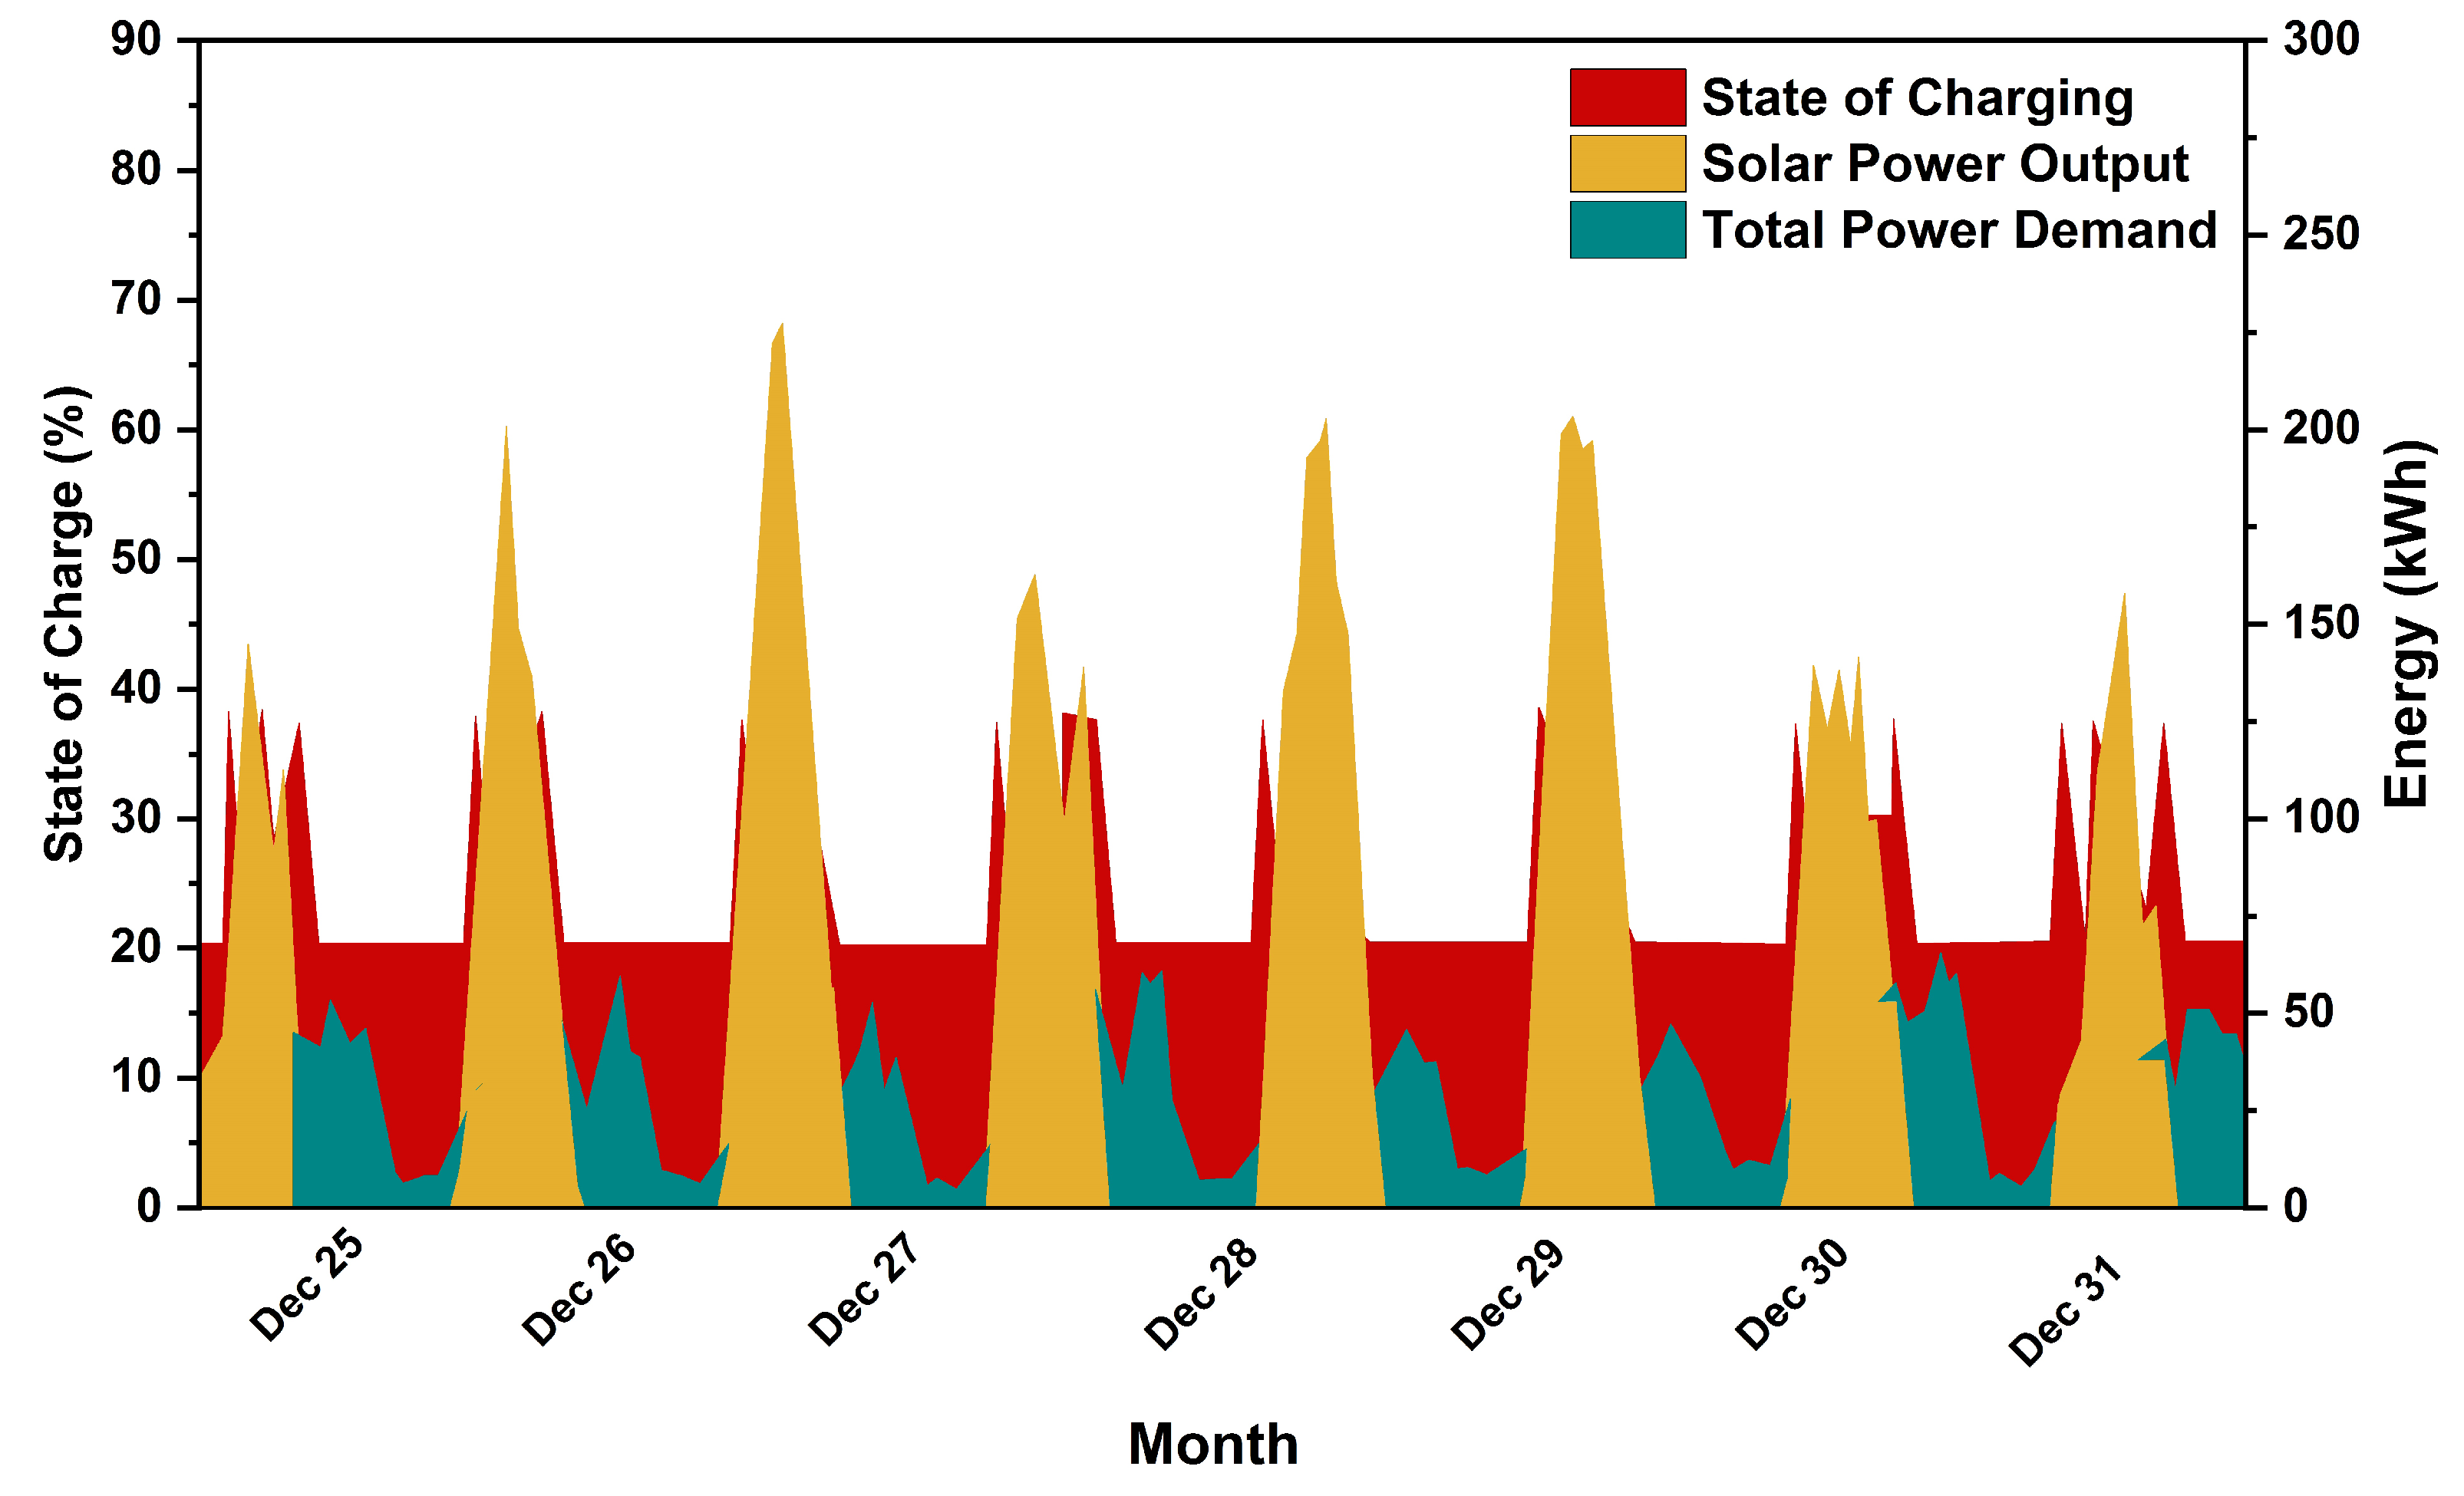
5.1. Analysis of Results

The simulations were performed for a time step equivalent to one hour using MATLAB 2016a and were run for the data that are recorded for one year duration. The objective function is solved using PSO, MFABC and MFABC+ algorithms. All algorithm parameters used for simulation are presented in Table 3. The number of solar PV units and the number of batteries are the variables that are required to be found so that the ASC can be minimized. The size of the inverter was not included as the decision variable as this was selected on the basis of the peak demand. These algorithms run by considering the similar maximum number of solar panels and batteries i.e., 300 and 1000, respectively. The rating of the inverter is considered to be 110 kW and obtained using (2). The results have also been obtained using HOMER software and used as reference for comparing the solutions obtained using aforementioned algorithms. The results obtained are compared and presented in Table 4.
It presents total number of PV and battery units. It can be observed that results obtained using MFABC+ is better or comparable than other techniques and HOMER software in terms of optimized value of solar and battery units. Table 4 also presents ASC, TNPC and LCOE costs and all these costs are found to be better in case of MFABC+ algorithm. Total 230 number of PV units, 800 battery units with the ASC of 56,002 $/yr, TNPC of 700,000$, with LCOE of 0.195 $/kWh are obtained using MFABC+ algorithm. These parameter values are minimum than values obtained by other methods.
The performance of the MFABC+ algorithm was observed to be much better in comparison to other meta-heuristics i.e., MFABC and PSO in terms of results as well as the computational time. Moreover, it is also observed that the solutions provided by the considered meta-heuristics are better in comparison to that obtained using HOMER software. The results obtained and associated LCOE reveals that the proposed system fulfills the energy requirement of the community with an acceptable cost. The least LCOE is provided by the MFABC+ algorithm and hence MFABC+ is found to be better among all methods.
Results obtained using all solution methods are further extended in Table 5 to present solar power generations, battery in and out, total served demand and excess electricity. The excess generated energy was revealed to be 6897 kWh/yr i.e., 2.1% of the total load served in the case of MFABC algorithm. The excess energy generated with implementation of MFABC+ is 5320 kWh/yr i.e., 1.45% of total energy served. The results obtained using HOMER reveals an excess energy of 128,087 kWh/yr and amounts to 43.92% of the total energy served.
The detailed analysis with respect to the annualized cost of the proposed design obtained using MFABC+ algorithm was demonstrated in Table 6. The capital cost, replacement cost, maintenance cost and salvage cost of each component connected in the proposed system are presented in the table. The cost recovery factor, depicted in (16), is employed to arrive at the ASCs. No replacement cost is required in case of the PV panels owing to the fact that the lifetime of PV panels is similar to that of the lifetime associated with the project. The replacement is required for the battery bank and it was assumed that the employed battery bank needs to be replaced in every five years. Hence total number of replacements associated with the batteries is three. The cost contribution associated with the batteries is approximately 33% of the total cost of the designed system while the SPV system contribute 43% of the total cost of the project.
The convergence graphs for ASC using PSO, MFABC, and MFABC+ are shown in Figure 5. The cost function is formulated for minimization, so better performing algorithm will provide minimum cost value than other algorithms. It can be observed from figure that convergence obtained using MFABC+ is better than other methods. All three meta-heuristics take 20–30 min to converge. HOMER software on the other hand take more time to converge. The total energy demand was fulfilled through the employability of PV panels and batteries. The monthly average energy balance for one year was delineated in Figure 6. It can be observed that, during summers, more power is drawn from the batteries. For other seasons, the energy requirement was met through the generated solar power. The excess energy is available only for three months. The proposed system was optimized to minimize or dump the excess generated energy and utilize maximum RESs with the help of efficient energy storage system.
Three weeks were opted for in order to judge the validity of the optimal operation between load and demand of the community that is obtained through the implementation of the system under consideration for a period of one year. The first week selected is in month of April, second week is for the month of July and third week is for the month of December. These months are selected as in the month of April the load demand is moderate, the demand is at peak in the month of July and is at minimum for the month of December. The complete power exchange associated with the different components of the proposed integrated renewable energy system for the duration of one week being considered for the month of April is depicted in Figure 7. It can be observed from the figure that the generation from the installed solar power plant is low for a few hours and also the SOC of the BESS is low. Therefore during these hours, the power is provided by the DG. The management of the energy during the last week for the month of July is depicted in Figure 8 and for the month of December in Figure 9. It is revealed from Figure 9 that the solar power generation is sufficient and hence there is no requirement to run the DG set. The total power demand of the considered area can therefore be met through the SPV and the BESS.
The SOC of the battery Trojan SAGM 06 315 storage system is delineated in Figure 10. The monthly average SOC of the battery varies between 30–80% of the total load consumption. It can be observed that the SOC for the employed BESS always remains well within the defined limits. The initial SOC is considered to be 100% in January i.e., the SOC is 2984 kWh. However, the SOC is observed to be at 30% during certain hours of the year. It is also deducible that for most of the time around the year, the SOC of the BESS remains good. However, during a few instances such as during the month of April and July, the SOC is poor due to low availability of natural resources and high demand respectively for the month of January and June.

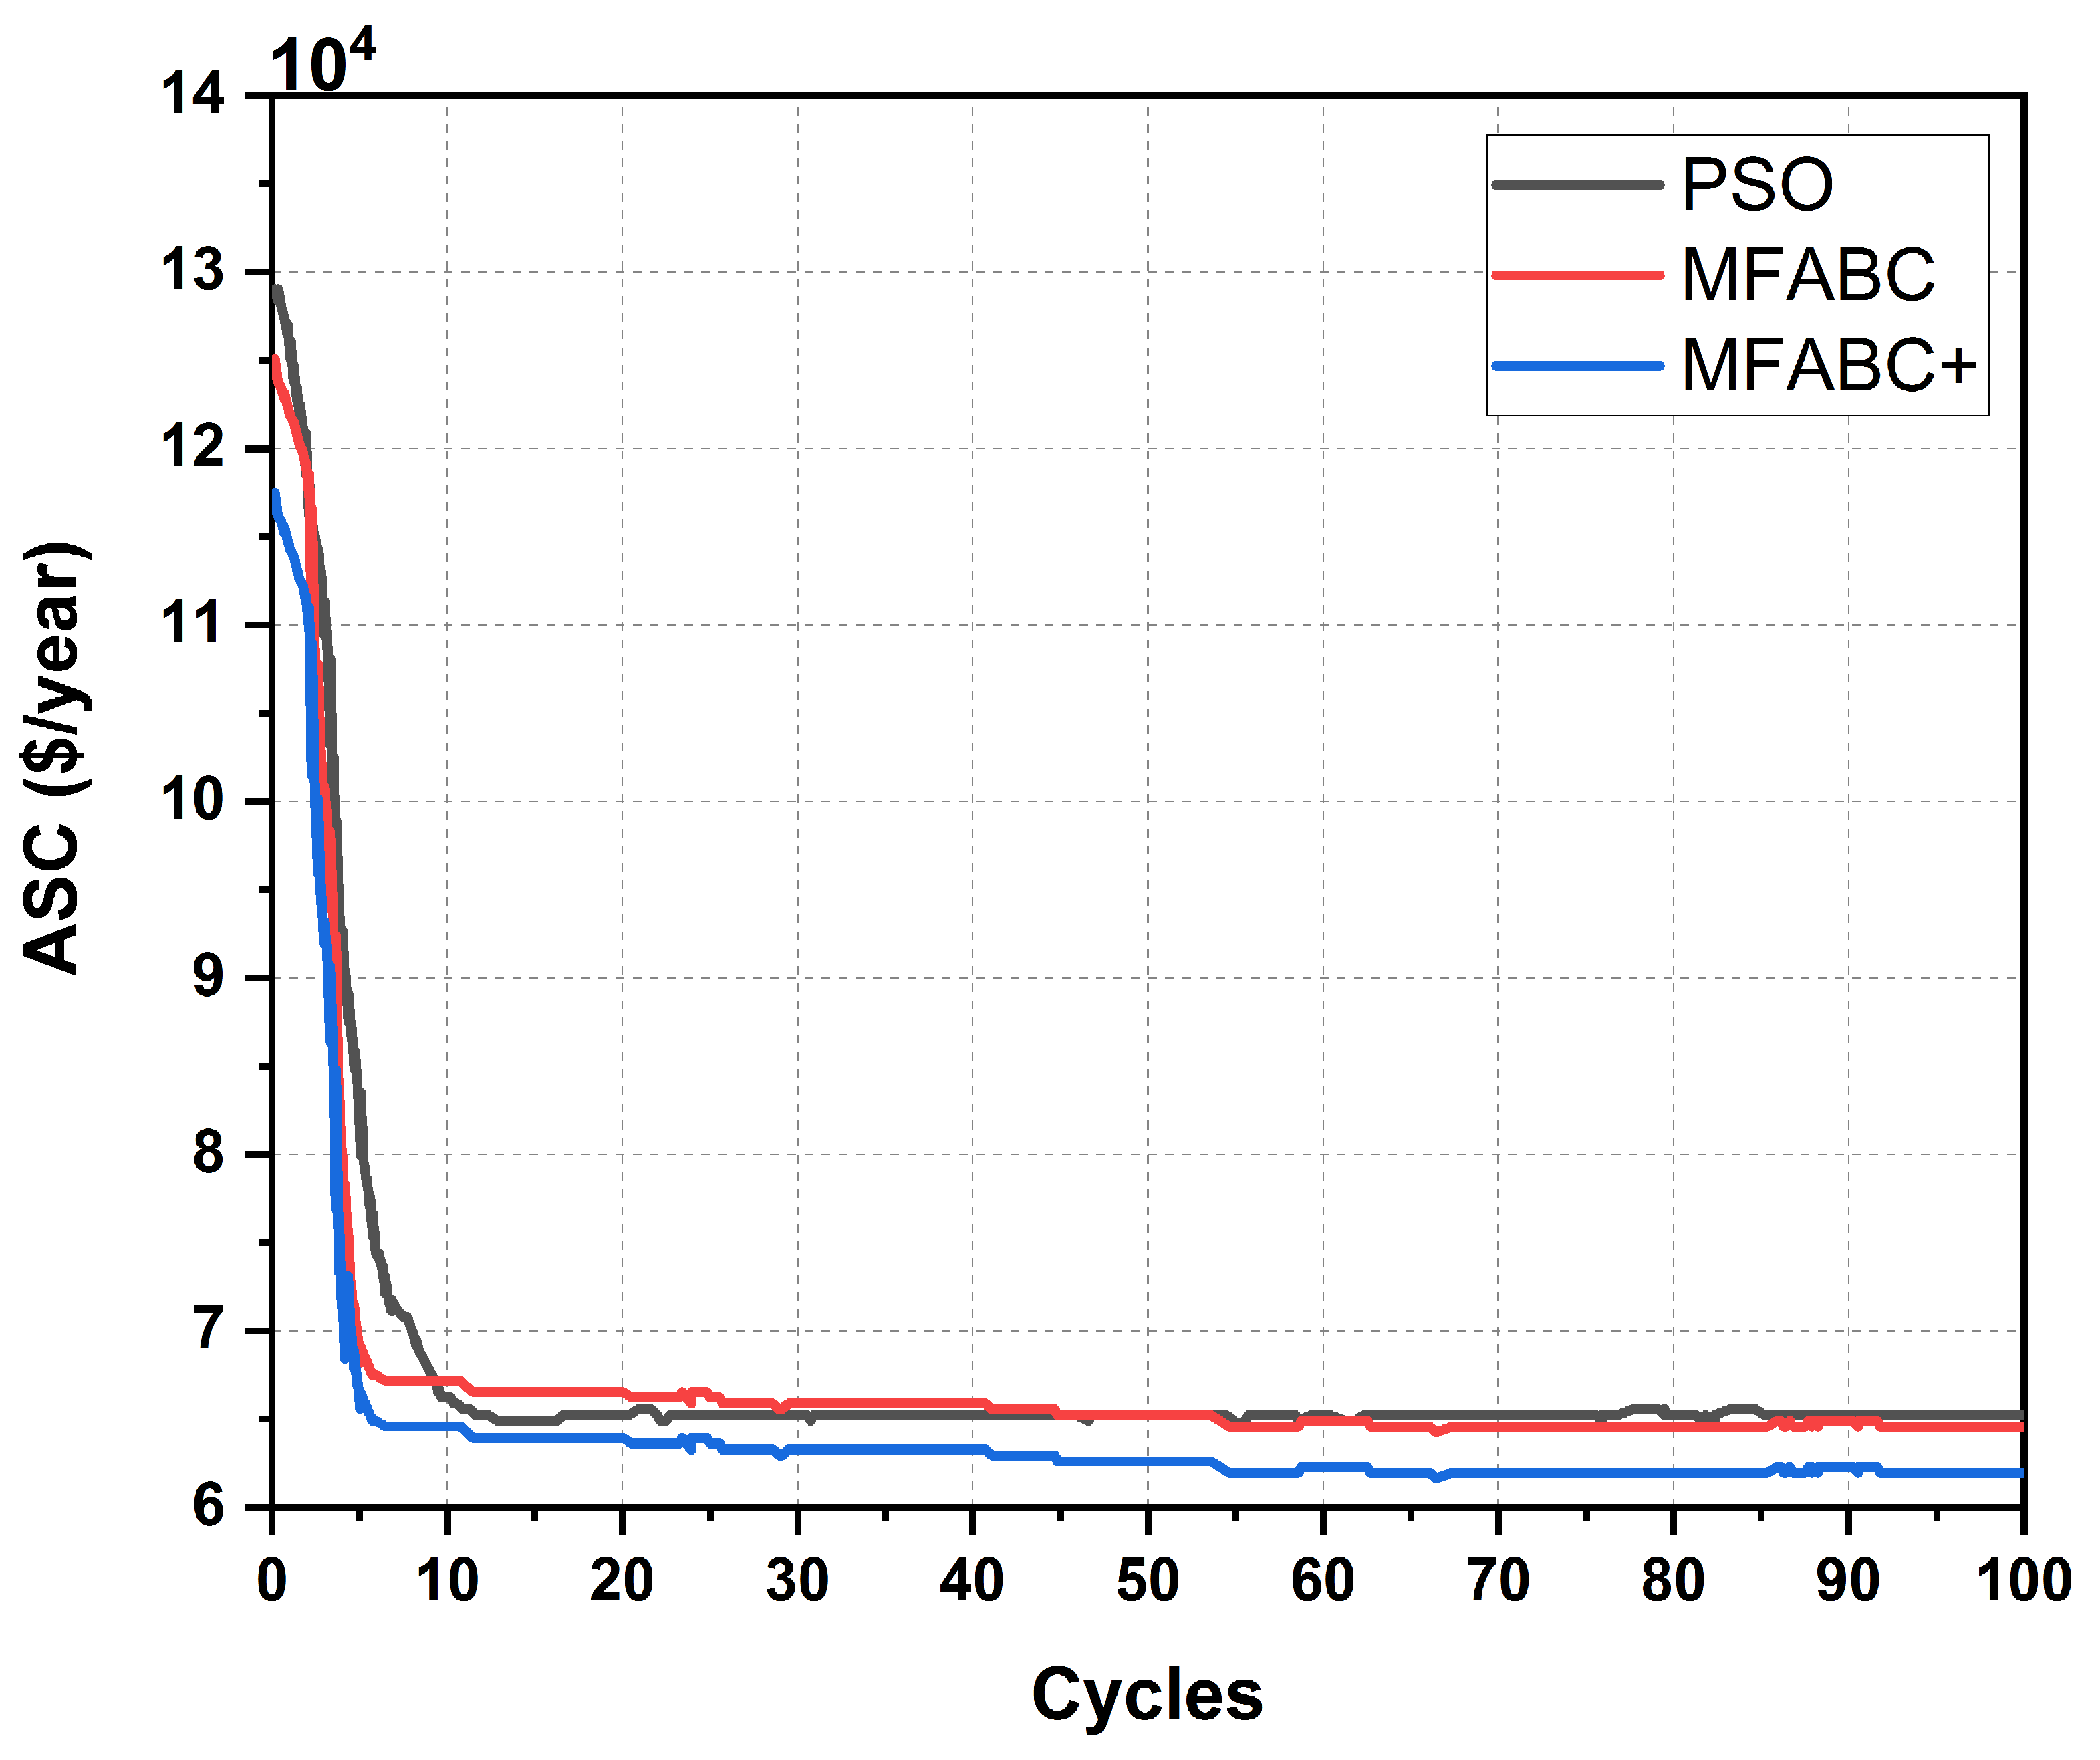
5.2. Effectiveness of MFABC+ Algorithm

The effectiveness of the MFABC+ algorithm over MFABC and PSO algorithms was verified using a total of thirty iterations for each of the aforementioned algorithm. Minimum deviations is revealed for the MFABC+ algorithm in comparison to the MFABC, and PSO algorithm and therefore suggests that MFABC+ algorithm is better than MFABC, and PSO algorithms. The validity of the effectiveness was established through the paired student’s t-test. The validity associated with the effectiveness of the solution was accomplished at confidence level assumed to be 5%. The value of ASC that was achieved using the implementation of the MFABC+ algorithm is observed to be significantly less in comparison to that obtained using the MFABC and PSO algorithms.

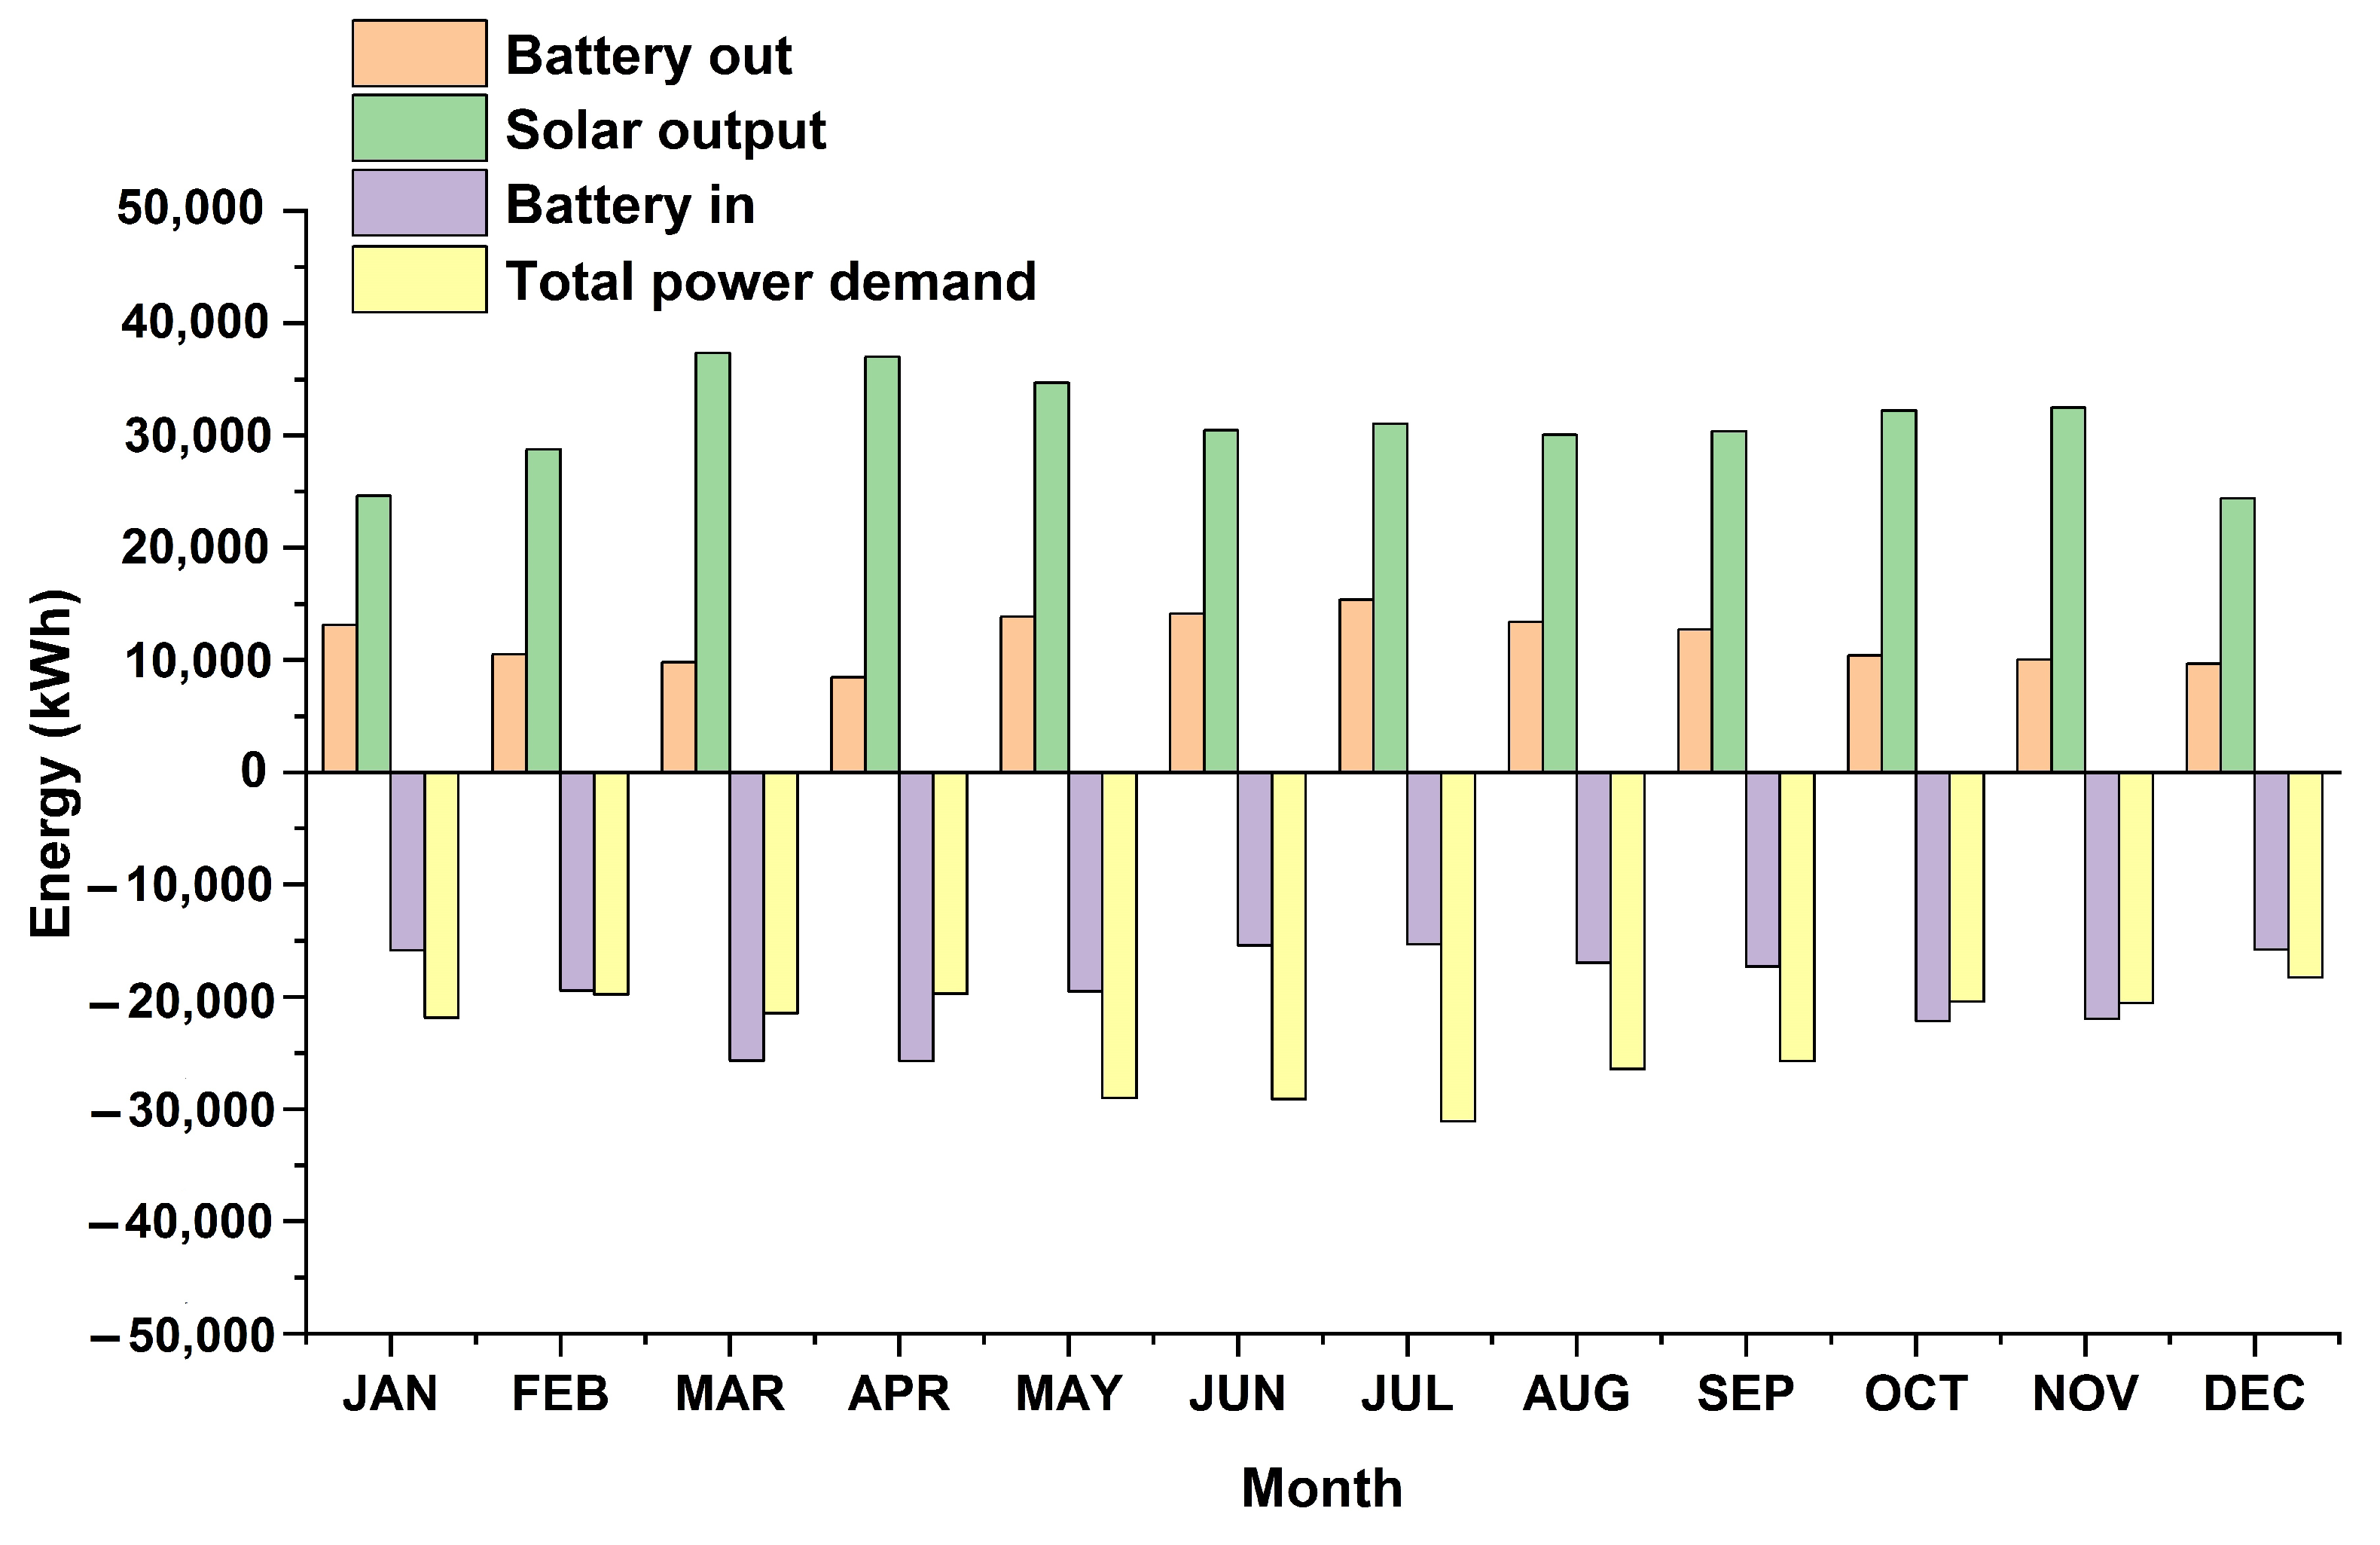
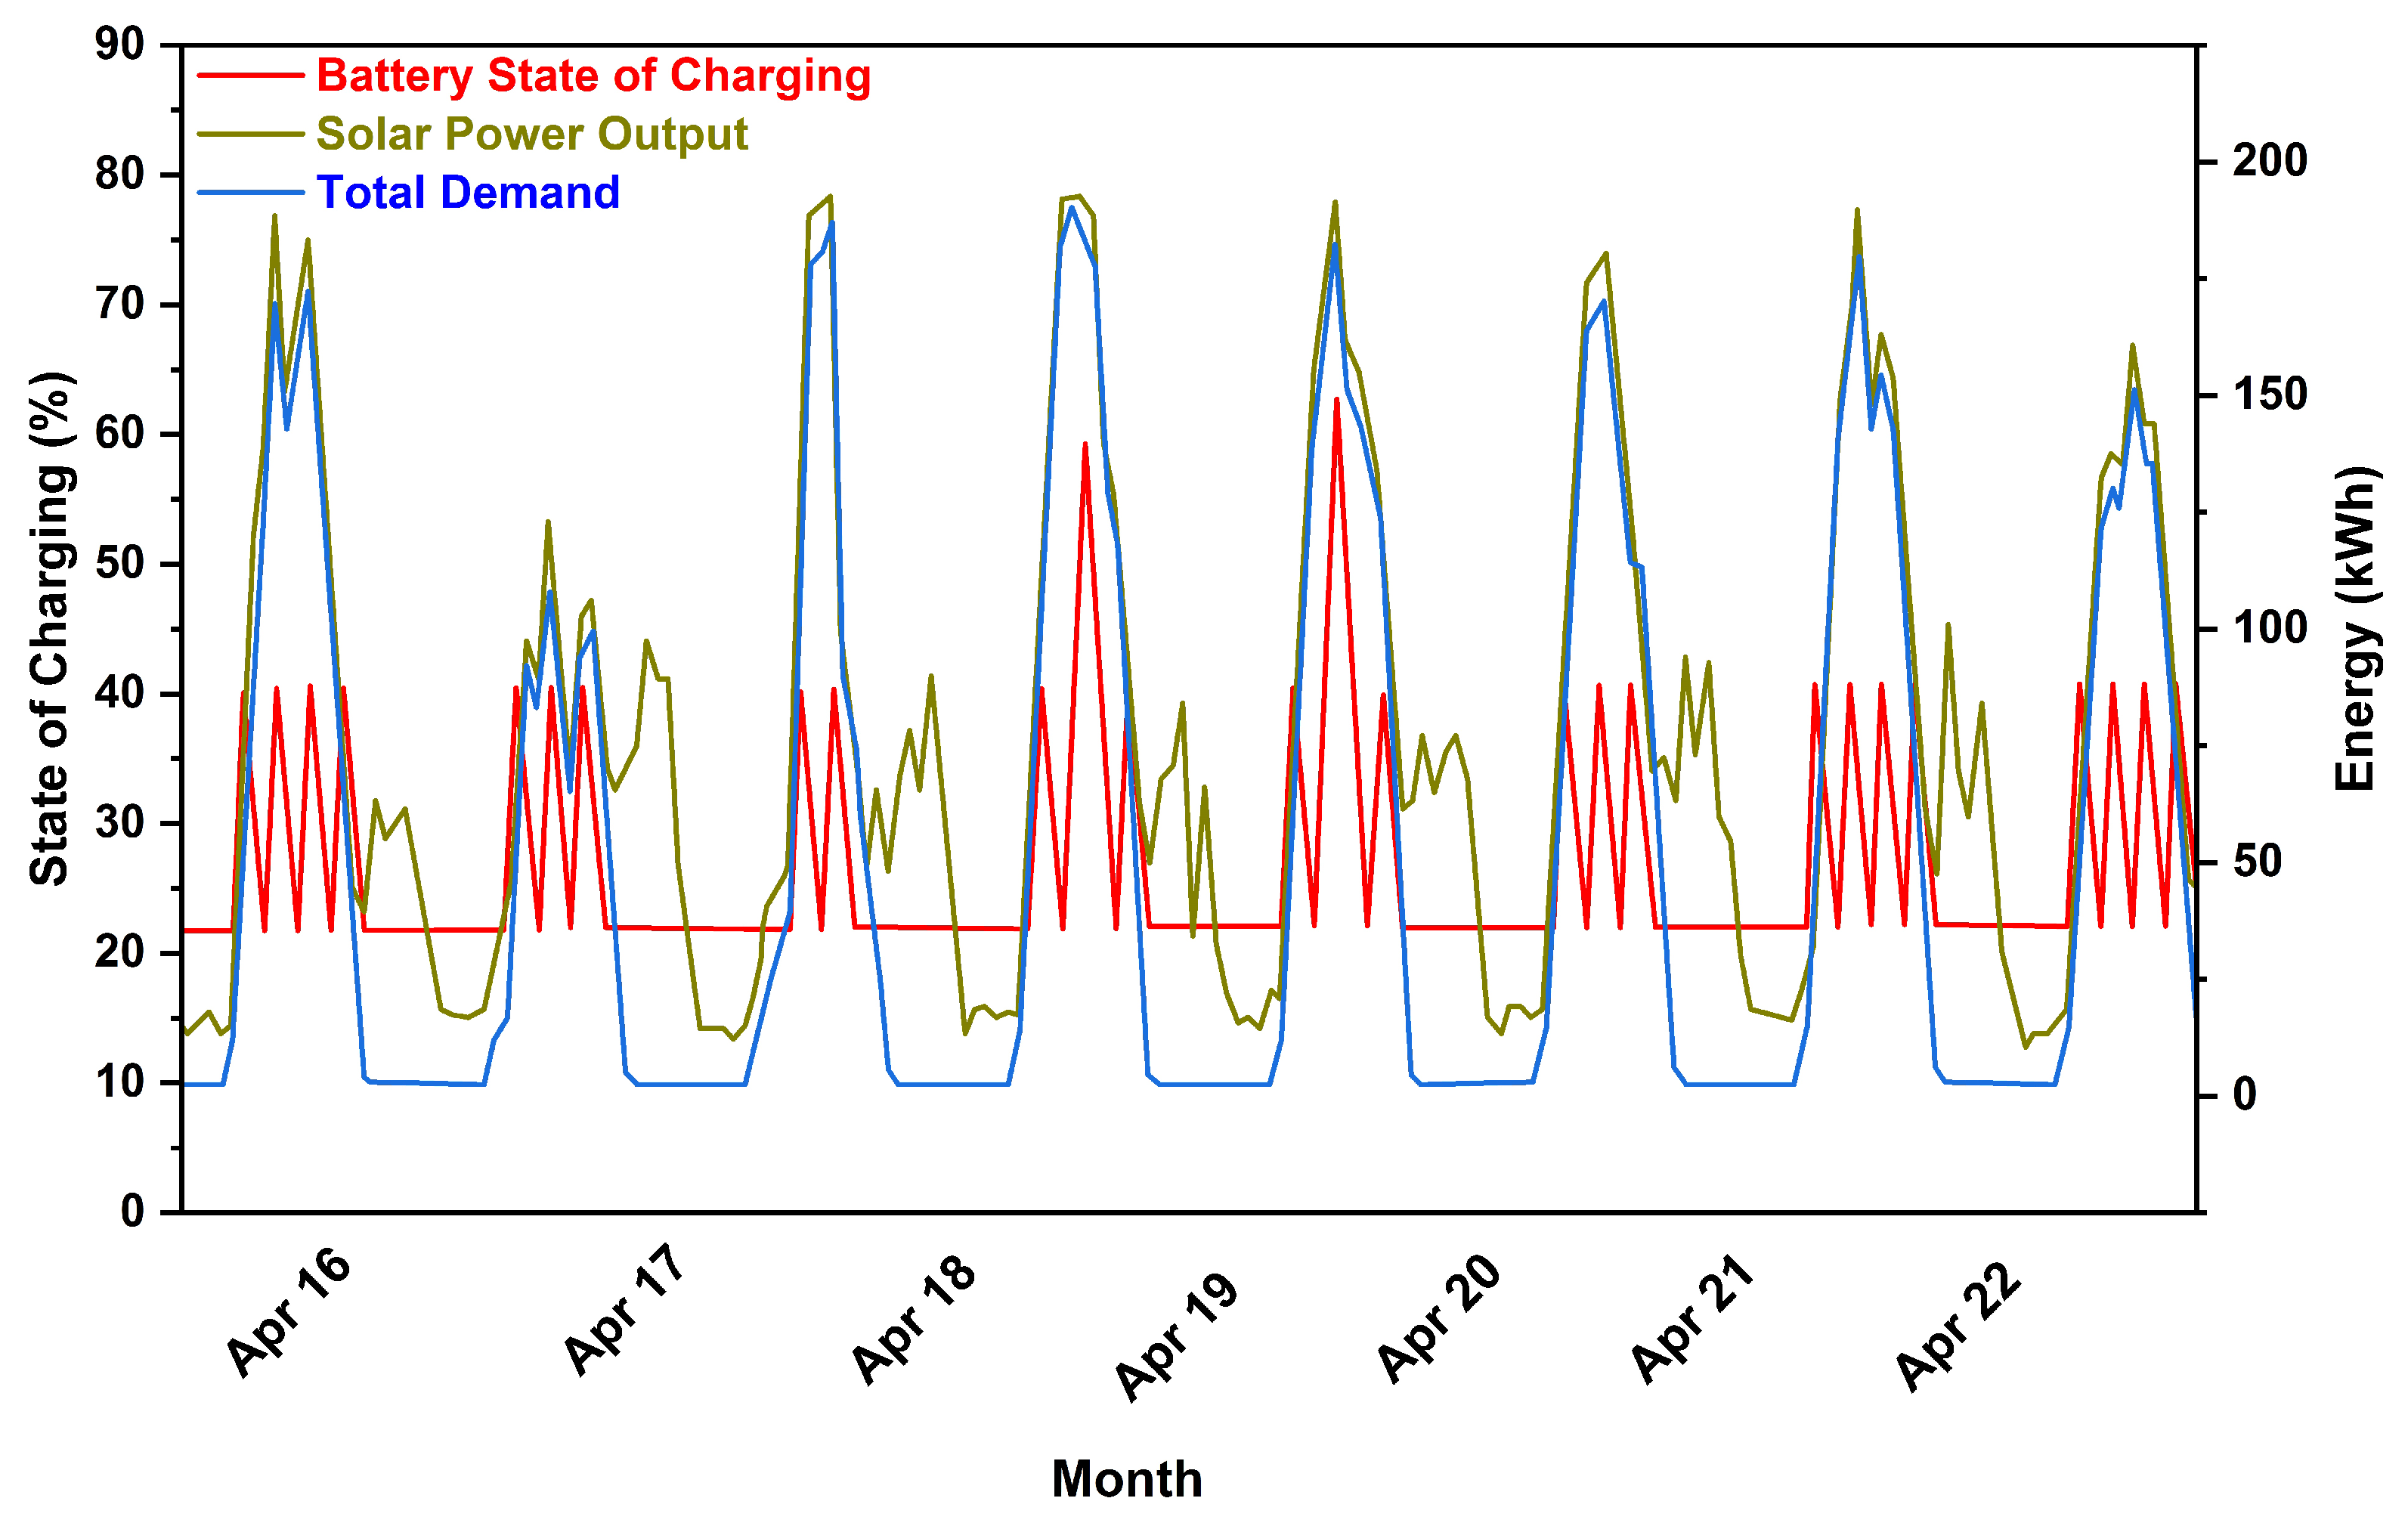
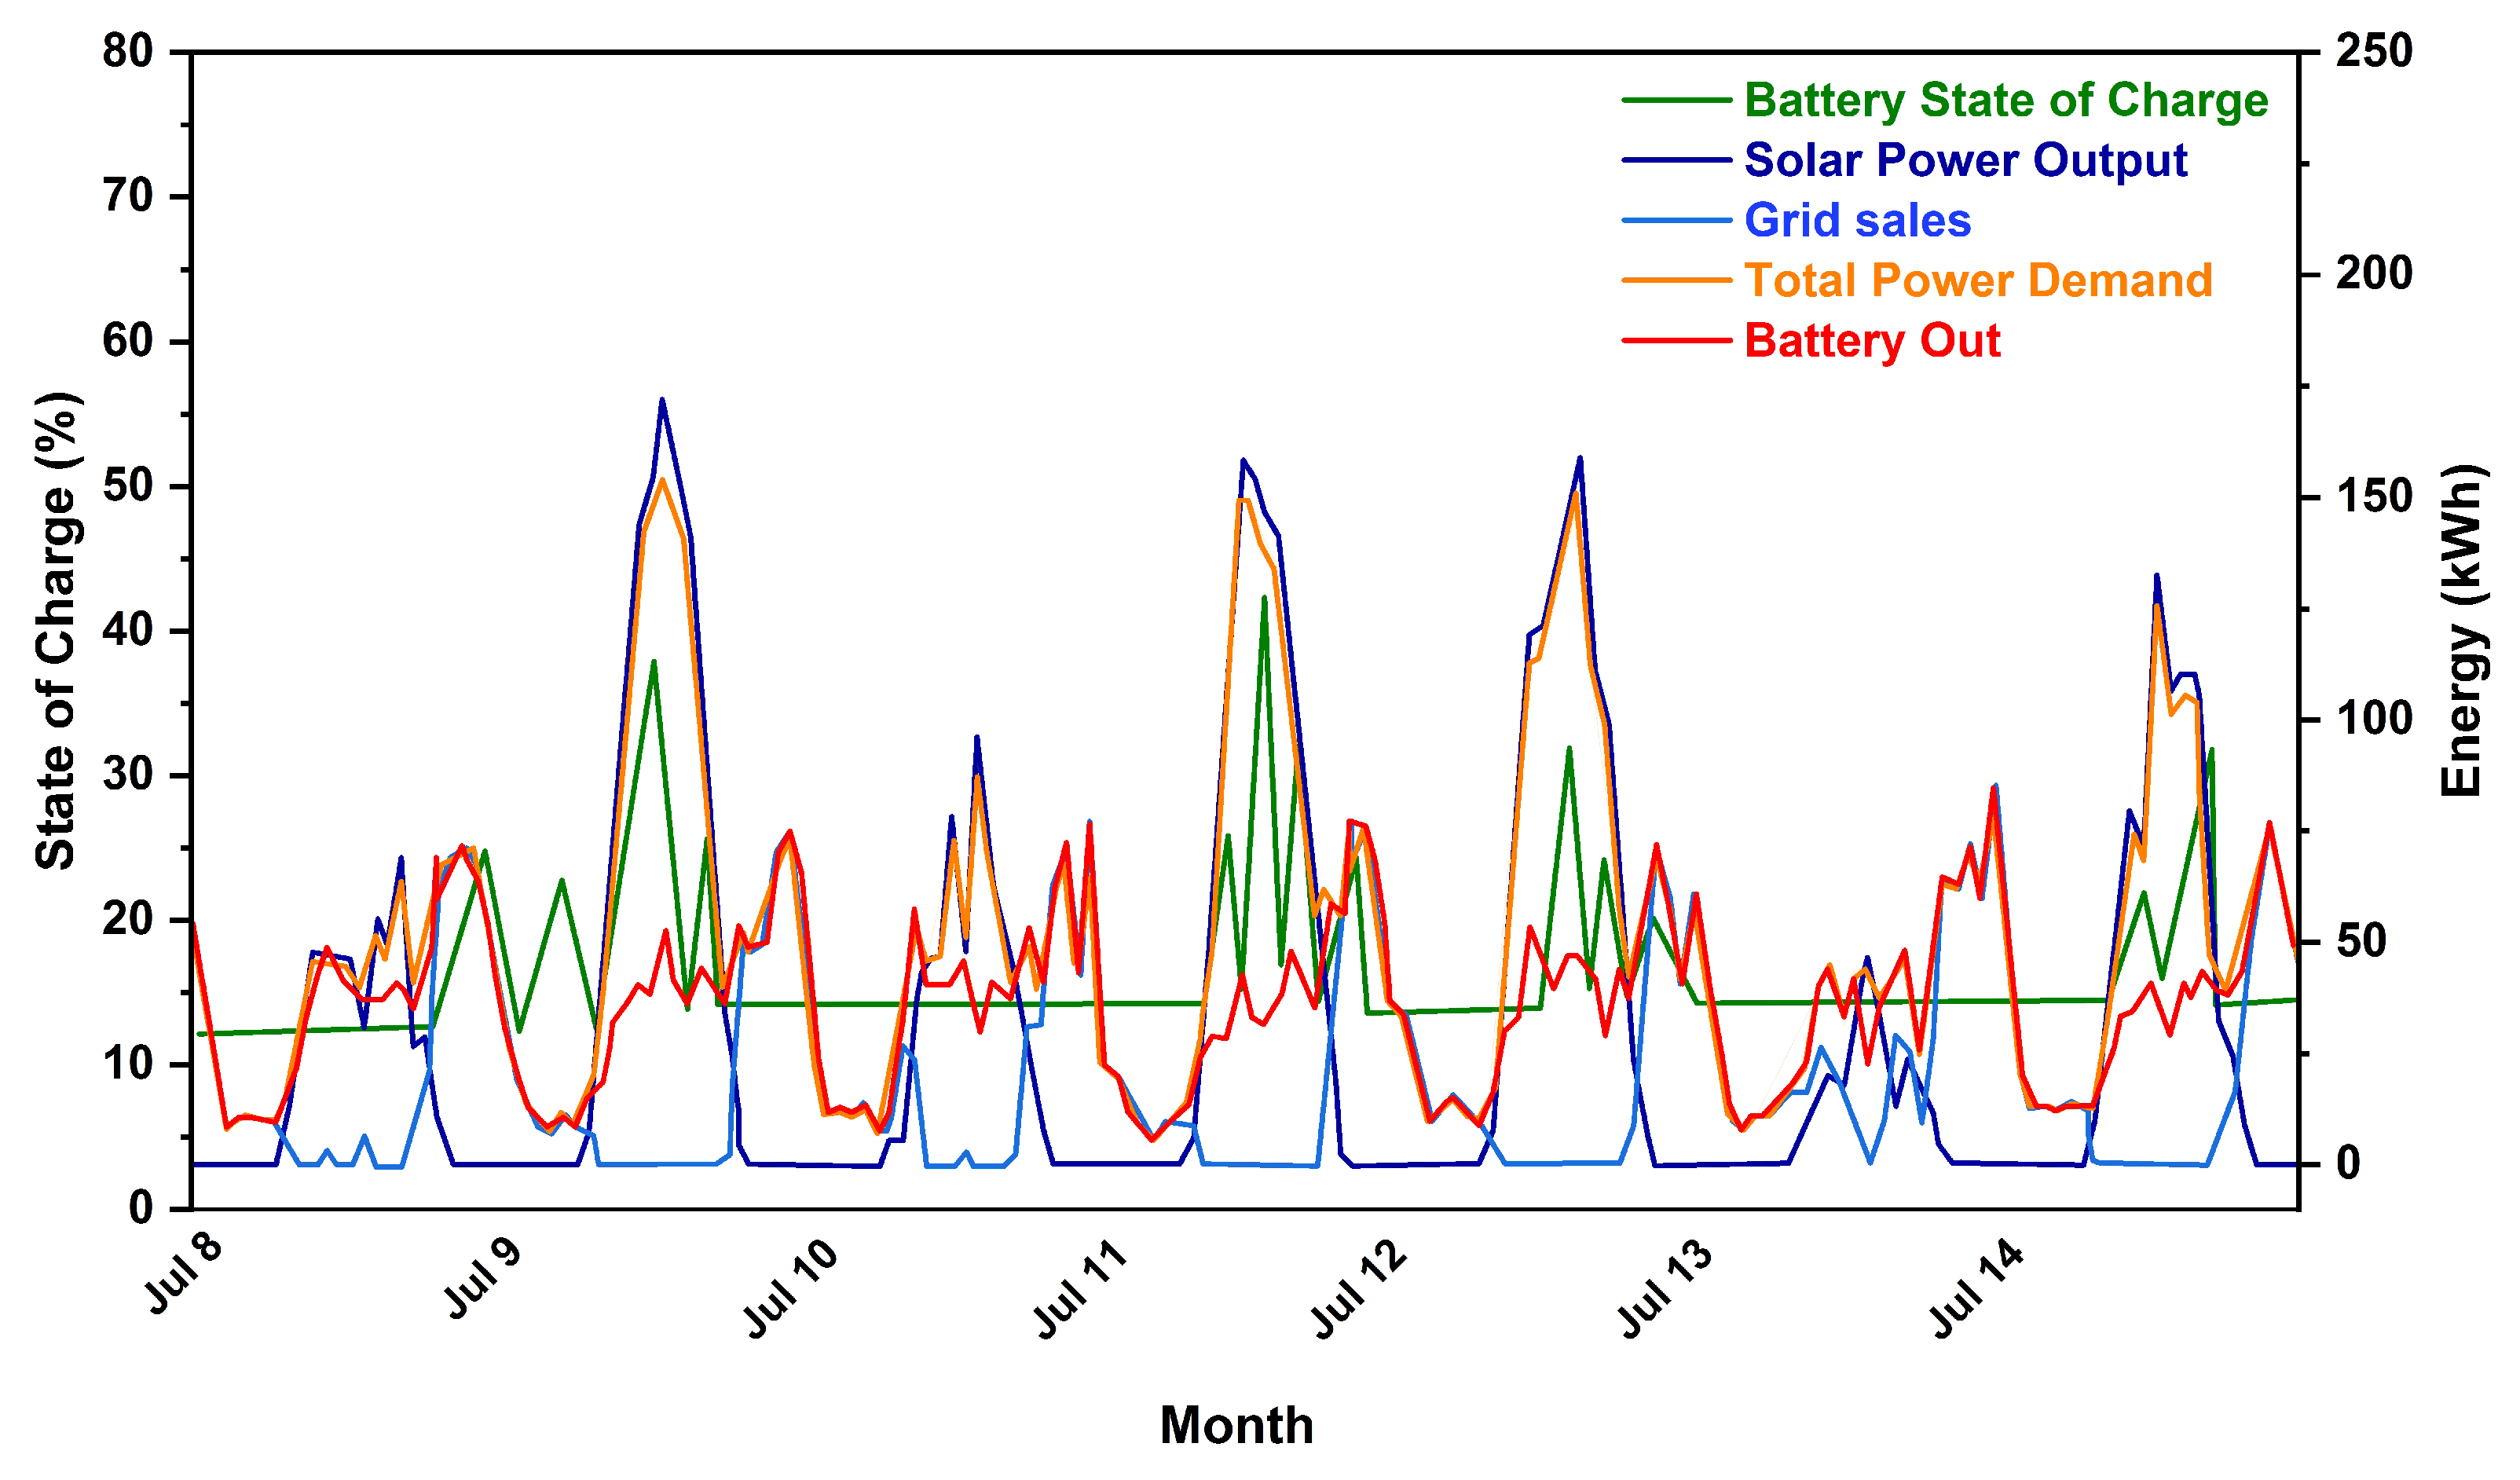
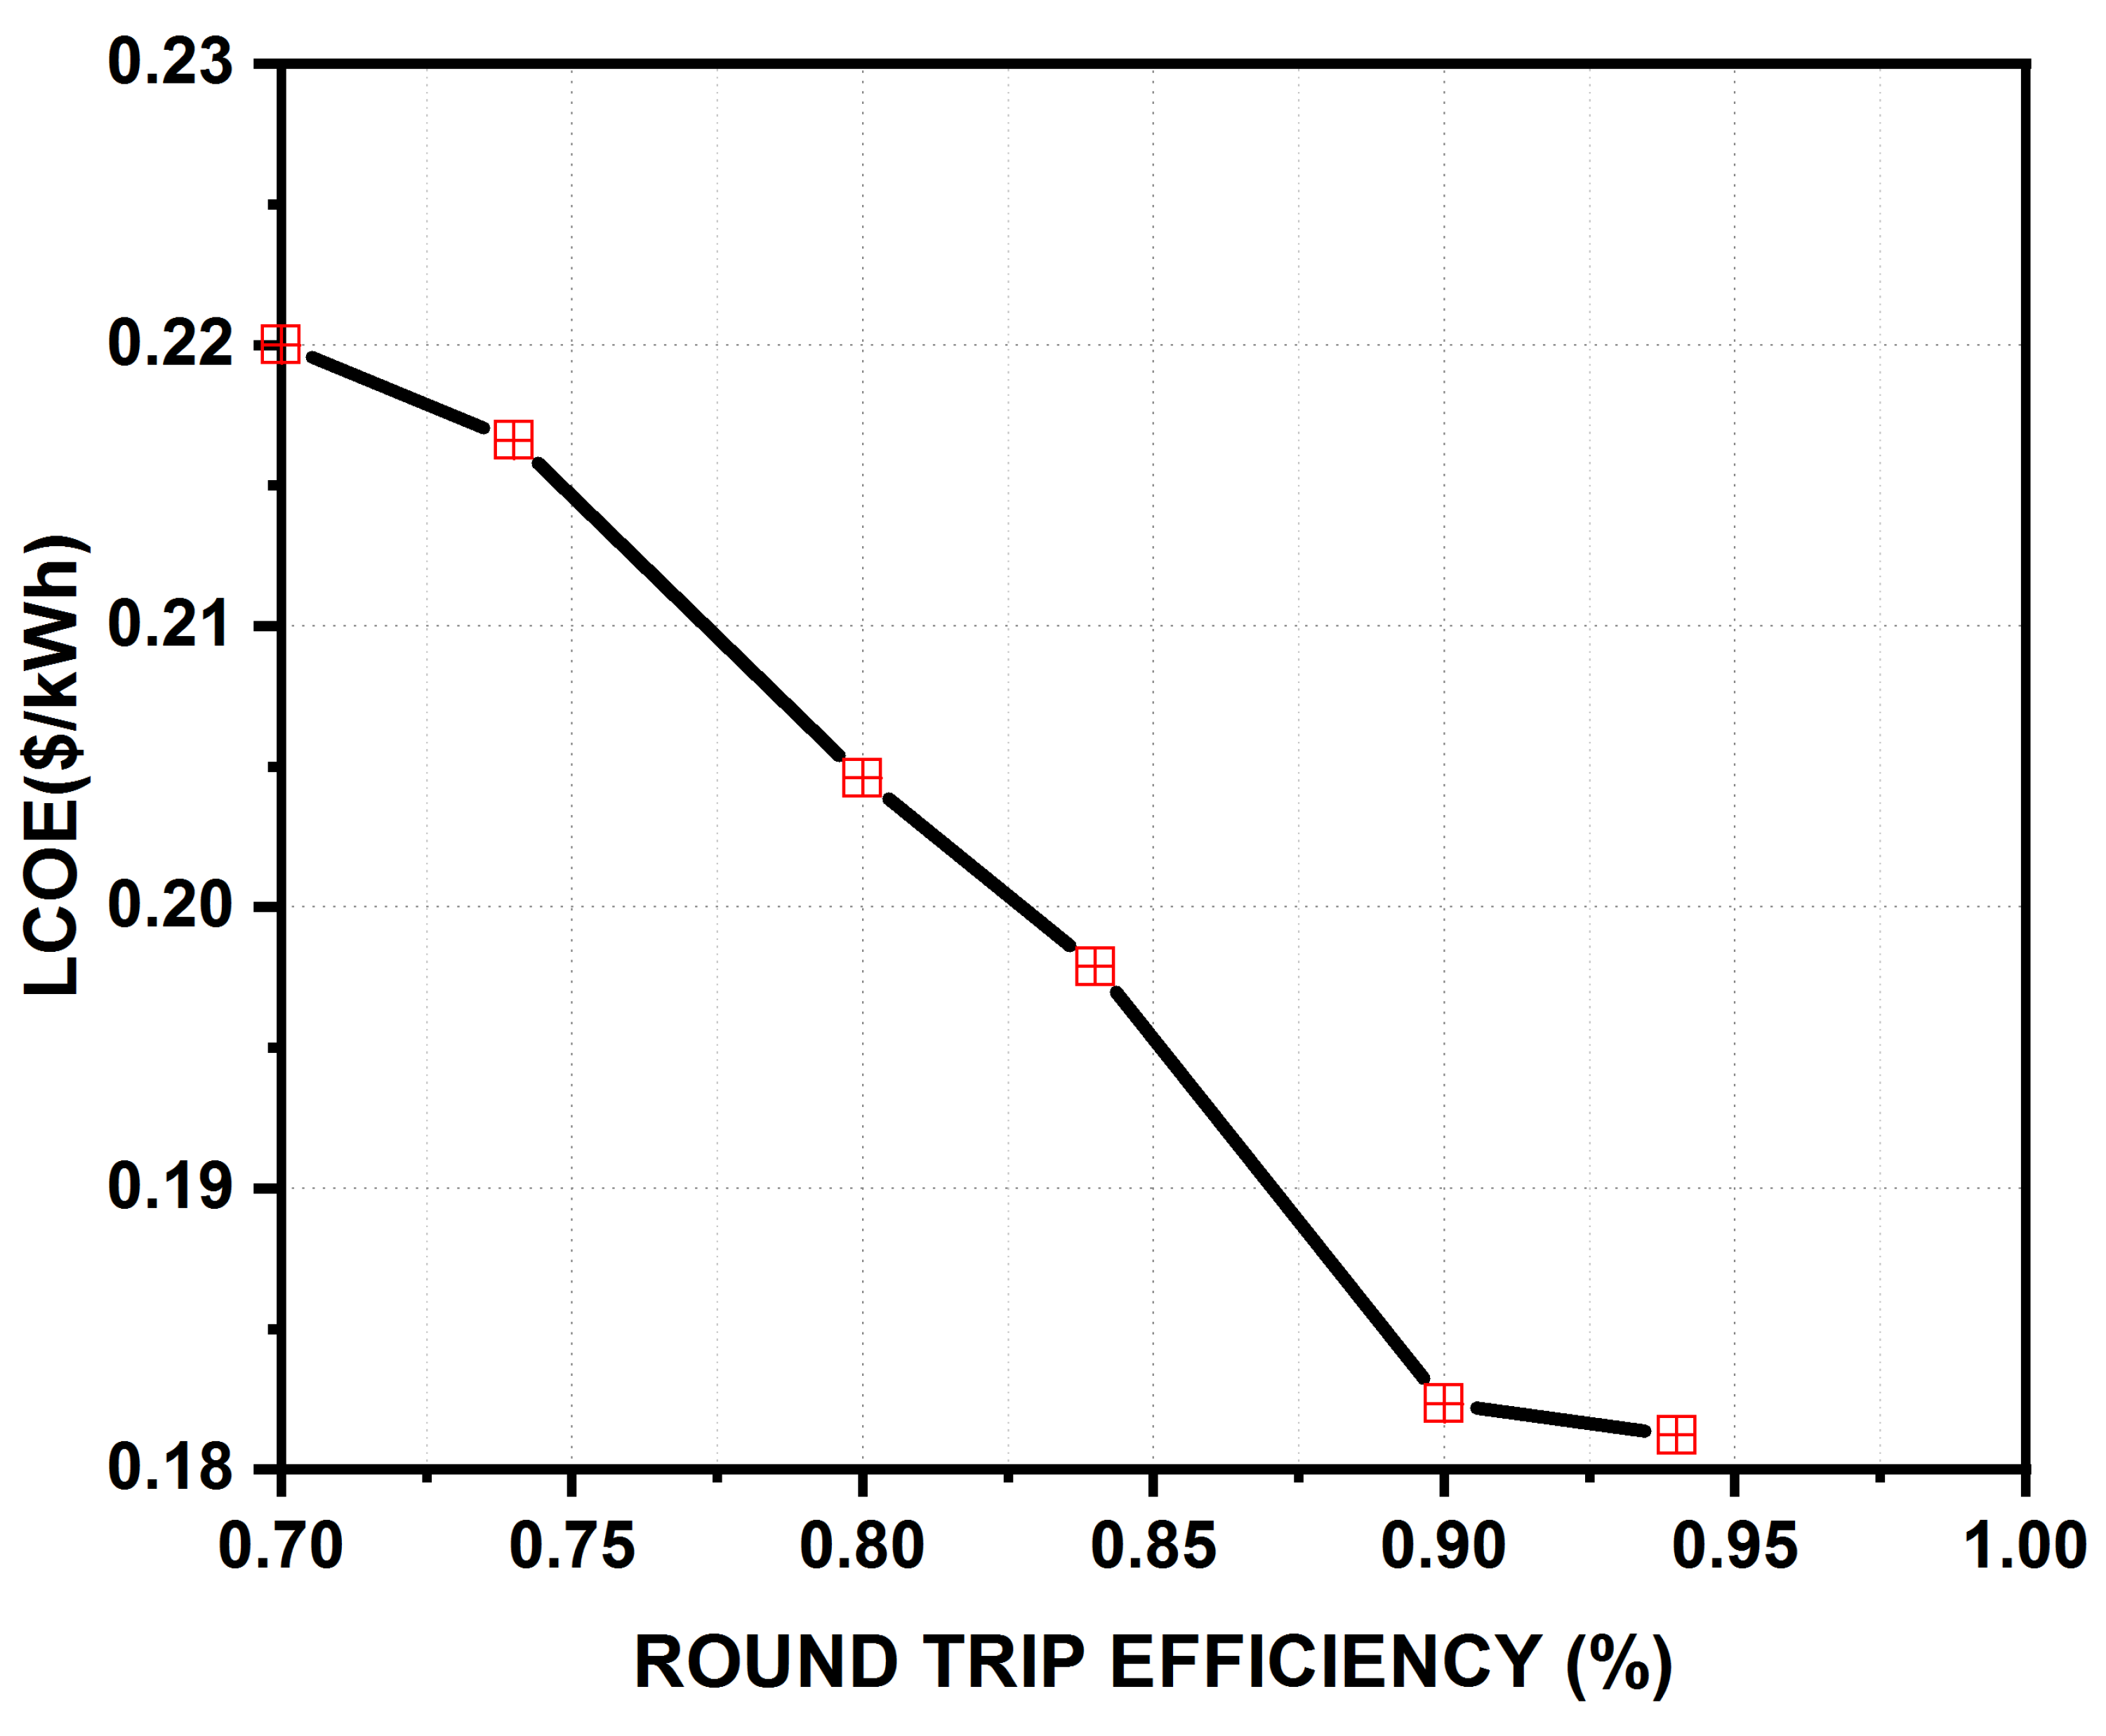
5.3. Battery’s Efficiency and LCOE

The effect on the LCOE of the proposed system was investigated with the different round trip efficiencies associated with the battery system considered. The results achieved so far were for the 95% round trip efficiency of the battery system. The efficiencies related to battery charging and discharging are considered to be 100% and 80%, respectively. In order to obtain more practical solution, the efficiencies associated with charging and discharging were considered to be the same. Figure 11 depicts the results obtained for different round trip efficiencies of the battery while keeping the charging and discharging efficiencies equal. The LCOE decreases with the increase in the round trip efficiency of the battery.

6. Conclusions

In this research, the feasibility of off-grid hybrid energy system for a rural area was investigated. The MFABC+ algorithm was proposed to predict the optimal size of different components within the proposed hybrid system. Mathematical modeling of different components within the system was delineated. The objective function is framed to obtain the optimal sizing of the components and to minimize the levelized cost of electricity. The results obtained using the MFABC+ algorithm were compared with other optimization techniques such as MFABC and PSO. Results are also compared with the solution obtained using HOMER software. The obtained results are found to be better in MFABC+ algorithm in comparison to the HOMER, MFABC and PSO algorithms. Through the investigation, it was revealed that the proposed optimal hybrid system satisfies the load demand of the community under consideration with due considerations to the constraints. As a future scope of the presented study, cost of the grid could be considered for the dynamic cost evaluation of the grid connected microgrid.

Author Contributions

S.S., A.S., N.K. and N.K.M. contributed equally to this work. All authors have read and agreed to the published version of the manuscript.

Funding

This research received no external funding.

Institutional Review Board Statement

Not applicable.

Informed Consent Statement

Not applicable.

Data Availability Statement

Not applicable.

Conflicts of Interest

The authors declare no conflict of interest.

Nomenclature

C a c p Capital and installment cost ($/yr)
C r p Replacement cost ($/yr)
C b t Cost of battery (per unit) ($/yr)
C n The capacity of a single battery (kW)
C o Cost of solar PV panel ($)
C o a c p Capital and installation cost of solar PV panel ($/yr)
C o r p The replacement cost of solar PV panel ($/yr)
C o a c The operational cost of solar PV panel ($/yr)
C o a m The annual maintenance cost of the solar PV panel ($/yr)
C o s l v g Salvage cost of solar PV panel ($/yr)
C b The capacity of a single battery (kW)
C b t s l v g Salvage cost of the battery (per unit) ($/yr)
C b t a c p Capital and installation cost of battery (per unit) ($/yr)
C b t r p the replacement cost of the battery (per unit) ($/yr)
C a c b t The operational cost of the battery (per unit) ($/yr)
C a m b t The annual maintenance cost of the battery (per unit) ($/yr)
C c o n Cost of converter ($/yr)
C c o n a c p Capital and installation cost of converter ($/yr)
C c o n r p The replacement cost of the converter ($/yr)
C c o n a c The operational cost of the converter ($/yr)
C c o n a m The annual maintenance cost of the converter ($/yr)
C c o n s l v g Salvage cost of converter ($/yr)
C s l v g Salvage cost ($)
DNumber of dimensions to be optimized
E g e n Energy generated by the integrated renewable energy system in t-th hour (kWh)
F D G Diesel fuel coefficient
F N Number of food sources
f l o s s Derating factor
G ( t ) Solar radiation (w/m 2 )
G h ( t ) Solar radiations incident hourly onto the solar panel (w/m 2 )
G s Standard incident radiation (w/m 2 )
G s t d Standard radiation for environment (w/m 2 )
I m x Maximum battery charging current (A)
M a x F E S Maximum number of function evaluations
N P Population size
N b t Number of batteries
N b t s Batteries connected in series
N o Solar photovoltaic system concerning total no of solution
N b a t t m Maximum number of batteries
N s o l m Maximum number of solar PV panels
P b t ( t ) Battery input/output power
P b t , m n Minimum generated battery capacity range (kW)
P b t , m x Maximum generated battery capacity range (kW)
P p c f Power conversion function associated with the SPV system
P c o n Size of the converter
P D G , g Diesel fuel is consumed by diesel generator
P d m p Excess or dump energy
P g r i d Power output from grid
P N S Energy not supplied
P l m Peak power demand with respect to the time (kW)
P p v s Total power produced by SPV system (kW)
P s n Conversion function associated with the SPV
P s r SPV panel rating (kW)
P p L m ( t ) Peak load (kW)
P D G , r ( t ) Rated capacity of the DG (kW)
P D G , g ( t ) Output power from DG (kW)
P o Power output from solar PV (kW)
p f Probability function
R c Cut in radiation point (w/m 2 )
S O C m n Minimum value associated with the state of charge of the battery system
S O C m x Maximum value associated with the state of charge of the battery system
S O C ( t ) The SOC of the battery at any given tth hour.
V b s Bus voltage (V)
V b t Voltage associated with a single battery (V)
η b t Round trip efficiency associated with a single battery
η b t c Charging efficiency of the battery
η b t d Discharging efficiency
η i n v Inverter efficiency
α D G Fuel curve intercept coefficient (L/h/ k W r a t e d )
β D G Diesel curve intercept coefficient (L/h/ k W o u t p u t )
γ Annual discount rate ($)
τ Life of the plant (year)

References

  1. Mamaghani, A.H.; Escandon, S.A.A.; Najafi, B.; Shirazi, A.; Rinaldi, F. Techno-economic feasibility of photovoltaic, wind, diesel and hybrid electrification systems for off-grid rural electrification in Colombia. Renew. Energy 2016, 97, 293–305. [Google Scholar] [CrossRef]
  2. Entering, A.; Gas, A.G.A.O. World Energy Outlook; International Energy Agency: Paris, France, 2011. [Google Scholar]
  3. Bhatt, A.; Sharma, M.P.; Saini, R.P. Feasibility and sensitivity analysis of an off-grid micro hydro-photovoltaic-biomass and biogas-diesel-battery hybrid energy system for a remote area in Uttarakhand state, India. Renew. Sustain. Energy Rev. 2016, 61, 53–69. [Google Scholar] [CrossRef]
  4. Chauhan, A.; Saini, R.P. Discrete harmony search based size optimization of integrated renewable energy system for remote rural areas of Uttarakhand state in India. Renew. Energy 2016, 94, 587–604. [Google Scholar] [CrossRef]
  5. Castellanos, J.G.; Walker, M.; Poggio, D.; Pourkashanian, M.; Nimmo, W. Modelling an off-grid integrated renewable energy system for rural electrification in India using photovoltaics and anaerobic digestion. Renew. Energy 2015, 74, 390–398. [Google Scholar] [CrossRef] [Green Version]
  6. Halabi, L.M.; Mekhilef, S. Flexible hybrid renewable energy system design for a typical remote village located in tropical climate. J. Clean. Prod. 2018, 177, 908–924. [Google Scholar] [CrossRef]
  7. Halabi, L.M.; Mekhilef, S.; Olatomiwa, L.; Hazelton, J. Performance analysis of hybrid PV/diesel/battery system using HOMER: A case study Sabah, Malaysia. Energy Convers. Manag. 2017, 144, 322–339. [Google Scholar] [CrossRef]
  8. Shezan, S.A.; Julai, S.; Kibria, M.A.; Ullah, K.R.; Saidur, R.; Chong, W.T.; Akikur, R.K. Performance analysis of an off-grid wind-PV (photovoltaic)-diesel-battery hybrid energy system feasible for remote areas. J. Clean. Prod. 2016, 125, 121–132. [Google Scholar] [CrossRef]
  9. Rajanna, S.; Saini, R.P. Modeling of integrated renewable energy system for electrification of a remote area in India. Renew. Energy 2016, 90, 175–187. [Google Scholar] [CrossRef]
  10. Chauhan, A.; Saini, R.P. A review on Integrated Renewable Energy System based power generation for stand-alone applications: Configurations, storage options, sizing methodologies and control. Renew. Sustain. Energy Rev. 2014, 38, 99–120. [Google Scholar] [CrossRef]
  11. Mandelli, S.; Merlo, M.; Colombo, E. Novel procedure to formulate load profiles for off-grid rural areas. Energy Sustain. Dev. 2016, 31, 130–142. [Google Scholar] [CrossRef]
  12. Ramchandran, N.; Pai, R.; Parihar, A.K.S. Feasibility assessment of Anchor-Business-Community model for off-grid rural electrification in India. Renew. Energy 2016, 97, 197–209. [Google Scholar] [CrossRef]
  13. Li, B.; Roche, R.; Miraoui, A. Microgrid sizing with combined evolutionary algorithm and MILP unit commitment. Appl. Energy 2017, 188, 547–562. [Google Scholar] [CrossRef] [Green Version]
  14. Singh, S.; Singh, M.; Kaushik, S.C. Feasibility study of an islanded microgrid in rural area consisting of PV, wind, biomass and battery energy storage system. Energy Convers. Manag. 2016, 128, 178–190. [Google Scholar] [CrossRef]
  15. Kim, H.; Jung, T.Y. Independent solar photovoltaic with Energy Storage Systems (ESS) for rural electrification in Myanmar. Renew. Sustain. Energy Rev. 2018, 82, 1187–1194. [Google Scholar] [CrossRef]
  16. Mazzola, S.; Astolfi, M.; Macchi, E. The potential role of solid biomass for rural electrification: A techno economic analysis for a hybrid microgrid in India. Appl. Energy 2016, 169, 370–383. [Google Scholar] [CrossRef]
  17. Upadhyay, S.; Sharma, M.P. Selection of a suitable energy management strategy for a hybrid energy system in a remote rural area of India. Energy 2016, 94, 352–366. [Google Scholar] [CrossRef]
  18. Maleki, A.; Pourfayaz, F.; Rosen, M.A. A novel framework for optimal design of hybrid renewable energy-based autonomous energy systems: A case study for Namin, Iran. Energy 2016, 98, 168–180. [Google Scholar] [CrossRef]
  19. Ogunjuyigbe, A.S.O.; Ayodele, T.R.; Akinola, O.A. Optimal allocation and sizing of PV/Wind/Split-diesel/Battery hybrid energy system for minimizing life cycle cost, carbon emission and dump energy of remote residential building. Appl. Energy 2016, 171, 153–171. [Google Scholar] [CrossRef]
  20. Ramli, M.A.; Hiendro, A.; Twaha, S. Economic analysis of PV/diesel hybrid system with flywheel energy storage. Renew. Energy 2015, 78, 398–405. [Google Scholar] [CrossRef]
  21. Kolhe, M.L.; Ranaweera, K.I.U.; Gunawardana, A.S. Techno-economic sizing of off-grid hybrid renewable energy system for rural electrification in Sri Lanka. Sustain. Energy Technol. Assess. 2015, 11, 53–64. [Google Scholar] [CrossRef]
  22. Singh, S.S.; Fernandez, E. Modeling, size optimization and sensitivity analysis of a remote hybrid renewable energy system. Energy 2018, 143, 719–731. [Google Scholar] [CrossRef]
  23. Bordin, C.; Anuta, H.O.; Crossland, A.; Gutierrez, I.L.; Dent, C.J.; Vigo, D. A linear programming approach for battery degradation analysis and optimization in offgrid power systems with solar energy integration. Renew. Energy 2017, 101, 417–430. [Google Scholar] [CrossRef] [Green Version]
  24. Lai, C.S.; Jia, Y.; Xu, Z.; Lai, L.L.; Li, X.; Cao, J.; McCulloch, M.D. Levelized cost of electricity for photovoltaic/biogas power plant hybrid system with electrical energy storage degradation costs. Energy Convers. Manag. 2017, 153, 34–47. [Google Scholar] [CrossRef]
  25. Rajbongshi, R.; Borgohain, D.; Mahapatra, S. Optimization of PV-biomass-diesel and grid base hybrid energy systems for rural electrification by using HOMER. Energy 2017, 126, 461–474. [Google Scholar] [CrossRef]
  26. Ahmadi, S.; Abdi, S. Application of the Hybrid Big Bang–Big Crunch algorithm for optimal sizing of a stand-alone hybrid PV/wind/battery system. Sol. Energy 2016, 134, 366–374. [Google Scholar] [CrossRef]
  27. Ahmad, J.; Imran, M.; Khalid, A.; Iqbal, W.; Ashraf, S.R.; Adnan, M.; Khokhar, K.S. Techno economic analysis of a wind-photovoltaic-biomass hybrid renewable energy system for rural electrification: A case study of Kallar. Energy 2018, 148, 208–234. [Google Scholar] [CrossRef]
  28. Sandwell, P.; Chan, N.L.A.; Foster, S.; Nagpal, D.; Emmott, C.J.; Candelise, C.; Nelson, J. Off-grid solar photovoltaic systems for rural electrification and emissions mitigation in India. Sol. Energy Mater. Sol. Cells 2016, 156, 147–156. [Google Scholar] [CrossRef]
  29. Nacer, T.; Hamidat, A.; Nadjemi, O.; Bey, M. Feasibility study of grid connected photovoltaic system in family farms for electricity generation in rural areas. Renew. Energy 2016, 96, 305–318. [Google Scholar] [CrossRef]
  30. Maisanam, A.K.S.; Podder, B.; Biswas, A.; Sharma, K.K. Site-specific tailoring of an optimal design of renewable energy system for remote water supply station in Silchar, India. Sustain. Energy Technol. Assess. 2019, 36, 100558. [Google Scholar] [CrossRef]
  31. Song, X.; Zhao, M.; Xing, S. A multi-strategy fusion artificial bee colony algorithm with small population. Expert Syst. Appl. 2020, 142, 112921. [Google Scholar] [CrossRef]
  32. Chen, Y.; Roux, B. Generalized Metropolis acceptance criterion for hybrid non-equilibrium molecular dynamics-Monte Carlo simulations. J. Chem. Phys. 2015, 142, 024101. [Google Scholar] [CrossRef] [PubMed]
Figure 1. Seasonal variation of load demand of the area.
Energies 14 00190 g001
Figure 2. An illustration of proposed microgrid system.
Energies 14 00190 g002
Figure 3. Monthly average hourly global solar radiation.
Energies 14 00190 g003
Figure 4. Flowchart for working of the proposed hybrid microgrid system.
Energies 14 00190 g004
Figure 5. Convergence characteristics of PSO, MFABC and MFABC+.
Energies 14 00190 g005
Figure 6. Energy analysis of the proposed microgrid system for one year.
Energies 14 00190 g006
Figure 7. Battery SOC and energy balance of hybrid microgrid system for the third week of April.
Energies 14 00190 g007
Figure 8. Battery SOC and energy balance of hybrid microgrid system for the third week of July.
Energies 14 00190 g008
Figure 9. Battery SOC and energy balance of hybrid microgrid system for the third week of December.
Energies 14 00190 g009
Figure 10. The monthly average SOC of the battery.
Energies 14 00190 g010
Figure 11. Variation in LCOE of the system with battery round trip efficiency.
Energies 14 00190 g011
Table 1. Estimated load demand for the village area under consideration.
SNDomestic Electrical LoadNo of LoadPower (W)Summer (May–August)Autumn (September–October)Winter (November–Feburary)Spring (Feburary–April)
h/dayWatt-h/dayh/dayWatt-h/dayh/dayWatt-h/dayh/dayWatt-h/day
1CFL-I4238736873687368736
2CFL-II111888888888888
3Ceiling Fan11202024002240008960
4Kitchen fan110066002200006600
5Cooler2120102400000000
6Television11008800880088008800
7Computer130041200412004120041200
8Exhaust115575575575575
9Table fan11581200000575
10Room Heater112000000000
11Bulb11001100110011001100
6119 3439 2999 4634
Total Load demand: 17,191; Total number of houses: 45; Total demand for one year = 45 × 17,191; Total demand (Wh) = 859,550.
Table 2. Techno-economic data associated with the different components of the proposed system.
S.No.Objective ComponentsObjective ParametersValueUnit
1SPVPhotovoltaic Power Rating1kW
PV Capital Expenses933.33$
PV Replacement Cost800.00$
Operation and Maintenance Cost13.33$/kW
Derating Factor88%
Photovoltaic Life20years
2ConverterConverter Power Rating1kW
Capital cost of the converter133.33$
Replacement Cost of the converter106.67$
Operation and Maintenance Cost160 $ / yr
Overall Converter Efficiency90%
Converter Life20Years
3BESSBattery Capital-Cost133.33$
Replacement Cost56.00$
Operation and Maintenance Cost1.33$
Size of the unit battery2.1kW
Battery Rated voltage6Volt
Minimum SOC30%
Maximum SOC100%
Efficiency95%
Life of Battery5Year
4DGsCapital Expenses9467$
Replacement Cost28.35$
Operation and Maintenance Cost2449.5$/kw
Efficiency80%
Life25year
4GridSupply Cost10$
5OtherRate for discount6%
Life of Project20Year
Table 3. Parameters considered for simulation using PSO, MFABC and MFABC+ algorithms.
PSO AlgorithmMFABC AlgorithmMFABC+ Algorithm
Dimension (D): 4Dimension (D1): 4Dimension (D2): 4
Propulsion size (N): 20Employed Bees = Onlooker
bees:10
Employed bees (ABC/best) = Onlooker
bees(CABC):12
Initial weight ( W m n ): 0.3Colony size (NP): 20Colony size (NP1): 40
Final weight ( W m n ): 0.8Food Number: NP/2Food number: NP1/4
Maximum Iteration ( I t m x ): 100Maximum cycle: 100Maximum Iteration: 100
Weighting factor: (C1 and C2):2Limit: 100Limit: 100
Table 4. Results obtained using all solution methods.
ParametersPSOHOMERMFABCMFABC+
PV units235244232230
Battery units80010001000800
Inverter sizing (kW)110110110110
ASC($/yr)61,58463,57361,00656,002
TNPC ($)730,011739,980723,378700,000
LCOE ($/kWh)0.1980.2010.1960.195
Table 5. Results obtained using all solution methods (contd.).
ComponentsHOMER (kWh/yr)PSO (kWh/yr)MFABC (kWh/yr)MFABC+ (kWh/yr)
Solar492,134410,024400,201421,257
Battery in178,840241,580287,348280,243
Battery out158,470121,542145,203160,232
Total demand served291,678345,167321,450355,230
Excess electricity128,087754068975320
Table 6. ASC analysis and cost contribution of different components using MFABC+ algorithm.
ComponentsCapital Cost ($/yr)Replacement Cost ($/yr)Maintenance Cost ($/yr)Salvage Cost ($/yr)Total Cost ($/yr)
PV51,014-371646455,194
Batteries33,7659876176-43,817
Inverter10,9251012862-12,799
Total95,70410,8884,754464111,810
Publisher’s Note: MDPI stays neutral with regard to jurisdictional claims in published maps and institutional affiliations.

