Article

Optimization of the Urea Injection Angle and Direction: Maximizing the Uniformity Index of a Selective Catalytic Reduction System

1
Powertrain Efficiency R&D Center, Korea Automotive Technology Institute, 303, Pungse-ro, Pungse-myeon, Dongnam-gu, Cheonan-si 31214, Korea
2
Engin Development Team, Daedong Industrial Co., Ltd., 602, Nongong-ro, Nongong-eub, Dalseong-gun 42981, Korea
3
TESK R&D Center, 20, Saneopdanji-ro, Eomo-myeon, Gimcheon-si 39536, Korea
*
Author to whom correspondence should be addressed.
Energies 2021, 14(1), 157; https://doi.org/10.3390/en14010157
Submission received: 2 December 2020 / Revised: 23 December 2020 / Accepted: 25 December 2020 / Published: 30 December 2020
(This article belongs to the Special Issue Exhaust Emissions from Passenger Cars)

Abstract

:
The uniformity of ammonia is very crucial for reducing the NOX emissions in a selective catalytic reduction system since the uniformity highly affects the chemical reaction between the ammonia and NOX emission. However, increasing ammonia uniformity in a short time period while injecting a urea solution is not a trivial task. Therefore, in this study, the uniformity of various urea injector designs is compared and an optimal design for the urea injector angle and direction is selected. The uniformity index (UI) was calculated using numerical analysis and compared with experimental result to achieve high reliability. The boundary condition of the analysis is extracted from the dominant operating region of the non-road transient cycle (NRTC) to guarantee a realistic analysis result. The design candidates were generated from the combination of three urea injection angles and eight urea injection directions and thoroughly compared to provide an insightful analysis. The conclusion is that injecting urea in the opposite direction to the main stream of exhaust gas increases the kinetic energy and thus the uniformity is highly increased. For example, urea injection in the opposite direction and angle to the mainstream flow could increase the UI to 0.966, which is a 16.7% improvement compared to the same direction and angle injection.

1. Introduction

Diesel engines have the advantages of a high thermal efficiency and reliability compared to other internal combustion engines. Furthermore, application of the material properties of the fuel and the high-pressure injector technology, Common Rail Direct Injection (CRDI), resulted in the simultaneous increase in these engines’ performance and their market [1]. However, despite the high thermal efficiency of compression ignition engines, these engines have the disadvantage of producing a large amount of exhaust gas compared to spark ignition engines. Recently, with increasing attention toward the environmental pollution of automobiles, strengthened emissions regulations were adopted, making the installation of additional aftertreatment equipment inevitable [2,3]. For diesel engines, three-way catalyst devices cannot be installed due to the low exhaust gas temperature and operating air–fuel ratio; numerous aftertreatment equipment installations are necessary [4,5].
Currently, rather than pretreatment, regulations are satisfied through the use of aftertreatment equipment for most of the automobile exhaust gas. Beginning with the adoption of the off-road exhaust gas regulation Euro 6 in 2014, the off-road engine regulation Tier 4 Final was implemented in 2015, requiring the development of exhaust gas aftertreatment technologies [6]. The existing aftertreatment equipment satisfied the exhaust gas regulations by installing a diesel oxidation catalyst (DOC), diesel particulate filter (DPF), or lean NOX trap (LNT), which operate without an additional injection system. Installation of selective catalytic reduction (SCR) devices became inevitable on all diesel vehicles with the enforcement of Euro 6 D [7,8]. Simultaneously, strengthening of the off-road emissions regulations made SCR installation necessary for diesel internal combustion engines regardless of whether they were on-road or off-road. The biggest reason for the delay in SCR applications is the need to additionally install a urea injection device and management system necessary for the reaction, unlike the conventional catalyst system. The SCR system is evaluated as an environmentally friendly exhaust gas aftertreatment device because it can reduce most of the carbon monoxide and NOX emissions produced from combustion [9].
SCR is largely composed of a storage tank, urea injection nozzle, control module, and catalyst. SCR requires a supply of urea for the catalyst reaction; an additional thawing module is necessary due to the risk of freezing in cold weather as the freezing point of urea is −11 °C. The NOX exchange rate increases for exhaust gas temperatures of 250 °C and higher, facilitating the reaction of the SCR catalyst. The exchange efficiency of the catalyst is proportional to the urea injection amount and catalyst urea distribution. Generally, a mixer is added to the outlet of the injection nozzle to increase the catalyst efficiency and improve the urea distribution and evaporation amount. Double-layered catalyst structure SCR development is being actively carried out to collect residual ammonia from the reaction through AOC coating of the outlet of the catalyst [10].
The SCR catalysts can be largely categorized into the primary catalyst that the urea and exhaust gas react to and the secondary catalyst with an AOC coating added to prevent the residual ammonia from the reaction with the primary catalyst from entering the atmosphere. Ammonia is an irritant substance that can affect biological tissue. Exposure to 10 ppm or more of ammonia can cause eye and respiratory problems. Thus, along with the adoption of the Euro 6 standard, additional catalyst (AOC coating) installation is mandatory to reduce slip ammonia in the SCR-installed vehicle. For the urea used in SCR, urea is diluted in distilled water (urea 32.5%, distilled water 67.5%) and this aqueous solution is injected for vaporization and interaction in the catalytic reaction. Ammonia, an alkaline substance, has the problem of negatively impacting the catalyst durability when the urea that did not vaporize at the inlet of the catalyst is transported. Accordingly, development companies are carrying out research in urea evaporation amount and distribution improvement by installing a device with a mixer shape between the catalyst and nozzle [11,12,13].
The NOX uniformity index (UI) results of the SCR catalyst outlet play an important role in the prediction of the catalyst exhaust gas reduction performance and slip ammonia predictions. Most SCR-related studies have conducted SCR part analyses or single tests rather than reflecting actual engine test results [14,15]. The aftertreatment device in an actual internal combustion engine has numerous design parameters depending on the engine room space and, in the case of exhaust gas flow testing, the results are significantly influenced by the inlet and outlet design of the catalyst. Additionally, systematical performance prediction and investigation of the aftertreatment system is required. The design layout of the exhaust gas and aftertreatment system should be clearly determined, and the same design has to be used for the numerical analysis to analyze the NOX emission and ammonia slip under the same conditions.
In this study, SCR performance prediction and improvement were made and examined for the actual Tier 4 Final-applied off-road engine. The determination of the test conditions utilized the exhaust gas temperature and flowrate conditions of the most dominant operating range in the exhaust gas assessment method used in certification testing. The test results were applied to increase the reliability of the governing equation and boundary conditions, and a numerical analysis was additionally conducted under the determined conditions.
In this paper, Section 2 explains the structure of this paper and Section 3 details the engine test conditions and numerical analysis boundary conditions and design. Section 4 discusses the numerical analysis performed for performance enhancement and the NH3 uniformity index result, followed by a summary of the results in Section 5.

2. Overview

Figure 1 shows the structure of this paper. This study was carried out in the following order. For the experimentation, a 3.8 L Tier 4 Final-compliant development engine from Daedong, Korea, was used. The non-road transient cycle (NRTC) test method was referenced for the exhaust regulation evaluation. The exhaust flow rate and temperature of the engine were determined taking into consideration the actual operation conditions and the most dominant operating range conditions in the evaluation standard. Under these conditions, the experimental and numerical analysis results for the urea uniformity index of the outlet of the SCR were compared. A numerical analysis was carried out and its results, which were investigated by varying the urea injection angle in the boundary conditions, were determined to be reliable through comparison with the experimental results.

3. Boundary Condition Determination and Verification

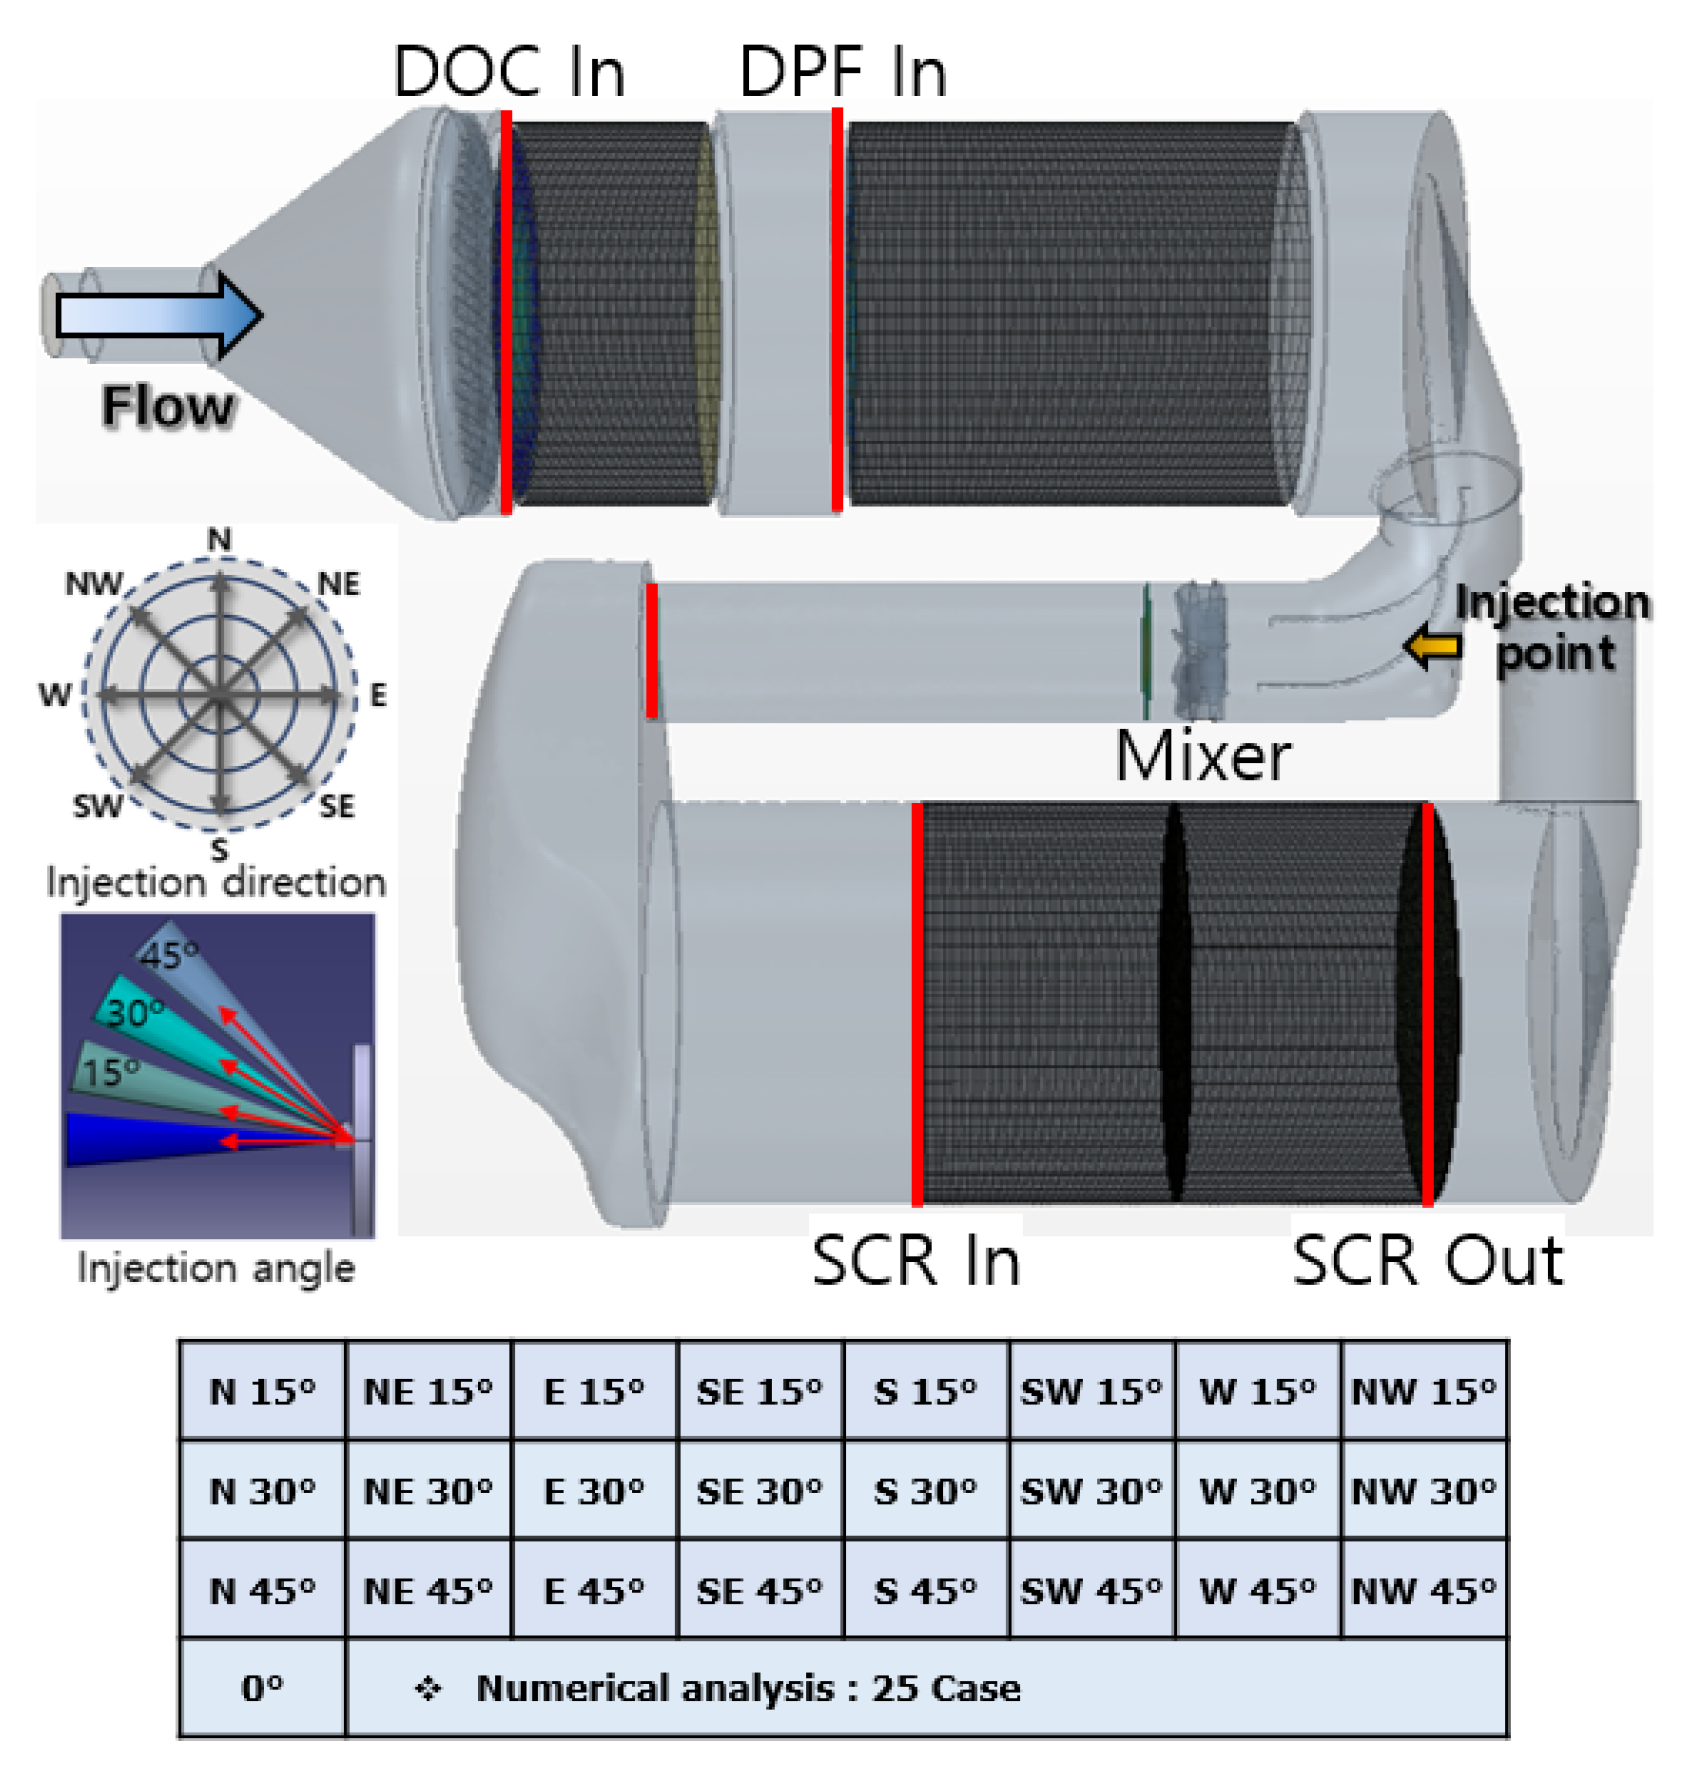
3.1. Target Aftertreatment Device

The target aftertreatment device was the Tier 4 Final-compliant aftertreatment device of the new 3.8 L engine from Daedong, Korea, shown in Figure 2. A numerical analysis was conducted referencing the actual design dimensions. The plate and DOC were used first for improved flow uniformity, followed by the DPF and then the SCR. A perforated plate and mixer were applied to improve the catalyst durability and efficiency by increasing the flow uniformity and urea uniformity index. Urea injection occurs at the outlet of the DPF and the mixer is placed approximately 120 mm after the injection nozzle for increased urea evaporation and distribution uniformity. The SCR catalyst without AOC coating, the primary catalyst, and the SCR catalyst with AOC coating, the secondary catalyst, were installed in this order.

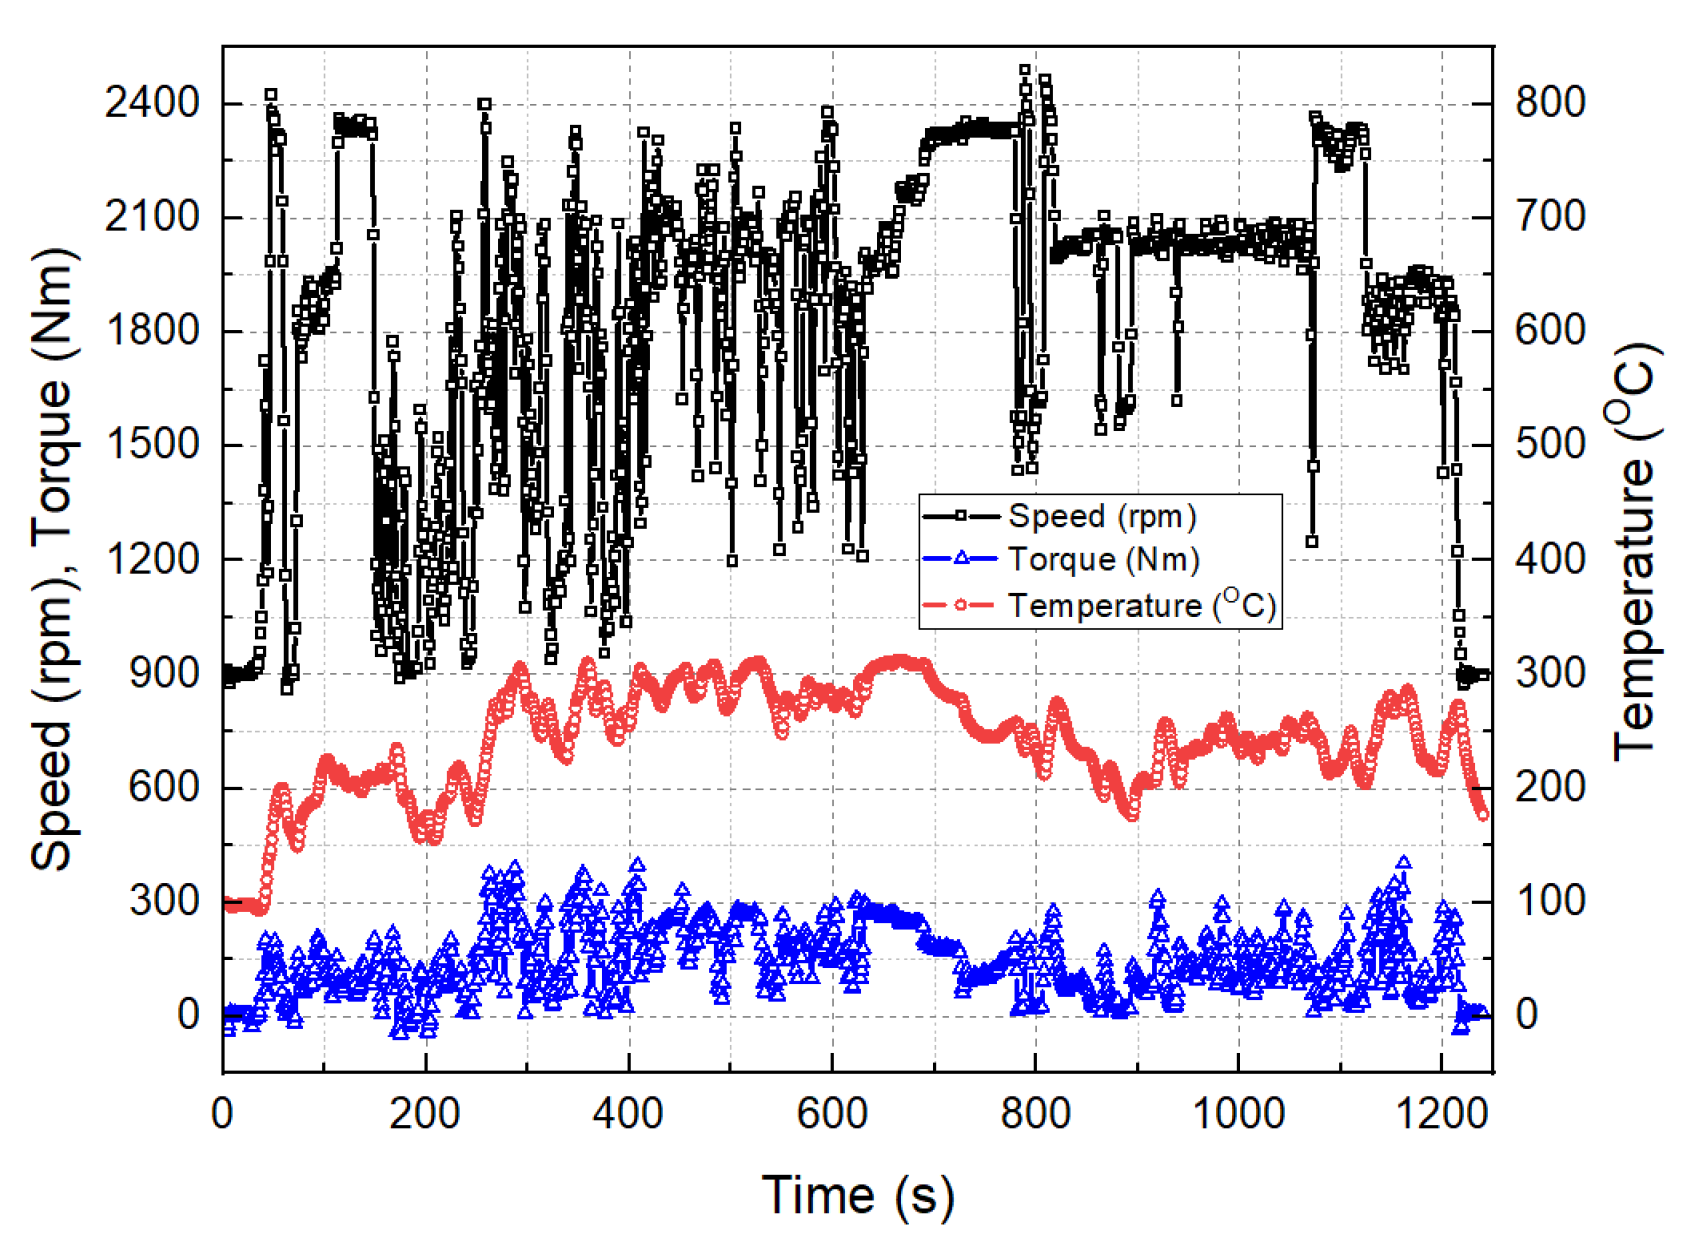
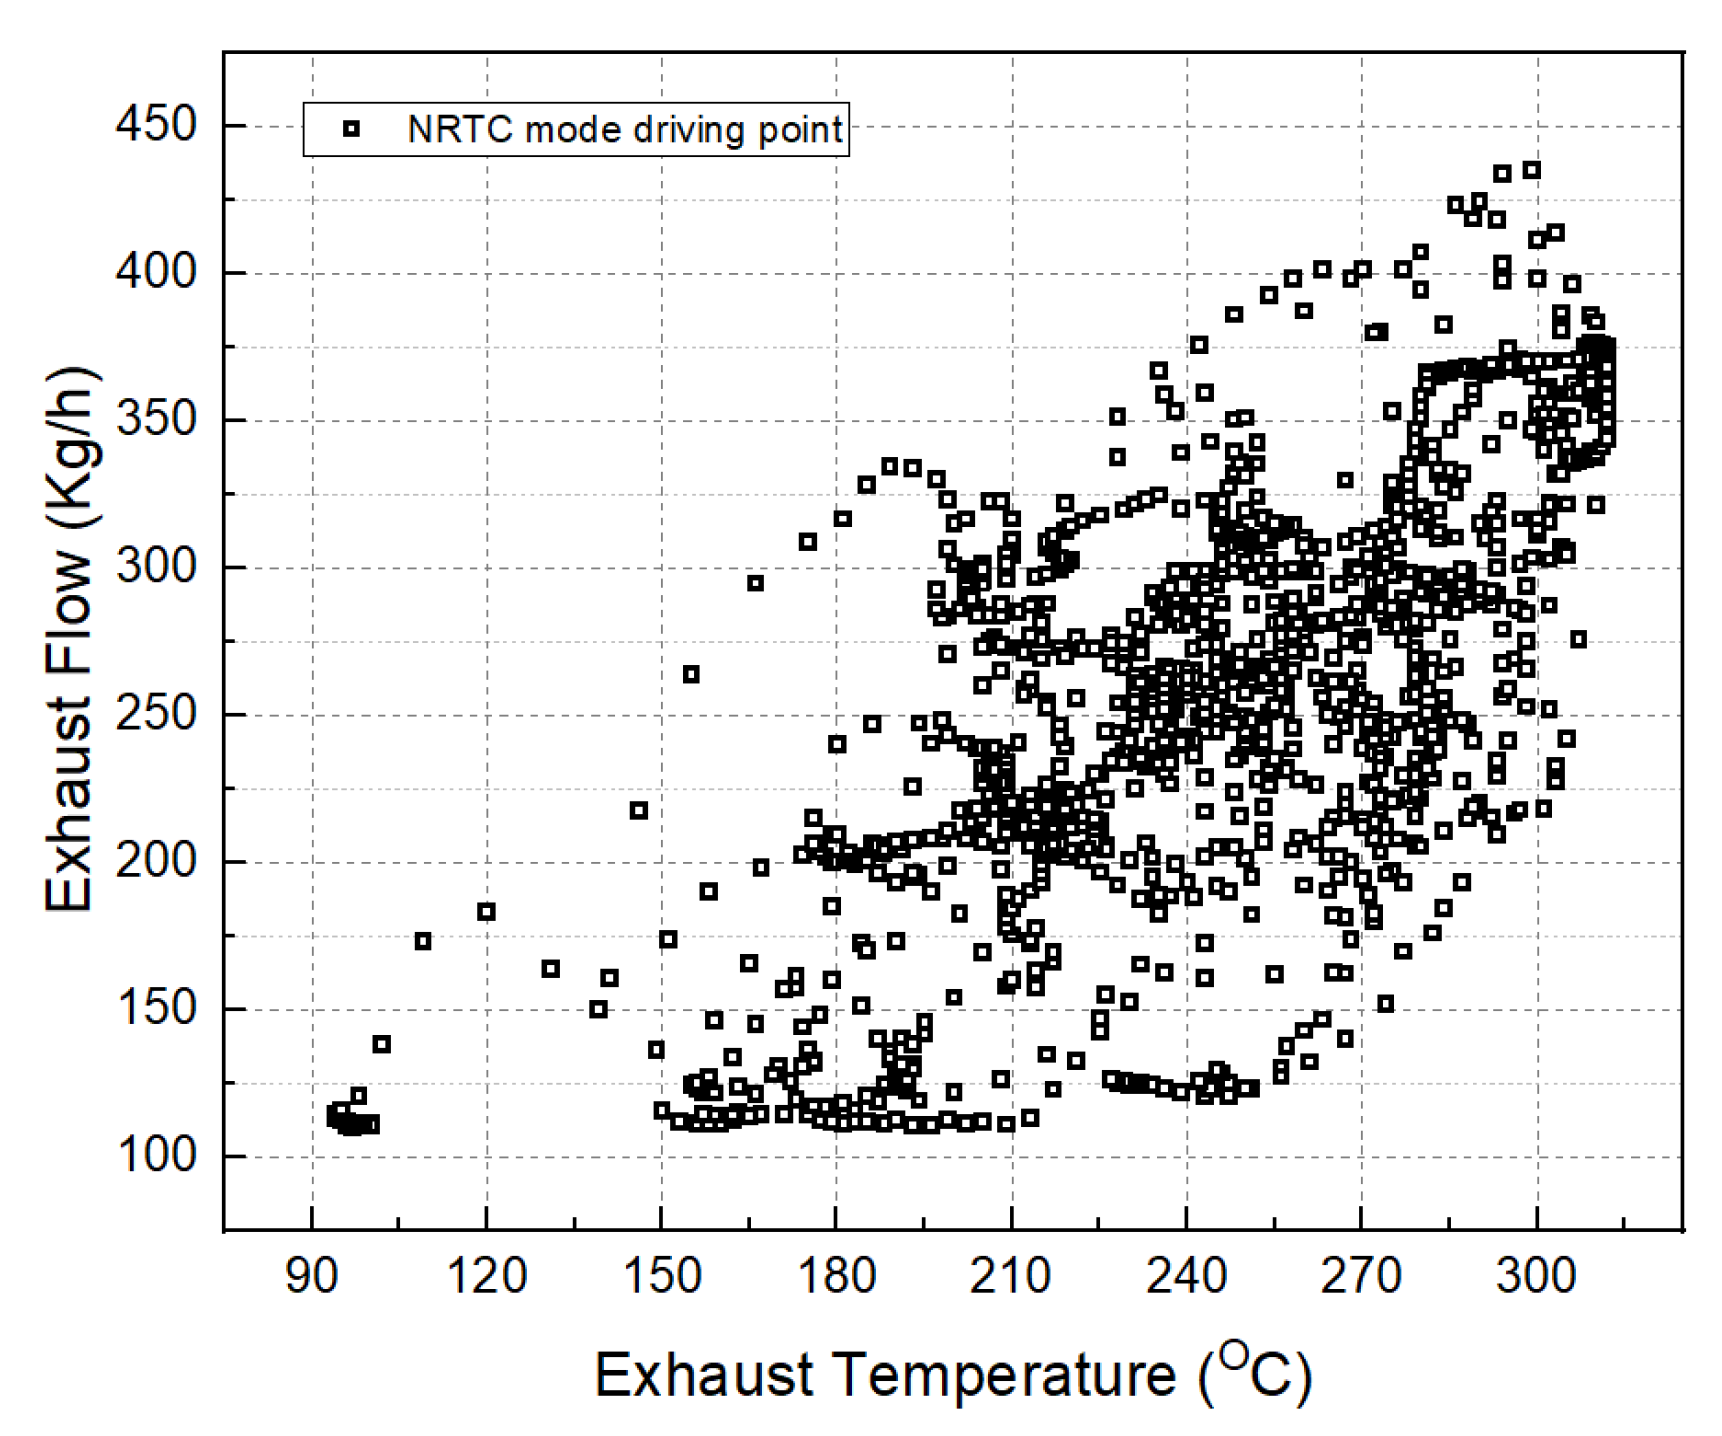
3.2. Boundary Condition Determination

The inflow rate and temperature need to be determined because they are important boundary conditions in the numerical analysis of the exhaust gas reduction device. Verification of reliability was done through comparison of the NH3 uniformity index of the outlet of the SCR for the NRTC mode test results and the numerical analysis results of the Daedong 3.8 L engine. Figure 3 provides a schematic diagram of the experimental setup; the obtained results are plotted in Figure 4. The most important variables of exhaust gas temperature and flow rate in the numerical analysis are scatter plotted in Figure 5 and shown in Table 1. The exhaust gas temperature and flow rate of the most dominant operating range in the NRTC test results were 200–300 °C and 200–300 kg/h, respectively, covering more than 50% of the entire operating range. The target engine was designed for agricultural machinery, so a 10% increase in the exhaust temperature was reflected in the same flow rate, taking into consideration the operational characteristics. Finally, an exhaust gas temperature of 330 °C and exhaust gas flow rate of 300 kg/h were selected.

3.3. Governing Equations

The governing equations significantly affect the accuracy and results of the numerical analysis. Ultimately, the governing equations must be carefully selected based on the factors that are considered most important. In this study, the commercial software STAR CCM+ 13.06 was used. The most important factors in this study were the phase change and chemical reaction of the injected urea. The energy of the exhaust gas reacts with the urea, so the energy equation becomes the basis of the chemical reaction. A phase-change equation is necessary to simulate the behavior and phase change of the injected urea. The phase equation predicts the phase of the domain and is continuous with the varying of the volume fraction according to the phase. Thus, the same equation is applied regardless of the phase and volumetric solid fraction (θ) changes according to the phase.
The basic differential momentum equation is derived first. Applying the liquid element acceleration equation to an infinitesimal particle with infinitesimal mass dm allows Newton’s second law to be expressed as the vector expression shown in Equation (1). Deriving the force component acting on dm in Equation (1) 3-dimensionally, adding density and temperature, and deriving it for the u, v, and w directions, results in derivation of the equation of motion (2), (3), (4) which becomes the basis of the numerical analysis. Here, h k = static enthalpy, λ k = thermal conductivity, T k = temperature, μ k t = eddy viscosity, σ h t = turbulent thermal diffusion Prandtl number, and Q k = inter-phase heat transfer; these are all added to derive the energy equation (Equation (5)) [16].
d F = d m D V D t = d m [ u V x + v V y + w V z + V t ]
ρ D u D t = ρ g x p x + x [ μ ( 2 u x 2 3 · V ) ] + y [ μ ( u y + v x ) ] + z [ μ ( w x + u z ) ]
ρ D v D t = ρ g y p y + x [ μ ( u y + v x ) ] + y [ μ ( 2 v y 2 3 · V ) ] + z [ μ ( v z + w y ) ]
ρ D w D t = ρ g z p z + x [ μ ( w x + u z ) ] + y [ μ ( w z + w y ) ] + z [ μ ( 2 w z 2 3 · V ) ]
t ( α k ρ k h k ) + · ( α k ρ k u k h k ) · ( α k ( λ k T k + μ k t σ h t h k ) ) = α k D p D t + α k ( τ k + τ k t ) : u k + Q k
The phase-change equation, applied to the injected urea, plays an important role in the numerical analysis. The injection equation begins with the Eulerian–Lagrangian multiphase equation. The Lagrangian equation is used because it is advantageous to track each individual particle motion due to the nature of the injection analysis. The Lagrangian equation also allows for the convenient processing of conditions such as the particle impacts, size distribution, phase change, and effects of turbulence. The particle equation of motion (6) is derived. The physical behavior of the particles differs depending on the thermal and chemical conditions of the particles. The thermal equilibrium equation changes due to differences between the particle (Tp) and evaporation (Tvap) temperatures and the initial volatility. When the representative particle temperature is lower than the evaporation temperature and the initial particle volatility is exhausted, the thermal equilibrium equation can be expressed as Equation (7).
  d u p d t = F D ( u u p ) + g x ( ρ p ρ ) ρ p F x
  m p c p d T p d t = h A p ( T T p ) + ε p A p σ ( θ R 4 T p 4 )
Here, m p = particle mass, c p = particle heat capacity, A p = particle surface area, T = local temperature of the continuous phase, ε p = particle emissivity, σ = Stefan–Boltzmann constant, and θ R = radiation temperature.

3.4. Experimental Results and Numerical Analysis Reliability Evaluation

To check the reliability of the experimentation and numerical analysis, the urea uniformity index at the outlet of the SCR was compared between the experimental and numerical analysis results. The numerical analysis was carried out after setting the exhaust flow rate and exhaust temperature, along with the boundary conditions for the numerical analysis, based on the experimental values as shown in Table 2. The numerical analysis model, exhaust gas inflow conditions, and urea injection conditions were determined.
Figure 6 shows the distribution and measurement points of the SCR outlet urea uniformity index experimental results, as well as the numerical analysis distribution. For the experiment, the NOX measurement results after the SCR catalyst reaction are shown; for the numerical analysis, the NH3 mole fraction cross-section distribution is shown to compare the trends of each cross section and finally obtain the error by comparing the cross-section uniformity index values. The cross sections were explained using the four cardinal directions. In the cross-section distribution, the concentration was low at the center and high in the S and NE directions, exhibiting similar cross-sectional trends. The distribution uniformity for the 17 points obtained through the experiment was 98.2%, while the numerical analysis uniformity was 97.5%. The error of the numerical analysis based on the experiment results was 0.7; thus, the reliability of the numerical analysis results was determined.

4. Numerical Analysis Results

The flow-path shape of the aftertreatment device is an important variable for the efficiency and durability of the catalyst. The catalyst shear rate uniformity index plays an important role in predicting the uniform reaction of the catalyst. In the case of the SCR, the injected urea and exhaust gas react unlike conventional catalysts. To predict the catalyst reaction and durability of the SCR, the velocity uniformity at the inlet of the catalyst was compared with the NH3 uniformity index. Using the same aftertreatment device design, 25 cases were conducted for 8 urea injection directions and 3 angles with the same boundary conditions. Figure 7 shows the urea injection conditions of the numerical analysis. The NH3 uniformity index results for the SCR mixer outlet and SCR catalyst inlet were investigated according to the urea injection conditions with the same flow-path design.

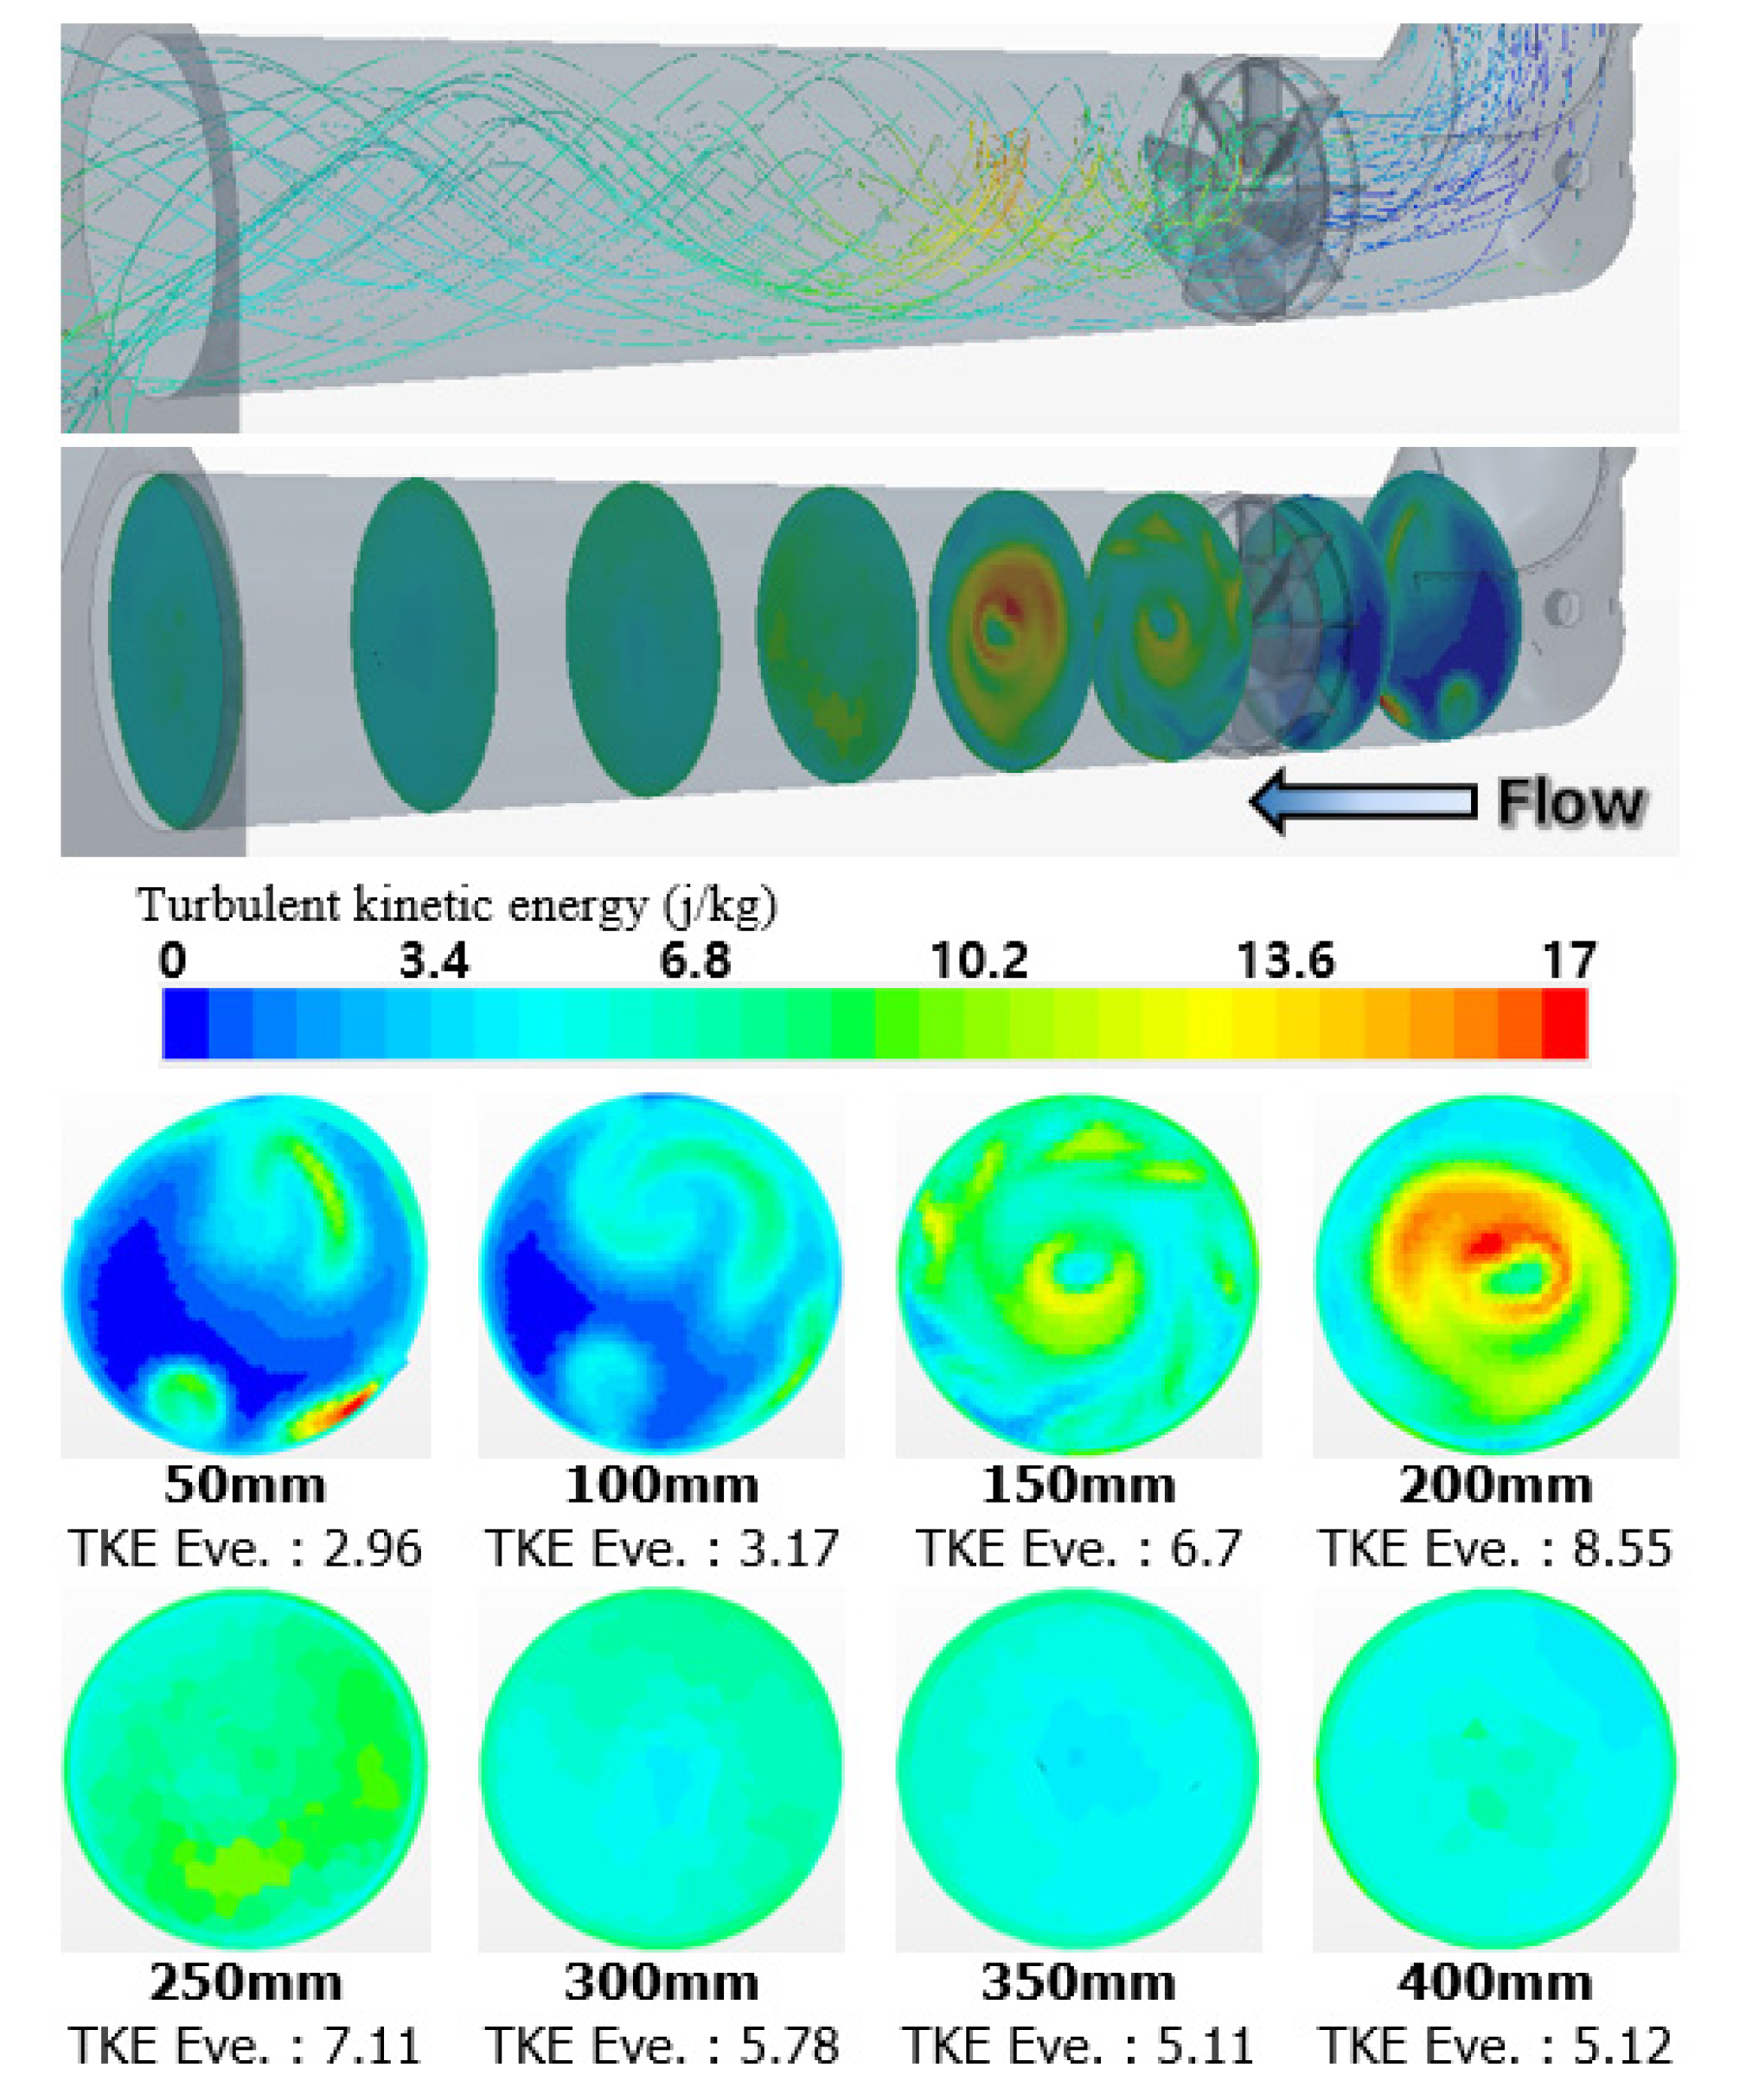
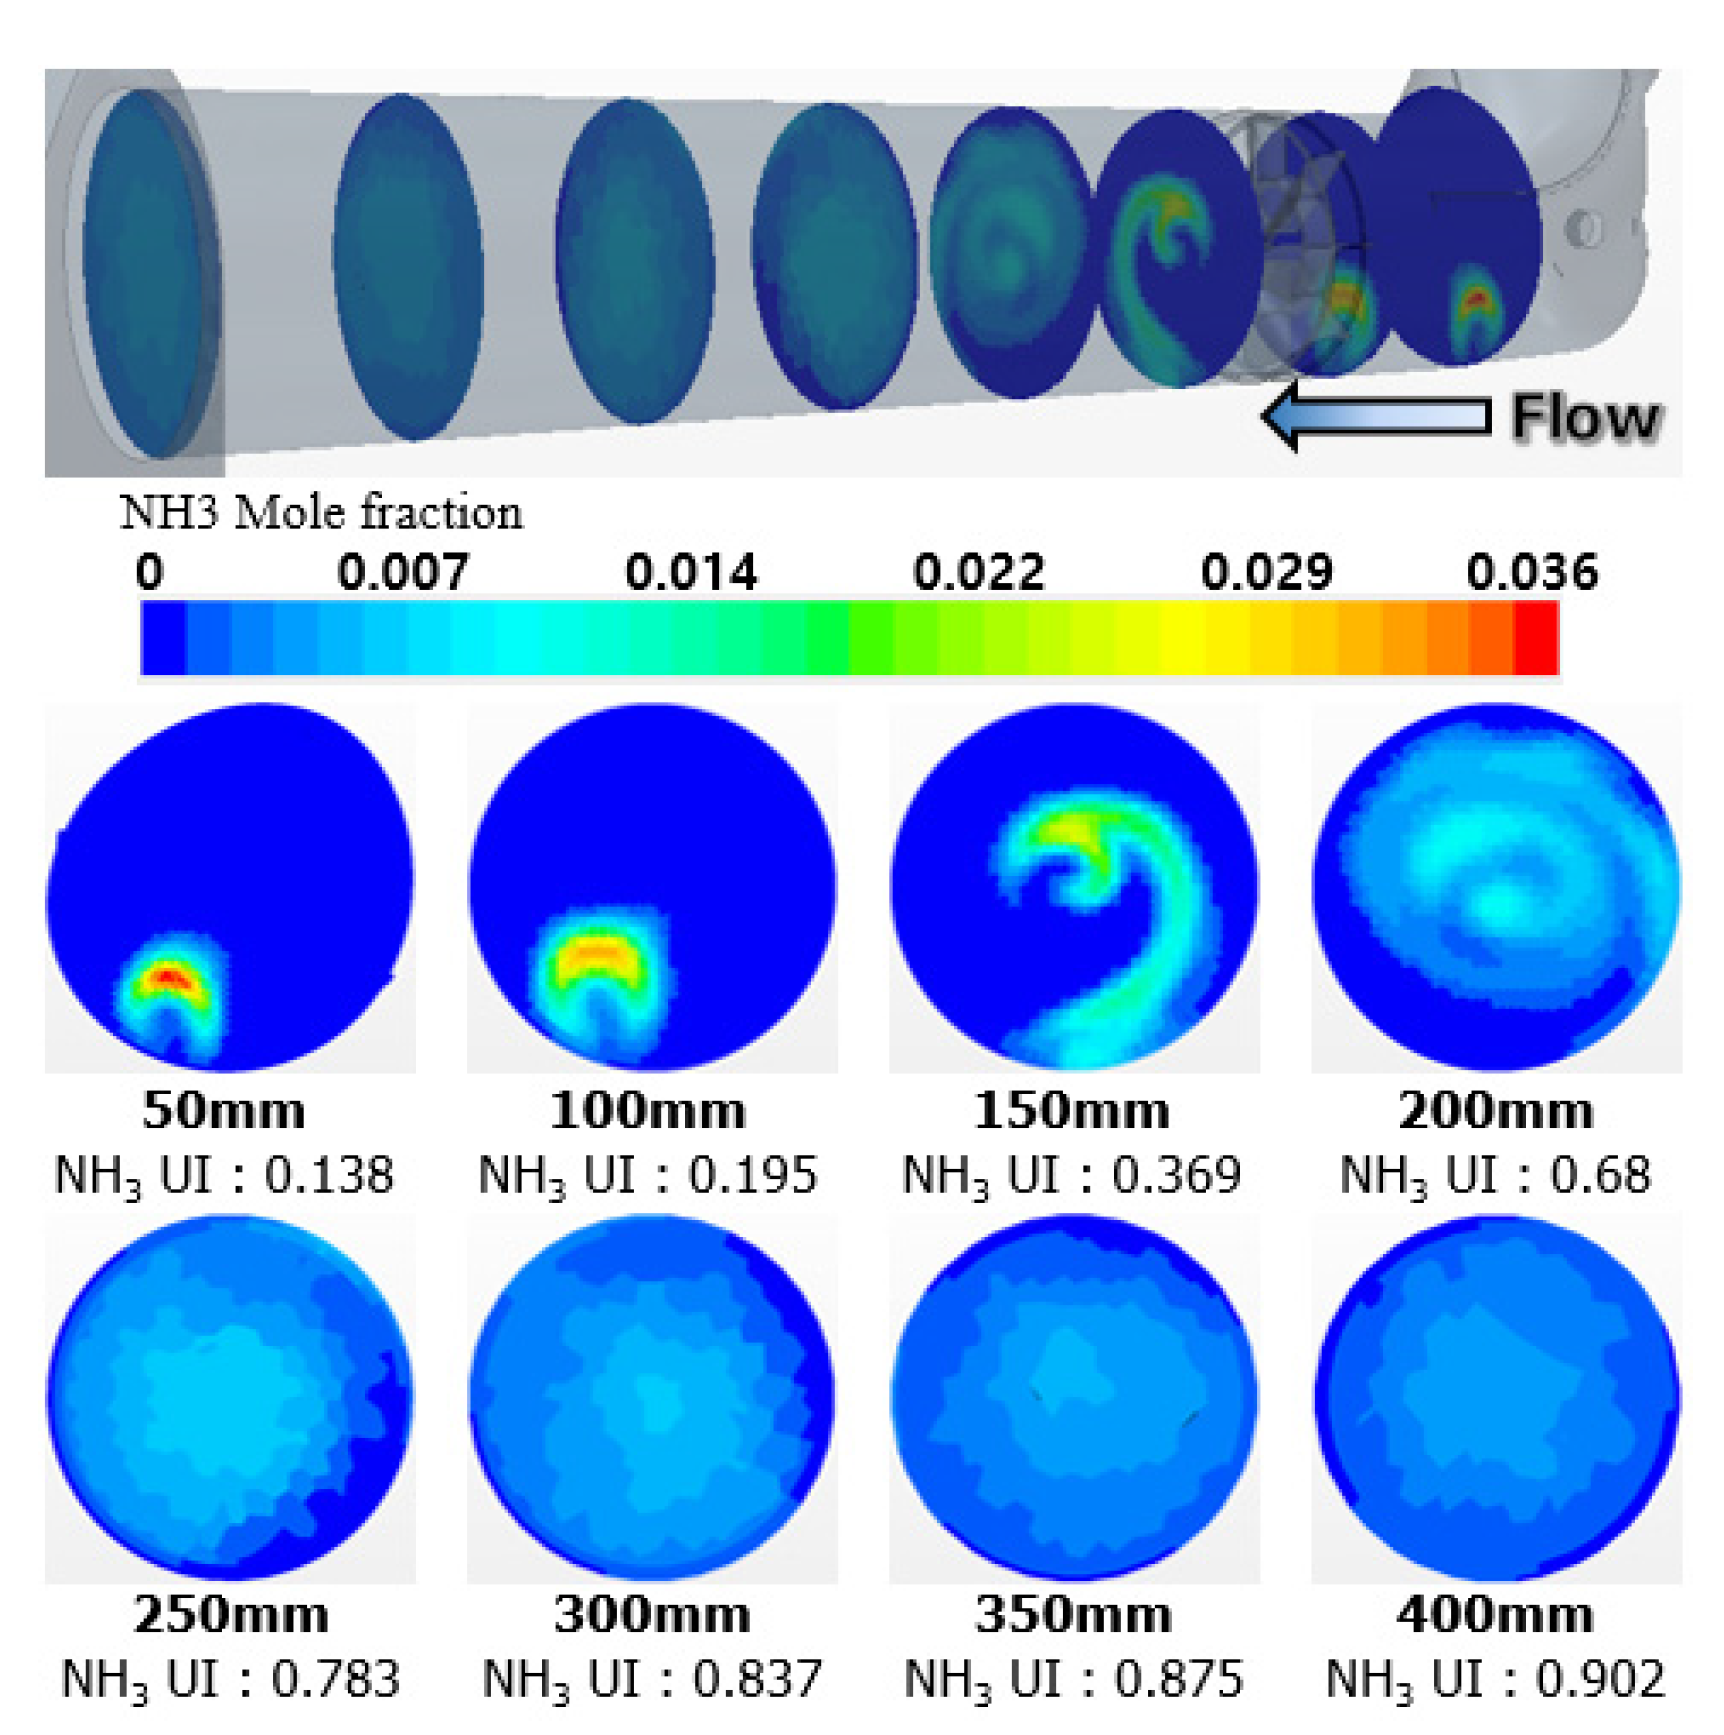
4.1. Device and Mixer Flow Characteristics

The catalyst inlet flow path and cross section velocity distributions were examined to predict the durability and performance of the aftertreatment device catalyst. Figure 8 shows the velocity distribution of the inlet of each catalyst. The flow was concentrated at the center in the DOC inflow catalyst inlet; the velocity distribution and flow concentration in a lattice shape were observed at the center due to the effect of the perforated plate. For the DPF, it was observed that the velocity distribution stabilized after passing through the DOC catalyst. The velocity distribution at the SCR inlet stabilized overall after passing through the DOC and DPF catalysts. However, the uniformity, at 0.733, did not significantly improve compared to the case of DPF. This result was thought to be due to the effect of the flow rotation caused by the shape of the flow between the mixer outlet and the SCR inlet. Additional space for stabilization of the SCR catalyst inlet flow or installation of an additional plate are thought to be options that would provide increased flow stability. In this research, additional design changes were not carried out as the velocity distribution and uniformity index were determined to be stable.
While the uniformity index of the exhaust gas inflow to the catalyst is important in enhancing the SCR catalyst reaction, the uniformity index of the urea is also important. The mixer performance for improved urea uniformity was examined. To observe the effect of the mixer, the turbulent kinetic energy distribution is shown for eight cross sections from the injection point up to 400 mm at 50 mm intervals, along with the uniformity index and a streamline, shown in Figure 9. For the same cross sections, the NH3 distribution and uniformity index are shown in Figure 10. After passing through the 120 mm point where the mixer is located, NH3 developed towards the cross-section center at the 150 mm cross section and the uniformity index began to rapidly increase. As shown for the 200 mm cross section, the turbulent kinetic energy sharply increased at the center and the NH3 distribution increased in a similar way. It was concluded that the turbulent kinetic energy has an effect on the distribution development, along with the evaporation of NH3. It was observed that the NH3 distribution increased up to 0.902 at the mixer outlet. These results are plotted in Figure 11 to allow trends to be observed.

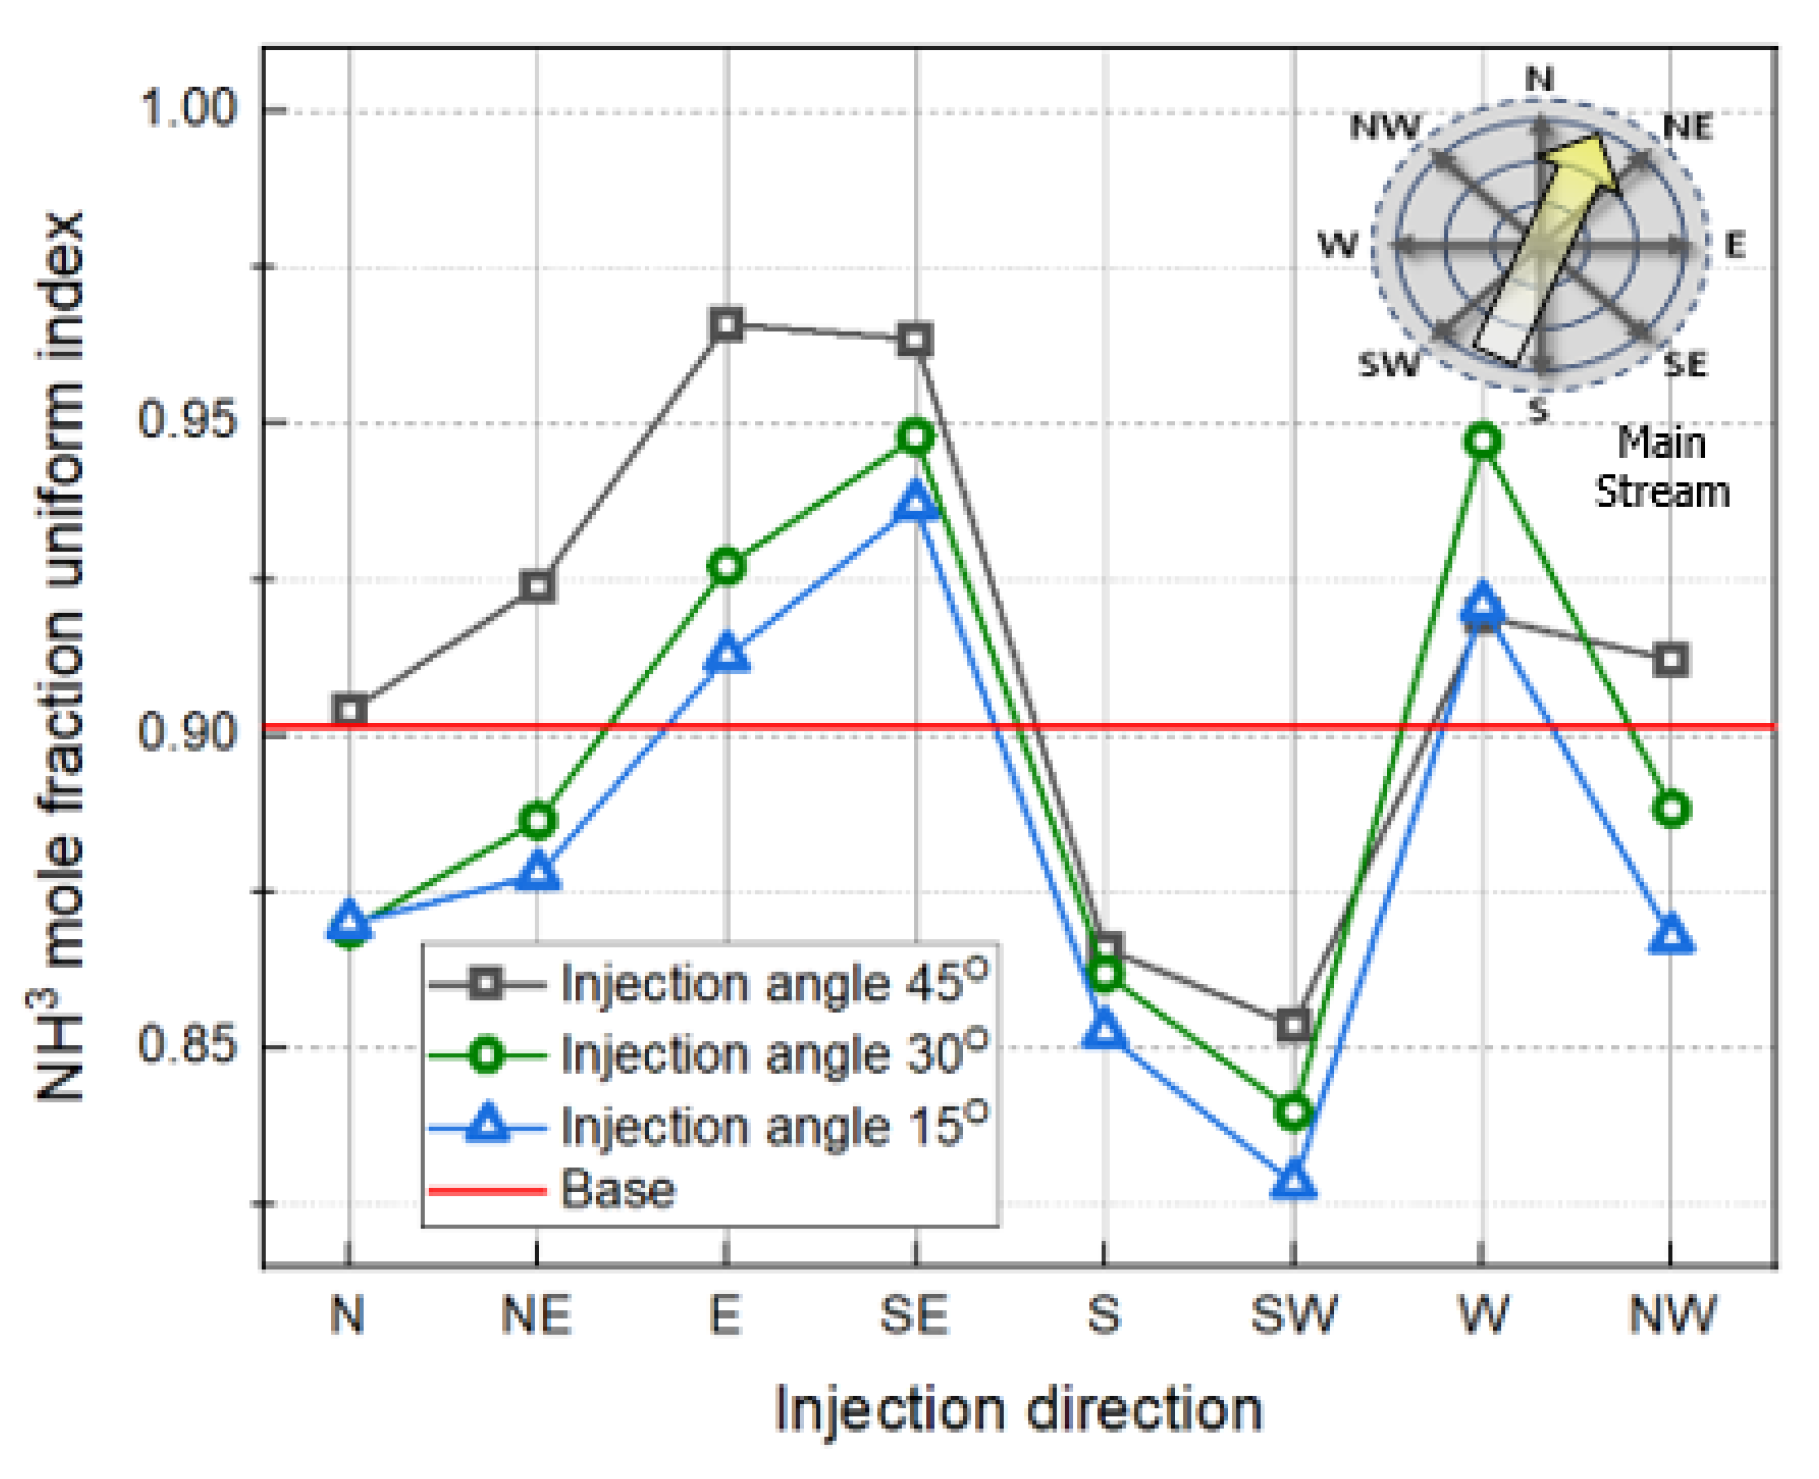
4.2. Mixer Outlet NH3 Uniformity Index Distribution According to the Urea Injection Angle

Numerical analysis was performed for the 25 cases to observe the NH3 uniformity index at the mixer outlet according to the urea injection angle for the same mixer and flow path shape. The case of injection in the center direction, used in the reliability evaluation, was set as the reference. The resulting graph is plotted in Figure 12 to allow comparison of the NH3 uniformity index at 400 mm of the injection outlet; the resulting values are shown in Table 3.
As the diameter decreased at the DPF outlet, the main stream was formed diagonally at the injector nozzle inlet. The main stream direction is marked on the graph when looking in the injection direction from the injector. For the condition of injection in the main stream direction, the NH3 uniformity index showed a decreasing trend. This result is thought to be due to the injector energy and main stream energy acting on the injected urea evaporation and flow. When the injected urea main stream direction and injection direction are the same, the NH3 uniformity index appears to decrease as the time to reach the mixer along the flow decreases. When the injection direction is perpendicular to the main stream, the NH3 uniformity index improved for the E and SE directions.
The mixer outlet uniformity index showed a minimum value of 0.828 in the SW direction and maximum value of 0.966 in the E direction. The results for each angle for all directions showed the same trend. Regardless of the injection direction, the uniformity index tended to be high for small injection angle conditions. As energy transfer occurred due to the main stream for 15° in all directions, on average a high NH3 uniformity index was established in comparison to the other angles. The 45° condition was thought to be less affected by the turbulent flow due to the high injection angle compared to the injector nozzle shape.

4.3. SCR Inlet NH3 Uniformity Index Distribution According to Urea Injection Angle

The imbalance of the SCR catalyst inlet uniformity index can increase the probability of NH3 slip occurring and cause a durability imbalance in the catalyst. Numerical analysis for 25 cases was carried out and compared to investigate the NH3 uniformity index at the SCR inlet according to the urea injection angle for the same mixer and flow path shapes. The case with the injection in the center direction, used in the comparison with the experimentation and reliability evaluation, was set as the reference. Figure 13 and Table 4 shows the NH3 uniformity index at the SCR catalyst inlet.
The SCR catalyst inlet uniformity index showed results very similar to those of the mixer. It was thought that the initial injection evaporation maintained a high uniformity index until the SCR inlet. When the main stream direction and injection direction were similar, a low NH3 uniformity index was obtained at the SCR catalyst inlet regardless of the injection angle, while a high NH3 uniformity index was obtained when the main stream direction and injection direction were perpendicular to each other.
The maximum NH3 uniformity index at the SCR inlet was 0.981 for the SE direction 15° condition and the minimum uniformity index was 0.954 for the N direction 45° condition. The difference between the maximum and minimum was very small at 0.027. Although the difference appears to be large in the graph plot, it can be observed that the average difference for the injection angles is very small. This result was due to the sufficient space necessary for flow stabilization as the flow slowed down with the expansion of the shape from the mixer outlet to the SCR catalyst inlet.

5. Conclusions

In this study, the reliability of numerical analysis was determined based on an SCR-installed exhaust gas aftertreatment device experiment. The urea injection angle and injection direction were varied under numerical analysis boundary conditions and determined to be reliable to carry out numerical analysis and investigate its results. The following conclusions were obtained in this study. An error of 0.7% was found for the uniformity index at the same cross sections between the experiment and numerical analysis results. The trends for the cross sections also appeared to be similar, showing the validity of the numerical analysis boundary conditions. The mixer was located at a point 120 mm from the injector nozzle outlet. NH3 develops at the 150 mm cross-section center and the uniformity index begins to rapidly increase. The minimum and maximum mixer outlet NH3 uniformity index values were 0.828 in the SW direction and 0.966 in the E direction, respectively. At the SCR inlet, the maximum NH3 uniformity index was 0.981 for the SE direction 15° condition and the minimum was 0.954 for the N direction 45° condition. It was determined that there was sufficient space for flow stabilization as the flow slowed down with expanding shape from the mixer outlet to the SCR catalyst inlet.

Author Contributions

Conceptualization, O.K. and E.P.; data curation, H.K. (Hoonmyung Kim); software, S.J.; writing—original draft, S.J.; writing—review and editing, H.K. (Hyunjun Kim) and J.K. All authors have read and agreed to the published version of the manuscript.

Funding

The authors are grateful for support by the Ministry of Trade, Industry and Energy (MOTIE) through the Industrial Technology Innovation Program “Post Tier-4 Response 100 Horsepower Diesel Engine NOX Reduction Urea Supply System Development” (No. 10077690).

Institutional Review Board Statement

Not applicable.

Informed Consent Statement

Not applicable.

Data Availability Statement

The data presented in this study are available on request from the corresponding author. The data are not publicly available due to confidential of engine and aftertreat system.

Conflicts of Interest

The authors declare no conflict of interest.

References

  1. Johnson, T. Review of Diesel Emissions and Control. SAE Int. 2010, 3, 16–29. [Google Scholar] [CrossRef]
  2. BASF, Very Pure NOx-Reduction Agent for Diesel Engines Equipped with SCR Catalysts. AdBlue. Available online: https://pdf4pro.com/amp/view/adblue-m-6221-e-11-2006-276afb.html (accessed on 1 November 2006).
  3. Yuanqing, Z.; Tinghui, L.; Chong, X.; Yongming, F.; Song, Z. Simulation analysis on vaporizer/mixer performance of the high-pressure SCR system in a marine diesel. Chem. Eng. Process. Process Intensif. 2020, 148, 107819. [Google Scholar]
  4. Chundru, V.R.; Parker, G.G.; Johnson, J.H. The Effect of NO2/NOx Ratio on the Performance of a SCR Downstream of a SCR Catalyst on a DPF. SAE Int. 2019, 12, 121–141. [Google Scholar] [CrossRef]
  5. Georgiadis, E.; Kudo, T.; Herrmann, O.; Uchiyama, K. Real Driving Emission Efficiency Potential of SDPF Systems without an Ammonia Slip Catalyst. SAE Tech. Paper 2017. [Google Scholar] [CrossRef]
  6. Haozhong, H.; Yajuan, C.; Zhihua, L.; Hui, W.; Bin, H.; Yingjie, C.; Han, L.; Xiaoyu, G. Analysis of deposit formation mechanism and structure optimization in urea-SCR system of diesel engine. Fuel 2020, 265, 116941. [Google Scholar]
  7. Peter, T.; Yan, S.; Martin, R. Enhancement of Flow Distribution and Pressure Drop Performance of SCR System for Commercial Vehicles; Eberspaecher North America Inc.: Detroit, MI, USA, 2013; pp. 1–9. [Google Scholar]
  8. Azael, C.; Fernando, I. Multiphase injector modelling for automotive SCR systems: A full factorial design of experiment and optimization. Comput. Math. Appl. 2017, 74, 188–200. [Google Scholar]
  9. Praveena, V.; Jesu, M.L. Design Optimization of Urea Injectors and Mixers in a Compact SCR System. SAE Tech. Pap. 2018. [Google Scholar] [CrossRef]
  10. Yajuan, C.; Haozhong, H.; Zhihua, L.B.; Hui, W.; Bin, H.; Yingjie, C.; Guanyan, H.; Xiaoyu, G. Study of reducing deposits formation in the urea-SCR system: Mechanism of urea decomposition and assessment of influential parameters. Chem. Eng. Res. Des. 2020, 164, 311–323. [Google Scholar]
  11. Nishad, K.; Ries, F.; Janicka, J.; Sadiki, A. Analysis of spray dynamics of urea–water-solution jets in a SCR-DeNOx system: An LES based study. Int. J. Heat Fluid Flow 2018, 70, 247–258. [Google Scholar] [CrossRef]
  12. Ossi, T.K.; Ville, V.; Lei, Z.; Martti, L.; Ronghou, L. Mixing and evaporation analysis of a high-pressure SCR system using a hybrid LES-RANS approach. Energy 2017, 120, 827–841. [Google Scholar]
  13. Um, H.S.; Kim, D.H.; Kim, H.K. Numerical study on the design of urea decomposition chamber in LP SCR system. Int. J. Naval Archit. Ocean. Eng. 2019, 11, 307–313. [Google Scholar] [CrossRef]
  14. Ligang, T.; Pengfei, F.; Shubao, Y.; Yage, G.; Shaochun, L.; Ziwen, L. CFD studies on effects of SCR mixers on the performance of urea conversion and mixing of the reducing agent. Chem. Eng. Process. Process. Intensif. 2018, 123, 82–88. [Google Scholar]
  15. Achuth, M.; Christopher, M.; Cremeens, Z.; Gerald, L. Development of Flow Uniformity Indices for Performance Evaluation of Aftertreatment Systems. SAE Int. J. Engines 2011. [Google Scholar] [CrossRef]
  16. Börnhorst, M.; Kuntz, C.; Tischer, S.; Deutschmann, O. Urea derived deposits in diesel exhaust gas after-treatment: Integration of urea decomposition kinetics into a CFD simulation. Chem. Eng. Sci. 2020, 211, 5319. [Google Scholar] [CrossRef]
Figure 1. Design optimization procedure of the urea injection angle and direction of the selective catalytic reduction system.
Energies 14 00157 g001
Figure 2. Target aftertreatment device, including a diesel oxidation catalyst (DOC), diesel particulate filter (DPF), and selective catalytic reduction (SCR).
Energies 14 00157 g002
Figure 3. Schematic diagram of the engine dynamometer apparatus.
Energies 14 00157 g003
Figure 4. Real-time data (speed, torque, and temperature) of the non-road transient cycle (NRTC) mode.
Energies 14 00157 g004
Figure 5. Operating points of the NRTC mode: exhaust temperature vs. exhaust flow rate.
Energies 14 00157 g005
Figure 6. Uniformity index (UI) comparison: experimental result vs. numerical analysis result.
Energies 14 00157 g006
Figure 7. Design candidates for optimizing the UI: eight injection directions, three injection angles, and base cases.
Energies 14 00157 g007
Figure 8. The UI of three locations in the aftertreatment system: inlets of DOC, DPF, and SCR.
Energies 14 00157 g008
Figure 9. Development of turbulence after a urea injection point and the kinetic energies at specific distances: from 50 mm to 400 mm with 50 mm intervals.
Energies 14 00157 g009
Figure 10. Development of ammonia uniformity after a urea injection point and the cross-sectional views and UI values at specific distances: from 50 mm to 400 mm with 50 mm intervals.
Energies 14 00157 g010
Figure 11. Kinetic energy and ammonia UI over the distance from a urea injection point.
Energies 14 00157 g011
Figure 12. Ammonia uniformity index (UI) according to the various injection angle and direction candidates at the 400 mm distance from the urea injection point.
Energies 14 00157 g012
Figure 13. Ammonia uniformity index (UI) according to the various injection angle and direction candidates at the inlet of the SCR.
Energies 14 00157 g013
Table 1. Statistical analysis of NRTC mode: numbers and percentage of temperature and flow rate.
NRTC Mode Driving Data Study
Exhaust TemperatureExhaust Flow
°CPoint No.Percentkg/hPoint No.Percent
0–100393.1100–20024619.8
100–20015612.6200–30065152.5
200–30092274.3300–40033126.7
300–40012410.0400–500131.0
Total1241100Total1241100
Table 2. Conditions for the numerical analysis.
Analysis Model
ToolStar CCM+ 13.06Time Step (ms)1
Turbulencek-omega SSTPhysical Time (s)2
Breakup ModelReitz–Diwakar BreakupThermistor ModelNTC Thermistor Model
Analysis Boundary Conditions
Working FluidExhaust Gas
Pressure (barG)1.5Temperature (°C)600
Exhaust Manifold Pressure (barG)1.5Flow Rate (kg/h)450
Supersonic Static Pressure (barG)1.31Density (kg/m3)0.11
Urea–Water Solution
H2O (%)67.5N2H4CO (%)32.5
Injection Rate (kg/h)1.819
Reactions
Thermolysis(NH2)2CO(s or l) → NH3(g) + HNCO(g)
HydrolysisHNCO(g) + H2O → NH3(g) + CO2(g)
Table 3. Ammonia uniformity index (UI) data according to the various injection angle and direction candidates at the 400 mm distance from the urea injection point.
NNEESESSWWNW
15°0.9040.9240.9660.9640.8660.8540.9190.912
30°0.8690.8860.9270.9480.8620.8400.9790.888
45°0.8700.8780.9130.9370.8520.8280.9760.957
Base0.902
※ N: North, E: East, S: South, W: West
Table 4. Ammonia uniformity index (UI) data according to the various injection angle and direction candidates at the inlet of the SCR.
NNEESESSWWNW
15°0.9630.9610.9640.9810.9630.9590.9590.963
30°0.9560.9570.9780.9630.9590.9580.9790.960
45°0.9540.9540.9640.9620.9580.9570.9760.957
Base0.961
※ N: North, E: East, S: South, W: West
Publisher’s Note: MDPI stays neutral with regard to jurisdictional claims in published maps and institutional affiliations.

