Article

Ammonia Emissions in SI Engines Fueled with LPG

Motor Transport Institute, 80 Jagiellonska Str., 03-301 Warsaw, Poland
*
Author to whom correspondence should be addressed.
Energies 2021, 14(3), 691; https://doi.org/10.3390/en14030691
Submission received: 24 November 2020 / Revised: 12 January 2021 / Accepted: 21 January 2021 / Published: 29 January 2021
(This article belongs to the Special Issue Exhaust Emissions from Passenger Cars)

Abstract

:
Ammonia is a toxic exhaust component emitted from internal combustion engines. Both pure ammonia and the products of its reaction with nitrogen and sulfur compounds, being the source of particulate matter (PM) emissions, are dangerous for human health and life. The aim of the article was to demonstrate that NH3 can be produced in exhaust gas after-treatment systems of spark-ignition (SI) engines used in light-duty vehicles. In some cases, NH3 occurs in high enough concentrations that can be harmful and dangerous. It would be reasonable to collect research data regarding this problem and consider the advisability of limiting these pollutant emissions in future regulations. The article presents the results of the spark-ignition engine testing on an engine test bench and discusses the impact of the air–fuel ratio regulation and some engine operating parameters on the concentration of NH3. It has been proven that in certain engine operating conditions and a combination of circumstances like the three-way catalytic reactor (TWC) temperature and periodic enrichment of the air–fuel mixture may lead to excessive NH3 emissions resulting from the NO conversion in the catalytic reactor. This is a clear disadvantage due to the lack of limitation of these pollutant emissions by the relevant type-approval regulations. This article should be a contribution to discussion among emissions researchers whether future emission regulations (e.g., Euro 7 or Euro VII) should include a provision to reduce NH3 emissions from all vehicles.

1. Introduction

Ammonia is a toxic substance classified by international regulations [1]. US regulations allow for the NH3 concentration limit of 25 ppm during 8-h human exposure [2]. NH3 is not a product forming itself inside the engine combustion chamber during the combustion process. In spark ignition (SI) engines, NH3 is formed in exhaust after-treatment systems during NO conversion in the presence of CO. Moreover, NH3 may react with the acids contained in the exhaust gas, forming particulate matter (PM) and harmful aerosols. Exposure to higher NH3 concentration could cause irritation of the skin, eyes, nose, or throat due to direct contact. Ammonia, even at low concentrations, has an unpleasant odor when released into the air but most notably harms vegetation, particularly at high concentrations. In water bodies, ammonia causes more serious harm due to the toxicity to organisms living in water [3]. Regulation No. 595/2009 for the value of NH3 concentration in Euro VI has set 10 ppm as the limit for NH3 concentration in the exhaust gas emitted from a heavy-duty vehicle [4]. So far, there are no NH3 limits for light-duty vehicles.
NH3 emissions have been associated mainly with the emissions from heavy-duty vehicles using selective catalytic reduction (SCR) as an after-treatment device. This type of catalytic reactor allows us to reduce NOx emissions in the exhaust of the engines fueled with a lean air–fuel mixture. In a stoichiometric engine, carbon monoxide is used to reduce nitrogen oxides inside three-way catalytic reactors (TWCs). In compression ignition engines, fueled with a lean air–fuel mixture with an excess of oxygen, most of the CO contained in the exhaust gases is oxidized to CO2. This process slows down the NOx conversion and prevents the use of such reactors in stoichiometric spark-ignition engines. The operation principle of SCR reactors is based on the use of chemical reactions between nitrogen oxides and ammonia formed from urea injected into the reactor [4]. Overdosing of the amount of injected urea results in increased NH3 emissions from the exhaust system. However, urea overdosing is not the only factor increasing NH3 emissions from the internal combustion engine. NH3 can also be emitted from a spark ignition engine operating as a stoichiometric engine. NH3 emissions are mainly produced from NO emissions by reactions (1) and (2).
2 NO + 4 CO + 2 H2O + H2 → 2 NH3 + 4 CO2
2 NO + 5 H2 → 2 NH3 + 2 H2O
The greater the concentrations of NO, CO, and H2 in the exhaust gas are, the greater the mass of the NH3 is. These gases are the basic components of the exhaust gas on which the mass of the NH3 depends. CO is a natural component of exhaust gases and has higher concentrations when the air–fuel mixture is rich. H2 can be obtained in the exhaust gas in two ways—during the combustion stroke, where, under high pressures and temperature, the hydrogen contained in the fuel is released or by means one of the below reactions: the water gas shift (3) or the steam reforming (4).
CO + H2O → CO2 + H2
CnHm + n H2O → n CO + (m/2 + n) H2
Thus, higher engine NO, CO, HC, and H2 emissions could bring about higher NH3 emissions. It can be seen that the type of used fuel may have an influence on the amount of H2 produced in the combustion chamber according to reaction (4). In particular, the value of n/m fuel ratio is important. For lighter gaseous fuels, such as methane or propane, a higher value of the n/m ratio means that the fuel contains more hydrogen, and therefore more water will be formed in the products of its combustion, which, according to reactions (3) and (4), may change the quantity of hydrogen participating in the process of NH3 formation. In a stoichiometric engine, lambda sensor periodically and alternately changes the air–fuel ratio between rich-to-lean stages, but the average air–fuel equivalent ratio oscillates around a value equal to 1.00. During engine operation, it is possible to identify the operating conditions in which the engine has a rich (λ < 1.00) and a lean (λ > 1.00) air–fuel ratio. When the air–fuel mixture is rich, conditions for the formation of NH3 occur. Due to the limited access to oxygen, the raw exhaust gas will contain more CO and unburned hydrocarbons (CnHm), because these gases cannot be fully oxidized. This situation leads to the generation of NH3 emissions in accordance with reactions (1)–(4).
The greater and deeper the changes of the air–fuel ratio occur, the greater tendency the engine shows for increasing NH3 emissions. Therefore, by analyzing the influence of air–fuel ratio on NH3 emissions, it can be assumed that the engine will have the lowest NH3 emission during operation in stationary, steady-state conditions with constant speed and torque. In the event of a sudden change of operating parameters, e.g., rapid acceleration of the vehicle during aggressive driving and temporary enrichment of air–fuel ratio, or only with frequent changes of the engine operating parameters caused by the vehicle’s driving, conditions for higher NH3 emissions will be created.
Apart from the concentration of gases participating in the reactions (1) and (2) (NO, CO, and H2), the mass of NH3 emission will be determined by the kinetics of these reactions depending on the temperature at which the NO converts to NH3. According to [5], reaction (3) takes place at lower TWC temperatures (300–500 °C), whereas reaction (4) occurs at higher temperatures (>500 °C).
Gaseous ammonia has been shown to contribute to the formation of airborne particulate matter. Ammonia emitted into ambient air neutralizes nitric and sulfuric acid to form ammonia nitrate (NH4NO3) and sulfate (NH4)2SO4, two important components contributing to airborne fine particles or PM2.5. As has been stated by International Agency for Research on Cancer, a part of the World Health Organization (WHO), particulate matter is a major constituent of outdoor air pollution and can cause cancer in humans (IARC 2013). In addition to human health effects, ammonia also impacts terrestrial vegetation.
Three-way catalysts have been used in modern light-duty vehicles driven by spark-ignition engines for over three decades since the introduction of low-emission vehicles to the automotive market. Today, this is a typical part of the exhaust after-treatment system. The time that has elapsed since the start of using SCR technology in heavy-duty vehicles is a little shorter. TWC and SCR are identified as the main causes of NH3 emissions in the exhaust gas. Although agriculture is still the main source of NH3 emissions to the atmosphere, some researchers have reported an increase in NH3 emissions from vehicles in recent years.
Ammonia emitted into the ambient air has the ability to react with nitric acid to form solid ammonium nitrate, which is the secondary source of pollutant emissions in the form of PM emissions. For this reason, an increase in NH3 emissions to the atmosphere can be dangerous and undesirable. Therefore, it is time to take a closer look at the problem of NH3 emissions from vehicles, including also those powered by SI engines.
The literature on the formation and modeling of ammonia emissions in SI engines is quite extensive. Descriptions of these issues can be found in [6,7,8,9,10,11,12,13,14,15,16,17,18,19,20,21,22,23,24,25]. However, there is still a lack of knowledge of the influence of the TWC processes on the NH3 emissions in the emission test cycles.

2. Results of the Testing

2.1. Test Bed and Tested Object

The aim of the testing was to determine the influence of selected engine parameters on NH3 emissions. The experimental testing was carried out on a spark-ignition engine fueled with propane. It was a V-type engine with a displacement of 7.2 dm3, equipped with two TWCs. The diameter of the TWC’s metal substrate was 148 mm, catalyst body volume 4.22 dm3, cell density 400 cpsi, and precious metal charge 70 g/ft3 with Pt/Pd/Rh ratio of 1:5:4. The engine was tested on the test bench equipped with measurement equipment complying with requirements of UN Regulation No. 49.06 and EU Regulation No. 582/2011.
The tests were performed on the test bench equipped with the following devices:
  • engine dynamometer as an asynchronous electric machine (capable of operating in the motor-generator mode) by AVL type AFA 100 4Z4/4;
  • system for particulate sampling Smart Sampler AVL 472 by AVL;
  • particle counter AVL489 APC ADVANCED by AVL enabling measurement of particulate number concentration in raw sampling;
  • a set of AMA i60 by AVL exhaust gases analyzers for analyzing the raw exhaust gas, consisting of
    • type AVL IRD i60 CO2/COL analyzer by ABB operating on the principle of infrared absorption (NDIR);
    • type AVL IRD i60 CO2/COH analyzer by ABB adapted for measuring CO2 and high CO concentrations, operating on the bases of the absorption of infrared radiation (NDIR) measuring the concentration of gas in the dry exhaust gases;
    • a heated analyzer of the total hydrocarbons (THC) AVL Cutter FID i60 HDD type by AVL, operating on a principle of flame ionization detection (FID). The analyzer was equipped with a non-methane hydrocarbons separator (cutter), which enabled the analyzer to measure concentrations of THC and CH4;
    • a heated analyzer NO/NOx of AVL CLD i60 HDD type operating on a principle of chemiluminescence;
  • a set of calibration gases with accuracy 1% used for calibration of the analyzers;
  • AVL AMA i60 LDD NH3/H2O type analyzer by AVL being a diode laser gas analyzer with a measuring principle based on the specific light absorption of different gas components;
  • airflow meter Sensyflow P-type to measure the air consumption of by the engine, operating on the principle of measuring the resistance of the heated wire;
  • mass flowmeter CMF 025M 300 NQFZGZZZ by Emerson for measurement of gaseous fuel consumption, operating on Coriolis principle.
The used experimental equipment allowed to ensure the accuracy of emission measurements of 2%.

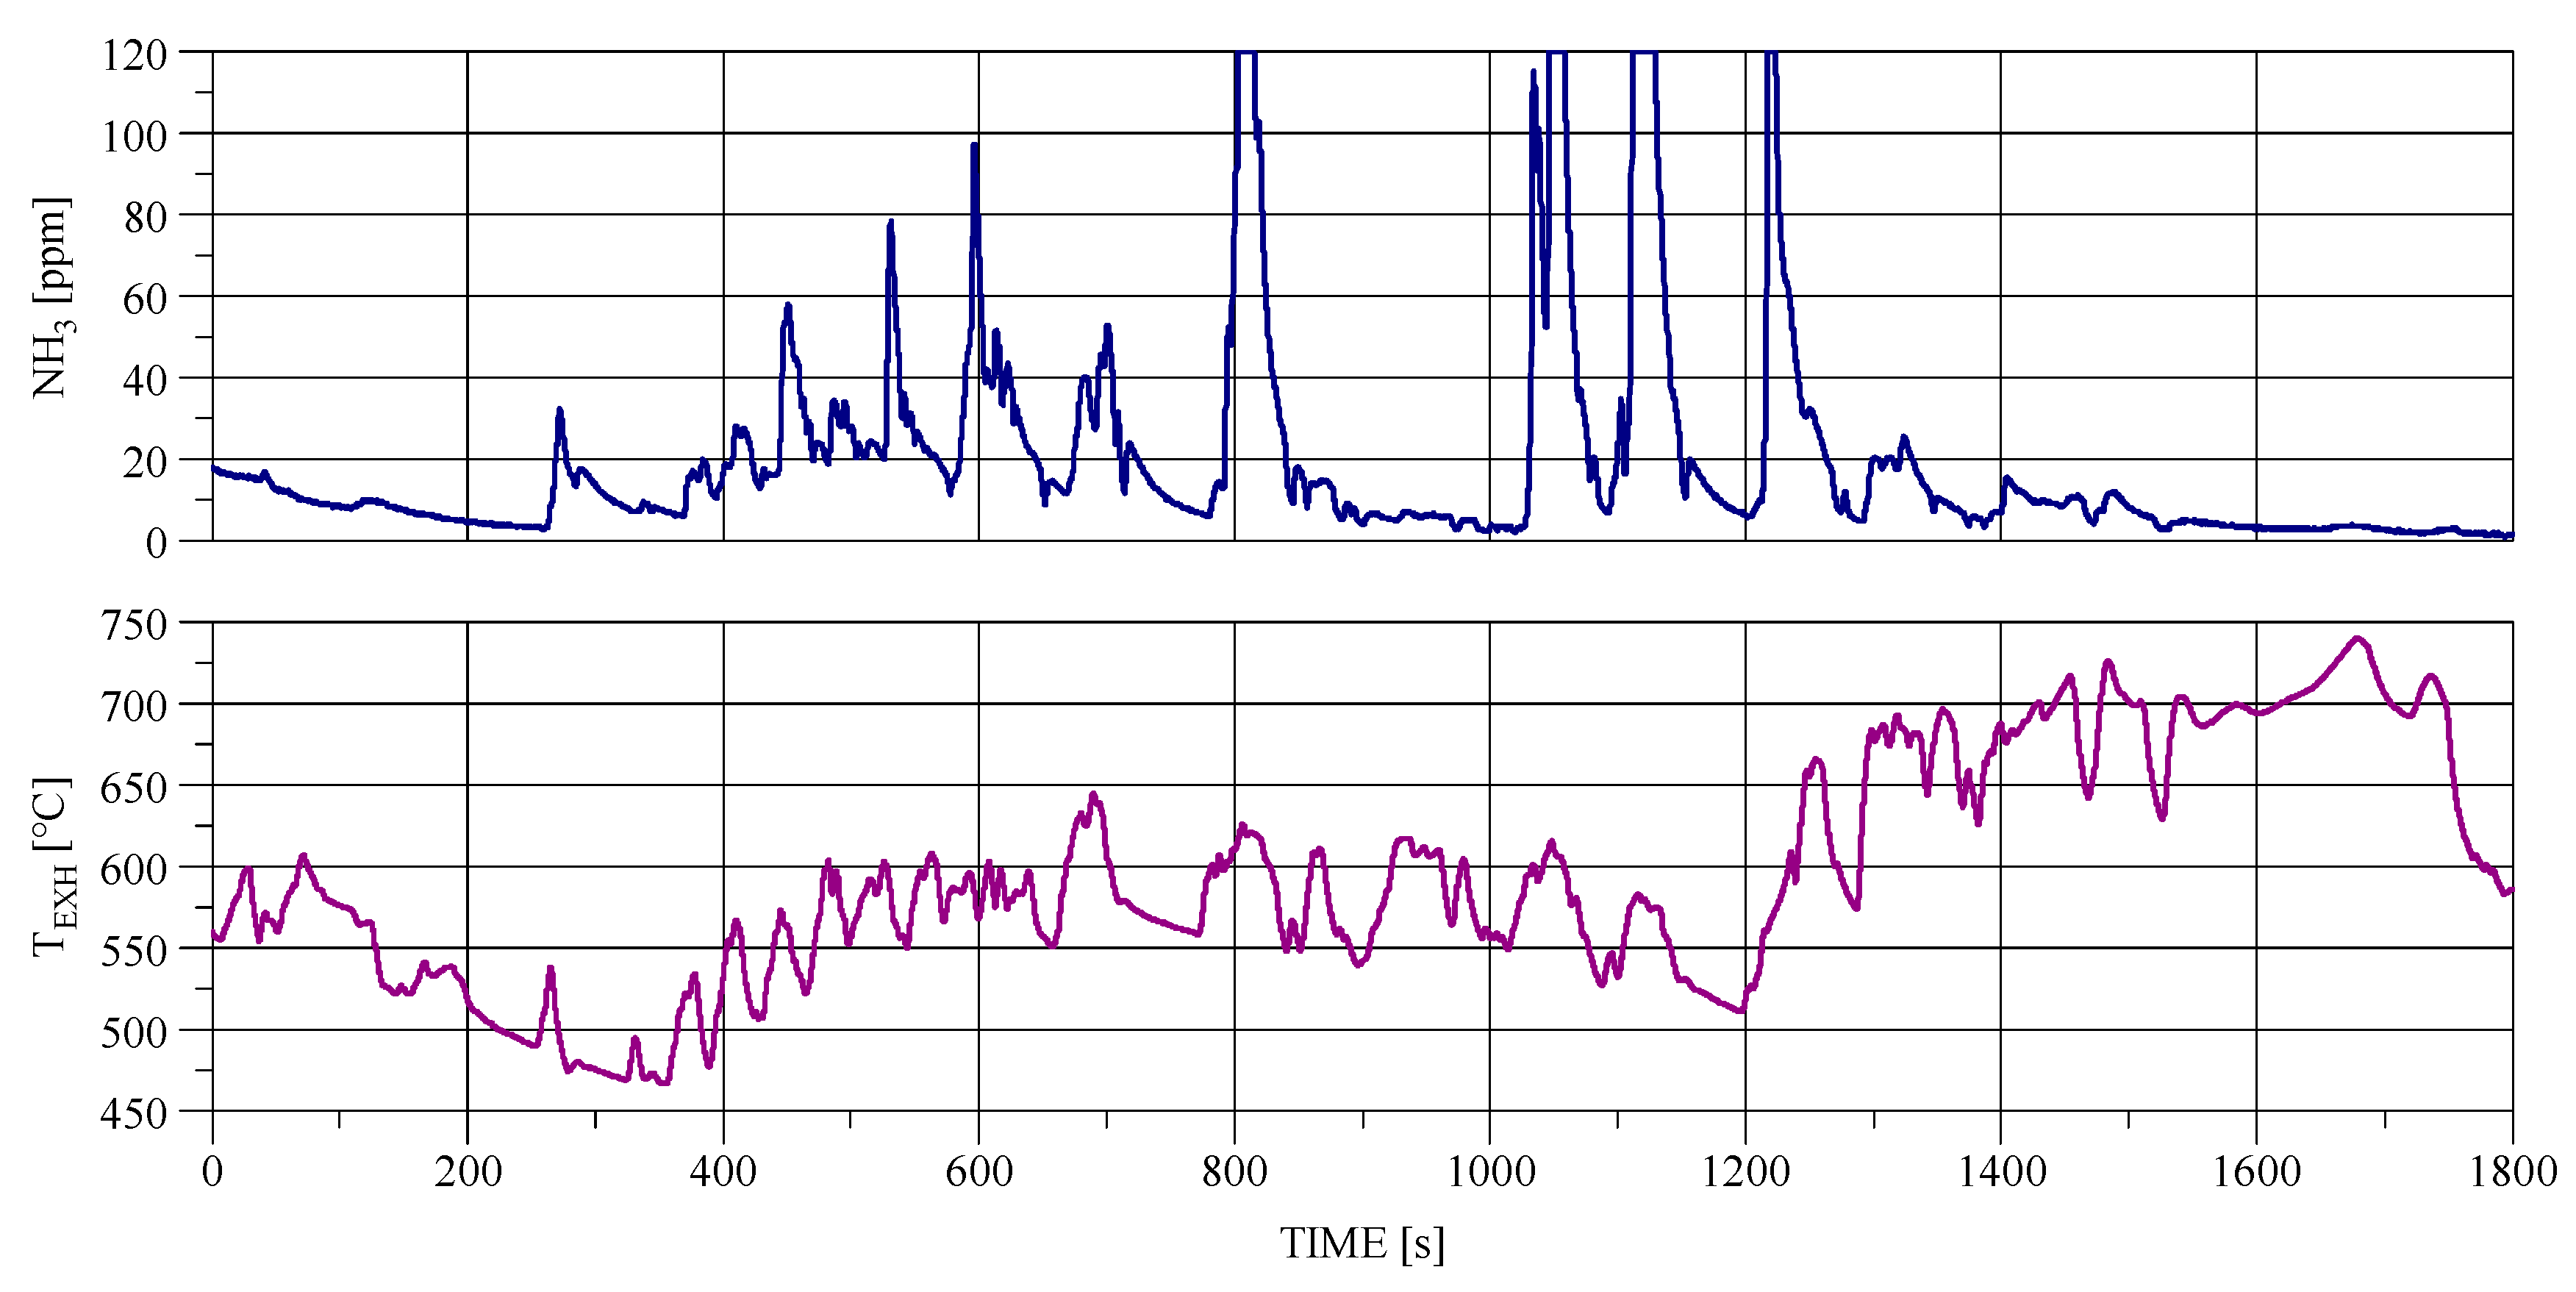
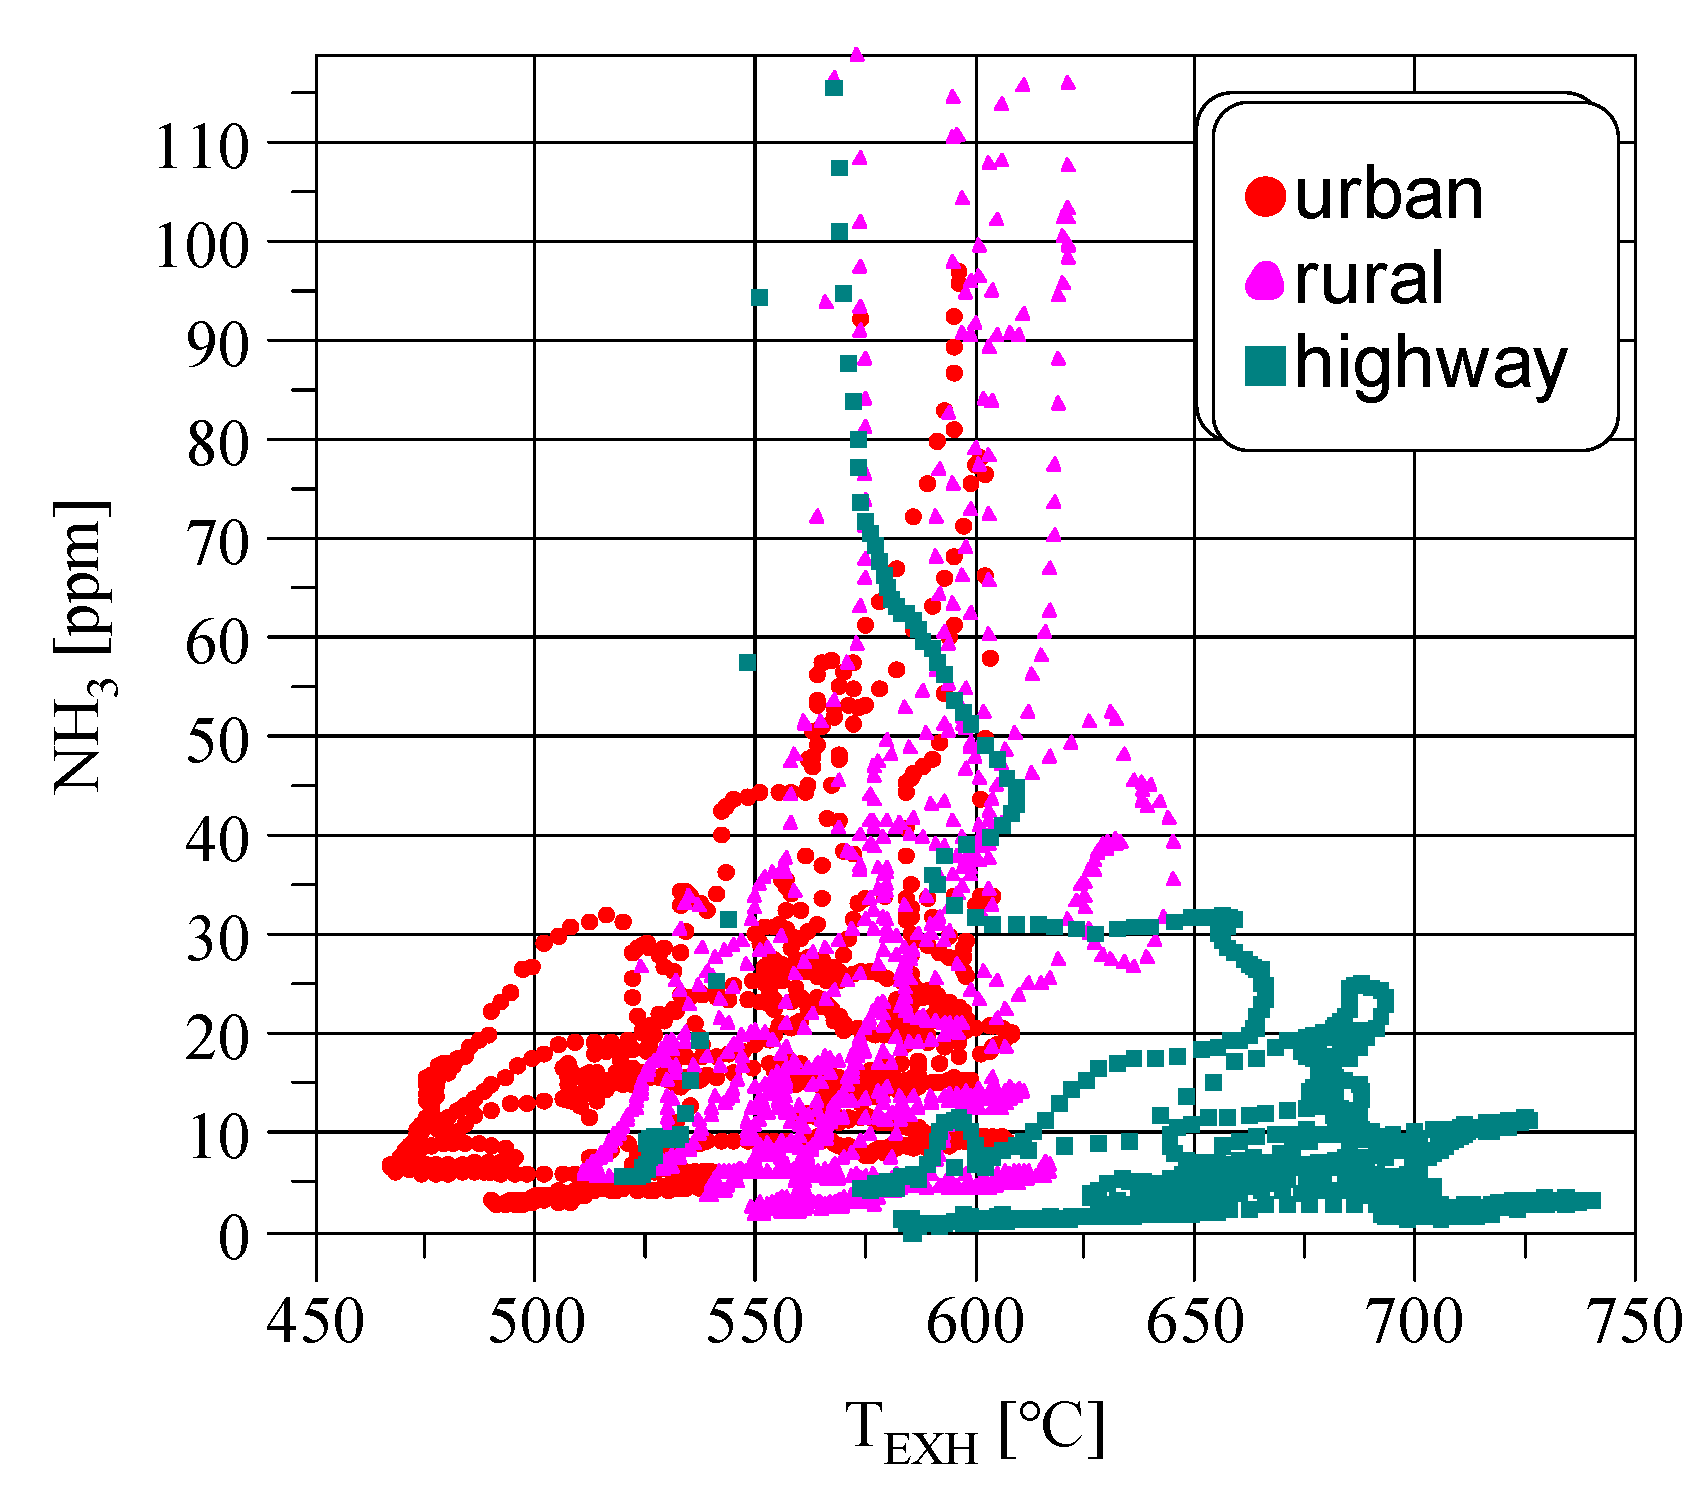
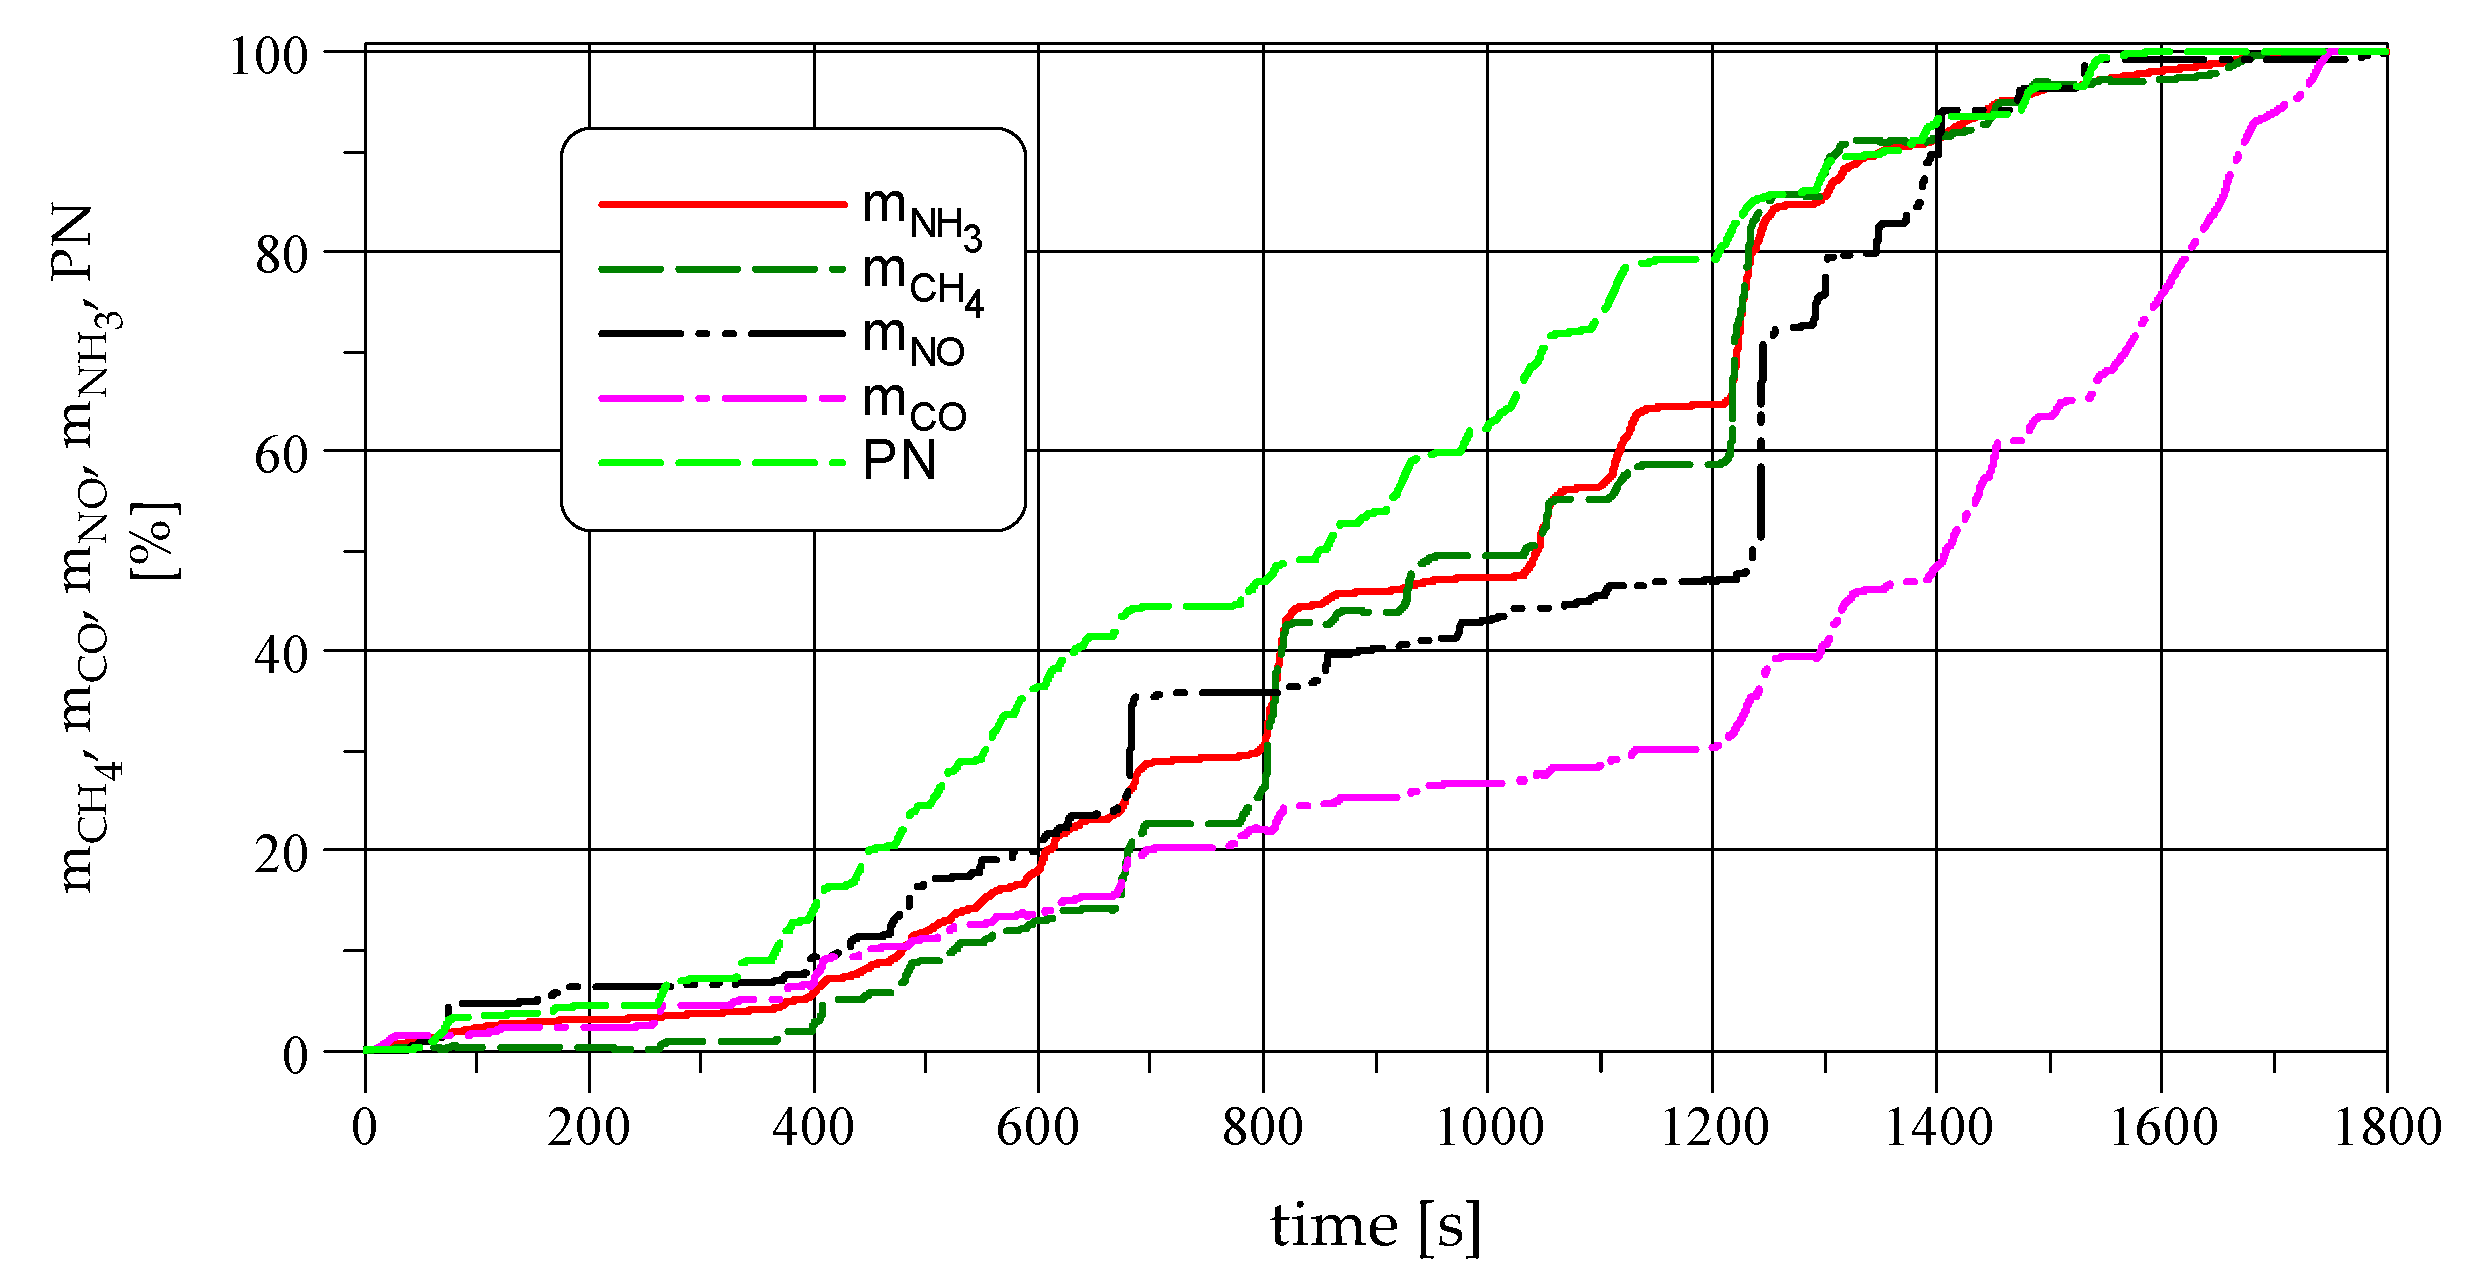
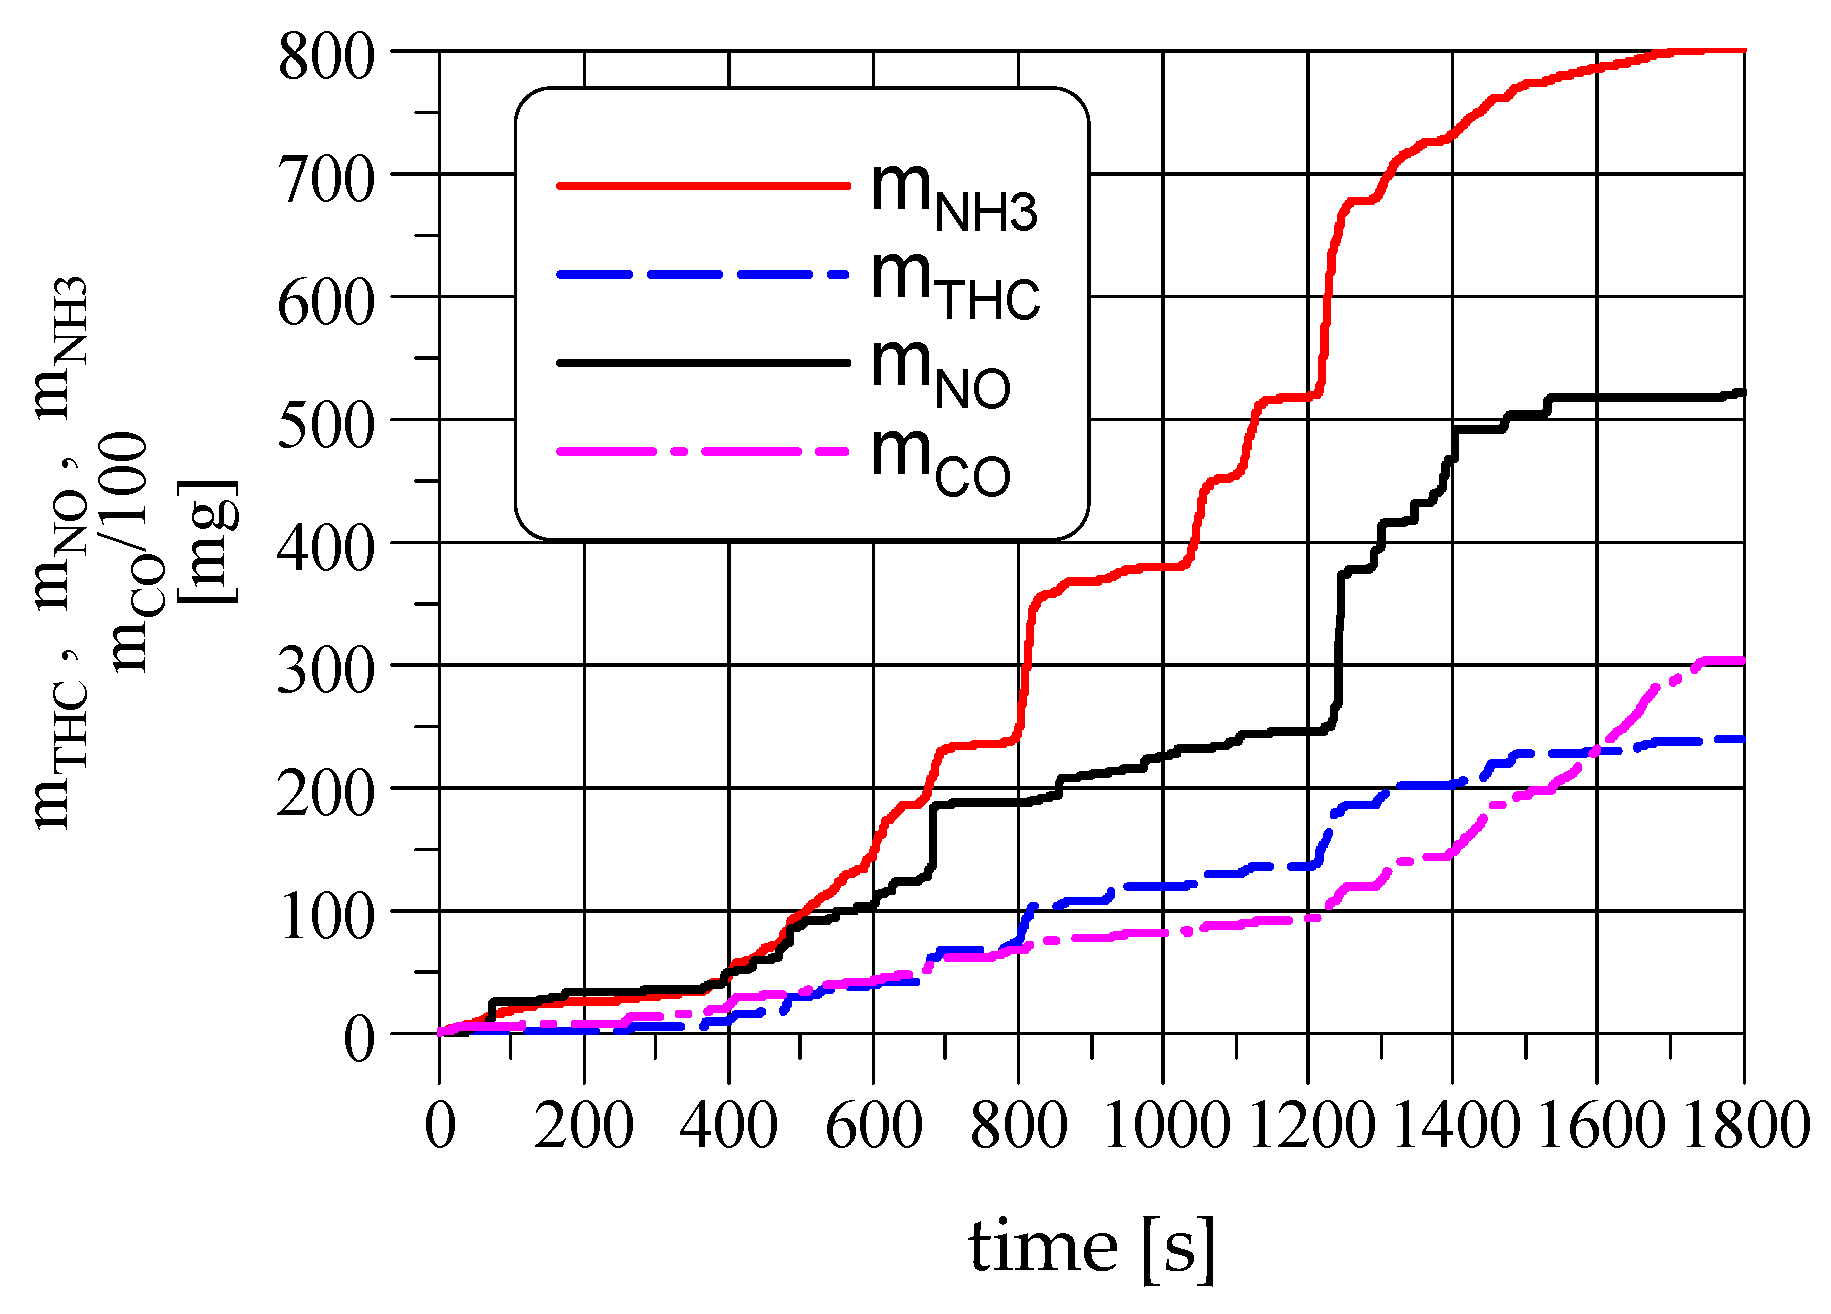
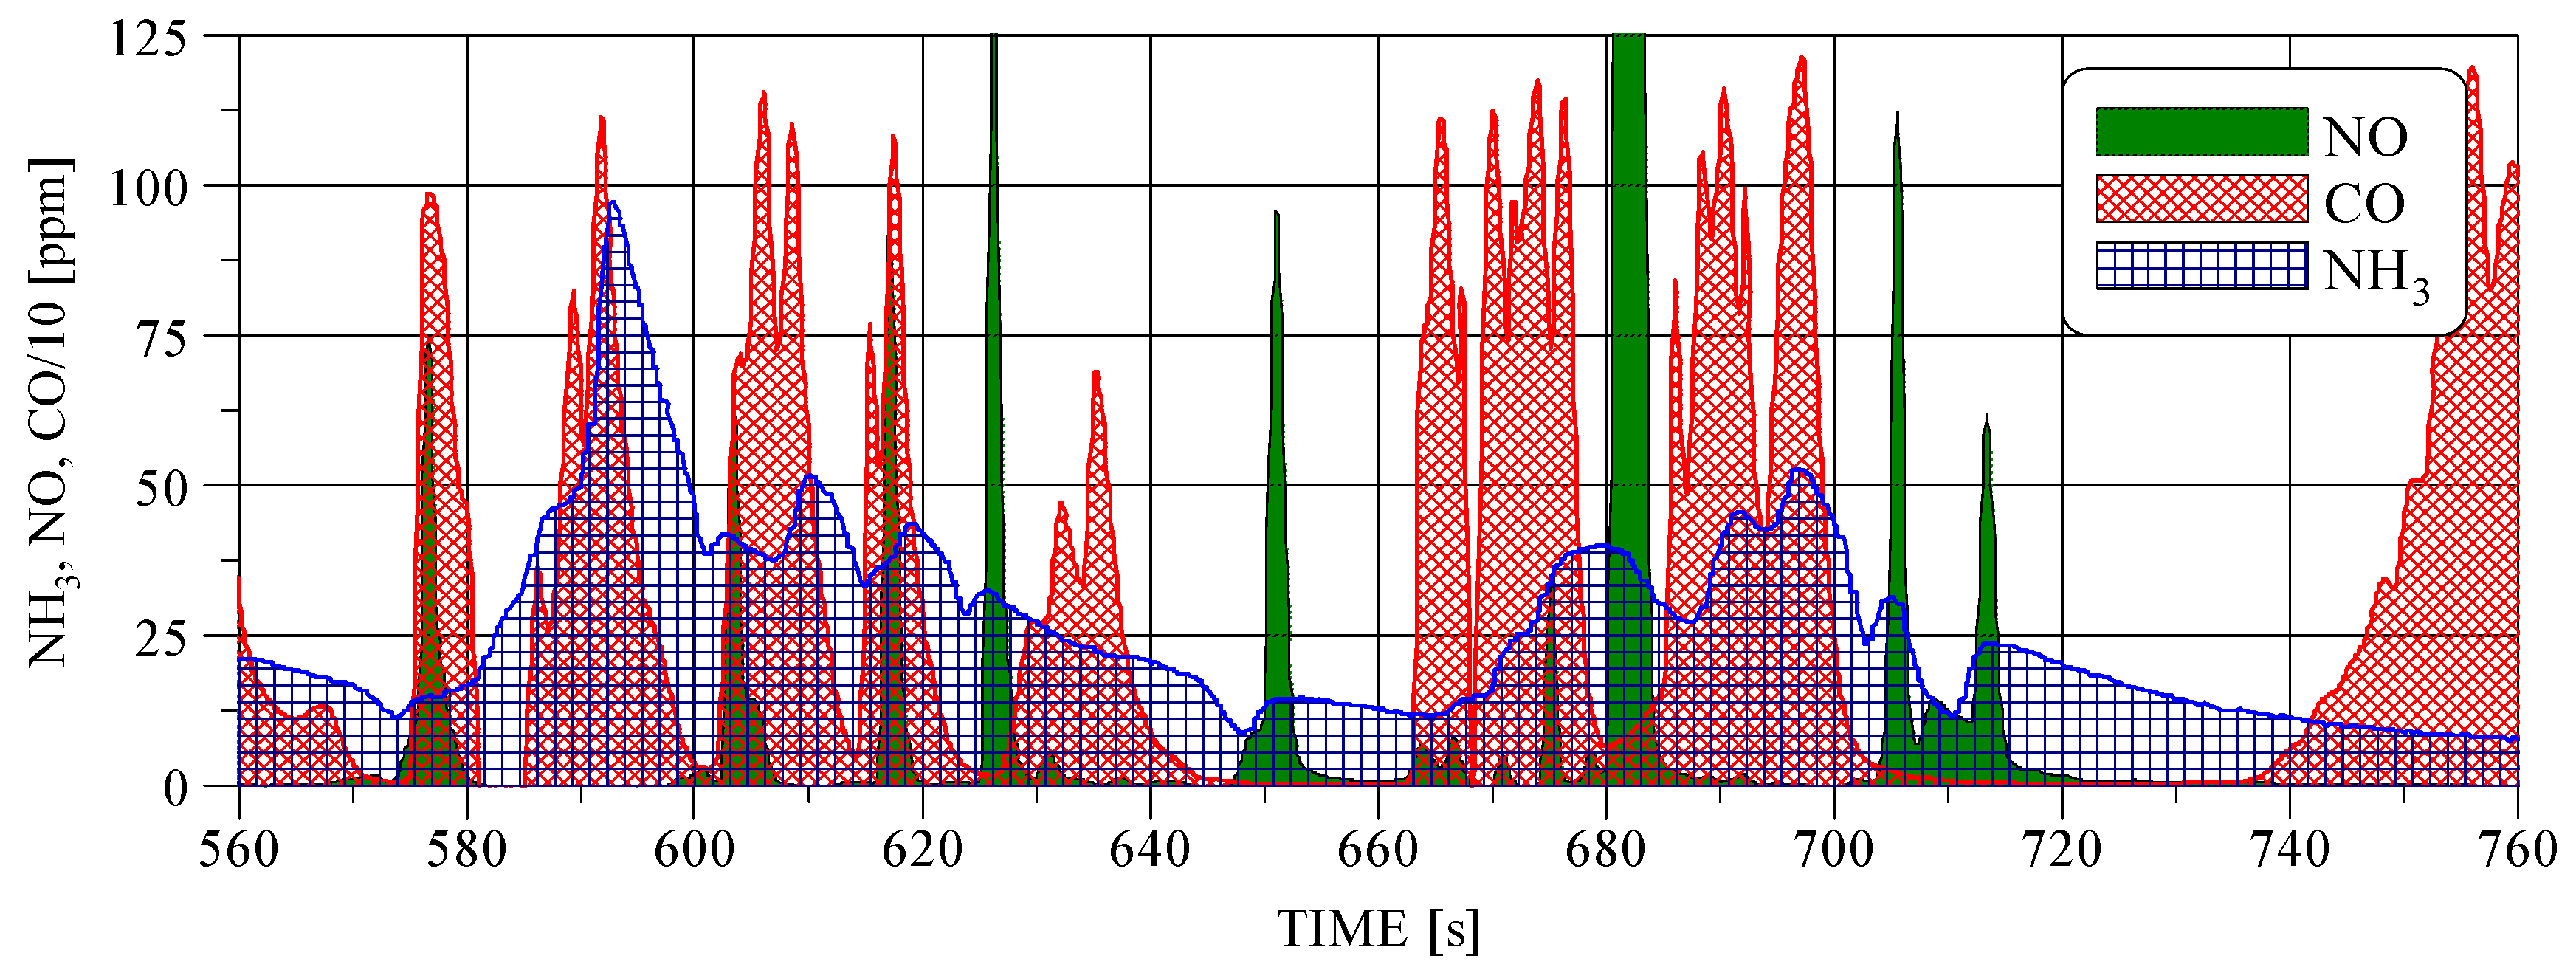
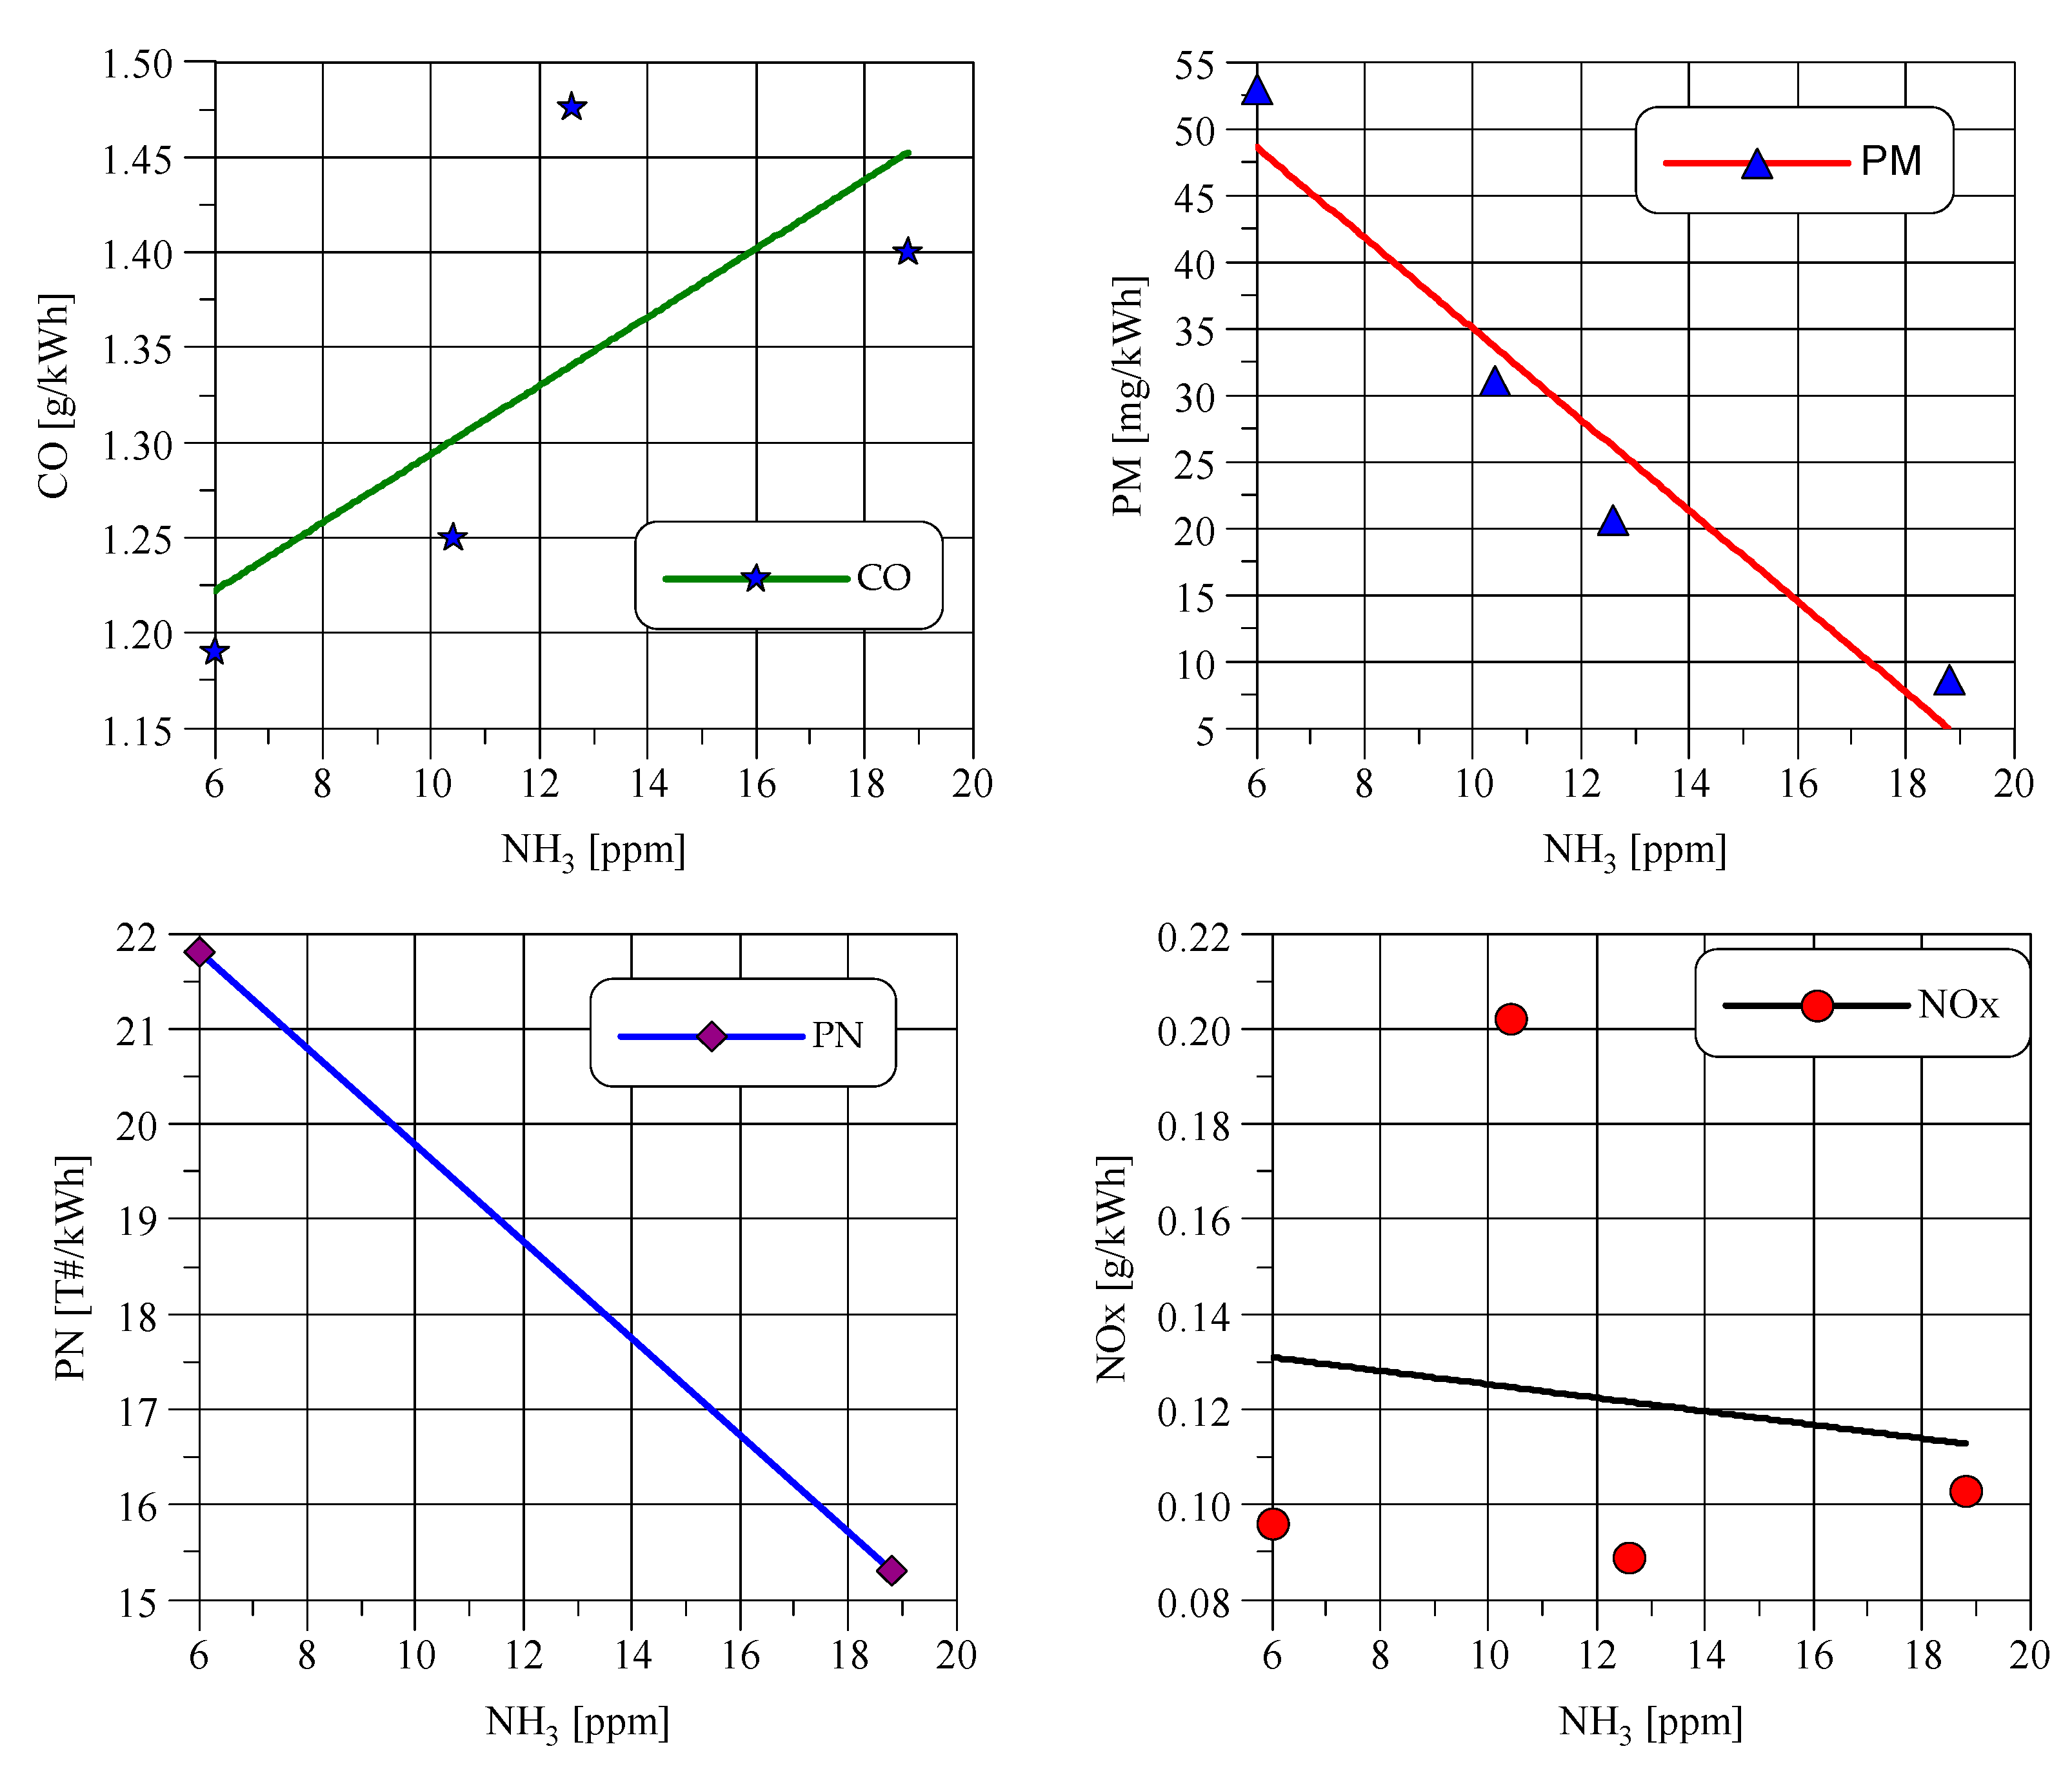
2.2. Result of the Testing

Figure 1 shows the NH3 concentration in the exhaust gas and the exhaust temperature during the hot World Harmonized Transient Cycle (WHTC). In accordance with UN Regulation No. 49.06, the WHTC cycle is a commonly used pollutant emissions test in Euro VI standard. The figure shows that NH3 reaches relatively low concentrations at both low and high exhaust gas temperatures, which roughly corresponds to the urban and highway phases of the WHTC cycle. The relatively high concentration of NH3 is achieved during rural driving, where the exhaust gas temperature is approx. 550–600 °C.
Figure 2 shows the dependence of NH3 concentration and the exhaust gas temperature in the WHTC cycle. The total duration of the WHTC cycle is 1800 s. The cycle covers three successive different types of driving conditions—urban, rural, and highway, 600 s each. Urban driving mode is characterized by the greatest frequency of changes in engine speed and loading. In highway driving mode, the changes of engine speed and loading are relatively the smallest.
The highest concentrations of NH3 correspond to the exhaust gas temperature range of 570–625 °C. Outside this temperature range, the NH3 concentration decreases with both increasing and decreasing temperature. The distribution of NH3 concentrations (Figure 2) indicates that the NH3 concentration increases along with the increase in exhaust gas temperature from the lowest values to approx. 570 °C. This means that one of the reactions responsible for the NH3 formation (i.e., (1) or (2)) is accelerated. It is claimed [3] that this is an effect of water gas shift reaction (reaction (3)). At higher temperatures, this reaction slows down and the hydrogen needed for NH3 formation is produced as a result of hydrocarbons steam reforming (reaction (4)).
Most of the registered points in the WHTC cycle having the highest concentrations of NH3 (Figure 2) correspond to the exhaust gas temperatures with the highest frequency of occurrence in the cycle (Figure 3); hence, they have significant importance and influence on total NH3 emissions in the whole emission cycle.
The concentrations of the gases participating in the reactions (1)–(4) should be correlated with each other. However, only the concentration of CH4 from the concentrations of NO, CO, particulate number emissions (PN), and CH4 presented in Figure 4, i.e., all exhaust gas components related to the formation of NH3, is similar to the course of NH3 concentrations (Figure 2). This observation is confirmed by the values of the correlation coefficients presented in Table 1.
The correlation coefficient (r) between x and y parameters were calculated in accordance with Formula (5). This is a measure of the relationship between two measured data values.
r = i = 1 n ( x i x ¯ ) ( y i y ¯ ) i = 1 n ( x i x ¯ ) 2 i = 1 n ( y i y ¯ ) 2
where xi, yi are the current values of x and y parameters as a function of time in the WHTC cycle, x ¯ , y ¯ are the mean values of parameters x and y in the WHTC cycle, and n = 18,000 is the number of registered points in the test.
Small values of the correlation coefficient for NO, CO, and PN (Table 1) indicate that used TWC had proper conversion efficiency for these pollutants, and its efficiency was independent of NH3 concentration. A much stronger correlation between NH3 and CH4 means that TWC had rather poor conversion efficiency for CH4, and as a result, a linear relationship can be found between concentrations of these two exhaust gas components.
In SI engines, NO and CH4 concentrations depend on engine loading, and for this reason, the initial increase of NO and CH4 concentrations in Figure 4 is due to the increase of the engine loading. It can be observed that the maximum of NO and CH4 concentrations occur at TEXH = 600–625 °C and then decrease with increasing exhaust gas temperature. This means that the TWC’s conversion efficiency and the decrease of NO and CH4 concentrations caused by it become greater in this temperature than the increase of the concentration caused by the engine loading changes. TWC used in the tests has sufficient efficiency of CO and NMHC oxidation in the whole operating range of the exhaust gas temperature shown in Figure 4. However, CH4 conversion efficiency apparently depends on the temperature. It may be an effect of the commonly known fact that methane oxidizes poorly in platinum-dominant catalytic converters used in gasoline-powered engines. The effect of exhaust gas temperature on the PN number concentration is difficult to notice.
The strong correlation between NH3 and CH4, especially for CH4 emitted in the highway phase of the emission cycle, confirms an important role that reaction (4) plays in the creation of conditions for the NH3 formation. In particular, it means that when the exhaust gas temperature increases (transition from the urban phase to the highway phase), the share of reaction (4) in the NH4 formation process increases, which proves that the share of reaction (3) in this process is simultaneously decreasing.
Figure 5 shows the relative rate of mass emissions (NO, CH4, CO, and NH3) and particulate number emissions (PN) in the WHTC cycle. In this figure, it can be seen that each pollutant is emitted with different mass rates expressed as a percentage of the total mass emissions of a pollutant. In the initial phase of the test (urban driving), the relative rate of emission is approximately constant for each pollutant. This part of the WHTC cycle is characterized by relatively low exhaust gas temperatures, relatively low average engine load, and frequent changes in engine loading and speed. In the rural phase of the WHTC cycle (600–1200 s), where the exhaust gas temperature, engine loading, and its speed increase, and the frequency of gear changes and braking decreases, the TWC reactor operates with greater efficiency, which significantly reduces the mass rate of CO emissions. At the same time, CH4 emissions increase as a result of the poor efficiency of catalytic converter for CH4 conversion and more exhaust mass flow through the exhaust system.
Throughout the WHTC cycle, the mass rate of CH4 and NH3 emissions are similar to each other. In the rural phase of the WHTC cycle, the rate of particle number (PN) emissions has increased compared to other pollutants. This may be the result of a higher concentration of NH3 in this part of the test cycle and, as a result, acceleration of the reactions (6) and (7), whose product is particulate matter. Comparing the relative mass emission of different pollutants in the rural fragment of the WHTC cycle, it can be observed that the relative mass rate of NH3 increases faster than the NO and CO emissions. Reactions (1)–(3) in which CO and NO are involved directly or indirectly may be responsible for this phenomenon.
In the final phase of the WHTC cycle (highway driving), the exhaust gas temperature increases to its maximum value. It reduces the NH3 concentration as an effect of more stable driving. This results in the decrease of the NH3 emission rate in the final part of the WHTC cycle, and the equalization of the rate of NH3, CH4, and PN of emissions changes as a consequence.
Table 2 shows the masses of emitted pollutants and their specific emissions. Based on the stoichiometry of reactions (1) and (2), it can be determined that 0.56 kg of NH3 was produced from 1 kg of NO, which means that 1.41 g of NO was used to produce 0.79 g of NH3 stated in Table 2. Similarly, it can be determined that an additional 3.9 g of CO was consumed in reaction (1) to make 0.79 g of NH3. The above stoichiometric calculations show that if the engine did not generate NH3, NO and CO emissions would have to increase by 360 and 19 %, respectively.
Figure 6 and Figure 7 show cumulative masses of emissions and their ratios in the WHTC cycle determined by dividing the mass of NH3 emissions by the mass of the selected pollutants. This figure shows how the NH3 emission is changing in relation to other pollutants during the WHTC cycle. In contrast to the NH3/THC emission ratio, which is constant for most of the test, the NH3/CO and NH3/NO ratios have their visible maxima near the beginning of the highway driving, which is caused by the rapid increase of engine loading after idling.
The conditions for the formation of NH3 emissions occur when NO and CO are present in the exhaust gas. The concentrations shown in Figure 8 were measured at the TWC outlet of single cylinder row and are not real concentrations of CO and NO in raw exhaust at the inlet to the catalytic converter. In TWC, a significant part of the CO is oxidized and only a part of the CO is involved in the conversion of NO according to the following reactions:
2 NO + CO → N2O + CO2
2 NO + H2 → N2O + H2O
If no NH3 was formed in the TWC, the emissions of NO, NOx, and CO (Table 2) could be greater. It is possible to trace (Figure 8) the coincidence of CO and NO concentration peaks with NH3 peaks. As already mentioned, in positive ignition engines, the NH3 emission depends on the CO emission, which in turn depends on the air–fuel ratio. In a stoichiometric engine equipped with a lambda sensor, the air–fuel ratio oscillates around 1.00 (Figure 9). The frequency and amplitude of these oscillations depend on the characteristics of the fuel control unit. If the changes of the air–fuel ratio take place in a narrower range than shown in Figure 9, lower NH3 emissions can be expected.
Figure 10 shows that, as a result of various changes in the regulation of the engine control system and the exhaust after-treatment system, a significant change in the concentration of NH3 in the exhaust gas was achieved. As predicted, during greater CO emissions, more NH3 is formed due to the increased concentration of free H2 in the exhaust gas. When NH3 concentration is lower, NO emissions increase due to ceasing NO conversion to NH3.
Emissions of particulate mass (PM) and particulate number (PN) decrease with the increase in NH3 concentration, which may be partly due to the effect of converting ammonia to solid particles by the reaction of NH3 with nitric and sulfuric acids. Figure 10 shows that the desire to reduce NH3 emissions may result in an increase in particulate emissions. In the tested engine, it was necessary to use a particulate filter (DPF) as a part of the exhaust after-treatment system.

3. Discussion

The conducted tests showed the ability to emit NH3 by SI engines. The combination of selected factors like TWC temperature, air–fuel ratio, or the type of precious metal coating in the TWC may cause an increase in NH3 emissions. The tested engine met the Euro VI requirements for all limited exhaust gas components (CO, NOx, NMHC, PM, and PN) in each tested variant, but its NH3 emission was clearly dependent on the air–fuel regulation and the TWC used. If an engine taken from the tested engine family was used in a light-duty vehicle, it could still be characterized by excessive NH3 emissions despite passing the type-approval process. The influence of ammonia formation in the TWC on the emissions of particulate matter resulting from its reaction with nitric and sulfuric acids is not sufficiently investigated. It would be interesting to find an answer to the question of how much the fight against NH3 emissions would reduce the PM emissions at the same time.
NH3 is a toxic pollutant, the concentration of which in the atmosphere has been systematically increasing for many years [26]. This is mainly the effect of processes taking place in agriculture, but emissions from vehicles also participate in the increasing pollution. In vehicles’ engines, the source of NH3 emissions can be ammonia slip in the diesel’s SCR and the processes taking place in the three-way catalyst in SI engines. The article shows that the main way to reduce NH3 emissions in the SI engines is to reduce CO and NO emissions in the exhaust gas. In particular, this may be a significant problem in gaseous engines. Due to the greater value of hydrogen/carbon ratio in fuels such as CNG or LPG as compared to gasoline, exhaust gases from engines powered by gaseous fuels are characterized by a lower CO concentration and a higher content of H2O. Based on reactions (2)–(4), a greater share of H2 in fuel and H2O in the exhaust gas can be considered stimulating factors in NH3 emissions. As it is commonly known, the TWC technology uses CO for NO conversion. To ensure CO required mass for NO conversion, the range of acceptable air–fuel ratio variability in gaseous engines should be lower than for gasoline engine. For this reason, the gaseous engine will be more liable to increase NO emissions during dynamic driving and rapid changes of vehicle speed and more liable to greater NH3 emissions. The cases presented in Figure 10 prove that in the engine fueled with propane, high NH3 emissions occurred only in the case of a simultaneous increase of CO and NO emissions (the invisible increase of NO emissions in Figure 10 was almost completely converted to NH3).

4. Conclusions

Widespread use of TWC in exhaust after-treatment systems of spark-ignition engines used in light-duty vehicles can result in ammonia formation in the exhaust gas. So far, this pollutant is not limited by international regulation regarding the light-duty vehicle, although emitted NH3 may increase the content of this component in the ambient air. Currently, a regulation exists of ammonia slip from ships and heavy-duty vehicles, and it is necessary to propose a method to eliminate this problem in other vehicles. Now is the right time to take this issue into account in the future Euro 7 regulation that is being developed.

Author Contributions

Conceptualization, A.Ż. and W.G.; methodology, A.Ż. and W.G.; software, A.Ż.; validation, A.Ż. and W.G.; investigation, A.Ż.; resources, A.Ż. and W.G.; data curation, A.Ż.; writing—original draft preparation, A.Ż.; writing—review and editing, A.Ż. and W.G.; supervision, A.Ż.; funding acquisition, A.Ż. and W.G. All authors have read and agreed to the published version of the manuscript.

Funding

This research received no external funding.

Institutional Review Board Statement

Not applicable.

Informed Consent Statement

Not applicable.

Conflicts of Interest

The authors declare no conflict of interest.

References

  1. Public Health Statement: Ammonia. UN Agency for Toxic Substances and Disease Registry. Available online: https://www.atsdr.cdc.gov/ToxProfiles/tp126-c1-b.pdf (accessed on 27 January 2021).
  2. Osha, U. Globally Harmonized System of Classification and Lablling of CHEMICALS (GHS); United Nation: Geneva, Switzerland, 2011; Available online: https://www.unece.org/fileadmin/DAM/trans/danger/publi/ghs/ghs_rev04/English/ST-SG-AC10-30-Rev4e.pdf (accessed on 27 January 2021).
  3. Pradhan, S. Development of an Ammonia Reduction After-Treatment Systems Development of an Ammonia Reduction After-Treatment Systems for Stoichiometric Natural Gas Engines for Stoichiometric Natural Gas Engines. SAE Int. J. Engines 2017, 10, 104–109. [Google Scholar] [CrossRef]
  4. Regulation (EC) No. 595/2009 of the European Parliament and of the Council of 18 June 2009. Off. J. Eur. Union L188 2009. [CrossRef]
  5. Nevalainen, P.; Kinnunen, N.M.; Kirveslahti, A.; Kallinen, K.; Maunula, T.; Keenan, M.; Suvanto, M. Formation of NH3 and N2O in a modern natural gas three-way catalyst designed for heavy-duty vehicles: The effects of simulated exhaust gas composition and ageing. Appl. Catal. A Gen. 2018, 552, 30–37. [Google Scholar] [CrossRef]
  6. Mejía-Centenoa, I.; Castillo, B.; Fuentesa, G. Enhanced emissions of NH3, N2O and H2 from a Pd-only TWC and supported Pd model catalysts: Light-off and sulfur level studies. Appl. Catal. B Environ. 2012, 119, 234–240. [Google Scholar] [CrossRef]
  7. Suarez-Bertoa, R.; Zardini, A.A.; Astorga, C. Ammonia exhaust emissions from spark ignition vehicles over the New European Driving Cycle. Atmos. Environ. 2014, 97, 43–53. [Google Scholar] [CrossRef]
  8. Adams, E.C. Catalytic Formation of Ammonia from Nitric Oxide. Ph.D. Thesis, Department of Chemistry and Chemical Engineering, Chalmers University of Technology, Gothenburg, Sweden, 2016. [Google Scholar]
  9. Gong, J.; Rutland, C.H. Three Way Catalyst Modeling with Ammonia and Nitrous Oxide Kinetics for a Lean Burn Spark Ignition Direct Injection (SIDI) Gasoline Engine; SAE International: Warrendale, PA, USA, 2013. [Google Scholar]
  10. Prikhodko, V.Y.; Pihl, J.A.; Toops, T.J.; Parks, J.E., II. Ammonia Generation over TWC with NOX Storage Component for Passive SCR NOX Control in Lean Gasoline Engines. SAE Int. J. Engines 2014, 7, 1235–1243. [Google Scholar] [CrossRef]
  11. Li, M.; Tian, H.; Wei, Z.; Zhang, Q.; Shen, B. Ammonia and nitrous oxide emissions of a stoichiometric natural gas engine operating with high caloric value and low caloric value fuels. Fuel 2021, 285, 119166. [Google Scholar] [CrossRef]
  12. Borsari, V.; de Vicente Assunção, J. Ammonia emissions from a light-duty vehicle. Clim. Chang. 2012, 111, 519–531. [Google Scholar] [CrossRef]
  13. Sun, K.; Tao, L.; Miller, D.J.; Pan, D.; Golston, L.M.; Zondlo, M.A.; Griffin, R.J.; Wallace, H.W.; Leong, Y.J.; Yang, M.M.; et al. Vehicle Emissions as an Important Urban Ammonia Source in the United States and China. Environ. Sci. Technol. 2017, 51, 2472–2481. [Google Scholar] [CrossRef] [PubMed]
  14. Gao, F.; Tang, X.; Yi, H.; Zhao, S.; Li, C.; Li, J.; Shi, Y.; Meng, X. A Review on Selective Catalytic Reduction of NOx by NH3 over Mn–Based Catalysts at Low Temperatures: Catalysts, Mechanisms, Kinetics and DFT Calculations. Catalysts 2017, 7, 199. [Google Scholar] [CrossRef]
  15. Toops, T.J.; Parks, J.E., II; Pihl, J.A.; DiGiulio, C.D.; Amirdis, M.D. Lean Gasoline Emissions Control: NH3 generation over commercial Three-Way Catalysts and Lean-NOx Traps, Amiridis. In Proceedings of the 2012 DEER Conference, Dearborn, MI, USA, 18 October 2012. [Google Scholar]
  16. Ribeiro, T.C. Understanding NH3 Emissions Over a Three-Way Catalyst in Lean/Rich Conditions; Instituto Superior Tecnico Lisboa Portugal: Lisboa, Portugal, 2015. [Google Scholar]
  17. Prikhodko, V.Y. Passive Ammonia-SCR Catalyst System for NOX Abatement from Lean-Burn Gasoline Engines: NH3 formation over TWC. Ph.D. Thesis, University of Tennessee, Knoxville, TN, USA, 2018. [Google Scholar]
  18. Durbin, T.D.; Wilson, R.D.; Norbeck, J.M.; Miller, J.W.; Huai, T.; Bourns, S.R. Emissions of Ammonia from Light-Duty Vehicles. In Proceedings of the 10th International Emission Inventory Conference–“One Atmosphere, One Inventory, Many Challenges”, Denver, CO, USA, 1–3 May 2001. [Google Scholar]
  19. Durbin, T.D.; Wilson, R.D.; Norbeck, J.M.; Miller, J.W.; Huai, T.; Rhee, S.H. Estimates of the emission rates of ammonia from light-duty vehicles using standard chassis dynamometer test cycles. Atmos. Environ. 2002, 36, 1475–1482. [Google Scholar] [CrossRef] [Green Version]
  20. Cant, N.W.; Chambers, D.C.; Liu, I.O.Y. The formation of isocyanic acid and ammonia during the reduction of NO over supported platinum group metals. Catal. Today 2004, 93, 761–768. [Google Scholar] [CrossRef]
  21. Ma, H.; Schneider, W.F. DFT and microkinetic comparison of Pt, Pd and Rh-catalyzed ammonia oxidation. J. Catal. 2020, 383, 322–330. [Google Scholar]
  22. Kean, A.J.; Littlejohn, D.; Ban-Weiss, G.A.; Harley, R.A.; Kirchstetter, T.W.; Lundenb, M.M. Trends in on-road vehicle emissions of ammonia. Atmos. Environ. 2009, 43, 1565–1570. [Google Scholar] [CrossRef] [Green Version]
  23. Backes, A.M.; Aulinger, A.; Bieser, J.; Volker, M.; Quante, M. Ammonia emissions in Europe, part II: How ammonia emission abatement strategies affect secondary aerosols. Atmos. Environ. 2016, 126, 153–161. [Google Scholar]
  24. Ntziachristos, L.; Samaras, Z. EMEP/EEA Air Pollutant Emission Inventory Guidebook 2019; European Environment Agency: Copenhagen, Denmark, 2019; pp. 79–84.
  25. Michal Vojtíšek-Loma, M.; Beránek, V.; Klír, V.; Jindra, P.; Pechout, M.; Voříšek, T. On-road and laboratory emissions of NO, NO2, NH3, N2O and CH4 from late-model EU light utility vehicles: Comparison of diesel and CNG. Sci. Total Environ. 2018, 616, 774–784. [Google Scholar] [CrossRef] [PubMed]
  26. Lang, J.; Zhou, Y.; Cheng Sh Zhang, Y.; Dong, M.; Li Sh Wang, G.; Zhang, Y. Unregulated pollutant emissions from on-road vehicles in China, 1999–2014. Sci. Total Environ. 2016, 573, 974–984. [Google Scholar] [PubMed]
Figure 1. NH3 concentration and exhaust gas temperature in the hot World Harmonized Transient Cycle (WHTC).
Energies 14 00691 g001
Figure 2. NH3 concentration versus exhaust gas temperature (TEXH) in the hot WHTC cycle.
Energies 14 00691 g002
Figure 3. Histogram showing the relative frequency (in %) of exhaust gas temperature in classes with a width of 25 °C.
Energies 14 00691 g003
Figure 4. The concentration of different exhaust gas components at the three-way catalytic reactor (TWC) outlet in the hot WHTC cycle as a function of exhaust gas temperature.
Energies 14 00691 g004
Figure 5. The relative rate of mass emissions in the WHTC cycle.
Energies 14 00691 g005
Figure 6. The cumulative mass of emissions versus time in the WHTC cycle.
Energies 14 00691 g006
Figure 7. The cumulative mass of emissions ratios in the WHTC cycle.
Energies 14 00691 g007
Figure 8. CO, NO, and NH3 concentrations at the outlet of the engine exhaust system in a fragment of the WHTC cycle.
Energies 14 00691 g008
Figure 9. Histogram of relative air–fuel ratio distribution in classes with a width of 0.005. Hot WHTC cycle.
Energies 14 00691 g009
Figure 10. Emissions in the WHTC cycle versus mean NH3 concentration in the test.
Energies 14 00691 g010
Table 1. Correlation coefficients of NH3 concentration and selected exhaust component at the TWC outlet.
Exhaust ComponentCorrelation
NO0.12
CO0.06
PN0.08
CH4 (whole WHT cycle)0.63
CH4 (urban)0.55
CH4 (rural)0.62
CH4 (highway)0.75
Table 2. Mass of pollutant and specific emissions in the tested engine in the WHTC cycle.
PollutantMass of Pollutant
[g]
Specific Emissions
[mg/kWh]
CO30.62045
NOx0.8154
NO0.5335
THC0.2416
CH40.1711
NH30.7953
Publisher’s Note: MDPI stays neutral with regard to jurisdictional claims in published maps and institutional affiliations.

