Abstract
The environmental safety of a car is currently one of the most important indicators of vehicle competitiveness and quality in the consumer market. Currently, assessment of the ecological properties of vehicles is based on various criteria. In the case of combustion-powered cars, most attention is usually paid to the values characterizing their use, and in terms of environmental assessment, pollutant emissions, and operational fuel consumption are key factors. The current article considers the possibility of using the life cycle assessment (LCA) method to analyze the ecological properties of a passenger car during its operation. A simplified LCA method for vehicles, which, in strictly defined cases, can be used for the analysis of environmental impact and assessment of the energy analysis related to its operation, is presented. For this purpose, a vehicle life cycle model is developed. Data on the operation of 33 passenger cars from different manufacturers with similar operational characteristics, coming from different production periods, are analyzed in detail. The vehicle use model takes into account the environmental load due to fuel consumption and pollutant emissions from the internal combustion engine, as well as processes related to the maintenance of the car. The obtained results show that, from the point of view of a car’s impact on the environment throughout its life cycle, the phase of its operation plays the most important role. For the annual operation period, the results of the analysis lead to the conclusion that, in the assessment of energy inputs and related emissions throughout the life cycle of a passenger car, the mileage of the car, which is determined by both the periodicity of replacement of elements and materials subject to normal wear and the length of the adopted period, is of key importance. For the tested vehicles, both the energy input resulting from fuel consumption as well as CO2 and SO2 emissions constitute about 94% to 96% of the total input during the annual operation of the vehicle.
1. Introduction
The global automotive industry is currently facing serious challenges related to ongoing global environmental degradation. Currently, there is no doubt that road transport—next to the energy sector—poses one of the greatest threats to the environment, due to both the systematic increase in global carbon dioxide (CO2) emissions and the increase in the amount of waste generated during the production and disposal of end-of-life vehicles [1,2]. For example, in Europe, transport is the biggest source of CO2 and is responsible for the emissions of over a quarter of all greenhouse gases [1]. Transport emissions have increased by a quarter since 1990 and are continuing to rise with oil consumption in the EU in 2017 increasing at its fastest pace since 2001 [3].
Concerns about the negative environmental impact of car transport have been exacerbated by the constantly growing number of cars in the world. Legal regulations aimed at eliminating environmentally harmful technologies are being used to reduce environmental degradation by road transport. Stricter environmental standards have put the automotive industry under increasing pressure to reduce fuel consumption and exhaust emissions over the lifetime of a car. Hence, most research has focused on reducing the energy consumption and emissions of toxic compounds and CO2 emissions directly related to car operation.
There are many methods for assessing the ecological properties of a car. In the case of cars with internal combustion engines, a traditional approach to environmental assessment is primarily used to determine the amount of CO2 emissions, which depends on the type and amount of fuel consumed. The research methods used are largely objectified; they have a long tradition in the automotive industry and are based on an extensive body of knowledge. The result of this approach are the existing EURO standards. The methodology (LCA) described in standards ISO 14,040 [4] and 14,044 [5] expresses a contemporary approach to the problem of the impact of cars on the environment and has been used for this purpose for over 30 years [6]. It is used to determine the potential environmental impact of the processes related to the entire contractual lifetime of the car, from the production of materials, through to the production of the car, its operation, and its decommissioning. Many studies have evaluated the car from the point of view of life cycle analysis. Some works have focused on the environmental assessment of the vehicle construction phase [6,7]. Most often, individual components or the assembly of a car have been the subjects of a detailed life cycle assessment (LCA) [8]. Other research has focused on car design in terms of the ease of assembly [7]. Estimates on the shares of individual processes in the environmental load of a car throughout its life cycle have also been presented [7]. They show that the car operation process has a dominant impact on energy consumption and the amount of pollutant emissions [6]. Since then, there has been a lot of work done on the assessment of the impact of car use on the environment. Among the many impacts of the automotive industry on the environment, attention has been paid primarily to air pollution by toxic substances emitted from vehicles, which pose a threat to human health [9,10] and to the growing consumption of limited resources of fossil fuels [11]. Other studies have indicated the high effectiveness of the weight curb strategy in order to reduce the environmental impact during car operation [12]. Without a doubt, these problems continue to grow as the demand for means of transport is now increasing. According to the Regulations of the United Nations Economic Commission for Europe (UNECE), air emissions from the transport sector currently account for about 23% of total anthropogenic CO2 emissions on a global scale [13]. The number of light duty vehicles is expected to increase from around 1.3 billion by 2030 to 2 billion by 2050, which could also lead to a significant increase in demand for gasoline and diesel in the coming years and which will undoubtedly impact energy security, climate change, and air quality, not only in cities but also outside them [14]. In this context, sustainable development has become a very important issue for the automotive industry, motivating the transport industry to significantly reduce the overall environmental impact of vehicles, especially during operation. Attention has mostly been paid to the environmental assessment of car driving technologies. In particular, fuel efficiency has been analyzed in terms of minimizing the consumption of materials and energy [15]. Significant emphasis has also been placed on the use of batteries in electric vehicles (BEV), which are now treated as a real factor in environmental protection as they reduce the use of fossil fuels [16]. For this reason, currently, the most frequently presented studies in the literature are those comparing the ecological profiles of vehicles with various driving technologies, such as the comparison of internal combustion engine cars with purely electric and hybrid cars [17,18]. The fuel consumption and emissions of electric and hybrid vehicles have also been studied from the perspective of the life cycle analysis [19,20,21,22]. The aim of this research was to show that electric mobility plays a particularly important role in the sustainable development of road transport. Often, however, comparative studies limited to local conditions have been carried out.
Many studies have focused only on specific elements of the vehicle, such as the battery [23,24,25], but this information is scarce and it is based on materials available in the literature.
Several studies have assessed the impact on the environment of elements other than the drive unit of the vehicle. They included the material input for the entire vehicle, and on this basis, analyses were made throughout the entire life cycle, including the operation phase [26,27,28]. In these studies, the inventory data contained in the literature have often been used, and on this basis, the environmental impact of the car has been assessed. In addition, the most frequently studied phase has been the vehicle production phase, mainly regarding the production of the powertrain. A comparison of the environmental profiles of conventional and electric cars is also presented in [29,30,31,32]. Although the share of plug-in hybrid vehicle and electric vehicle sales is growing, cars with internal combustion engines continue to have a decisive influence on the environmental and energy efficiency of the car fleet. Hence, this article is focused on the modeling of the environmental impacts of this type of vehicle.
Along with the development of civilization, the awareness of current environmental threats and the great need to counteract them has increased. This is particularly evident in the automotive industry, where environmental issues have recently become more and more significant. Currently, the ecological properties of vehicles, in addition to the safety systems used, are often considered to be indicators of technical progress in the automotive industry. The problem with vehicle use and its impact on the environment is becoming more and more serious nowadays due to the constantly growing transport needs [33]. It is much easier to minimize the negative effects of stationary emission sources than the effects of many millions of moving vehicles. The aim of this article is to propose a model of the environmental impact of the car operation phase. Using the developed model, selected aspects of its ecological evaluation under operating conditions are presented.
2. Modeling the Car Operation Phase
2.1. Purpose and Scope of the Research
The environmental assessment of a vehicle under operating conditions presented in the article is based on a life cycle model of a passenger car that uses the LCA method in accordance with the requirements of ISO 14,040 and ISO 14,044. The environmental assessment of the operation phase is presented using the example of 30 passenger car models of the same generation, manufactured since 1984, with comparable operating characteristics. These are front-wheel drive vehicles with a manual gearbox. The vehicle use model takes into account the environmental load due to fuel consumption and pollutant emissions from the internal combustion engine as well as processes related to the maintenance of the car. The assessment of these processes provides a supply of additional material streams needed to carry out periodic maintenance and emergency repairs. In order to ensure the comparability of the evaluation results, cars with a gasoline engine with a capacity of 1.2 to 1.5 dm3, standard equipment, and comparable performance were considered. The vehicles bodies include a three- and five-door hatchback and a four-door sedan. They were produced and operated in the years 1984–2013. These years were divided into five six-year periods. For each period, 4 to 8 vehicles of different brands were assigned, for which the average results of the analysis are presented in three adopted categories related to environmental impact: material consumption, energy consumption, and the accompanying emission levels. Each subsequent passenger car of a given brand was the successor of the previous model. Due to the high complexity of the structure and the lack of detailed data on the production processes, the energy and ecological characteristics of the vehicles in question were determined on the basis of the results of a detailed inventory of materials with known characteristics used for their production. This approach allowed a detailed comparative analysis of the environmental loads characterizing vehicles from different manufacturers to be conducted. This included changes in the material structures of vehicles within the considered time period and an assessment of the possibility for pro-ecological rationalization of car production in the future. During a detailed analysis, 27 material groups were identified. In terms of energy consumption and emission levels, the total environmental load of these amounted to 95% of the environmental impact of the total mass of raw materials involved in the vehicle manufacturing process. The characteristics necessary for the analysis of selected material groups were obtained from the databases Gemis and LCA Plastics Europe Report and from the supporting calculation programs SimaPro and Greet. The energy inputs and emission levels in the operation phase of the selected cars related to fuel consumption were assessed on the basis of the technical data of the tested vehicles, in which the average fuel consumption was determined according to the measurement method of the United Nations Economic Commission for Europe described in regulation ECE R83.
The basic assumption used in the presented model was the analytical modeling of the production phase of a passenger vehicle, as shown in Figure 1. The first stage involved its division into assemblies (A), which were then divided into sub-assemblies (S) consisting of individual materials (M) with a specific mass (m). These materials were grouped into five basic groups: ferrous metals, aluminum and its alloys, plastics, non-ferrous metals, and other materials. Determining the material structure of a motor vehicle is the basis for determining the amount of energy and ecological input for individual types of materials, including the materials used for the car’s operation phase. The vehicle use model takes into account the environmental load resulting from fuel combustion in the internal combustion engine during actual car driving. The processes related to the maintenance of the car and the production and delivery of fuel were taken into account.
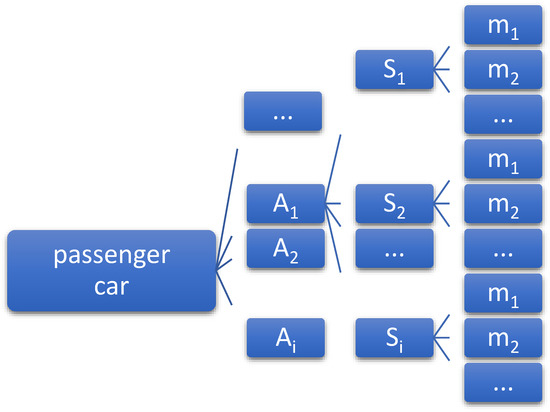
Figure 1.
Analytical model of passenger car decomposition.
According to ISO 14,040 (2006), the LCA covers all stages of the life cycle, from creation to disposal of a product or service and from raw material extraction, through to production and use, and waste management. In all phases of the life cycle, energy and natural resources are used and pollutants are released into the environment. In line with the aim of our research, in order to be able to effectively compare the environmental profiles of cars using a long-term perspective, we limited the scope of the assessment to the processes and material streams directly related to the production of materials, the use of the car, and the end of its life. On the other hand, the impacts of production and transport infrastructure were ignored. This means that during these processes, only substances that are released to the environment exceed the system boundaries covering the entire life cycle (production, use, and recycling phase of the car).
2.2. Model Inventory Data
The operation of passenger cars involves a set of deliberate organizational, technical, and economic activities involving people, vehicle, and the interactions between them, from the moment of taking over the vehicle for use in accordance with its intended use, until its liquidation. The service life of the vehicle primarily involves use and maintenance. The operational use of a vehicle is an activity related to its intended use. During use, the car is subject to wear processes, leading to changes in its technical condition. It is therefore necessary to take appropriate actions related to the maintenance of the vehicle so that it can be safely used for its intended purpose. Using the concept of maintenance, we can distinguish activities related to checking the condition of the vehicle and preventing excessive and premature wear (called maintenance) as well as activities consisting of removing the effects of wear and restoring the vehicle’s condition (called repair). In practice, the boundary between maintenance and repair is often negligible, which is why both activities are called maintenance. All maintenance during vehicle operation should be performed regularly in cycles depending on the mileage of the vehicle, its operating time, the seasons of the year, and the occurrence of special operating conditions, such as external temperature, humidity, dustiness, and increased intensity of use. The vast majority of maintenance cycles are related to the actual mileage of the vehicle, which is measured with an onboard odometer. This meter reflects the actual wear process of mechanisms and consumables used relatively accurately. Vehicle designers strive to minimize the frequency of necessary maintenance for the convenience of users. However, maintenance cycles of tens of thousands of kilometers traveled oblige, in turn, the user to keep appropriate documentation of the treatments performed and to accurately track the meter readings. In this respect, it is more convenient to conduct services in seasonal cycles, in line with the natural cycles of nature or with the administrative cycles of periodic technical inspections.
Data for the environmental assessment of the vehicle operation process were obtained during tests carried out at a certified disassembly station in Szczecin (Poland). Data obtained from the literature were also used [33,34]. As part of the research, the cars were disassembled into assemblies and individual parts. In order to prepare a list of materials used in the cars, the parts were weighed and the types of material used were determined. Many small parts were made of one material and similar technologies. In this case, in the list of parts, their total weights were expressed in kilograms. The missing material data for some car components, such as plastic and rubber body fittings, were obtained from the IDIS vehicle manufacturer’s database.
2.3. Assumptions Used in Identification Research
In order to quantify the environmental impact of the vehicle in three selected impact categories, the model of the vehicle construction phase was identified on the basis of the collected research material, which covered 33 selected vehicles from different manufacturers belonging to segments B and C, which were produced in the years 1984–2013. This required the determination of the mass of materials constituting each vehicle immediately after leaving the manufacturer’s assembly plant. It was assumed that on the basis of changes in the material structure, the level of energy consumption and emissivity in the vehicle construction phase in subsequent production years, which were divided into five six-year periods, could be determined. The environmental load generated during the operation phase was defined as not being related to the material structure of the car, but rather, depended on its own weight and the design features of the engine and drive system. This meant that for vehicles belonging to the same class and of a similar design, the level of environmental impact during operation was considered comparable in the comparative analysis carried out. Based on changes in material inputs, an analysis of energy consumption and emissivity was carried out within the adopted environmental impact categories. The obtained characteristics, indicating changes in the magnitude of the generated environmental load, were determined for the entire vehicle and divided into individual groups and material groups.
Figure 2 shows changes in the mass of selected cars in relation to the production years along with the marked periods. The significant dispersion of weight in vehicles from different manufacturers in particular production periods was noteworthy. In order to confirm the correlation between vehicle weight and production years, on which the analysis of the car operation phase was based, in the entire range from 1984 to 2013, and in individual production periods, the Spearman’s rank statistical test was performed. For this purpose, the specialized software Statistica 10 PL was used. The results of correlation studies for the adopted significance level (p = 0.05) are presented in Table 1.
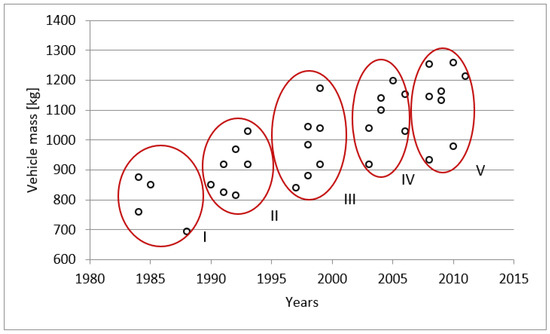
Figure 2.
Mass dispersion of passenger cars in relation to the year of production.

Table 1.
Spearman’s rank correlation results for vehicle weight and year of production.
Table 1 gives the size of the groups in the column “Valid n”. The “R Spearman” column shows the value of the Spearman’s R coefficient. Column “t(n−2)” gives the value of the t statistic to check the significance of this coefficient, and column “p” shows the significance level for the above t statistic. a statistically significant relationship was shown between the weight of all vehicles and the year of production. The correlation was positive with a value of R = 0.81, which means that the newer the year of production, the greater the vehicle weight. In contrast, no statistically significant correlations with the mass of vehicles in the examined period of production (p > 0.05) were found. Thus, the obtained results indicate the permissibility of dividing the production years into five six-year periods.
The average weight of a passenger car was determined for each period of production years (Table 2). In the analyzed period from 1984 to 2013, the average weight increased by approximately 340 kg. This corresponds to a weight increase of about 43%.
Table 2.
Average weight of passenger cars.
In order to check whether there was a difference in the average weight of motor vehicles in the analyzed periods of production years, the non-parametric Kruskal–Wallis test was used, assuming a statistical significance level of p = 0.05. The results of the statistical analysis are presented in Table 3.
Table 3.
Kruskal–Wallis test results.
The first column shows the period of production years for the motor vehicles. In the “Code” column, the data rank code for each period is shown. The column “Valid n” shows the number of passenger cars tested, and the columns “Sum of ranks” and “Average ranks” give the sums and average ranks for each period. The value determined in the Kruskal–Wallis test (for 4 degrees of freedom and 33 tested motor vehicles) was H = 18.71 at the level of statistical significance p = 0.0009. These values confirm the statistical significance of the influence of the adopted production periods on the average weight of passenger cars manufactured in these periods. At the same time, the results obtained from the statistical analysis indicate the permissibility of determining the mass shares of selected material groups and the corresponding energy inputs and environmental loads on the basis of the average values of the mass of a vehicle and its components for each production period.
In order to determine the model description of changes in material inputs, a regression analysis was used. A mathematical model is presented in the form of a regression function that approximates empirical data that describe changes in the mass of a vehicle and its components in particular periods of car production. The accuracy of the approximation was assessed in terms of the regression function in the linear (y = a·x + b), power (y = b·xa), exponential (y = b·ax), quadratic (y = a·x2 + b·x + c), hyperbolic (y = a· + b), and logarithmic (y = b + a·log10x) forms. Estimation of the regression function coefficients was performed using the least squares method (LSM). The module in the Statistica program was used. The adequacy of the functional dependencies obtained in this way was verified on the basis of the R correlation coefficient.
In terms of the model’s description of changes in vehicle mass in relation to the production years (Figure 3), its distribution indicates the possibility of approximation using a linear function in the form y = a·x + b. The determined coefficients values of this function and the relevant statistics are presented in Table 4.
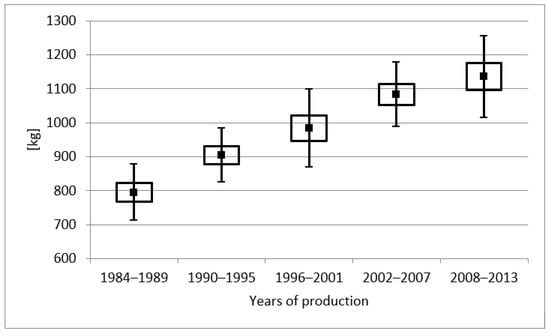
Figure 3.
The average weight of a passenger car (including standard error and standard deviation) in relation to the year of production.
Table 4.
Results of regression analysis of the linear function for the whole vehicle mass.
The values of parameters a and b along with estimation errors are shown in the “Rating” and “Standard error” columns. Column “t(df = 31)” shows the quotients of the evaluation and the error of parameter estimation for a given number of degrees of freedom (df). Column “p” shows the calculated test probability level for the significance of the parameters. In the columns “Lower confidence limit” and “Upper confidence limit”, 95% confidence intervals (lower and upper) of the estimated parameters a and b are given. Both parameters of the linear function model (a and b) were found to be statistically significant (the calculated value of the probability level p is lower than the adopted significance level of 0.05), and the linear trend function explains over 62.2% of the variability in the vehicle mass “R2”. Thus, the results of the verification of the adequacy of the regression function indicate a high level of accuracy regarding the description of vehicle mass changes using the selected approximation function.
Ultimately, the regression model describing the changes in the vehicle mass in subsequent production periods along with the estimation errors is as follows:
Every year, the weight of motor vehicles was found to increase by about 14.3 ± 2.0 kg on average.
3. Characteristics of Changes in Material and Energy Inputs and Environmental Loads in the Vehicle Operation Phase
3.1. Assumptions for the Annual Vehicle Operation
The following assumptions were made in the analysis of the annual operation of the vehicle:
- Annual mileage of motor vehicles: 15,000 km;
- The scope of activities involving the replacement of operating fluids and car parts and subassemblies subject to normal wear and tear was determined on the basis of periodic inspection schedules established by the manufacturers of the tested brands and models of motor vehicles.
Assumptions for additional activities related to the cyclical replacement of components subject to wear and not included in the periodic inspection schedule:
- Tire change: every four years (summer and winter);
- Brake pad replacement: every two years;
- Changing the windscreen washer fluid: twice a year (summer and winter);
- Replacement of wiper blades: twice a year.
It was assumed that the oil in the gearbox and the oil in the power steering system did not need to be changed. A summary of the average weight of elements subject to cyclical replacement (according to manufacturers’ recommendations) per year of operation is shown in Table 5.
Table 5.
Average material input for elements to be replaced per year.
In the annual operation of a passenger car, petrol has the largest mass share among the elements to be replaced. The remaining elements account for a small part of the total material input incurred during the annual use of a car, which is about 3% for all vehicles produced between 1984 and 2013.
The assessment of material inputs was supplemented with unplanned replacements of elements and assemblies of the vehicle of a random nature, which may occur at any time of the assumed vehicle operation period.
3.2. Energy Inputs
On the basis of the average consumption of consumables and elements subject to cyclical replacement (Table 5), the corresponding energy inputs were determined. Table 6 shows the average energy inputs in subsequent production periods for the entire vehicle and for gasoline over an annual operation period. A graphic illustration of these changes is shown in Figure 4.
Table 6.
Average energy input (EI) in MJ for various production periods.
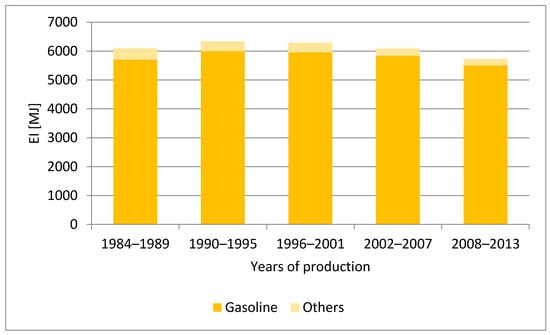
Figure 4.
Energy input for the entire passenger car.
The obtained average energy input values for entire motor vehicles in subsequent years of production were mainly determined by fuel consumption, which constitutes about 94% (1984–1989) to 96% (2008–2013) of the total expenditure incurred during annual vehicle operation. Although the percentage share of fuel input remained practically unchanged, clear changes were observed in subsequent periods of car production. Initially, at the turn of the first and second periods, an increase in these inputs of about 4% was observed. This was the result of the increasingly frequent use of injection systems and catalytic reactors and the related enrichment of the mixture to a stoichiometric composition, leading to an increase in fuel consumption. However, as engines that meet more and more stringent requirements, including those related to fuel consumption, are being designed, the related energy input in subsequent periods has reduced by about 8%.
3.3. CO2 Emissions
Table 7 presents the average CO2 emissions in subsequent production periods related to the entire vehicle and to petrol over an annual operation period. A graphical illustration of these changes is shown in Figure 5.
Table 7.
Average CO2 emissions in kg for different production years.
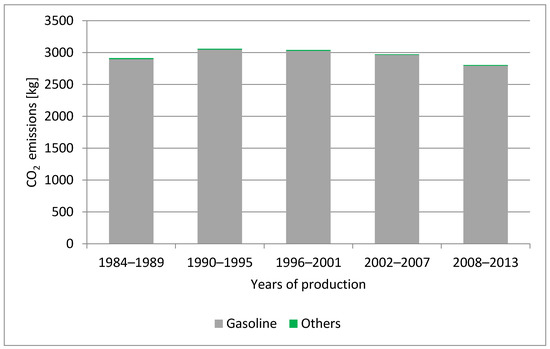
Figure 5.
CO2 emissions for the entire passenger car.
As in the case of energy inputs (Figure 5), fuel consumption, which accounts for over 99% of the total CO2 emissions in the annual period of car use, has a dominant influence on the average CO2 emissions in cars from subsequent production periods. The observed changes in the levels of these emissions reflect the previously discussed changes in fuel consumption. Thus, after an initial increase in CO2 emissions of about 5% in vehicles from subsequent production periods, the level of CO2 emissions reduced by around 8%.
3.4. SO2 Emissions
Table 8 presents the average SO2 emissions in subsequent production periods related to the entire vehicle and to gasoline over an annual operation period. A graphical illustration of these changes is shown in Figure 6.
Table 8.
Average SO2 emissions in kg for different production periods.
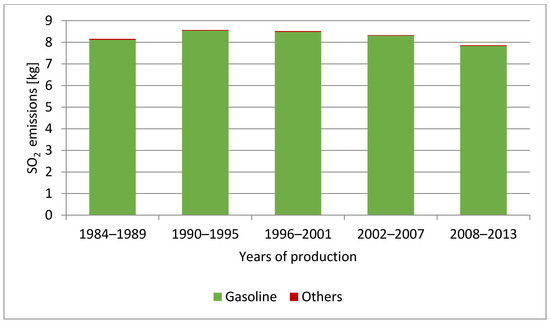
Figure 6.
SO2 emissions for the entire passenger car.
The average level of SO2 emissions in cars from subsequent production periods accounts for more than 99% of the fuel consumption. At the turn of the first and second periods, SO2 emissions increased by about 5%, and then systematically decreased, reaching a value about 9% lower than that in vehicles from the previous period.
3.5. Changes in Energy Input Related to Vehicle Failure
The assessment of energy consumption in the operation phase of vehicles from different production periods accounted for the additional consumption of materials and energy resulting from the need to supply parts due to their unplanned, emergency wear. Average failure rates of basic vehicle combinations with mileages of 0–50,000 km, 50,000–100,000 km, and 100,000–150,000 km from the 1996–2001 and 2002–2007 production periods were determined on the basis of published Dekra reports. The processes of producing new parts and product recycling were considered to be sources of supply for the parts needed for repair. The maximum energy input, based on the assumption that the entire unit or system is to be replaced, is summarized in Table 9 and Table 10.
Table 9.
Energy input in MJ related to the failure rate of units for new parts in a passenger car depending on its mileage and production period.
Table 10.
Energy input in MJ related to the failure rate of units for remanufactured parts in a passenger car depending on its mileage and production period.
The operation of older vehicles with mileage over 50,000 km, which is characterized by a higher failure rate, is associated with increased energy input per part (by about 6–8% on average), regardless of their source (Figure 7). At the same time, an increase in input by about 15% was observed for newer vehicles with a mileage of up to 50,000 km. In the case of vehicles manufactured in the years 1996–2001, energy input related to emergency repairs, for which brand new parts are used, may constitute about 23% to 116% of the expenditure incurred for the failure-free annual operation of such a vehicle. For newer vehicles manufactured from 2002 to 2007, the maximum energy input was found to be slightly lower, amounting to around 111%. The use of remanufactured parts makes it possible to reduce the maximum investment to about 98%, regardless of the age of the vehicle.
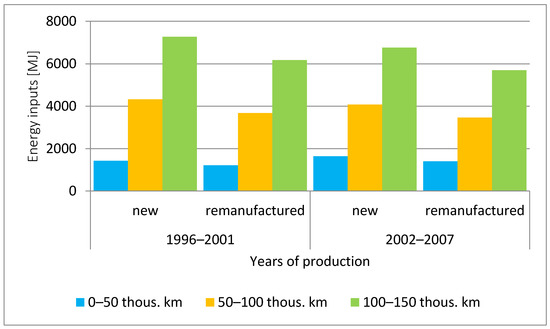
Figure 7.
Energy expenditure related to the failure rate of units for new and remanufactured parts in a passenger car depending on its mileage and production period.
4. Conclusions
On the basis of the conducted research and its analysis, it can be unequivocally stated that from the point of view of the impact of a car on the environment throughout its life cycle, the most important role is played by the operating phase. The results of the analysis of environmental load for the one-year operation period show that in the assessment of energy input and related emissions throughout the life cycle of a passenger car, the mileage of the car, determined by both the periodicity of replacement of elements and materials subject to normal wear and the duration of the assumed service life, is of crucial importance. It is also necessary to account for the additional loads related to the car’s failure rate, which are related to the mileage of the passenger car expressed in thousands of kilometers traveled during the year. Using an assumed average annual mileage of 15,000 km, the failure rate of the car was related to the average period of its operation, which was assumed to be equal to six years.
The average energy input for the entire life cycle of a motor vehicle in subsequent years of production obtained in the article was determined mainly by the input resulting from fuel consumption, which constituted about 94% of the total inputs incurred during the annual operation of the vehicle in 1984–1989 and about 96% in 2008–2013. Although the percentage share remained practically unchanged, clear changes were observed in subsequent periods of vehicle production. At the turn of the first and second periods, an increase in these inputs by about 4% was observed. This was the result of the increasingly frequent use of injection systems and catalytic reactors and the related enrichment of the mixture to a stoichiometric composition, which led to an increase in fuel consumption. However, as the design of engines has improved to meet more and more stringent requirements, including those related to fuel consumption, the related energy input decreased in subsequent periods by about 8%.
The environmental load situation is similar. As in the case of energy inputs, fuel consumption, which accounts for more than 99% of the total CO2 emissions during the annual lifespan of a car, has a dominant influence on the average CO2 emissions of cars from subsequent production periods. These changes reflect the changes in fuel consumption discussed earlier. Thus, after an initial increase in CO2 emissions by approximately 5% in vehicles from subsequent production periods, the level of emissions reduced by around 8%. In the case of SO2, at the turn of the first and second periods, emissions increased by about 5% and then systematically decreased, reaching a value that was about 9% lower in vehicles from the last period.
However, the current impact assessment which is based solely on fuel consumption emissions may not be sufficient. Due to the significant role of the operation phase, a modern approach also requires impacts related to scheduled periodic maintenance and removal of failures arising during use to be considered. The research results presented in the article show that the impacts of these factors systematically increase along with the mileage of the car. There may be further limitations regarding the rationalization of repair processes (use of remanufactured parts for repairs, repair of components rather than their replacement) and, possibly, in terms of improving the reliability of vehicles.
Author Contributions
Conceptualization, M.M. and A.M.-G.; methodology, M.M.; validation, A.M.-G.; writing—original draft preparation, M.M.; writing—review and editing, A.M.-G.; supervision, A.M.-G. All authors were involved equally in developing the full research manuscript for its final presentation. All authors have read and agreed to the published version of the manuscript.
Funding
This research received no external funding.
Institutional Review Board Statement
Not applicable.
Informed Consent Statement
Not applicable.
Data Availability Statement
Publicly available datasets were analyzed in this study. This data can be found here: Gemis database at http://iinas.org/, LCA Plastics Europe Report at https://www.plasticseurope.org/en/resources/eco-profiles, Greet database at https://greet.es.anl.gov/ and SimaPro database available after purchasing a license at https://simapro.com/.
Conflicts of Interest
The authors declare no conflict of interest.
References
- European Parliament. CO2 Emissions from Cars: Facts and Figures. Strasbourg. 2019. Available online: https://www.europarl.europa.eu/news/en/headlines/society/20190313STO31218/co2-emissions-from-cars-facts-and-figures-infographics (accessed on 12 December 2020).
- FIA. Global Reduction in CO2 Emissions from Cars: A Consumer’s Perspective—Policy Recommendations for Decision Makers. Paris. 2015. Available online: https://www.fia.com/sites/default/files/global_reduction_in_co2_emissions_from_cars-_a_consumers_perspective_0.pdf (accessed on 12 December 2020).
- CO2 Emissions from Cars: The Facts. A Report by Transport & Environment, European Federation for Transport and Environment AISBL. Brussels. 2018. Available online: https://www.transportenvironment.org/publications/co2-emissions-cars-facts (accessed on 16 December 2020).
- Environmental Management. Life Cycle Assessment; Principles and Framework: Geneva, Switzerland, 2006; ISO 14040. [Google Scholar]
- Environmental Management. Life Cycle Assessment; Requirements and Guidelines: Geneva, Switzerland, 2006; ISO 14044. [Google Scholar]
- Braess, H.-H.; Finkenauer, W.; Hamm, L.; Rotberg, B.V.; Weber, R.; Willeke, R.; Bellmann, K. Lebensdauer, recycling, ressourcenschonung, entwicklungstrends—Grundlagen und probleme bei der konzipierung gesamtwirtschaftlich optimaler personenkraftwagen, entwicklungslinien in der kraftfahrzeugtechnik. In Proceedings of the 4. Statusseminar Kraftfahrzeug- und Straßenverkehrstechnik, Bundesministeriums für Forschung und Technologie, Verlag TÜV Rheinland, Cologne, Germany, 12 November 1976. [Google Scholar]
- Mayyas, A.; Qattawi, A.; Omara, M.; Shan, D. Design for sustainability in automotive industry: A comprehensive review. Renew. Sustain. Energy Rev. 2012, 16, 1845–1862. [Google Scholar] [CrossRef]
- Suzuki, T.; Odai, T.; Hukui, R.; Takahashi, J. LCA of passenger vehicles lightened by recyclable carbon fiber reinforced plastics. In Proceedings of the International Conference on Life Cycle Assessment, San Jose, Costa Rica, 25–28 April 2008. [Google Scholar]
- Ballester, F. Air pollution and health: An overview with some case studies. In Environmental Health Impacts of Transport and Mobility; Nicolopoulou-Stamati, P., Hens, L., Howard, C.V., Eds.; Springer: Berlin/Heidelberg, Germany, 2005; Volume 21, pp. 53–77. [Google Scholar]
- Roussou, T.; Behrakis, P. The respiratory effects of air pollution. In Environmental Health Impacts of Transport and Mobility; Nicolopoulou-Stamati, P., Hens, L., Howard, C.V., Eds.; Springer: Berlin/Heidelberg, Germany, 2005; Volume 21, pp. 79–94. [Google Scholar]
- Hensher, D.A.; Button, K.J. Handbook of Transport and the Environment; Publisher Elsevier Science: Amsterdam, The Netherlands, 2003. [Google Scholar]
- Raugei, M.; Morrey, D.; Hutchinson, A.; Winfield, P. A coherent life cycle assessment of a range of lightweighting strategies for compact vehicles. J. Clean. Prod. 2015, 108, 1168–1176. [Google Scholar] [CrossRef]
- Regulation No 100 of the Economic Commission for Europe of the United Nations (UNECE). Uniform Provisions Concerning the Approval of Vehicles with Regard to Specific Requirements for the Electric Power Train; Publications Office in European Union: Luxembourg, 2015. [Google Scholar]
- World Business Council for Sustainable Development (WBCSD). Mobility 2030: Meeting the Challenges to Sustainability. World Business Council for Sustainable Development; Conches: Geneva, Switzerland, 2004. [Google Scholar]
- Messagie, M.; Boureima, F.S.; Coosemans, T.; Macharis, C.; Mierlo, J. Van A range-based vehicle life cycle assessment incorporating variability in the environmental assessment of different vehicle technologies and fuels. Energies 2014, 7, 1467–1482. [Google Scholar] [CrossRef]
- Zackrisson, M.; Avellan, L.; Orlenius, J. Life cycle assessment of lithium-ion batteries for plug-in hybrid electric vehicles—Critical issues. J. Clean. Prod. 2010, 18, 1519–1529. [Google Scholar] [CrossRef]
- Gao, L.; Winfield, Z.C. Life cycle assessment of environmental and economic impacts of advanced vehicles. Energies 2012, 5, 605–620. [Google Scholar] [CrossRef]
- Xiong, S.; Ji, J.; Ma, X. Comparative life cycle energy and ghg emission analysis for BEVs and PhEVs: A case study in China. Energies 2019, 12, 834. [Google Scholar] [CrossRef]
- Elgowainy, A.; Burnham, A.; Wang, M.; Molburg, J.; Rousseau, A. Well-to-Wheels Energy Use and Greenhouse Gas Emissions of Plug-in Hybrid Electric Vehicles; SAE Technical Paper; Argonne National Laboratories: Lemont, IL, USA, 2009.
- Hekkert, M.P.; Hendriks, F.H.J.F.; Faaij, A.P.C.; Neelis, M.L. Natural Gas as an alternative to crude oil in automotive fuel chains: Well-To-Wheel analysis and transition strategy development. Energy Policy 2005, 33, 579–594. [Google Scholar] [CrossRef]
- Donateo, T.; Ingrosso, F.; Bruno, D.; Laforgia, D. Effect of driving conditions and auxiliaries on mileage and CO2 emissions of a gasoline and an electric city car. SAE Tech. Paper 2014. [Google Scholar] [CrossRef]
- Tagliaferri, C.; Evangelisti, S.; Acconcia, F.; Domenech, P.; Ekins, P.; Barletta, D.; Lettieri, P. Life cycle assessment of future electric and hybrid vehicles: A cradle-to-grave systems engineering approach. Chem. Eng. Res. Des. 2016, 112, 298–309. [Google Scholar] [CrossRef]
- Van den Bossche, P.; Vergels, F.; VanMierlo, J.; Matheys, J.; Van Autenboer, W. SUBAT: An assessment of sustainable battery technology. J. Power Sources 2006, 162, 913–919. [Google Scholar] [CrossRef]
- Messagie, M.; Boureima, F.S.; Matheys, J. Environmental performance of a battery electric vehicle: A descriptive life cycle assessment approach. World Electr. Veh. J. 2011, 4, 782–786. [Google Scholar] [CrossRef]
- Ellingsen, L.A.-W.; Majeau-Bettez, G.; Singh, B. Life cycle assessment of a lithium-ion battery vehicle pack. J. Ind. Ecol. 2014, 18, 113–124. [Google Scholar] [CrossRef]
- Faria, R.; Marques, P.; Moura, P.; Freire, F.; Delgado, J.; de Almeida, A.T. Impact of the electricity mix and use profile in the life-cycle assessment of electric vehicles. Renew. Sustain. Energy Rev. 2013, 24, 271–287. [Google Scholar] [CrossRef]
- Bartolozzi, I.; Rizzi, F.; Frey, M. Comparison between hydrogen and electric vehicles by life cycle assessment: A case study in Tuscany. Appl. Energy 2013, 101, 103–111. [Google Scholar] [CrossRef]
- 28. Donateo, T.; Ingrosso, F.; Lacandia, F.; Pagliara, E. Impact of hybrid and electric mobility in a medium sized historic city. SAE Tech. Paper 2013. [Google Scholar] [CrossRef]
- Casals, L.C.; Martinez-Laserna, E.; García, B.A.; Nieto, N. Sustainability analysis of the electric vehicle use in Europe for CO2 emissions reduction. J. Clean. Prod. 2016, 127, 425–437. [Google Scholar] [CrossRef]
- Bauer, C.; Hofer, J.; Althaus, H.-J.; Del Duce, A.; Simons, A. The environmental performance of current and future passenger vehicles: Life cycle assessment based on a novel scenario analysis framework. Appl. Energy 2015, 157, 871–883. [Google Scholar] [CrossRef]
- Hawkins, T.R.; Gausen, O.M.; Stromman, A.H. Environmental impacts of hybrid and electric vehicles—a review. Int. J. Life Cycle Assess. 2012, 17, 997–1014. [Google Scholar] [CrossRef]
- Lombardi, L.; Tribioli, L.; Cozzolino, R.; Bell, G. Comparative environmental assessment of conventional, electric, hybrid, and fuel cell powertrain based on LCA. Int. J. Life Cycle Assess. 2017, 22, 1989–2006. [Google Scholar] [CrossRef]
- Harris, A.; Soban, D.; Smyth, B.M.; Best, R. Assessing life cycle impacts and the risk and uncertainty of alternative bus technologies. Renew. Sustain. Energy Rev. 2018, 97, 569–579. [Google Scholar] [CrossRef]
- Eberle, R. Dissertation zum Thema “Methodik zur ganzheitlichen Bilanzierung im Automobilbau”; Technische Universität Berlin, Fakultät 10: Berlin, Germany, 2000. [Google Scholar]


Publisher’s Note: MDPI stays neutral with regard to jurisdictional claims in published maps and institutional affiliations. |
© 2020 by the authors. Licensee MDPI, Basel, Switzerland. This article is an open access article distributed under the terms and conditions of the Creative Commons Attribution (CC BY) license (http://creativecommons.org/licenses/by/4.0/).