Article

Towards a More Realistic Cost–Benefit Analysis—Attempting to Integrate Transaction Costs and Energy Efficiency Services

1
Energy, Transport and Climate Policy Division, Wuppertal Institute, Doeppersberg 19, 42103 Wuppertal, Germany
2
DLR Institute of Networked Energy Systems, Carl-von-Ossietzky-Str. 15, 26129 Oldenburg, Germany
3
Oeko-Institut e.V., Merzhauser Straße 173, 79100 Freiburg, Germany
*
Author to whom correspondence should be addressed.
Energies 2021, 14(1), 152; https://doi.org/10.3390/en14010152
Submission received: 16 November 2020 / Revised: 16 December 2020 / Accepted: 18 December 2020 / Published: 30 December 2020

Abstract

:
In order to calculate the financial return of energy efficiency measures, a cost–benefit analysis (CBA) is a proven tool for investors. Generally, however, most CBAs for investors have a narrow focus, which is—simply speaking—on investment costs compared with energy cost savings over the life span of the investment. This only provides part of the full picture. Ideally, a comprehensive or extended CBA would take additional benefits as well as additional costs into account. The objective of this paper is to reflect upon integrating into a CBA two important cost components: transaction costs and energy efficiency services—and how they interact. Even though this concept has not been carried out to the knowledge of the authors, we even go a step further to try to apply this idea. In so doing, we carried out a meta-analysis on relevant literature and existing data and interviewed a limited number of energy experts with comprehensive experience in carrying out energy services. Even though data is hardly available, we succeeded in constructing three real-world cases and applied an extended CBA making use of information gathered on transaction costs and energy services costs. We were able to show that, despite these additional cost components, the energy efficiency measures are economically viable. Quantitative data was not available on how energy services reduce transaction costs; more information on this aspect could render our results even more positive. Even though empirical and conceptual research must intensify efforts to design an even more comprehensive CBA, these first-of-its-kind findings can counterargue those that believe energy efficiency is not worth it (in monetary terms) due to transaction costs or energy services costs. In fact, this is good news for energy efficiency and for those that seek to make use of our findings to argue in favor of taking up energy efficiency investments in businesses.

1. Introduction

Cost–benefit analysis (CBA) is a frequently used method to evaluate the viability and financial return of investments [1,2]. Although such calculations often show that energy efficiency measures pay off after a few years [3], measures are often not implemented due to existing barriers. These include transaction costs (TAC) such as the time needed to acquire the necessary knowledge, to apply for funding, to monitor the energy costs, and to order and install the products. These TAC, in turn, can be reduced by energy efficiency services (EES), aiming for concrete implementation of energy efficiency measures. The integration of TAC and EES into a CBA would provide a more realistic analysis of an energy efficiency investment. It would give investors a more comprehensive understanding of costs arising. For instance, if an enhanced CBA including both TAC and EES still results in a positive investment case, the investor will be more inclined to carry out the undertaking envisioned.
To the knowledge of the authors, research has not yet tried to (re)design CBAs factoring in TAC and EES. Hence, our study seeks to address this knowledge gap. In this paper, which is based on a proceeding paper presented at the 15 Conference on Sustainable Development of Energy Water and Environment Systems (SDEWES) in 2020 (cf. [4]), we propose an approach for a more realistic CBA for the business sector that integrates both transaction costs and costs for energy efficiency services. The research presented in this paper is developed based on [5] as well as an already published paper [6], which both give insights into the project’s overall findings factoring in all sectors. In contrast, this paper focuses on an integrated approach for a CBA explicitly targeted at businesses.
On the way towards a more realistic CBA integrating TAC and EES and, thus, towards achieving this study’s research objective, quantitative data is needed. Our study team identified relevant data and used it for a more realistic analysis. It needs to be acknowledged that integrating other factors would create an even more realistic picture of a cost–benefit analysis. For instance, more and more researchers focus on multiple benefits of energy efficiency (such as improved air quality) and seek to quantify these benefits [7]. However, for the sake of simplicity, we focus on the core assumptions in this paper.
While we show that transaction costs do exist, we explain (and illustrate) that they are not a (rational) argument for not implementing energy efficiency measures. In so doing, we believe in contributing to persuading potential adopters/investors to invest in energy efficiency measures helping to overcome both the moderate interest in energy efficiency measures and the energy efficiency gap in general [8,9,10,11], the latter of which has been scrutinized in the literature for the businesses sector [12,13,14,15,16]. The prioritization of energy efficiency is decisive for achieving net-zero greenhouse gas emissions by 2050, as agreed in the Paris Agreement [17] and proposed by the EU Commission’s Green Deal [18]. For example, Germany needs to reduce primary energy consumption to 50% by 2050 compared to the year 2008 [19], with all sectors in need of increasing energy efficiency. Providing a more realistic picture regarding costs and benefits can help to achieve these various objectives.
In the following, Section 2 first focuses on the major components relevant to this study: the state-of-the art approach for a CBA as well as TAC and EES, both of which are mostly regarded in isolated terms. Afterwards, this section introduces this study’s methodological approach. In Section 3, the results are presented from our meta-analysis and interviews; in particular, we investigate upon (a) TAC for implementing energy efficiency measures in the business sector, (b) costs of applicable energy efficiency services including government funding, and (c) EES’s potential to reduce TAC. Data is gathered by conducting a meta-analysis, which is complemented by expert interviews with a limited number of energy advisors. More research is needed, e.g., to also quantify “multiple” investor benefits [20] from energy efficiency investments, as the data base is limited and methods are not sufficiently developed or are highly subjective (see, e.g., [21,22]).

2. Materials and Methods

2.1. Review of Literature

An analysis of costs and benefits from the investment in energy efficiency can be done at various levels. At a more macro level, program-centered analyses are conducted in order to, e.g., identify national, regional, or local government expenses (costs) as well as environmental and socioeconomic benefits including emission reduction or job creation [23,24,25]. At a rather micro level, a cost–benefit analysis (CBA) takes on an investor’s perspective factoring in the additional investments (costs) associated with purchasing energy efficiency technologies compared to non-efficient technologies and reduced life-cycle costs (especially energy costs) (benefits) [5,26]. The perspectives of other beneficiaries may also be included (cf. [27] for a CBA embracing energy consumers and investors in the case of a virtual power plant).
A simple CBA estimates the effects of an investment decision in advance or evaluates the investment made retrospectively. An energy efficiency measure is cost-effective when the benefits exceed the costs. A CBA is particularly useful if there are uncertainties in the investment decision and if these can be made transparent in calculations. It should be as objective as possible with transparent and comprehensible figures and assumptions. In the case of energy efficiency measures, CBAs are often used to assess the time when the measure will pay off or to calculate net present values [28].
Although cost–benefit calculations with a focus on energy efficiency often show that the measures pay off after a few years, they are often not implemented. This means that investment decisions in energy efficiency are often not only based on simple cost/benefit considerations (direct investments/saved energy costs) (see, e.g., [8,29,30]). The reasons for this are existing barriers, which can be summarized under the term “energy efficiency gap”. Reasons for this gap are, inter alia, a lack of interest and motivation for energy efficiency improvements, other priorities, knowledge and information barriers, or a lack of funding [31].
In general, a distinction between two types of barriers can be made. While, for instance, a lack of capital will prevent investments entirely, TACs that are attached to other barriers can be considered a softer barrier type. These TACs include all costs that are not linked to direct investment and maintenance costs but are necessary for the preparation and implementation of an energy efficiency measure. These TACs differ slightly depending on the group of actors considered. In this paper, the focus is on businesses. Here, TACs include both activities and operations carried out by employees of the companies and the costs arising from external contracts (like contracting craft businesses). A set of relevant TAC subtypes including illustrative examples from the field of energy efficiency can be found in the following list [32,33]:
  • Search costs and information processing (including search costs for providers of energy services): identifying credible information on technologies (e.g., on performance or investment costs), funding schemes, and crafts businesses for installation
  • Decision-making costs: (i) deciding whether an investment will be adopted/rejected and (ii) comparing different technology options, i.e., consultation between different decision-making units (e.g., management vs. operating director) on the perceived relative advantage
  • Capital costs or costs for having the investment financed: interests for debt-financed investments
  • Negotiating costs or costs for negotiating contractual issues: legal disputes due to increasing rents as a result of energy efficiency investments
  • Permitting and certification costs, or costs for having measures permitted or certified by an agency/body: filling in a funding application or an application for having a heritage-protected building refurbished
  • Costs for collecting energy-related data for verifying the effectiveness of the measure: monitoring meters and processing data
  • Realization costs, or costs for monitoring and enforcement to have energy efficiency investments correctly installed: supervision and time taken to receive goods
  • Adaptation costs or costs for making proper use of energy efficiency investments: capacity building/trainings and employment of new staff
  • Opportunity costs or costs for lost alternative investments: capital or staff used for energy efficiency investment “lost” for alternative decisions such as production increases
Even though the characteristics and relevance of transaction costs are regularly discussed in literature (e.g., [32,33,34]), there are hardly any references to quantify the costs. Furthermore, the methods for calculating TAC differ significantly from study to study or are not made transparent. The results of the limited number of studies that calculate TAC (especially [32,35,36]) are used in Section 3.1 to estimate the level of TAC for the case studies. It has to be noticed that the data from these sources are relatively old [37,38] or have a limited geographical focus [39].
As this paper is particularly interested in understanding how TAC interacts with EES in a CBA, its focus is on barriers associated with TAC. To complicate the matter, EES represents another cost driver for the uptake of energy efficiency investments. Energy efficiency services are defined by the European standard DIN EN 15900:2010 as activities aimed at improving energy efficiency and other agreed performance criteria. According to this definition, EESs are comprised of an analysis (i.e., an audit to identify and select measures) as well as downstream implementation and verification of energy savings. EESs are also supposed to provide a description of proposed or agreed-upon measures and how they achieve envisaged energy savings [40]. This represents a comprehensive but relatively narrow description of EES. This paper also understands individual/partial services, such as the identification and selection of measures, as EES—provided these services aim for concrete implementation of energy efficiency measures, which is the core element of an energy efficiency service.
As with most services, customers pay a certain fee and expect to benefit from this investment in any case. Our paper assumes that EESs (including its costs) are used to drive down TAC. For instance, by contracting an energy advisor, a business can reduce search costs for identifying relevant information on process technologies. An overview of advisory foci in terms of energy efficiency technologies for businesses is given in [41]. In the residential sector, an illustrative example can be found in [42]: a mechanical ventilation with heat recovery (MVHR) is considered to be complex, and building owners often lack knowledge about their existence, how they function, or how they can be integrated in a specific building context; thus, an energy advisor is supposed to provide guidance, so that potential adopters do not have to acquire such knowledge from scratch. In Germany, several types of EES are financially supported by the federal government. One set of services is provided by Germany’s consumer organisation Verbraucherzentrale (VZ), a network of consumer service points for various issues. The VZ offices provide detailed but low-cost overall building checks (mini-audits) or heating checks only [43]. Beyond the VZ network applicable to households, federal funds are channeled to EES through programs such as “on-site visits for installations and processes” targeting businesses. Government funding reduces the costs of EES and, thus, the overall cost associated with EE investments.
Contracting is a special type of energy service. A service provider installs energy efficiency measures in a building or installation and is repaid through energy savings over a fixed period. Contracting can be a suitable instrument, e.g., for municipalities in a difficult budgetary situation to implement costly energy efficiency measures. However, contracting is not considered in detail in the context of the present analysis because it is not compatible with the approach of this study that takes the perspective of investors and analyzes costs and benefits resulting from the technical measures. In the contracting model, investment costs are taken over by a service provider who refinances them through energy savings (usually with the participation of the initiator/facility owner).

2.2. Objectives and Methodological Approach

The following Figure 1 presents a schematic overview of how TAC and EES are related to each other and how an EES can be a TAC-reducing element. Importantly, the bars are only for illustrative purposes. The bars in the first section (1) of Figure 1 show a simple cost–benefit analysis regularly conducted by practitioners or scholars. It calculates the additional costs of the energy efficiency measure (upper bar) in relation to the energy costs saved (lower bar), suggesting that savings outweigh costs. The second section (2) extends this method by integrating TAC, illustrating that costs for a transaction increase the overall costs by an unspecific amount (upper bar). In the next section (3), EES are added to the cost–benefit analysis, which also increases the overall costs (upper bar). However, the potential of EES to drive down TAC is depicted by the smaller TAC block (dark grey) in contrast to (2). Section (4) illustrates that government funding lowers the investor’s costs for EES.
These theoretical assumptions raise the following central research question: how can a cost–benefit analysis be enhanced by also covering transaction costs and costs for energy efficiency services? This results in a set of supplementary questions: What are the costs of different types of transaction? What is the effect of energy efficiency services cost (including government funding)? By how much does EES reduce TAC?
To address these questions, a limited number of specific cases of energy efficiency investments were selected from the business sector and information was gathered from the literature. Specific real-world examples were used to illustrate as concretely as possible the quantification of transaction costs and the influence of energy services. That is why the results of this paper do not claim to show calculations that can be generalized. For selection of the case studies, a simple multicriteria scheme was used including the following criteria: the investment’s relevance or energy saving potential, data availability, and applicability to be addressed by an EES (for more details, see [6]). The following Table 1 shows the energy efficiency measures (M1–M3) from the businesses sector scrutinized in the project.
In order to answer the central research question on how a cost–benefit analysis can be enhanced by also covering transaction costs and costs for energy efficiency services, this paper first addresses the supplementary questions. First, a meta-analysis was conducted (i) on the costs of different types of transaction, (ii) on costs for energy efficiency services (including government funding), and (iii) on how much EES reduces TAC. Second, findings were complemented through expert interviews with energy advisors.
With regard to the meta-analysis, several databases were checked to find real-world data for the analysis. For the purpose of our work, it was crucial to obtain data on investment costs, energy savings, and payback times. A major source was the EU-MERCI database, which lists and analyses numerous measures from different sectors. This data was used as the basis for the calculation how EES can reduce TAC of these specific measures. For further analysis, existing literature was used [34,35,36] and verified by three energy expert interviews in 2018. In this context, a semi-structured interview guide was developed. The interviewees have years of experience as energy consultants and/or with the topic of energy efficiency in companies. The interviews were conducted via telephone for around 30 min. In particular, the energy experts were asked to provide guidance regarding the costs applicable for energy efficiency services targeting the abovementioned cases (M1 to M3). Through their answers, the data identified through literature, which lacked information on concrete investment, were complemented.
During the research activities, an excel-based calculation tool was developed to collect and assess the data. The information could be adjusted to make the effects of individual factors directly visible. The tool also made it possible to compare the different case studies and data (cf. Figure 2).

3. Results

3.1. Quantification of Transaction Costs

This section summarizes the results derived from the literature on the quantification of transaction costs for energy efficiency investments in companies and derives the transaction costs for the energy efficiency measures displayed in Table 1. Even though the topic of transaction costs is often touched upon the literature [32,37], empirical investigations have hardly been done and only a few references are available that deal with the quantification of TAC. The authors of [45] compiled the findings for quantifying transaction costs for some specific technologies in the buildings sector. With regard to lighting, TACs were estimated to be 10% and, for improved cavity wall insulation, TAC was estimated at 30%. However, the authors conclude that the quantification of transaction costs is always associated with uncertainties due to technological issues, accountability, reliability, and different calculation methods. For the business sector, the authors of [37] quantified transaction costs for energy efficiency measures carried out in the Netherlands. They investigated energy intensive companies, in particular, and measured TACs in relation to the overall investment to be made. They found information collection costs of about 2 to 6% of the investment. This covers, e.g., the writing of an energy report that includes information for potentially interesting energy efficiency measures. It also accounts for the implications on production (safety and failure), product quality, as well as maintenance issues. The empirical findings of the cases investigated show that information costs “as a fraction of the investments tend to decrease as the size of the investment increases” [37], indicating scale effects. A second component of TAC which was scrutinized is decision-making. Decision-making costs may rise when increasing overall investment costs for energy efficiency measures. In this respect, the authors noted that low-cost measures can be approved by the energy department itself (without any engagement with other organizational units) so that the time spent to reach a decision is redundant. High-cost investments, however, need authorization from higher management levels with higher salaries, which increases expenses. Implementation costs were not estimated by representatives from Dutch energy-intensive industries. With regard to the costs for monitoring energy savings, which are considered to be below 1% of investment costs, the authors of [37] differentiated between those enterprises that do not take specific monitoring actions and those that install an energy management system, which allows for simple and low-cost monitoring of savings.
Based on empirical data from the energy-intensive industry, the authors of [38] quantified the transaction costs for procuring energy-efficient electric motors. She concluded, among other things, that the share of TAC in purchasing costs is relatively high for smaller motor types in contrast to larger (and more costly) motors. For instance, the costs of transaction for a 1-kW motor with a purchasing price of 200 € is considered to be at around 300 €; a 10 kW motor purchased for 800 € has the same TAC. The TAC for a 100-kW motor available for 5100 € amounts to 600 €. To calculate the TAC on the exchange of an inefficient motor by a 30-kW motor (M1), we estimate the TAC by a linear interpolation between TACs for a 10 kW and 100 kW motor (A linear increase of transaction costs after the threshold of 10 kW output is postulated.) [36]. This yields a TAC of 366.67 € for our case study (M1).
In 2014, the authors of [39] conducted an in-depth study to measure TAC in 35 German companies with 25 to 3000 employees and an annual energy consumption of 1.3 to 1000 GWh. The addressed energy efficiency measures taken up by those companies cover different technologies (e.g., insulation/heat insulation and heat recovery). Respective investments ranged from 1715 € to 800,000 €. A correlation between the share of TAC and the overall investment was revealed by the regression analysis conducted. Hence, for the other two cases in our study on the energy consumption reduction through compressed air (M2) and the utilization of cooling technology (M3), we apply TACs of 15.000 € and 25.000 €, respectively, based on [46]. The relatively high share of transaction costs with a lower investment sum as in the case of compressed air technology is in line with the results from [39] and can be explained by the fact that absolute transaction costs are independent (or only marginally dependent) on the investment sum. It needs to be acknowledged that companies that participated in [39] were part of an energy efficiency network, which can be assumed to be more open towards energy efficiency investments. Hence, the share of identified TAC might even be underestimated for less progressive companies.

3.2. Costs of Energy Efficiency Services and Government Support Schemes

Government-funded EESs for industries and processes as well as respective costs are reported by [46] with a median price of 4000 € (average 5800 €). However, EESs might be less technical as well as highly complex consultations and anything between. Furthermore, subsidies vary with regard to companies’ annual energy expenditures above or below 10,000 € annually. This might translate to the distribution of cost data, indicated by a high interquartile range of 6500 € (1500 € to 8000 €). Given the assumption of a company with a single location and energy costs of more than 10,000 € per year, the interviewed energy experts classified an appropriate consultancy in the price range of 5000 to 8000 €, thereby locating the price in the upper quartile and around the average of 5800 € from the survey data from [46].
Data is not attributed to single energy efficiency measures, which is key for attaching values to our case studies. We propose to allocate the costs according to the number of measures usually recommended by an energy consultant (3–5), which is also suggested by [41] as well as by an energy expert interviewed.
Taking into account the costs of 5000 € to 8000 € for 3 to 5 measures recommended, market costs of 1000 to 2666.67 € arise per measure. In the following sections, we make use of the upper bound of 2666.67 € for EES costs attached per isolated/single measure as a conservative assumption to account for the least favorable conditions.
In Germany, the support program “Energy Consulting in Medium-Sized Businesses” can be applied for the energy efficiency measures of our case studies (M1–M3). For a company with high annual energy costs (over 10,000 €), this subsidy amounts to 80% of the consulting costs up to a maximum of 6000 €. This reduces costs enormously down to 1000–2000 €. Thus, for individual measures, this again breaks down the net investor costs for EES (with subsidies from the German Government included) between 200 € and 667 €. For our study, we consistently make use of the upper value in all cases (M1–M3).

3.3. Reduction of TAC through EES

The business model of EES is that some of the tasks generating TACs for the investor are taken over by an external service provider in return for a service fee. As this is done by professionals who realize scale and learning effects, they can do this more efficiently than non-expert investors. Neither our literature meta-analysis nor interviews with energy consultants yielded reliable quantifications of the potential of EES to reduce transaction costs. This is a field where more research is needed.
Returning to the list of different types of TAC, it can be argued that EES can contribute to reducing TAC. However, this also strongly depends on the scope of the EES. Generally, an energy consultant can help in identifying technologies or in funding schemes. Having a contracted neutral expert may also help in reducing decision-making costs as some organizational units might be persuaded quicker with an objective third-party analysis. However, EESs such as advisory services also have limits, for instance, when it comes to capital costs or legal disputes. Apart from that, identifying applicable EES may also create TACs such as consultancy searching, contracting, and execution.

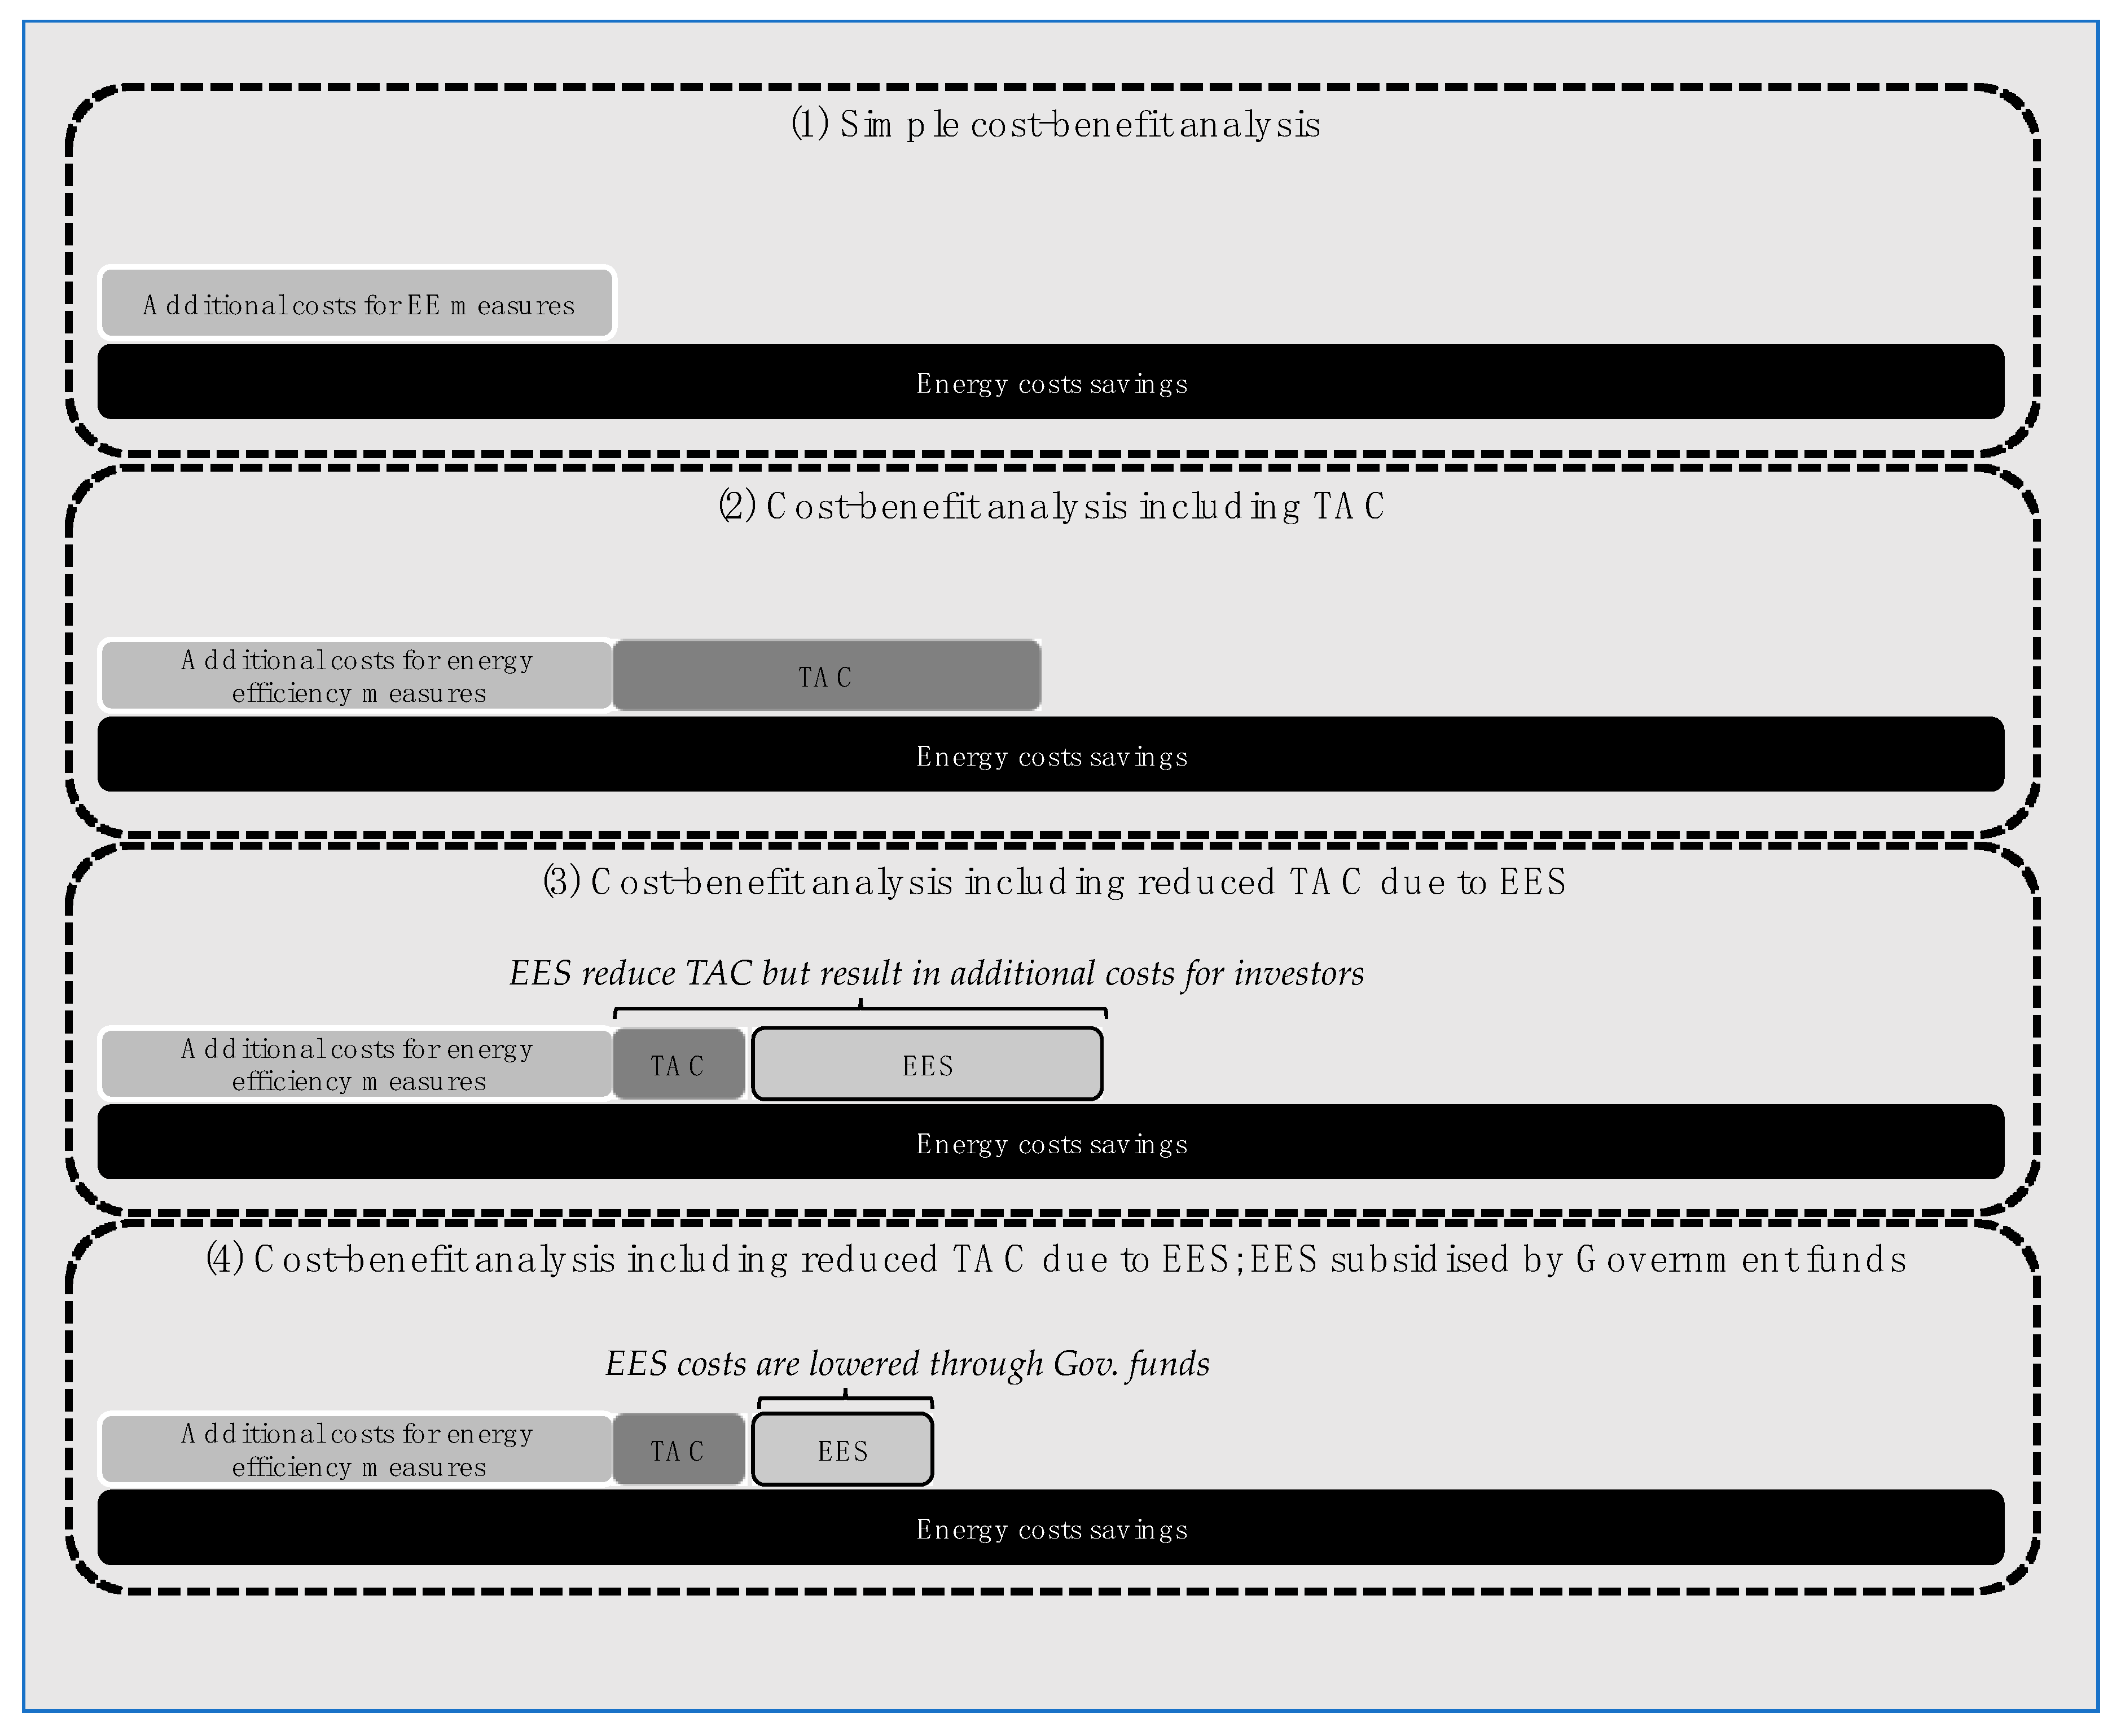
3.4. Integration of Results

Table 2 shows an overview of the information gathered and presented in the previous sections identified for the three cases (M1–M3). The energy efficiency interventions differ in investment costs affecting the amount of TAC attached. The cost aspects related to EES were calculated based on a standardized approach, so that EES costs, government funding for EESs, as well as investor costs for EESs are the same for M1 to M3. Operational cost savings were only identified for M3, while energy cost savings differed substantially to some extent. While in absolute terms they are relatively low for M1 and relatively high for M3, if compared to the investment costs, energy savings of M1 are 8 times higher compared to its investment costs, which is different for M2 and M3. Unfortunately, the question of how EES reduces TAC was difficult to answer.
The information shown in the previous table feeds the excel-based calculation tool developed as part of the overall project, which this paper is based on. In fact, the extended cost–benefit analysis was implemented using this calculation tool. A more realistic CBA for the three measures is shown below (Figure 2).
For all measures considered, the benefits (present value) are significantly higher than the costs (present value) of implementing the measure. Thus, the capital value (net present value) is also positive. The benefit–cost ratio is therefore >1 for M1 to M3, and the investment is cost-effective for all energy efficiency measures. This applies even if the classic cost–benefit analysis is extended to include additional cost categories such as transaction costs for implementing the measure and costs for the corresponding EES. It is noticeable that, for M2 (compressed air) and M3 (cooling), the cost–benefit ratio is positive but somewhat lower than for measures M1 (motors). M1, in turn, shows that consulting costs are higher than transaction costs, rendering the former questionable. For high-investment measures (M2, compressed air; M3, cooling) the consultancy costs are low or negligible compared to the investment costs and compared to TAC. Nevertheless, even for low-investment measures, it can be assumed that EES will contribute to implementation by reducing transaction costs even if they are relatively cost-intensive in relation to investment costs.

4. Discussion

Based on the information available, CBA for the considered measures is positive from the investor’s point of view. These results go beyond evidence that these measures can be carried out even if TAC and costs for EES may increase overall costs. Hence, these results illustrate that TAC cannot be seen as the only (economic) argument for not implementing energy efficiency measures, since, in fact, the benefits are still worth their realization.
It should be acknowledged that our research focused on extending the information on costs, while there is also an increasing body of research concentrating on multiple benefits [21]. If additional benefits associated with energy efficiency are taken into account (multiple), it can be assumed that the CBA may become more positive, even for investors.
In order to realize a CBA for the constructed case, we applied data mostly identified by means of a meta-analysis. Even though it was easy to find data on implemented energy efficiency measures in businesses (investment costs and energy savings), the TAC could only be estimated on the basis of a limited number of the available literature. In particular, [37,38,39,40] were key sources delivering data input for our excel-based tool. However, their empirical foundation is either relatively old [37,38] or geographically constrained [39]. Apart from that, interviewed companies of [39] have been part of an energy efficiency network. Such companies may be more progressive regarding energy efficiency investments and may have reduced transaction costs due to exchanging information within the network. Moreover, our study attempted to make use of a broad definition of TAC, but the available literature defines this more narrowly [37,38]. Hence, the CBA presented provides only a part of the full (TAC) picture. Despite the limitations mentioned, our analysis provides an essential first step for further research steps. With the development of our excel-based tool and the assessment of the results, the basis for an in-depth analysis is made.
Consequently, updating and expanding today’s knowledge about transaction costs in businesses will provide further new insights into transaction costs analysis regarding energy efficiency investments. It can also be assumed that TACs are attached to identifying a suitable EES, lowering the true value of EES vis-à-vis TAC reduction. This issue could be taken up by further research. Such research should distinguish between transaction costs in the different phases of the investment decision, so that targeted measures and interventions to reduce transaction costs may be developed.
Costs for EES were identified via [46] as well as through expert interviews. We found that it is difficult to allocate an EES to a single measure just because energy experts often recommend three to five energy efficiency measures. Hence, for our purposes, overall costs of EES had to be divided by the number of recommendations to feed our excel-based tool. Unfortunately, we did not find relevant existing data based on literature on how EES reduces TAC in businesses. This is an important research gap, which should be addressed in the future and for which we have here within laid the foundation.
From a methodological perspective, the scope of this study was relatively narrow, focusing on a case study approach for selected energy efficiency measures. In order to provide a more comprehensive approach with more generalizable results, the collection of primary data on transaction costs and the influence of energy efficiency services on these cost elements is a key prerequisite.
Reference [14] found that the lack of awareness belongs to the most relevant barriers to energy efficiency investments in businesses: “Regardless of the level of importance [that] energy receives in different companies, creating awareness about its efficient use and what this could mean in terms of cost and benefits requires more attention.” This insight also relates to our research context as a lack of awareness may either hinder the general interest (and investment) in energy efficiency or it may result in higher transaction costs, for instance, when the search for information becomes more time-consuming. Information quantifying how the lack of awareness results in true costs for businesses transactions may accelerate the interest of those businesses to overcome this lack of awareness. The hindering role of transaction costs is not only applicable to energy efficiency investments or the business sector. With regard to actors or sectors, the background study of Reference [5] also focused on the residential sector and public buildings. In the latter sphere, the authors of [47] “concluded that meeting the central government renovations requirements or achieving equivalent energy savings under Article 5 [of the EU’s Energy Efficiency Directive] may be challenging and increased efforts are therefore needed to step up progress in improving energy efficiency in the public sector.” To the knowledge of the authors, it is not well known how transaction costs affect energy savings in public buildings. A better understanding of transaction costs could shed light on problems attached to investments of the public purse; for instance, if search costs for relevant information are relatively high, policy makers could initiate problem-oriented policy support or (local/regional) administrations could provide hands-on help to staff in charge of realizing energy efficiency in public buildings. For instance, in Germany, Reference [48] recommended to public authorities to make use of government funding available for employing renovation managers that technically deal with the energetic refurbishment of existing public buildings. Such staff are better qualified than regular staff and may implement energy efficiency investments within shorter time periods. This is also relevant in order to meet policy targets such as Articles 5 and 18 of the Energy Efficiency Directive (EED). Furthermore, the annual reports which have to be published by the Member States according to Article 24 of the EED could also be improved by integrating not only costs and benefits of energy efficiency measures but also TAC and further benefits [47]. As for the field of renewable energies, Reference [49] analyzed the allocation of public funding and factor in the role of local administrative units. It could be helpful to know about the efforts (in quantitative terms) to apply for funding. This could give orientation to simplify certain procedures in the administrative unit and provide a reason to develop capacities for gaining access to public funds (e.g., proposal writing and contractual issues).
In a nutshell, Reference [50] noted that stakeholders including investors and policy makers “are usually aware of the existence of transaction costs in energy efficiency projects and programmes but know neither their structure nor the exact levels. Therefore, a common method is needed for including them in decision making.” Hence, a more robust information base on transaction costs, relevant TAC categories, and data on how such TACs turn into true costs would enable various stakeholder groups to reduce these components.

5. Conclusions

The central research objective was to carry out a CBA which factors in transaction costs and costs for energy efficiency services. While TACs and costs for EES increase the overall costs of an investment, EESs in fact contribute to lowering TAC since an energy expert takes over some of the work, which would otherwise be assigned to the respective company. At least for the German case, government funding is also available to reduce costs for EES.
While extending a CBA has not been done yet, information about TACs and EESs will give investors a more realistic picture of energy efficiency investments. Therefore, it is crucial to focus more on the issue of transaction costs and to overcome existing prejudices (energy efficiency is too expensive, and information gathering and qualification would take too long). In addition, the role of energy services in relation to transaction costs must also be given greater importance. Especially if the transaction costs in a company are considered too high, this barrier can be overcome by energy services—in a cost-efficient way.
This makes it essential to identify relevant and quantitative data to be included in a CBA calculation. For our three real-world case studies (M1–M3) we compiled data on TAC and EES through a meta-analysis of existing literature. This was complemented by three interviews with energy experts.
Despite limited availability of data, our paper was able to showcase quantitatively that monetary benefits of energy efficiency investments outperform costs, including TAC and EES. For instance, the benefits of exchanging an inefficient motor (M1) are five to six times higher than all cost components assessed in this paper. For more capital-intensive investments such as using compressed air (M2) or efficient cooling technology (M3), benefits outperform costs by a factor of around two, at least, despite TAC and EES being integrated. These findings can counterargue those that believe energy efficiency is not worth it (in monetary terms) due to high transaction costs and energy services costs. In fact, this is good news for energy efficiency and for those that seek to make use of our findings to argue in favor of taking up energy efficiency investments in businesses.
The data limitations of our study must be considered, but at the same time, such restrictions suggest a step forward. Regarding the limitations, it should be acknowledged that we artificially constructed the analysis because there is no information empirically gathered that includes quantitative TAC and costs for EES. Hence, a multicriteria analysis was applied to identify relevant measures (M1–M3), in the wake of which we sought TAC- and EES-related data that fits into the context of the measures. Especially data on how TAC are reduced through EES are not available. There is a considerable need for research here. Hence, future investigations may compile information as part of a concrete investment project in line with [38] or [39]. Therefore, for instance, if a business decides to realize energy efficiency investments, research should identify relevant TAC components and collect information on how much time would be spent on them. With regard to the translation of time needed into costs, research could either make use of the salaries of the respective staff or apply an average wage. A substantial number of cases is needed to underpin the results and to transfer them to other cases. At the same time, EES costs should be considered. The key challenge, then, is on how the respective energy consultant reduces which TAC for a company. Energy efficiency services play a crucial role in addressing transaction costs related to information deficits; however, the effect has not been quantified in the literature so far. A quantification of such effects would provide a basis for further development of EES and for addressing key barriers to the deployment of energy efficiency technologies.

Author Contributions

Conceptualization, T.A., L.T. and J.T..; methodology, T.A., J.T., L.T., H.L., S.B., K.S. and K.H.; software, H.L.; validation, T.A., J.T., L.T., H.L., S.B., K.S. and K.H.; formal analysis, T.A., J.T., L.T., H.L., S.B., K.S. and K.H.; investigation, T.A., L.T., H.L., S.B., K.S. and K.H.; writing—original draft preparation, T.A., L.T. and H.L.; writing—review and editing, L.T., J.T., H.L. and S.B.; visualization, T.A. and H.L.; supervision, T.A.; project administration, J.T. All authors have read and agreed to the published version of the manuscript.

Funding

This research was funded by the Federal Energy Efficiency Center (BfEE) within the German Federal Office for Economic Affairs and Export Control (BAFA), project title: “Erweiterung von Kosten-Nutzen-Analysen zu ausgewählten Energieeffizienzmaßnahmen um Erkenntnisse zum Markt fuür Energieeffizienzdienstleistungen und zum Aufwand von Investitionen in Energieeffizienz“ (Projekt BfEE 18/2017).

Acknowledgments

We kindly thank the Federal Energy Efficiency Center (BfEE) for funding the research project, which provides the basis for this publication. Thanks also to Arne Meier from the Wuppertal Institute for supporting this paper administratively.

Conflicts of Interest

The authors declare no conflict of interest. The funders of the research (BfEE) contributed to the design of the study through feedback and comments. In addition, the BfEE provided data from previously executed market research and evaluations. The funding agency agreed to the publishing of study results.

References

  1. California Public Utilities Commission (CPUC). California Standard Practice Manual. Economic Analysis of Demand-Side Programs and Projects; Governor’s Office of Planning and Research: Sacramento, CA, USA, 2001. Available online: http://www.calmac.org/events/SPM_9_20_02.pdf (accessed on 15 November 2020).
  2. National Action Plan for Energy Efficiency. Understanding Cost-Effectiveness of Energy Efficiency Programs: Best Practices, Technical Methods, and Emerging Issues for Policy-Makers. Energy and Environmental Economics Inc. and Regulatory Assistance Project; 2008. Available online: https://19january2017snapshot.epa.gov/sites/production/files/2015-08/documents/understanding_cost-effectiveness_of_energy_efficiency_programs_best_practices_technical_methods_and_emerging_issues_for_policy-makers.pdf (accessed on 15 November 2020).
  3. Levine, M.; Ürge-Vorsatz, D.; Blok, K.; Geng, L.; Harvey, D.; Lang, S.; Levermore, G.J.; Mongameli Mehlwana, A.; Mirasgedis, S.; Novikova, A.; et al. Residential and commercial buildings. In Climate Change 2007: Mitigation. Constribution of Working Group III to the Fourth Assessment Report of the Intergovernmental Panel on Climate Change; IPCC: New York, NY, USA; Cambridge University Press: Cambridge, UK, 2007. [Google Scholar]
  4. Adisorn, T.; Luetkehaus, H.; Thema, J.; Tholen, L.; Braungardt, S.; Huenecke, K.; Schumacher, K. Towards a More Realistic Cost-Benefits Analysis—Attempting to Integrate Transaction Costs and Energy Efficiency Services. 2020. Available online: https://elib.dlr.de/136983/ (accessed on 15 November 2020).
  5. Wuppertal Institut für Klima, Umwelt, Energie; Öko-Institut e.V. Erweiterung von Kosten-Nutzen-Analysen zu Ausgewählten Energieeffizienzmaßnahmen um Erkenntnisse zum Markt für Energieeffizienzdienstleistungen und zum Aufwand von Investitionen in Energieeffizienz. 2018. Available online: https://www.bfee-online.de/SharedDocs/Downloads/BfEE/DE/Energiedienstleistungen/studie_kostennutzen.html (accessed on 15 November 2020).
  6. Huenecke, K.; Thema, J.; Tholen, L.; Adisorn, T.; Luetkehaus, H.; Braungart, S.; Schumacher, K. What Role do Transaction Costs Play in Energy Effiency Improvements and How Can They Be Reduced? eceee summer study 2019. 2019, pp. 675–684. Available online: https://www.eceee.org/library/conference_proceedings/eceee_Summer_Studies/2019/4-monitoring-and-evaluation-for-greater-impact/what-role-do-transaction-costs-play-in-energy-efficiency-improvements-and-how-can-they-be-reduced/ (accessed on 15 November 2020).
  7. Thema, J.; Thomas, S.; Teubler, J.; Chatterjee, S.; Bouzarovski, S.; Mzavandaze, N.; von Below, D. More than Energy Savings: Quantifying the Multiple Impacts of Energy Efficiency in Europe. eceee summer study 2017. 2017. Available online: https://www.eceee.org/library/conference_proceedings/eceee_Summer_Studies/2017/8-monitoring-and-evaluation-building-confidence-and-enhancing-practices/more-than-energy-savings-quantifying-the-multiple-impacts-of-energy-efficiency-in-europe/ (accessed on 15 November 2020).
  8. Jaffe, A.B.; Stavins, R.N. The energy-efficiency gap. What does it mean? Energy Policy 1994, 10, 804–810. [Google Scholar] [CrossRef]
  9. Moya, J.A. A Natural Analogy to the Diffusion of Energy-Efficient Technologies. Energies 2016, 9, 471. [Google Scholar] [CrossRef] [Green Version]
  10. Fleiter, T.; Plötz, P. Diffusion of Energy-Efficient Technologies. In Encyclopedia of Energy, Natural Resource, and Environmental Economics, Vol. 1 Energy; Elsevier: Amsterdam, The Netherlands, 2013; Volume 1, pp. 63–73. [Google Scholar]
  11. Gerarden, T.D.; Newell, R.G.; Stavins, R.N. Assessing the Energy-Efficiency Gap. J. Econ. Lit. 2017, 55, 1486–1525. [Google Scholar] [CrossRef] [Green Version]
  12. König, W.; Loebbe, S.; Büttner, S.; Schneider, C. Establishing Energy Efficiency—Drivers for Energy Efficiency in German Manufacturing Small- and Medium-Sized Enterprises. Energies 2020, 13, 5144. [Google Scholar] [CrossRef]
  13. Thollander, P.; Backlund, S.; Trianni, A.; Cagno, E. Beyond barriers—A case study on driving forces for improved energy efficiency in the foundry industries in Finland, France, Germany, Italy, Poland, Spain, and Sweden. In Applied Energy; Elsevier: Amsterdam, The Netherlands, 2013; Volume 111, pp. 636–643. [Google Scholar] [CrossRef] [Green Version]
  14. Marchi, B.; Zanoni, S. Supply Chain Management for Improved Energy Efficiency: Review and Opportunities. Energies 2017, 10, 1618. [Google Scholar] [CrossRef] [Green Version]
  15. Parker, C.M.; Redmond, J.; Simpson, M. A Review of Interventions to Encourage SMEs to Make Environmental Improvements. Environ. Plan. C Politics Space 2009, 279–301. [Google Scholar] [CrossRef] [Green Version]
  16. Trianni, A.; Accordini, D.; Cagno, E. Identification and Categorization of Factors Affecting the Adoption of Energy Efficiency Measures within Compressed Air Systems. Energies 2020, 13, 5116. [Google Scholar] [CrossRef]
  17. United Nations Framework Convention on Climate Change (UNFCCC). Paris Agreement; United Nations: Paris, France, 2015. [Google Scholar]
  18. European Commission. The European Green Deal; European Commission: Brussels, Belgium, 2019; Available online: https://ec.europa.eu/commission/presscorner/detail/en/IP_19_6691 (accessed on 15 November 2020).
  19. Bundesministerium für Wirtschaft und Energie (BMWi). Energieeffizienzstrategie 2050; Bundesministerium für Wirtschaft und Energie (BMWi): Berlin, Germany, 2019; Available online: https://www.bmwi.de/Redaktion/DE/Publikationen/Energie/energieeffiezienzstrategie-2050.pdf?__blob=publicationFile&v=12 (accessed on 15 November 2020).
  20. Campbell, N.; Ryan, L.; Rozite, V.; Lees, E.; Heffner, G. Capturing the Multiple Benefits of Energy Efficiency; IEA: Paris, France, 2014. [Google Scholar]
  21. Thema, J.; Suerkemper, F.; Couder, J.; Mzavanadze, N.; Chatterjee, S.; Treubler, J.; Rasch, J. The multiple benefits of the 2030 EU energy efficiency potential. Energies 2019, 12, 2798. [Google Scholar] [CrossRef] [Green Version]
  22. Killip, G.; Cooremans, C.; Krishnan, S.; Fawcett, T.; Grijns-Gaus, W.; Voswinkel, F. Multiple Benefits of Energy Efficiency at the Firm Level: A Literature Review. eceee Summer Study Proceedings Paper. 2019. Available online: https://www.eceee.org/library/conference_proceedings/eceee_Summer_Studies/2019/2-whats-next-in-energy-policy/multiple-benefits-of-energy-efficiency-at-the-firm-level-a-literature-review/ (accessed on 15 November 2020).
  23. Simas, M.; Pacca, S. Socio-economic Benefits of Wind Power in Brazil. J. Sustain. Dev. Energy Water Environ. Syst. 2013, 1, 27–40. [Google Scholar] [CrossRef] [Green Version]
  24. Shakya, S.R. Benefits of Low Carbon Development Strategies in Emerging Cities of Developing Country: A Case of Kathmandu. J. Sustain. Dev. Energy Water Environ. Syst. 2016, 4, 141–160. [Google Scholar] [CrossRef]
  25. van der Meulen, S.H. Costs and Benefits of Green Roof Types for Cities and Building Owners. J. Sustain. Dev. Energy Water Environ. Syst. 2018, 7, 55–71. [Google Scholar] [CrossRef]
  26. Institute for European Environmental Policy (IEEP). Review of Costs and Benefits of Energy Savings, Task 1 Report “Energy Savings 2030”; Institute for European Environmental Policy (IEEP): London, UK, 2013.
  27. Behi, B.; Baniasadi, A.; Arefi, A.; Goriy, A.; Jennings, P.; Pivrikas, A. Cost–Benefit Analysis of a Virtual Power Plant Including Solar PV, Flow Battery, Heat Pump, and Demand Management: A Western Australian Case Study. Energies 2020, 13, 2614. [Google Scholar] [CrossRef]
  28. Moser, S.; Mayrhofer, J.; Schmidt, R.; Tichler, R. Socioeconomic cost-benefit-analysis of seasonal heat storages in district heating systems with industrial waste heat integration. In Energy; Elsevier: Amsterdam, The Netherlands, 2018; pp. 868–874. [Google Scholar] [CrossRef]
  29. Thomas, S. Aktivitäten der Energiewirtschaft zur Förderung der Energieeffizienz auf der Nachfrageseite in Liberalisierten Strom- und Gasmärkten Europäischer Staaten: Kriteriengestützter Vergleich der Politischen Rahmenbedingungen; Kommunalwirtschaftliche Forschung und Praxis; Europäischer Verlag der Wissenschaft: Berlin, Germany, 2007; Volume 13, ISBN 1435-8468. [Google Scholar]
  30. Bundesministerium für Umwelt, Naturschutz und nukleare Sicherheit (BMU). Beschluss der Bundesregierung zum Klimaschutzprogramm der Bundesrepublik Deutschland auf der Basis des Vierten Berichts der IMA “CO2-Reduktion”; Bundesministerium für Umwelt, Naturschutz und nukleare Sicherheit (BMU): Bonn, Germany, 1997. [Google Scholar]
  31. Gillingham, K.; Palmer, K. Bridging the Energy Efficiency Gap: Policy Insights from Economic Theory and Empirical Evidence. Rev. Environ. Econ. Policy 2014, 8, 18–38. [Google Scholar] [CrossRef] [Green Version]
  32. Mundasca, L.; Mansoz, M.; Neij, L.; Timilsina, G. Transaction Costs of Low Carbon Technologies and Policies. The Diverging Literature; Policy Research Paper 6565; World Bank: Washington, DC, USA, 2013. [Google Scholar]
  33. Kiss, B. Exploring transaction costs in passive house-oriented retrofitting. J. Clean. Prod. 2016, 123, 65–76. [Google Scholar] [CrossRef] [Green Version]
  34. Kube, M.; Schimmel, M.; Rhiemeier, J.M.; Barckhausen, A.; Fehr, J.; Büttner, S.; Unger, M.; Bottner, F.; Piégsa, A. Marktverfügbare Innovationen mit hoher Relevanz für die Energieeffizienz in der Industrie. 2017. Available online: https://www.bmwi.de/Redaktion/DE/Publikationen/Energie/marktverfuegbare-innovationen-mit-hoher-relevanz-fuer-energieeffizienz-in-der-industrie.pdf (accessed on 22 December 2020).
  35. Dena. Elektrische Motoren in Industrie und Gewerbe—Energieeffizienz- und Ökodesign-Richtlinie; Dena: Berlin, Germany, 2010. [Google Scholar]
  36. Bieniek, K. “Life-Cycle Costs” of Industrial Electric Drives in the Process Industry—Energy Consumption and Economics of Electric Drives. In Energy Efficiency Improvements in Electronic Motors and Drives; Springer: Heidelberg/Berlin, Germany, 2000. [Google Scholar] [CrossRef]
  37. Hein, L.; Blok, K. Transaction Costs of Energy Efficiency Improvement. eceee summer study 1995. 1995. Available online: https://www.eceee.org/library/conference_proceedings/eceee_Summer_Studies/1995/Panel_2/p2_12/ (accessed on 15 November 2020).
  38. Ostertag, K. Re-Assessing No-Regret Potentials—The Example of High Efficiency Electric Motors. eceee summer study 2001. 2001. Available online: http://publica.fraunhofer.de/dokumente/N-9797.html (accessed on 15 November 2020).
  39. Mai, M.; Gebhardt, T.; Wahl, F.; Dann, D.; Jochem, E. Transaktionskosten bei Energieeffizienz-Investitionen in Unternehmen. Zeitschrift für Energiewirtschaft 2014, 38, 269–279. [Google Scholar] [CrossRef] [Green Version]
  40. Irrek, W.; Suerkemper, F.; Rochas, C. Energy Efficiency Services. Good Practice and Successful Market Developments; Change Best Project; Ekodoma: Riga, Latvia, 2012. [Google Scholar]
  41. Mai, M.; Gruber, E.; Holländer, E.; Roser, A.; Gerspacher, A.; Fleiter, T.; Hirzel, S.; Ostrander, B.; Schleich, J.; Schlomann, B. Evaluation des Förderprogramms „Energieberatung im Mittelstand; Institut für Ressourceneffizienz und Energiestrategien GmbH (IREES); Fraunhofer-Institut für System- und Innovationsforschung ISI: Karlsruhe, Germany, 2014.
  42. Adisorn, T.; Vondung, F. Behind Closed Windows—An Actor-Centred Analysis of Barriers for the Diffusion of Energy Efficient Ventilation Systems in Residential Buildings. eceee summer study 2019. 2019, pp. 1459–1468. Available online: https://www.eceee.org/library/conference_proceedings/eceee_Summer_Studies/2019/8-buildings-technologies-and-systems-beyond-energy-efficiency/behind-closed-windows-an-actor-centred-analysis-of-barriers-for-the-diffusion-of-energy-efficient-ventilation-systems-in-residential-buildings/ (accessed on 15 November 2020).
  43. Verbraucherzentrale Bundesverband. Unsere Themen. Available online: https://verbraucherzentrale-energieberatung.de/?cn-reloaded=1 (accessed on 14 December 2020).
  44. Bayerisches Landesamt für Umweltschutz. Druckluft im Handwerk. Untersuchung von Druckluftanlagen in Handwerksbetrieben; Bayerisches Landesamt für Umweltschutz: Augsburg, Germany, 2004. [Google Scholar]
  45. Kiss, B.; Mundasca, L. Transaction Costs of Energy Efficiency in Buildings: An Overview. IAEE Energy Forum 2013, 22, 31–32. [Google Scholar]
  46. Bundesamt für Wirtschaft und Ausfuhrkontrolle; Bundesstelle für Energieeffizienz. Empirische Untersuchung des Marktes für Energiedienstleistungen, Energieaudits und andere Energieeffizienzmaßnahmen im Jahr 2018; BfEE 17/2017; Bundesamt für Wirtschaft und Ausfuhrkontrolle; Bundesstelle für Energieeffizienz: Eschborn, Germany, 2018. [Google Scholar]
  47. Zangheri, P.; Economidou, M.; Labanca, N. Progress in the Implementation of the EU Energy Efficiency Directive through the Lens of the National Annual Reports. Energies 2019, 12, 1107. [Google Scholar] [CrossRef] [Green Version]
  48. Deutsche Energie-Agentur. Dena-Analyse—Kommunale Nichtwohngebäude; Deutsche Energie-Agentur GmbH: Berlin, Germany, 2018. [Google Scholar]
  49. Kazak, J.K.; Kamińska, J.A.; Madej, R.; Bochenkiewicz, M. Where Renewable Energy Sources Funds are Invested? Spatial Analysis of Energy Production Potential and Public Support. Energies 2020, 13, 5551. [Google Scholar] [CrossRef]
  50. Valentová, M. Barriers to Energy Efficiency—Focus on Transaction Costs. Acta Polytechnica 2010, 50. Available online: https://ojs.cvut.cz/ojs/index.php/ap/article/view/1247 (accessed on 15 November 2020).
Figure 1. Schematic overview of a cost–benefit analysis (CBA) for the uptake of energy efficiency measures including transaction costs (TAC) and energy efficiency services (EES).
Energies 14 00152 g001
Figure 2. Enhanced dynamic cost–benefit analysis of the selected energy efficiency measures: (a) M1, (b) M2, and (c) M3, with EES costs to investor (after government subsidies using a 2.00% discount factor).
Energies 14 00152 g002
Table 1. Cases developed in the businesses sector to perform an enhanced cost–benefit analysis (Sources: M1: [35], M2: [44], and M3: [34]).
CaseExchange of Inefficient Motors (M1)Energy Consumption Reduction through Compressed Air (M2)Efficient Cooling Technology (M3)
Case description(Early) replacement of an older motor (4-pole, 30 kW, efficiency class EFF3, efficiency of 85%) with an efficient motor of class IE3.Use of compressed air station with a total energy consumption of 1000 MWh per year (before modernization).Use of an innovative system using water as a refrigerant and the use of free cooling
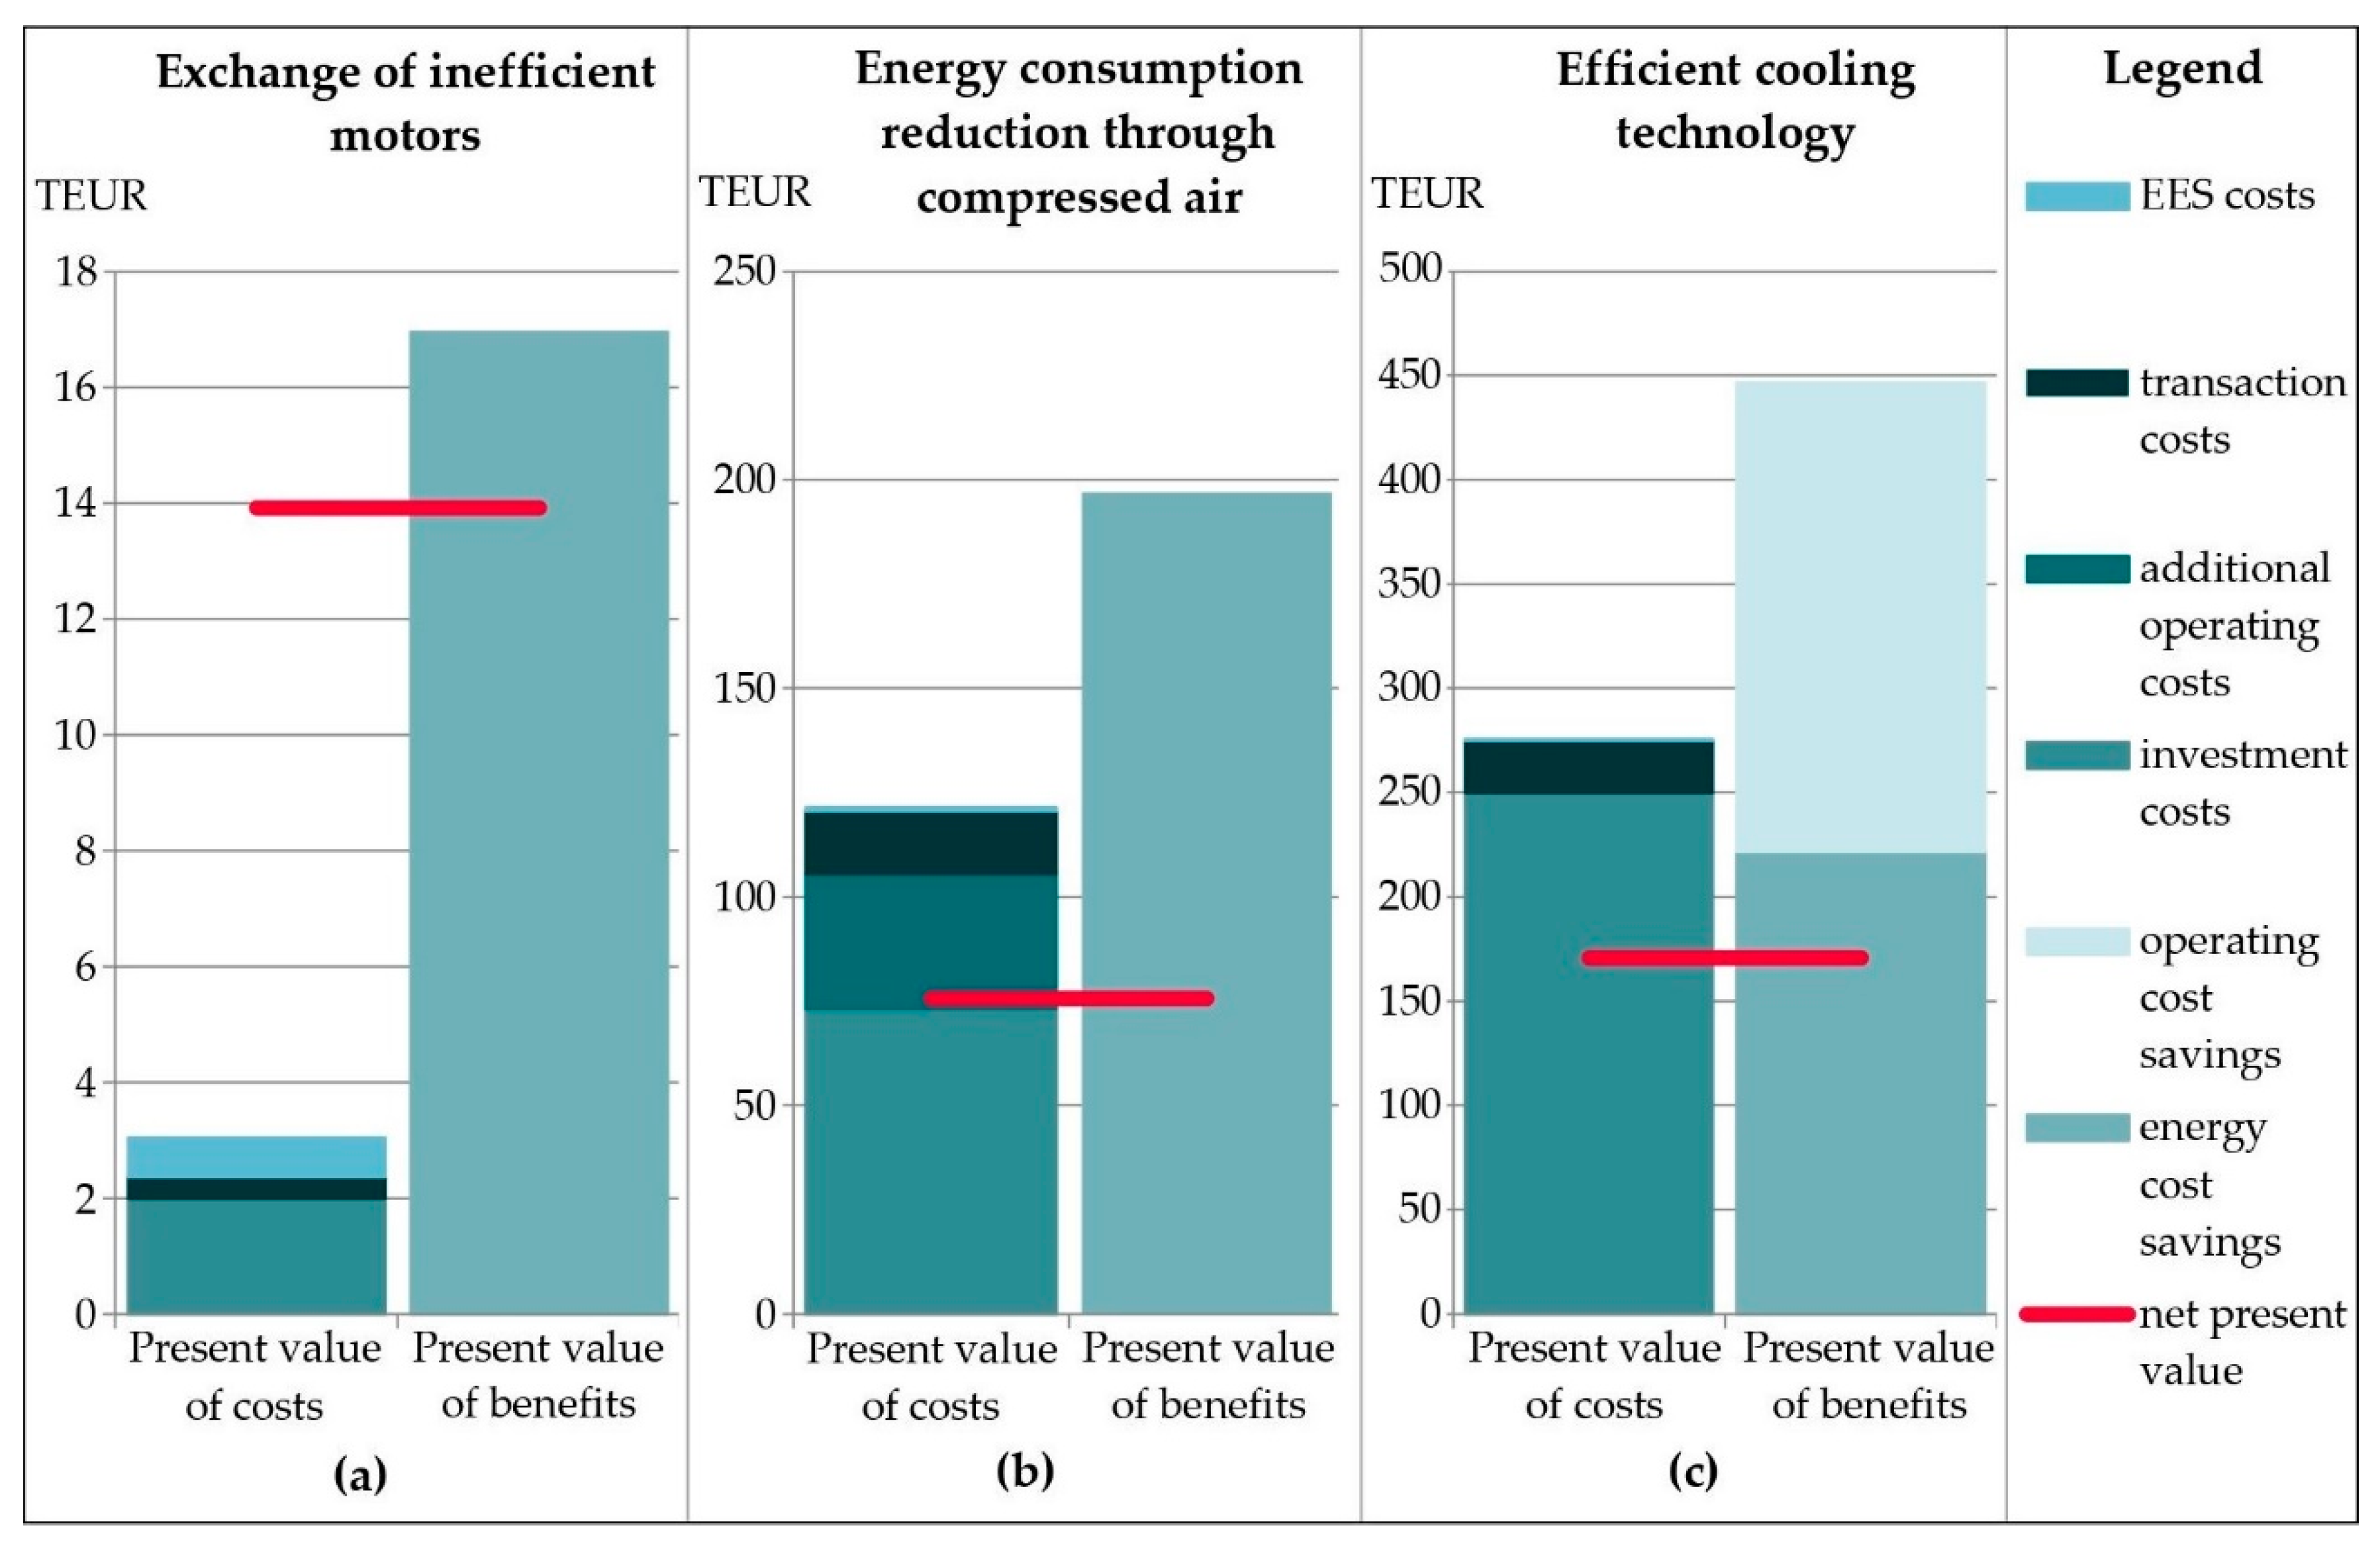
Investment costs (€)200073,000250,000
Energy cost savings over life span (€)16,994.98196,928.45221,869.85
Table 2. Present value costs and benefits of selected energy efficiency measures over the respective life time using a 2.00% discount factor.
CaseExchange of Inefficient Motors (M1) (€)Energy Consumption Reduction through Compressed Air (M2) (€)Efficient Cooling Technology (M3) (€)
Investment costs200073,000250,000
Additional operating costs032,359.960
Transaction costs366.6715,00025,000
EES costs 12666.672666.672666.67
Government funding for EES200020002000
Investor costs for EES666.67666.67666.67
Operation costs savings00224,564.63
Energy costs savings16,994.98196,928.45221,869.85
Reduction of TAC through EESn.a.n.a.n.a.
Net present value13,911.6475,601.83170,767.80
1 Note that the cost for EES recommending 3 to 5 energy efficiency measures are between 5000 to 8000 € in total. Allocating the costs to the number of measures and taking into account the upper bound, this yields average costs of 2667 € or 667 € after government funding per measure, irrespective of the distinct energy efficiency measure (M1–M3).
Publisher’s Note: MDPI stays neutral with regard to jurisdictional claims in published maps and institutional affiliations.

