Article

The Effect of Tab Attachment Positions and Cell Aspect Ratio on Temperature Difference in Large-Format LIBs Using Design of Experiments

1
Graduate School of Mechanical Design & Production Engineering, Konkuk University, 120, Neung Dong-ro, Gwangjin-gu, Seoul 05029, Korea
2
School of Mechanical Engineering, Konkuk University, 120, Neung Dong-ro, Gwangjin-gu, Seoul 05029, Korea
*
Author to whom correspondence should be addressed.
Energies 2021, 14(1), 116; https://doi.org/10.3390/en14010116
Submission received: 22 September 2020 / Revised: 11 December 2020 / Accepted: 15 December 2020 / Published: 28 December 2020
(This article belongs to the Section D1: Advanced Energy Materials)

Abstract

:
Large-format lithium-ion batteries (LIBs) suffer from problems in terms of their product life and capacity due to large temperature differences in LIB cells. This study analyzes the effect of design factors on temperature distribution using a 3D electrochemical–thermal model. The design of experiments methodology is used to obtain the sampling points and analyze the effect of the cell aspect ratio, negative tab attachment position, and positive tab attachment position. These were considered as design factors for the maximum and minimum temperatures, as well as their difference, in large-format LIB cells. The results reveal that the cell aspect ratio, negative tab attachment position, and positive tab attachment position considerably influence temperature distribution. The cell aspect ratio has the most significant effect on the temperature distribution by changing the longest current pathway and the distance between tabs and the lowest temperature point in the LIB cell. A positive tab attachment position affects the maximum temperature, minimum temperature, and the temperature difference due to the heat generation caused by the high resistance of aluminum, which the positive tab is made. Furthermore, a negative tab attachment position affects the minimum temperature due to low resistance.

1. Introduction

Recently, the demand for large-format lithium-ion batteries (LIBs) has increased due to the popularity of electric vehicles [1,2,3,4]. A large-format LIB has a large temperature difference (Tdiff) in the LIB cell due to the large dimensions of the cell. The temperature difference in the LIB cell causes critical problems, such as a rapid reduction in its capacity [5,6,7].
In order to solve the problems caused by the temperature difference in the LIB cell, several studies involving experiments and numerical models have been conducted. In the early 1990s, Newman and his colleagues developed an electrochemical–thermal model of LIBs by using the porous electrode theory for calculating the temperature in the LIB cell through numerical methods [8,9]. However, Newman’s model had a limitation since it only predicted the temperature distribution in the thickness direction of the LIB cell. To overcome the limitation of Newman’s model, Gerver developed a 3D electrochemical–thermal model by extending Newman’s model to 3D [10]. Subsequently, a variety of studies were conducted to calculate and analyze the temperature distribution in the LIB cell by using 3D electrochemical–thermal models [11,12,13,14,15,16,17].
In order to solve the problems caused by the temperature difference in the large-format LIB cell, studies were conducted to analyze the factors that affect the temperature distribution in the LIB cell [11,12,13,14,15,16,17]. Kim et al. showed that the length of the LIB cell and the tab type affects the temperature distribution in the LIB cell [11]. Both Du et al. [12] and Kosch et al. [13] analyzed the temperature distribution in the LIB cell with different tab types: the nominal tab (NT, tabs are on the same side of the cell) and the counter tab (CT, tabs are on the opposite side of the cell). These studies showed that the CT had a more uniform temperature distribution than the NT [12,13]. By comparing the temperature distribution of the CT and the misaligned CT, Song et al. showed that the CT, which has centered tabs, has a more uniform temperature distribution than the misaligned CT [6]. Lee et al. analyzed how a large cell aspect ratio and the tab type affects the temperature distribution in the LIB cell [14]. Zhao et al. analyzed the current density distributions with a different attachment position and the number of tabs [15], and they demonstrated that the tab attachment position affects the current density distribution in the LIB cell, which affects the temperature distribution [15]. Samba et al. analyzed the potential distributions, the current density distributions, and the temperature distributions of a large-format LIB cell with a different tab type and cell aspect ratio. They showed that the tab type and cell aspect ratio can affect the temperature distribution in the LIB cell by changing the potential distributions and the current density distributions [16]. Lee et al. showed that the temperature distribution can be improved by optimizing the cell aspect ratio, tab attachment position, and the tab type [17].
These studies showed that the cell aspect ratio, the tab type, and the tab attachment positions affect the temperature distribution for a large-format LIB cell. Moreover, temperature distribution can be improved by designing the cell aspect ratio, tab attachment position, and tab type [17], and there is a study about the effect of tab type and cell aspect ratio on temperature distribution in large-format LIB cell [14]. However, many studies only conducted parametric research with a few cases to analyze the effect of the cell aspect ratio and tab attachment position on the temperature distribution in a large-format LIB cell. In particular, the effect of the tab attachment position on the temperature distribution has not been researched adequately. In order to make the temperature distribution of large-format LIB cell uniform, it is necessary to perform an in-depth analysis of the effect of the cell aspect ratio and the tab attachment position on the temperature distribution for a large-format LIB cell.
In this study, the temperature distribution of a 45-Ah LFP/graphite pouch cell with an NT tab type with a different cell aspect ratio and tab attachment position are analyzed by using a 3D electrochemical–thermal model. The negative tab attachment position, positive tab attachment position, and cell aspect ratio are used as design factors. The responses to analyze the temperature distribution according to each design factor include the maximum and minimum temperatures in the LIB cell, and the difference between the maximum and minimum temperature in the LIB cell (Tdiff). Design of experiments (DOE) is performed to analyze the relationship between the design factors and the response. The sampling points of the DOE are obtained by the full factorial design (FFD). The effect of each design factor on the temperature distribution is analyzed, and the significance of the design factors is determined through analysis of variance (ANOVA).

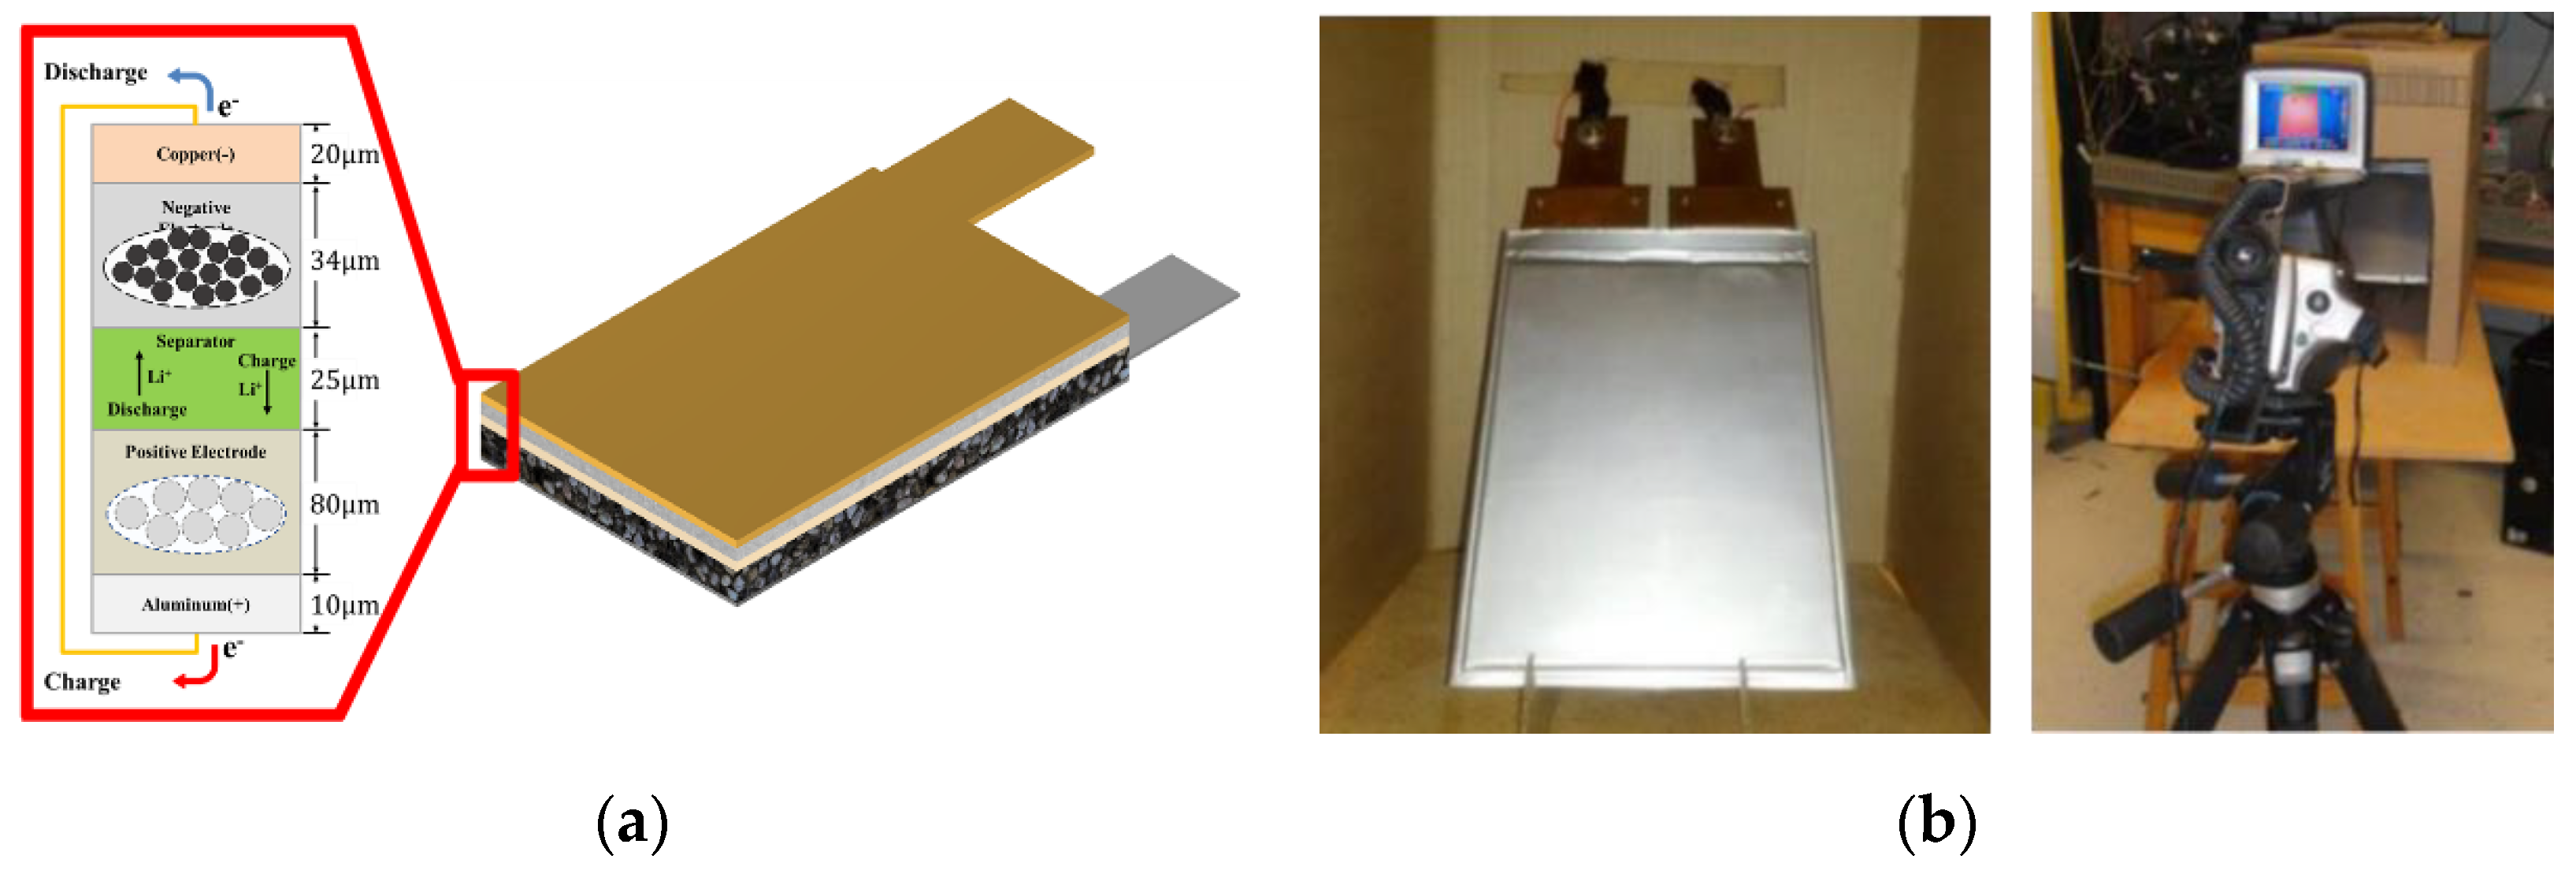
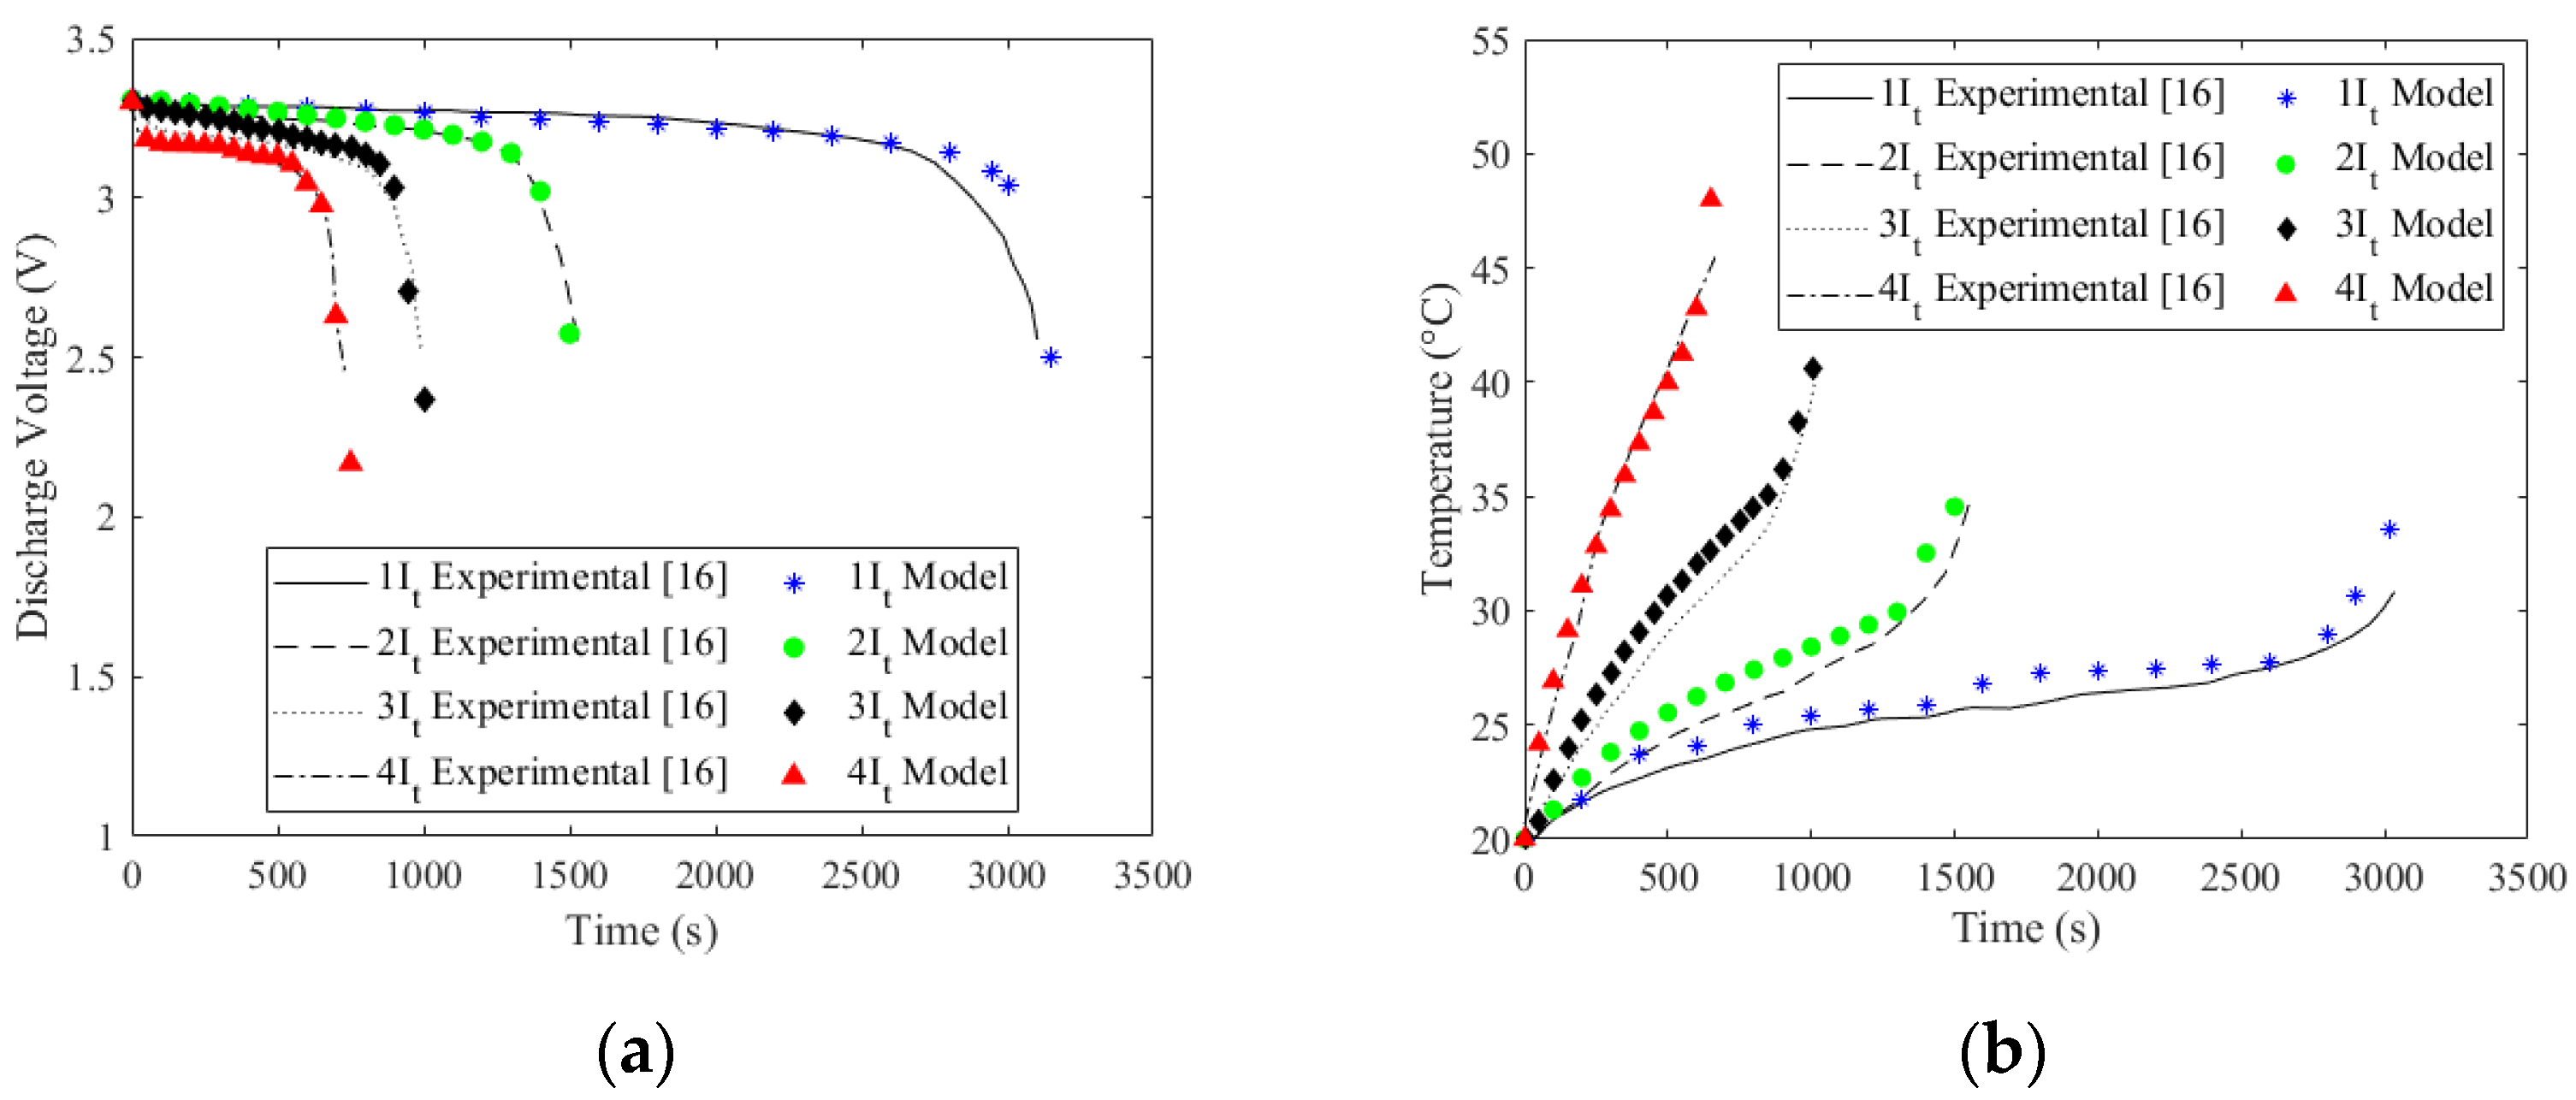
2. Three-Dimensional Electrochemical–Thermal Coupled Model of the 45-Ah LFP/Graphite Cell

Figure 1 shows a schematic of the 45-Ah LFP/graphite LIB unit cell. The unit cell comprises a positive current collector, a positive electrode, a separator, a negative electrode, and a negative current collector. A 3D electrochemical–thermal coupled model was used to calculate the temperature distribution of the 45-Ah LFP/graphite LIB unit cell.
The electrochemical–thermal coupled model developed by Rao and Newman was used in this study [8,9]. The electrochemical–thermal coupled model consists of an electrochemical model that calculates the state of charge (SOC, the level of charge of an electric battery relative to its capacity), the potential distribution, the current density distribution, and the heat generation. Meanwhile, the thermal model calculates the temperature distribution [8,9].
The electrochemical model calculates the diffusion of the lithium ion in the electrodes, the potential distribution, the current density distribution, and the heat generation in the LIB cell, as shown in Equations (1)–(8) [8]. Equations (1) and (2) calculate the charge balance according to the electrochemical reaction [8]. Equation (3) calculates the diffusion of the lithium ion in the active material by using the spherical coordinate system [8]. Equation (4) defines the ionic charge transport of the lithium ion and Equation (5) defines the reaction kinetics at the surface of the active material by the lithium-ion flux and the Butler–Volmer equation [8].
· ( k 1 ϕ 1 ) = a · j n
· ( k 2 e f f ϕ 2 + 2 R c T k 2 e f f F ( 1 + ln f ± ln c 2 ) ( 1 t + ) ( ln c 2 ) ) = a · j n
d c 1 d t + 1 r 2 r ( r 2 D 1 c 1 r ) = 0
ε d c 2 d t = · ( D 2 e f f c 2 ) 1 F i 2 · t + + a · j n ( 1 t + )
N 0 = j n F , j n = i 0 { exp ( η F R T ) exp ( ( η ) F R T ) }
Equations (6) and (7) define the reversible and irreversible heat generation in the positive electrode and the negative electrode [9]. The first term of Equations (6) and (7) defines the reversible heat in the electrodes and the other terms in Equations (6) and (7) define the polarization heat, the electronic ohmic heat, and the ionic ohmic heat in the electrodes, respectively [9]. The thermal model calculates the temperature distribution in the LIB cell by applying the heat generation given in Equations (6)–(9). This was calculated from the current collectors, electrodes, and the separator, as demonstrated in Equation (10) [9].
q n = a · j n · T Δ S n F + a · j n · η n i 1 · ϕ 1 i 2 · ϕ 2
q p = a · j n · T Δ S p F + a · j n · η p i 1 · ϕ 1 i 2 · ϕ 2
q s = i 2 · ϕ 2
q c = i 1 2 · r c
ρ C p T t = K i j 2 T + q p + q n + q s + q c
In order to verify the electrochemical–thermal coupled model, the constant current discharge test results for the model and the commercial LIB were compared. The properties that were reported by Samba et al. were used for the electrochemical–thermal coupled model [16]. The convective heat transfer coefficient 0.03 W/m2·K is applied on the cell surface, taking into account convective heat transfer [16]. Table 1 shows the model parameters, which include the cell aspect ratio and the tab attachment positions of the LIB cell. The nominal and cut-off voltage were 3.2 V and 2 V, respectively [16]. The 3D electrochemical–thermal model for LIB was built and calculated using COMSOL (COMSOL Inc., Burlington, MA, USA) [19]. I t , which is defined in IEC61434, is the discharge current. This study reported that 1 I t was 0.58 A because of the unit cell’s capacity, which was 0.58 Ah. The constant current discharge test of 1 I t , 2 I t , 3 I t , and 4 I t was performed at the ambient and initial temperature of 20 °C [16]. Figure 2 shows the comparison of the electrochemical–thermal model and the experimental results [16]. Figure 2a shows the comparison of the discharge voltage for I t , 2 I t , 3 I t , and 4 I t , and Figure 2b presents the comparison of the maximum temperature for I t , 2 I t , 3 I t , and 4 I t . These results reveal that the model can predict the experimental results.

3. Analyzing the Effect of Each Design Factor on Temperature Distribution by Applying the Design of Experiments

3.1. Design Factors and Responses

The cell aspect ratio, negative tab attachment position, and positive tab attachment position, which affect the temperature distribution in the large-format LIB cell [6,11,12,13,14,15,16,17], were selected as the design factors. The cell aspect ratio was defined as the ratio (W/L) of the width (W) to the length (L). Figure 3 illustrates the description of the tab attachment positions. In order to compare the effect of the tab attachment positions regardless of the cell width, which is determined by the cell aspect ratio, the tab attachment positions were defined as the ratio of the attached position to the attachable range ( D R n , D R p ) as described in Equation (11). As shown in Equation (12), the tab attached position is defined as the difference between tab center position ( D t ) and half of the tab width (0.5 W t ) to consider the geometry of the cell and tab. The tab attachable range is defined as the difference between the half of cell width and tab width as shown in Equation (13). The maximum temperature ( T m a x ), minimum temperature ( T m i n ), and the difference between the maximum and the minimum temperature (Tdiff) were defined as responses for the temperature distribution in the LIB cell. Equation (14) presents the equation for calculating Tdiff.
D R t = Attached   position Attachable   range × 100 ,   ( t   =   n ,   p )
Attached   position = d t 0.5 W t ,   ( t   =   n ,   p )
Attachable   range = 0.5 W W t ,   ( t   =   n ,   p )
T d i f f = T m a x T m i n
Table 2 shows the lower and upper bounds for the design factors. In order to prevent overlapping tabs, the lower bound of the cell aspect ratio is defined as 1/3. This value is the smallest cell aspect ratio where the cell width (W) is greater than the sum of the positive tab width ( W p ) and the negative tab width ( W n ). The upper bound of the cell aspect ratio is defined as 3, which is the inverse of the lower bound, 1/3. Since the cell capacity should be constant, the area of the cell is constantly limited, as shown in Equation (15). The lower bounds of D R n and D R p are defined as 0% and the upper bounds of D R n and D R p are defined as 100%.
W × L = 34,500   mm 2  

3.2. Design of Experiments Methodology

The design of experiments (DOE) is a powerful tool that can be used to analyze the relationship between the design factors and responses [20]. The significance of each design factor can be analyzed by using the DOE. Unlike traditional experimental methods that only consider one change at a time, the DOE can analyze the interactions of several factors [20]. In addition, several researchers are performing factor analysis by using the DOE in a variety of fields. The sampling points were obtained by performing a full factorial design (FFD) on three factors with five levels. FFD is one DOE sampling method that can consider all the combinations in the design factors. The number of sampling points can be calculated by applying Equation (16) [20]. Table 3 shows the levels of each design factor. In order to symmetrically distribute the cell aspect ratio, the cell aspect ratio is divided into five levels: 1/3, 1/2, 1, 2, and 3. The D R n and D R p are classed into five levels by dividing the lower bound and the upper bound into equal intervals: 0%, 25%, 50%, 75%, and 100% [20].
Total   case = n m ,   ( n = number   of   levels ,   m = number   of   factors )
ANOVA is an effective method to determine the significance of each design factor to a response [20]. ANOVA can be used to determine whether the factors can be ignored or not by analyzing the variance between the factors and comparing the significance of the factors. During ANOVA, the total sum of squares ( S S t o t a l ) is calculated by adding the variances of all the responses, as shown in Equation (17). The sum of squares ( S S k ) for each design factor and the error are calculated by applying Equations (18) and (19).
S S t o t a l = j = 1 k i = 1 n ( x i j x i j ¯ ) 2 ,   ( k   =   number   of   factors ,   n   =   levels   of   each   factor )
S S k = i = 1 n ( x i x i k ¯ ) 2 ,   ( k   =   cell   aspect   ratio ,   D R n ,   D R p ,   n   =   levels   of   each   factor )
S S e r r o r = j = 1 k i = 1 n ( x i j x j ¯ ) 2 ,   ( k   =   number   of   factors ,   n   =   levels   of   each   factor )
In order to consider the effect of the number of sample points for each factor for the sum of squares, the mean squares ( M S k ) are used [20]. To obtain the M S k , the sum of squares is divided by the degrees of freedom for each design factor, as shown in Equation (20). As demonstrated in Equation (21), F k , which is the ratio of M S k to M S e r r o r , can be determined [20].
M S k = S S k D O F k ,   ( D O F k =   n     1 )
F k = M S k M S e r r o r
To determine if the design factors are statistically significant, the p-value is obtained from F k , the degrees of freedom (DOF, the number of values in the final calculation of a statistic that are free to vary) of each design factor, and the DOE of the error, as described in Equation (22) [20]. Generally, when the p-value of a design factor is less than 0.05, it is determined that the design factor is statistically significant. Finally, as shown in Equation (23), the effect on the response of each design factor is analyzed based on the percentage contribution (% contribution), which is the proportion of the MS in each design factor in the total MS [20].
P k = f ( F k , D O F k , D O F e r r o r )
%   contribution = M S k M S × 100

4. Results and Discussion

The LIB cell was discharged with the constant current of 3It. After the cell was fully discharged, the temperature distributions with a different cell aspect ratio, negative tab attachment position, and positive tab attachment position, which are design factors, were analyzed. First, the effect of the negative and positive tab attachment position on the maximum and minimum temperatures in the LIB cell were assessed by applying the longest current pathway. Then, the effect of each design factor on the Tdiff was analyzed according to the effect of each design factor on the maximum and minimum temperatures. Since Tdiff is the difference between the maximum and minimum temperatures, Tdiff was reduced when the maximum temperature decreased or the minimum temperature increased. Finally, the significance of each design factor for Tdiff was analyzed by applying ANOVA. By performing ANOVA, it was determined that all three design factors are effective. When considering the design factors, the effect of the cell aspect ratio is the largest and the effect of the negative tab attachment position is the smallest.

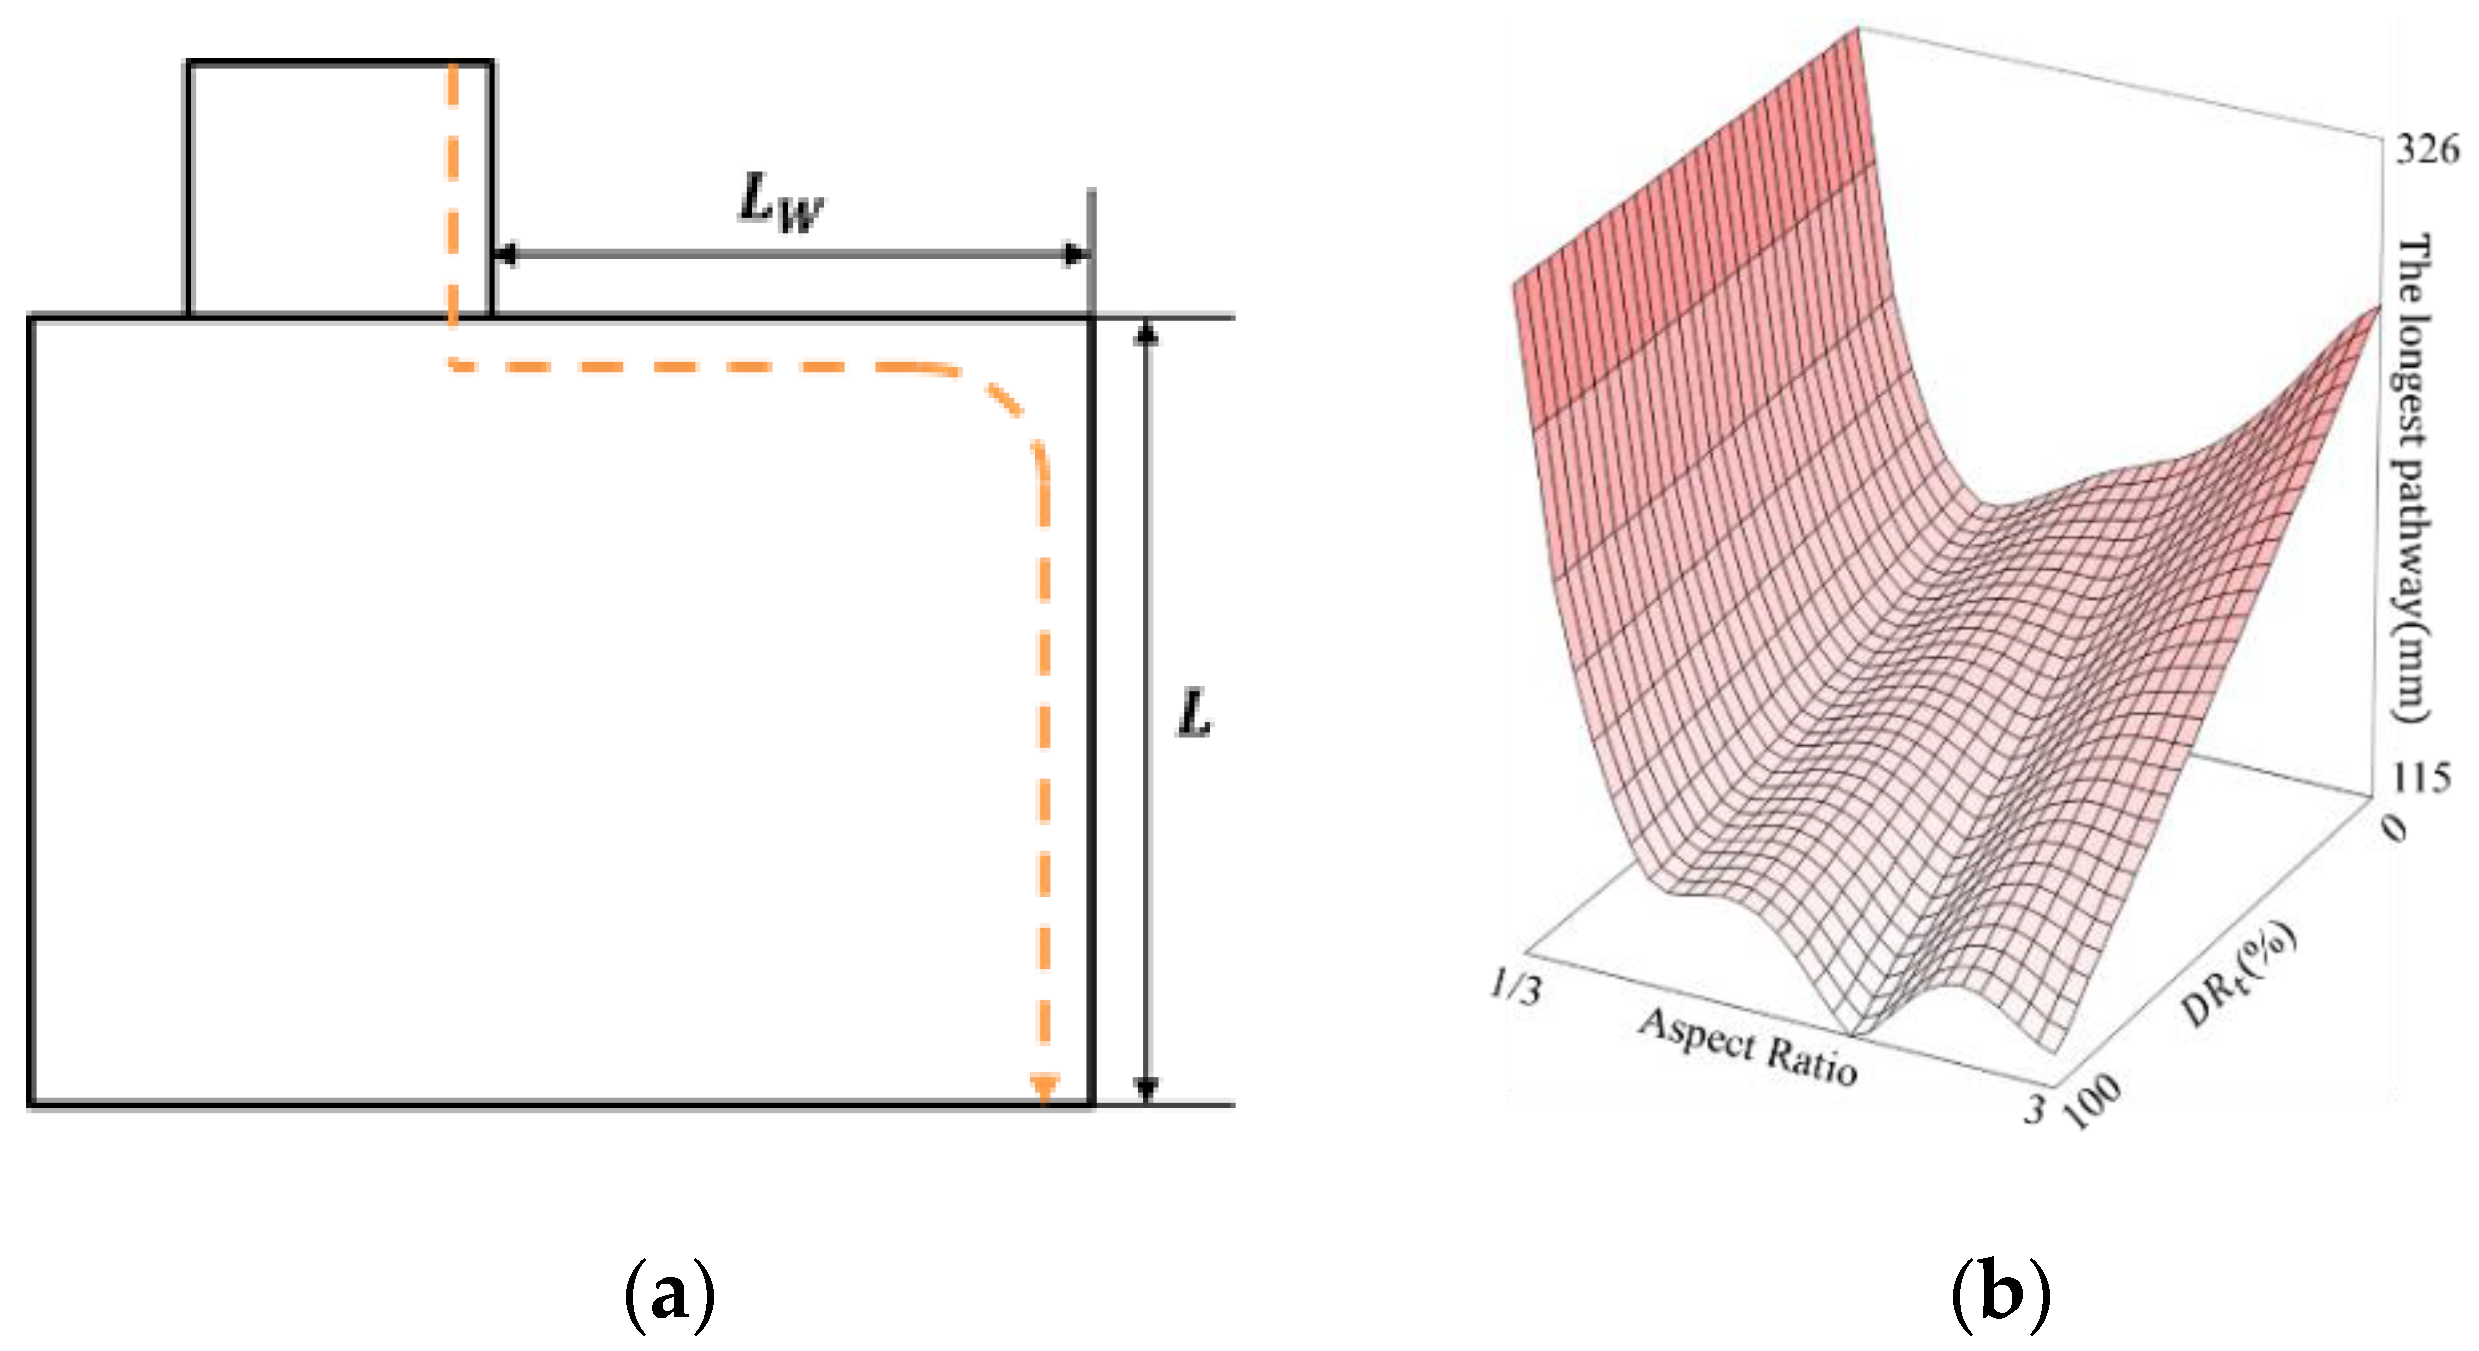
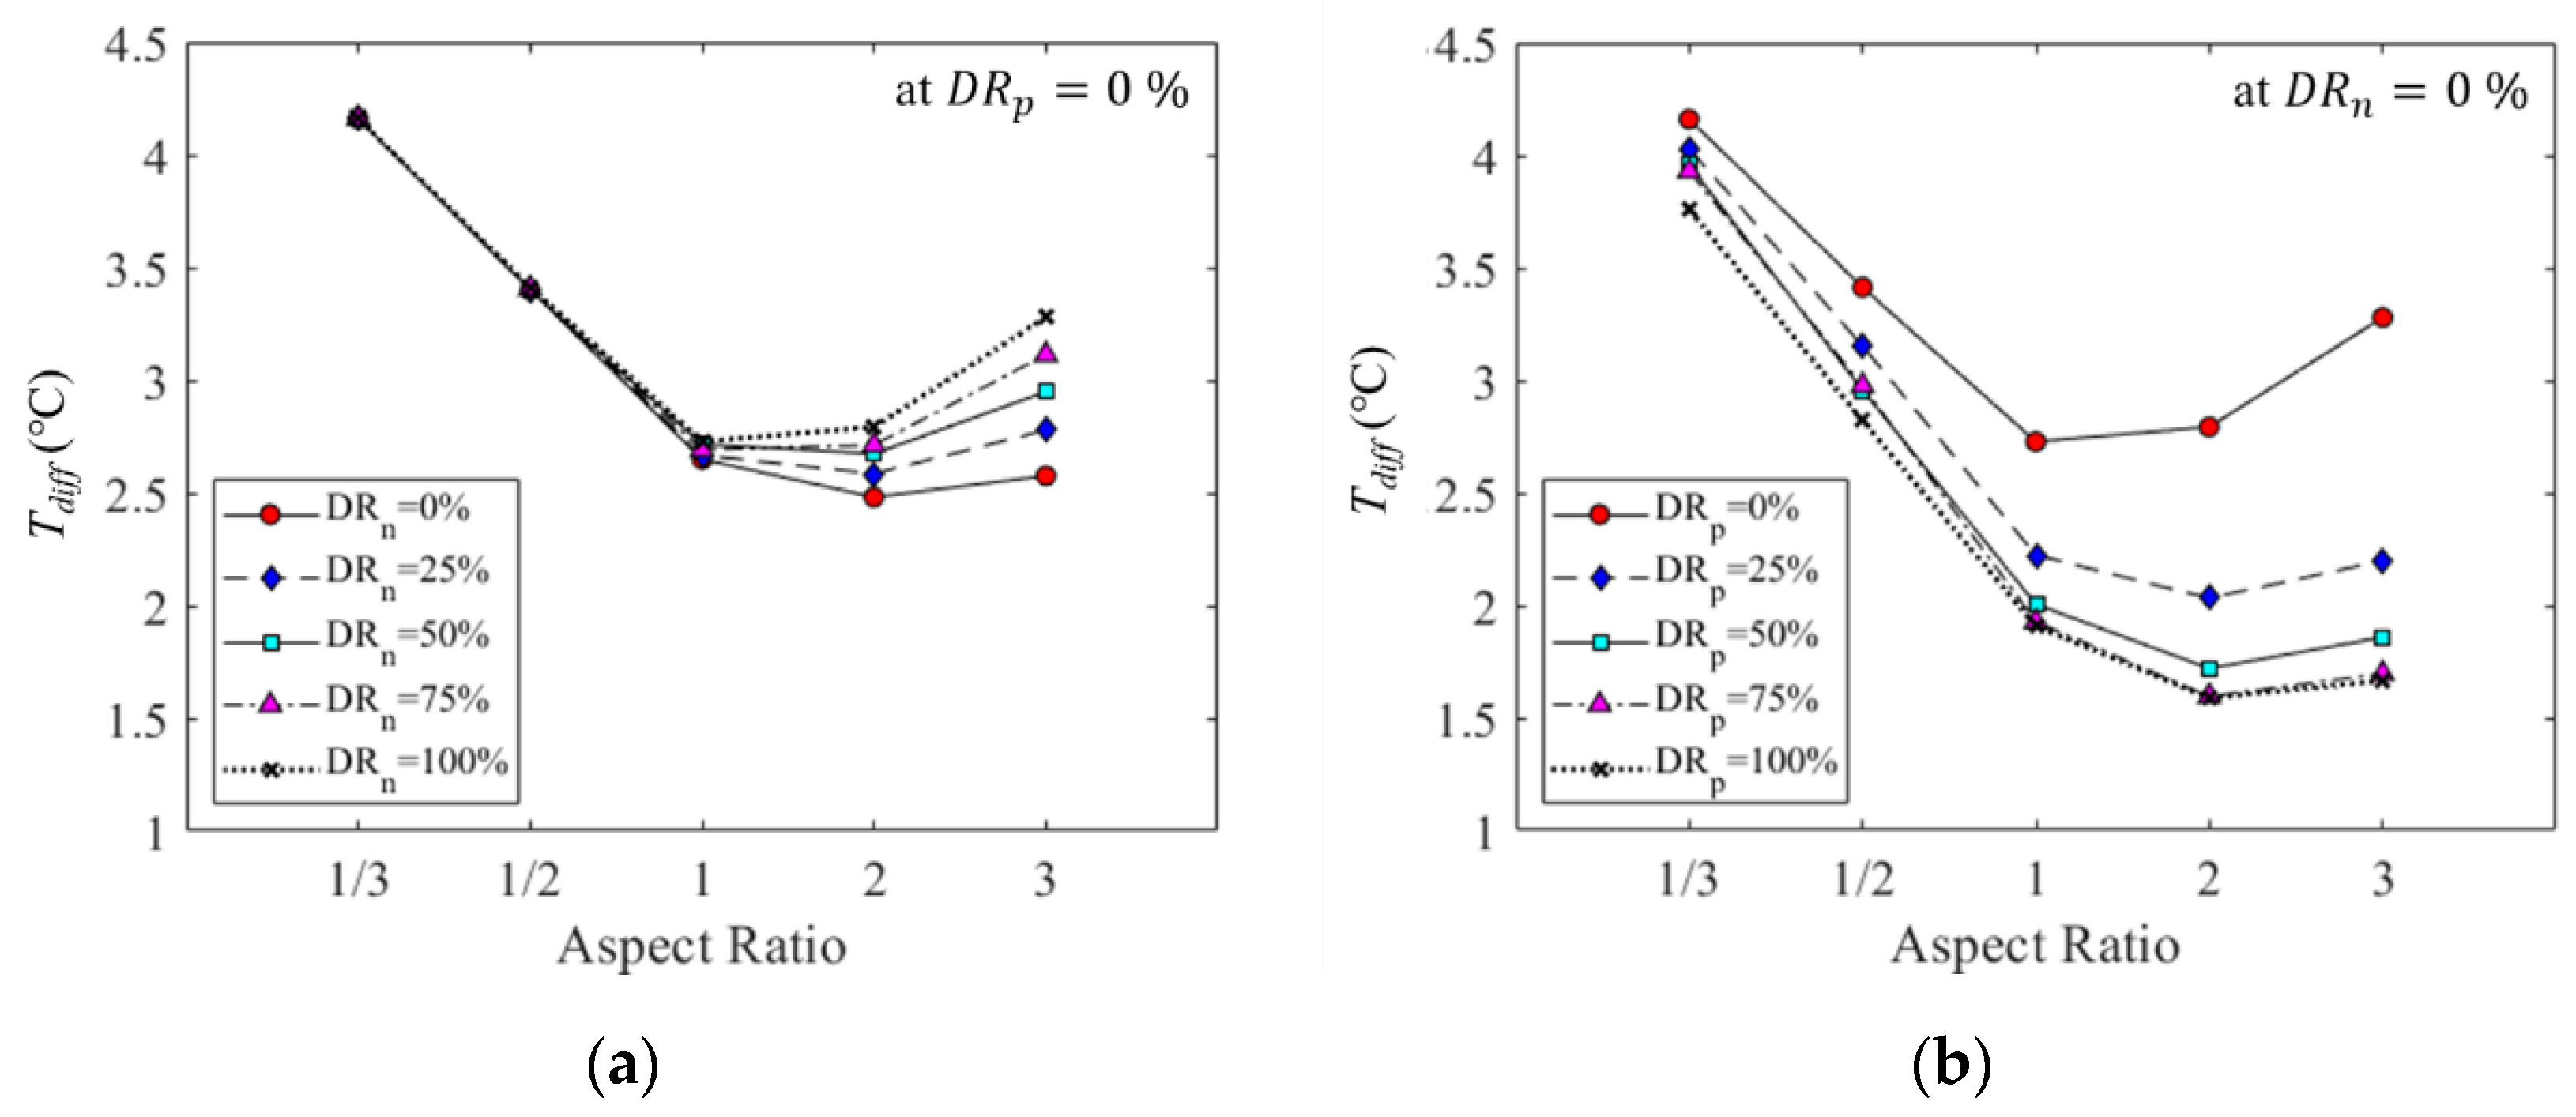
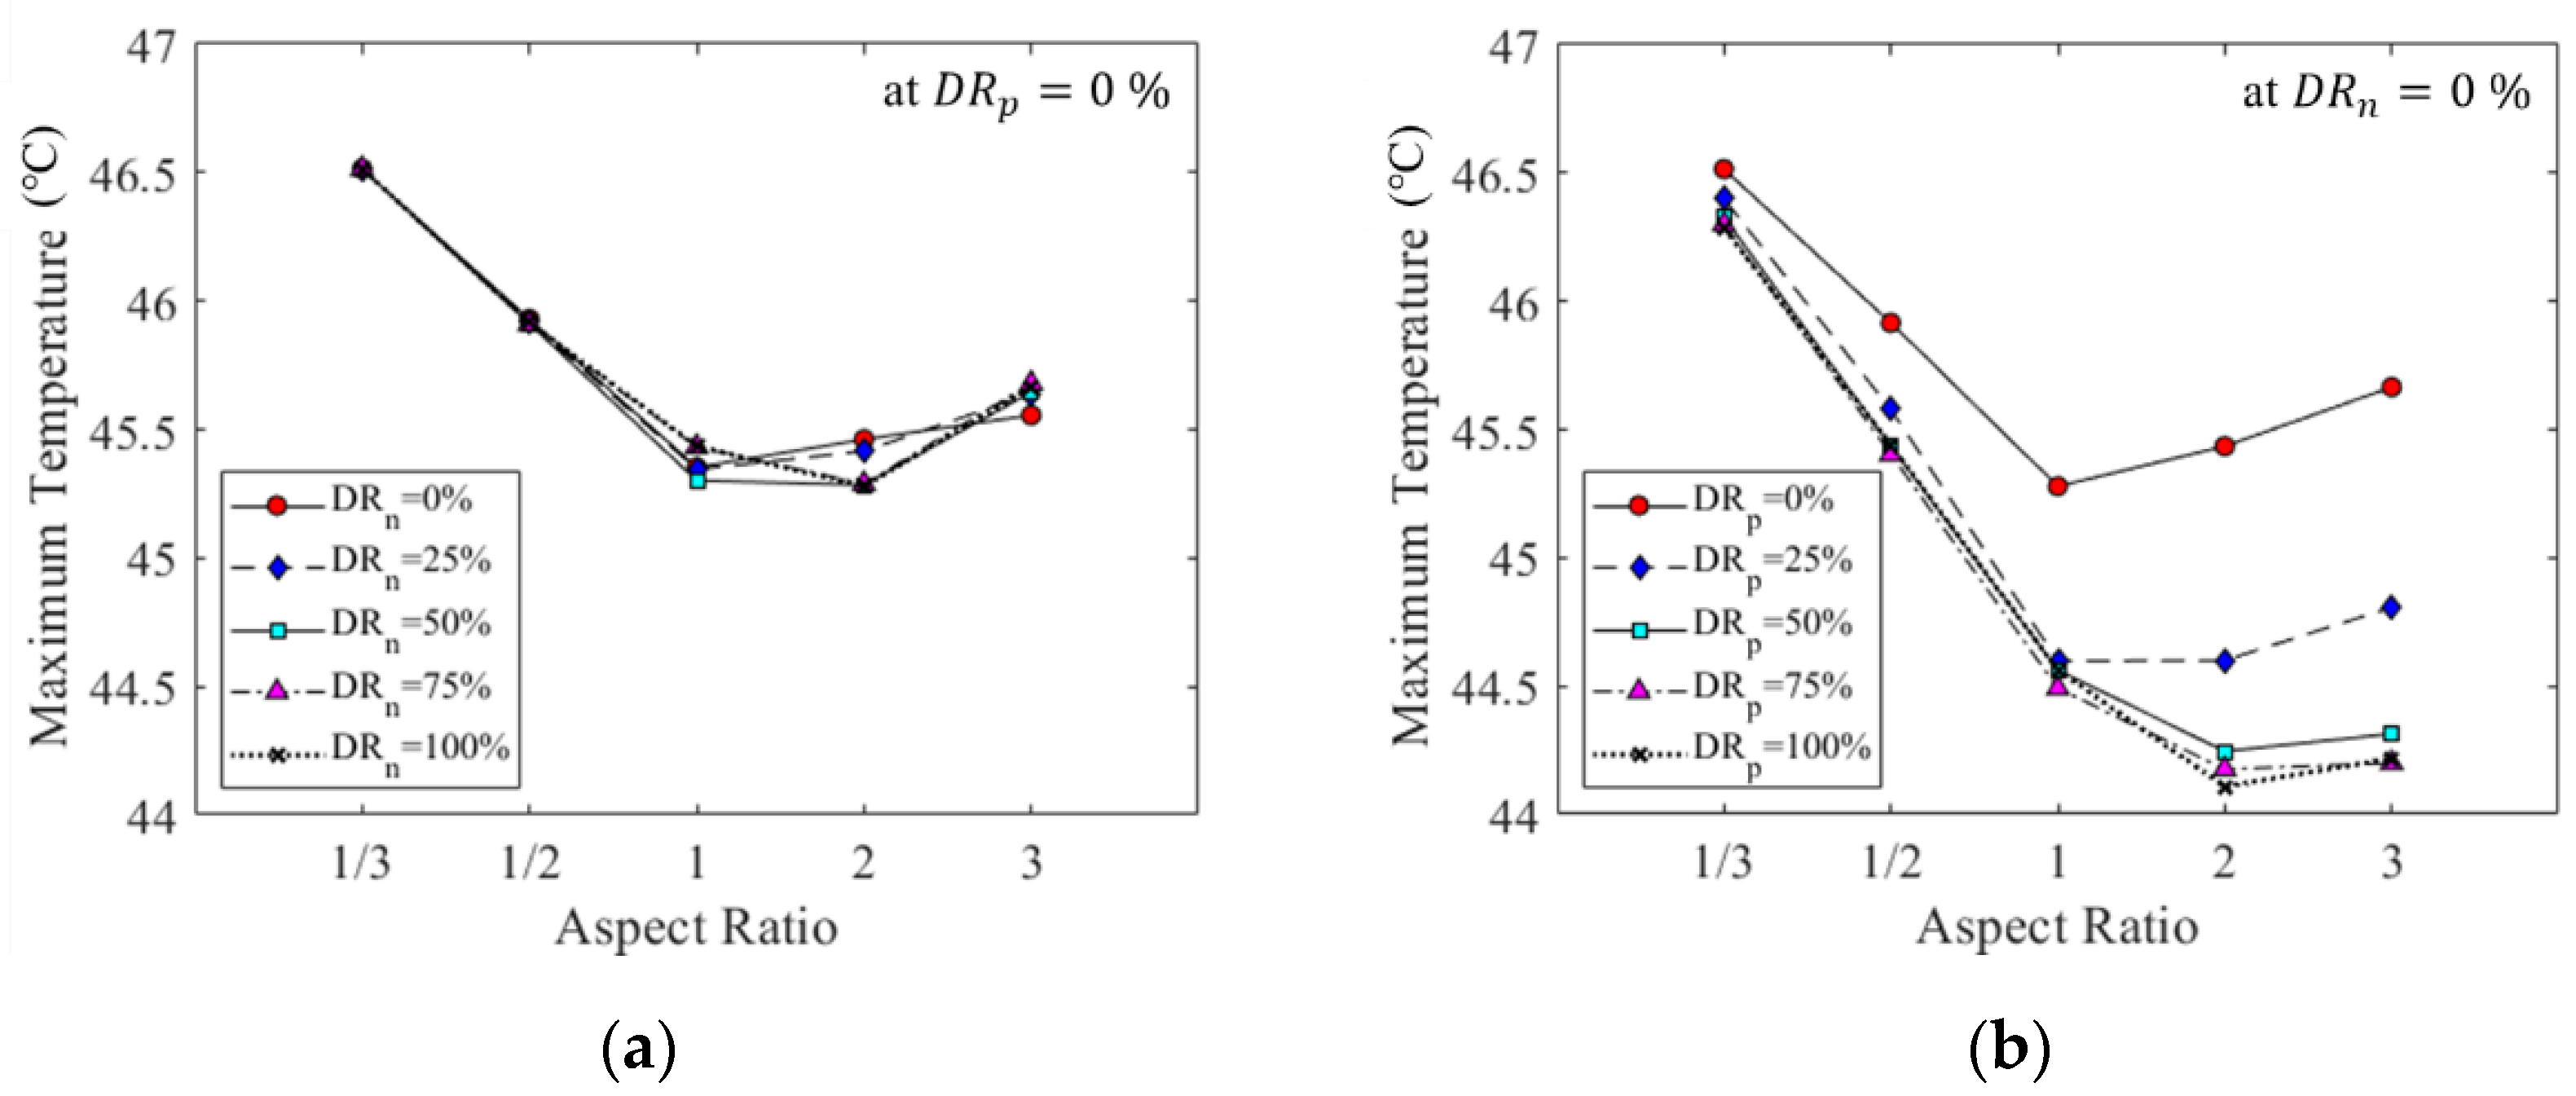
4.1. Effect of Cell Aspect Ratio and Tab Attachment Positions on the Temperature Distribution in LIB Cell

The effect of each design variable on the temperature distribution in the large-format LIB cell was analyzed. The distance between the two tabs was maximized during the analysis to avoid the concentration of the heat generation, which makes it difficult to analyze the effect of each design factor on the temperature distribution in the LIB cell. When analyzing the effect of the negative tab attachment position, the positive tab attachment position was fixed to 0%, and it was reversed while analyzing the effect of the positive electrode tab attachment position. The longest current pathway, which can compare the relative size of the internal resistance of the LIB cell, was defined to explain the change in the temperature distribution according to the design factors [16]. Since the resistance is proportional to the longest current pathway, the heat generation due to Joule heat increased when the longest current pathway increased. The longest current pathway was calculated as the sum of L and LW, as shown in Equations (24) and (25). Figure 4 shows the longest current pathway according to the cell aspect ratio and the tab attachment position.
The   longest   current   pathway = L W + L
L W = 0.5   W + ( 0.5   W d t ) ,   ( t   =   n ,   p )
Figure 5a shows the maximum temperature in a large-format LIB cell according to the cell aspect ratio and the negative tab attachment position when DRp is 0%. The maximum temperature according to the negative tab attachment position varied by 0.2 °C, which indicates that the effect of the negative tab attachment position on the maximum temperature is small. This implies that the change in the internal resistance according to the longest current pathway for the negative electrode tab is small. This is because the negative electrode tab consists of copper, which has a high electrical conductivity and heat capacity. However, the maximum temperature according to the cell aspect ratio varied over 1 °C, which indicates that the effect of the cell aspect ratio on the maximum temperature is large.
Figure 5b shows the maximum temperature in the large-format LIB cell according to the cell aspect ratio and the positive tab attachment position when DRn is 0%. The maximum temperature according to the positive tab attachment position varied over 1.9 °C. This demonstrates that the effect of the positive tab attachment position on the maximum temperature is large. When DRp is under 25%, the positive tab is close to the edge of the cell, and the maximum temperature is minimized when the cell aspect ratio is 1. When DRp is over 25%, the positive tab is close to the center of the cell, and the maximum temperature is minimized with a cell aspect ratio of 2. Figure 5 demonstrates that the cell aspect ratio and the positive tab attachment position affect the maximum temperature since they influence the longest current pathway. Therefore, the positive tab attachment position and cell aspect ratio have to be considered to decrease the maximum temperature during cell design.
Figure 6a shows the minimum temperature in the large-format LIB cell according to the cell aspect ratio and the negative tab attachment position when DRp is 0%. When DRn is under 50%, the negative tab is close to the cell edge, and the minimum temperature in the LIB cell increased with the rise in the cell aspect ratio. When DRn is 75%, the minimum temperature is maximized at a cell aspect of 2 and when DRn is 100%, the minimum temperature is maximized when the cell aspect is 1. Since L decreases and LW increases, the minimum temperature increases because the location that the minimum temperature occurred is closer to the negative tab.
Figure 6b shows the minimum temperature in the large-format LIB cell according to the cell aspect ratio and the positive tab attachment position when DRn is 0%. The minimum temperature according to the positive tab attachment position varied by 0.4 °C, which demonstrates that the effect of the positive tab attachment position on the minimum temperature is small. However, the cell aspect ratio where the maximum value of the minimum temperature appears is changed according to the DRp. When DRp is under 50%, the positive tab is close to the edge of the cell, and the minimum temperature is maximized when the cell aspect ratio is 1. When DRp is over 50%, the positive tab is close to the center of the cell, and the minimum temperature is maximized at the cell aspect ratio of 2. This implies that the minimum temperature increases as the longest current pathway for the positive tab decreases. This is because the distance between the minimum temperature location and the positive tab become closer. Figure 6 shows that the cell aspect ratio, the negative tab attachment position, and the positive tab attachment position can affect the minimum temperature by affecting the longest current pathway.
Figure 7a shows the Tdiff according to the cell aspect ratio and the negative tab attachment position when DRp is 0%. Tdiff increased up to 0.6 °C as the negative tab became closer to the center of the cell. This is because the minimum temperature inside the cell decreases as the negative tab becomes closer to the center of the cell.
Figure 7b shows the Tdiff according to the cell aspect ratio and the positive tab attachment position when DRn is 0%. Tdiff decreased up to 1.9 °C as the positive tab became closer to the center of the cell. This is because the maximum temperature decreases and the minimum temperature increases as the positive tab becomes closer to the center of the cell due to the decrease in the longest current pathway. Figure 7 demonstrates that the cell aspect ratio and the positive tab attachment position affect the temperature difference in the LIB cell since they have a large effect on the maximum temperature and minimum temperature. However, the negative tab attachment position has less effect on the temperature difference than other factors because it only affects the minimum temperature.

4.2. Analysis of Variance

ANOVA was used to analyze the effect of each design factor on Tdiff. A design factor is considered to be significant when the p-value is less than the significance level, and the influence of a design factor is considered to be greater when the percentage contribution of the factor is larger. Table 4 presents the ANOVA results. All three design factors are considered to be significant. The results demonstrate that the cell aspect ratio has the largest effect on Tdiff and the negative tab attachment position has the smallest effect on Tdiff. The cell aspect ratio has the largest effect on the longest current pathway by determining the L and W of the cell. This implies that the effect of the cell aspect ratio on the Tdiff is the largest because the heat generation by the internal resistance of the cell varies greatly depending on the cell aspect ratio. The positive tab attachment position on Tdiff is greater than the effect of the negative tab attachment position on Tdiff due to the fact that the positive tab is made from aluminum. Therefore, the maximum temperature change by the longest current pathway is significantly higher than the negative tab, which is made from copper. The negative tab attachment position did not affect the maximum temperature, but the negative tab attachment position effect on Tdiff significantly affected the minimum temperature of the cell.

5. Conclusions

This study analyzed the effect of the cell aspect ratio and the tab attachment positions on the temperature distribution for large-format LIBs. The temperature distribution of the 45-Ah LFP/graphite cell was calculated by using the 3D electrochemical–thermal coupled model. The effect of the cell aspect ratio and the tab attachment positions on the maximum temperature, minimum temperature, and the difference between the maximum and minimum temperature (Tdiff) was analyzed by using the design of experiments. The results reveal that the cell aspect ratio has the greatest effect on the maximum temperature, the minimum temperature, and Tdiff. This is because the cell aspect ratio affects the length and the width of the LIB cell; thus, resulting in a change in the longest current pathway. The maximum temperature according to the positive tab attachment position increased in proportion to the longest current pathway due to the small electrical conductivity and the heat capacity of aluminum, which the positive tab is made. The minimum temperature of the cell increased as the longest current pathway decreased because of the decreased distance between the positive tab attachment position and the location at which the minimum temperature occurred. Since the longest current pathway according to the positive tab attachment position decreased, the maximum temperature decreased and the minimum temperature increased, which resulted in a decrease in Tdiff. The negative tab attachment position had no effect on the maximum temperature due to the large electrical conductivity and the heat capacity of copper, which the negative tab is made. Since the longest current pathway increased according to the negative tab attachment position, the minimum temperature increased, resulting in a reduction of Tdiff. This is because Tdiff decreases when the maximum temperature decreases and the minimum temperature increases. ANOVA was performed to determine the significance of each design variable. By performing ANOVA, all three design factors have a significant effect on Tdiff, in decreasing order: cell aspect ratio, positive tab attachment position, and negative tab attachment position.

Author Contributions

Conceptualization, J.-J.L.; formal analysis, J.-J.L.; software, J.-J.L.; supervision, C.-W.K.; validation, J.-J.L.; visualization, J.-J.L.; writing—original draft, J.-J.L.; writing—review and editing, J.-J.L., J.-S.K., H.-K.C. and D.-C.L. All authors have read and agreed to the published version of the manuscript.

Funding

This work was supported by the National Research Foundation of Korea (NRF) grant funded by the Korea government (MSIT) [2019R1A2C1090228], by the Human Resources Program in Energy Technology of the Korea Institute of Energy Technology Evaluation and Planning(KETEP) grant funded by the Ministry of Trade, Industry and Energy(MOTIE) of the Republic of Korea (Grant no. 20194010201790), and by the Technology Innovation Program (20004627) funded By the Ministry of Trade, Industry & Energy(MOTIE, Korea).

Conflicts of Interest

The authors declare no conflict of interest.

Nomenclature

a ion number
α c charge coefficient
c Li concentration (mol/m3)
D diffusivity (m2/s)
D R n distance ratio of the total distance to the negative tab location
D R p distance ratio of the total distance to the positive tab location
d n distance between the right edge of the negative tab and the nearest edge of the LIB cell
d p distance between the right edge of the positive tab and the nearest edge of the LIB cell
f ± average molar activity coefficient
FFaraday’s constant, 96487 (C/mol)
i current density (A/m2)
j n local current density (A/m2)
kelectronic conductivity (S/m)
LLength of the LIB cell (mm)
N 0 Li+ flux (mol/m2s1)
R gas constant, 8.314 (J/(mol K))
r radial distance from the center of the electrode active particle (μm)
T absolute temperature (K)
t thickness (m)
t + transport number of Li+
WWidth of the LIB cell (mm)
ε porosity
η local surface overpotential (V)
ϕ electrical potential (V)
Subscripts and superscripts
1solid phase
2liquid phase
appapplied
effeffective value
elelectrolyte
initinitial value
nnegative electrode
ppositive electrode
sseparator

References

  1. Scrosati, B.; Garche, J. Lithium batteries: Status, prospects and future. J. Power Sources 2010, 195, 2419–2430. [Google Scholar] [CrossRef]
  2. Curry, C. Lithium-Ion Battery Costs and Market, Bloomberg New Energy Finance 2017. Available online: https://data.bloomberglp.com/bnef/sites/14/2017/07/BNEF-Lithium-ion-battery-costs-and-market.pdf (accessed on 17 December 2020).
  3. Pillot, C. Lithium Ion Battery Raw Material Supply & Demand 2016–2025. Avicenne Energy. Available online: http://cii-resource.com/cet/AABE-03-17/Presentations/BRMT/Pillot_Christophe.pdf (accessed on 17 December 2020).
  4. EEI, Electric Vehicle Sales: Facts & Figures. Available online: https://www.eei.org/issuesandpolicy/electrictransportation/Documents/FINAL_EV_Sales_Update_April2019.pdf (accessed on 17 December 2020).
  5. Veth, C.; Dragicevic, D.; Merten, C. Thermal characterizations of a large-format lithium ion cell focused on high current discharges. J. Power Sources 2014, 267, 760–769. [Google Scholar] [CrossRef]
  6. Song, W.; Chen, M.; Bai, F.; Lin, S.; Chen, Y.; Feng, Z. Non-uniform effect on the thermal/aging performance of Lithium-ion pouch battery. Appl. Therm. Eng. 2018, 128, 1165–1174. [Google Scholar] [CrossRef]
  7. Kim, H.-K.; Kim, C.-J.; Kim, C.-W.; Lee, K.-J. Numerical analysis of accelerated degradation in large lithium-ion batteries. Comput. Chem. Eng. 2018, 112, 82–91. [Google Scholar] [CrossRef]
  8. Doyle, M.; Fuller, T.F.; Newman, J.S. Modeling of Galvanostatic Charge and Discharge of the Lithium/Polymer/Insertion Cell. J. Electrochem. Soc. 1993, 140, 1526–1533. [Google Scholar] [CrossRef]
  9. Rao, L.; Newman, J. Heat-Generation Rate and General Energy Balance for Insertion Battery Systems. J. Electrochem. Soc. 1997, 144, 2697–2704. [Google Scholar] [CrossRef]
  10. Gerver, R.E. 3D Thermal-Electrochemical Lithium-Ion Battery Computational Modeling. Master’s Thesis, The University of Texas at Austin, Austin, TX, USA, 2009. [Google Scholar]
  11. Kim, G.-H.; Smith, K.; Lee, K.-J.; Santhanagopalan, S.; Pesaran, A.A. Multi-Domain Modeling of Lithium-Ion Batteries Encompassing Multi-Physics in Varied Length Scales. J. Electrochem. Soc. 2011, 158, A955–A969. [Google Scholar] [CrossRef]
  12. Du, S.; Jia, M.; Cheng, Y.; Tang, Y.; Zhang, H.; Ai, L.; Zhang, K.; Lai, Y. Study on the thermal behaviors of power lithium iron phosphate (LFP) aluminum-laminated battery with different tab configurations. Int. J. Therm. Sci. 2015, 89, 327–336. [Google Scholar] [CrossRef]
  13. Kosch, S.; Rheinfeld, A.; Erhard, S.V.; Jossen, A. An extended polarization model to study the influence of current collector geometry of large-format lithium-ion pouch cells. J. Power Sources 2017, 342, 666–676. [Google Scholar] [CrossRef]
  14. Lee, D.-C.; Lee, J.-J.; Kim, J.-S.; Cho, S.; Kim, C.-W. Thermal behaviors analysis of 55 Ah large-format lithium-ion pouch cells with different cell aspect ratios, tab locations, and C-rates. Appl. Therm. Eng. 2020, 175, 115422. [Google Scholar] [CrossRef]
  15. Zhao, W.; Luo, G.; Wang, C.-Y. Effect of tab design on large-format Li-ion cell performance. J. Power Sources 2014, 257, 70–79. [Google Scholar] [CrossRef]
  16. Samba, A.; Omar, N.; Gualous, H.; Capron, O.; Bossche, P.V.D.; Van Mierlo, J. Impact of Tab Location on Large Format Lithium-Ion Pouch Cell Based on Fully Coupled Tree-Dimensional Electrochemical-Thermal Modeling. Electrochim. Acta 2014, 147, 319–329. [Google Scholar] [CrossRef]
  17. Lee, J.-J.; Kim, J.-S.; Lee, D.-C.; Chang, H.; Kim, C.-W. Design optimization of tab attachment positions and cell aspect ratio to minimize temperature difference in 45-Ah LFP large-format Lithium-ion pouch cells. Appl. Therm. Eng. 2020, 182, 116143. [Google Scholar] [CrossRef]
  18. Panchal, S.; Mathewson, S.; Fraser, R.; Culham, R.; Fowler, M. Measurement of Temperature Gradient (dT/dy) and Temperature Response (dT/dt) of a Prismatic Lithium-Ion Pouch Cell with LiFePO4 Cathode Material. SAE Tech. Pap. Ser. 2017. [Google Scholar] [CrossRef]
  19. COMSOL Multiphysics 3.3. Available online: http://www.comsol.com (accessed on 11 January 2012).
  20. Montgomery, D.C. Design and Analysis of Experiments; John Wiley & Sons, Inc.: Hoboken, NJ, USA, 2006. [Google Scholar]
Figure 1. Descriptions of LIB model: (a) Schematic of the lithium-ion battery unit cell and (b) the set up for the thermographic experiment [18].
Energies 14 00116 g001
Figure 2. Comparison of the experimental [16] and electrochemical–thermal model results for the different discharge currents: (a) discharge voltage; (b) maximum temperature.
Energies 14 00116 g002
Figure 3. Description of (a) dn and dp, and (b) the attached position and the attachable range.
Energies 14 00116 g003
Figure 4. Longest current pathway: (a) description of the longest current pathway and (b) the longest current pathway with different cell aspect ratios and DRt.
Energies 14 00116 g004
Figure 5. Maximum temperature: (a) aspect ratio and DRn, and (b) aspect ratio and DRp.
Energies 14 00116 g005
Figure 6. Minimum temperature: (a) aspect ratio and DRn, and (b) aspect ratio and DRp.
Energies 14 00116 g006
Figure 7. Temperature difference: (a) aspect ratio and DRn, and (b) aspect ratio and DRp.
Energies 14 00116 g007
Table 1. Dimensions and nominal data for a 45-Ah LFP/graphite LIBs unit cell [16].
NameValue
Aspect ratio0.65
Area (mm2)34,500
d p (mm)70
d n (mm)30
Positive tab width (mm)40
Negative tab width (mm)50
Tab length (mm)75
Nominal capacity (Ah)0.58
Nominal voltage (V)3.2
Cut-off voltage (V)2
Table 2. Design factors and their lower and upper bounds.
Design FactorsCell Aspect Ratio D R n ( % ) D R p ( % )
Lower bound1/300
Upper bound3100100
Table 3. Design factors and their levels.
Design FactorsCell Aspect Ratio D R n   ( % ) D R p   ( % )
Level 11/300
Level 21/22525
Level 315050
Level 427575
Level 53100100
Table 4. ANOVA table for the design factors.
Design FactorsSum of SquaresDOFMean Square% ContributionF-Valuep-Value
Cell Aspect Ratio 91.74.022.9386.84534.92 5.6 × 10 72   << 0.001
D R n (%)0.64.00.150.573.5 9.9 × 10 3
D R p (%)13.34.03.3312.5977.58 2.2 × 10 31   << 0.001
Error4.8112.00.040.16--
Significance level: 0.05 (95%).
Publisher’s Note: MDPI stays neutral with regard to jurisdictional claims in published maps and institutional affiliations.

