Simulation of Fuzzy Control of Oxygen Flow in PEM Fuel Cells


Abstract
1. Introduction
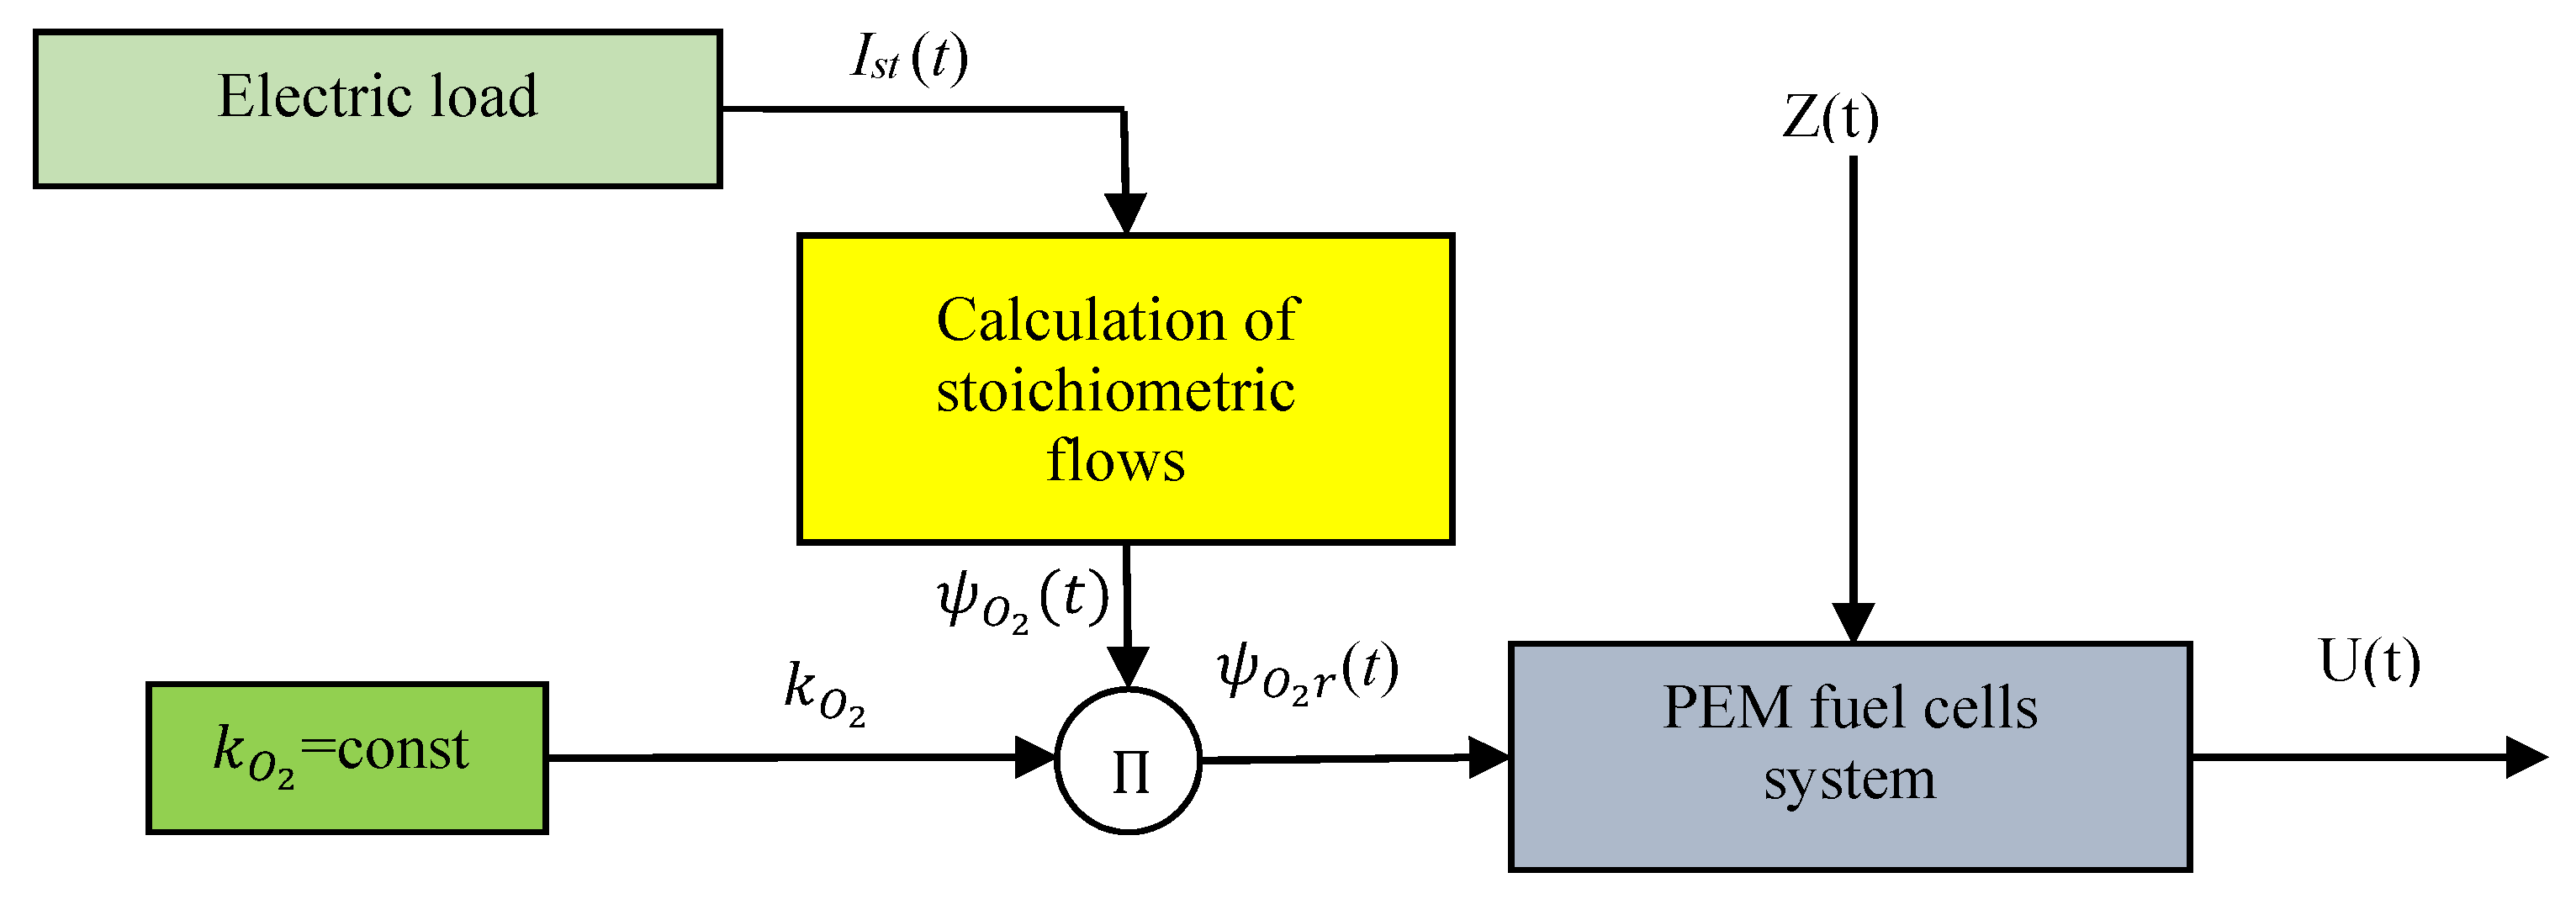
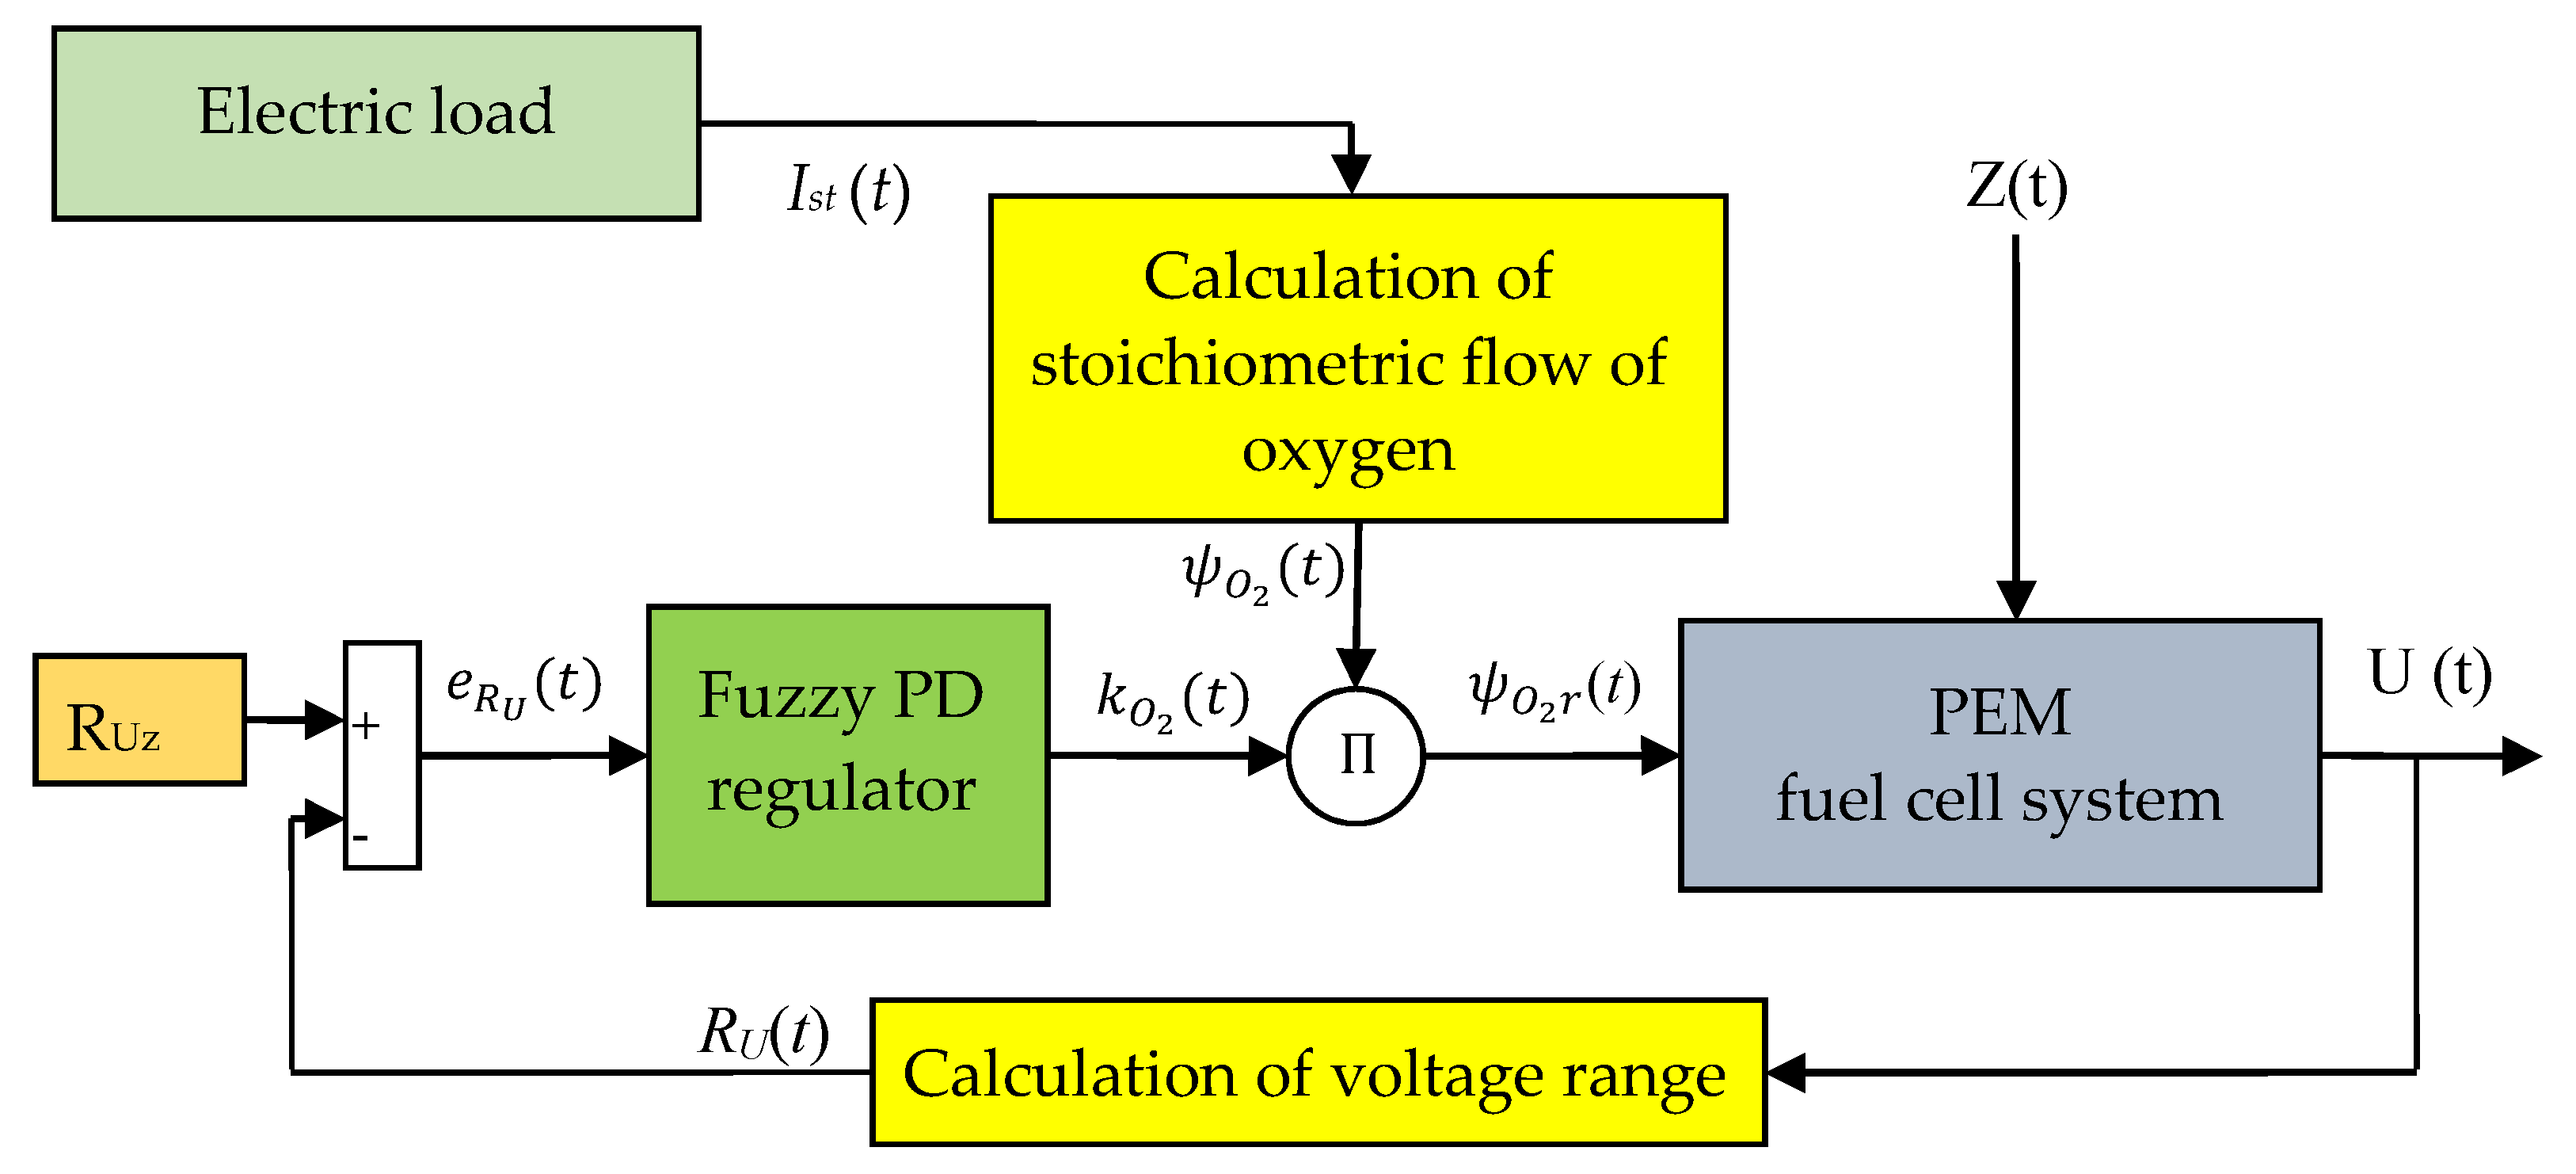
2. Oxygen Flow Control in PEM Fuel Cell System
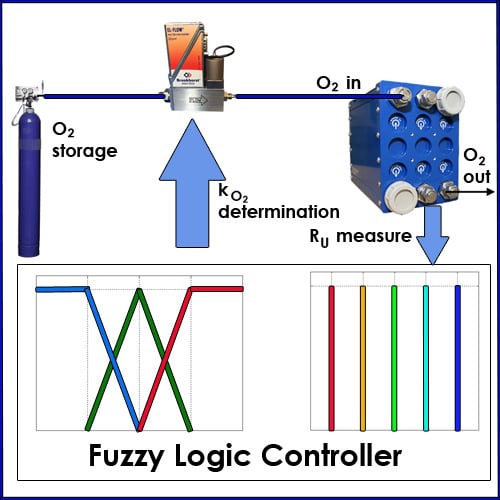
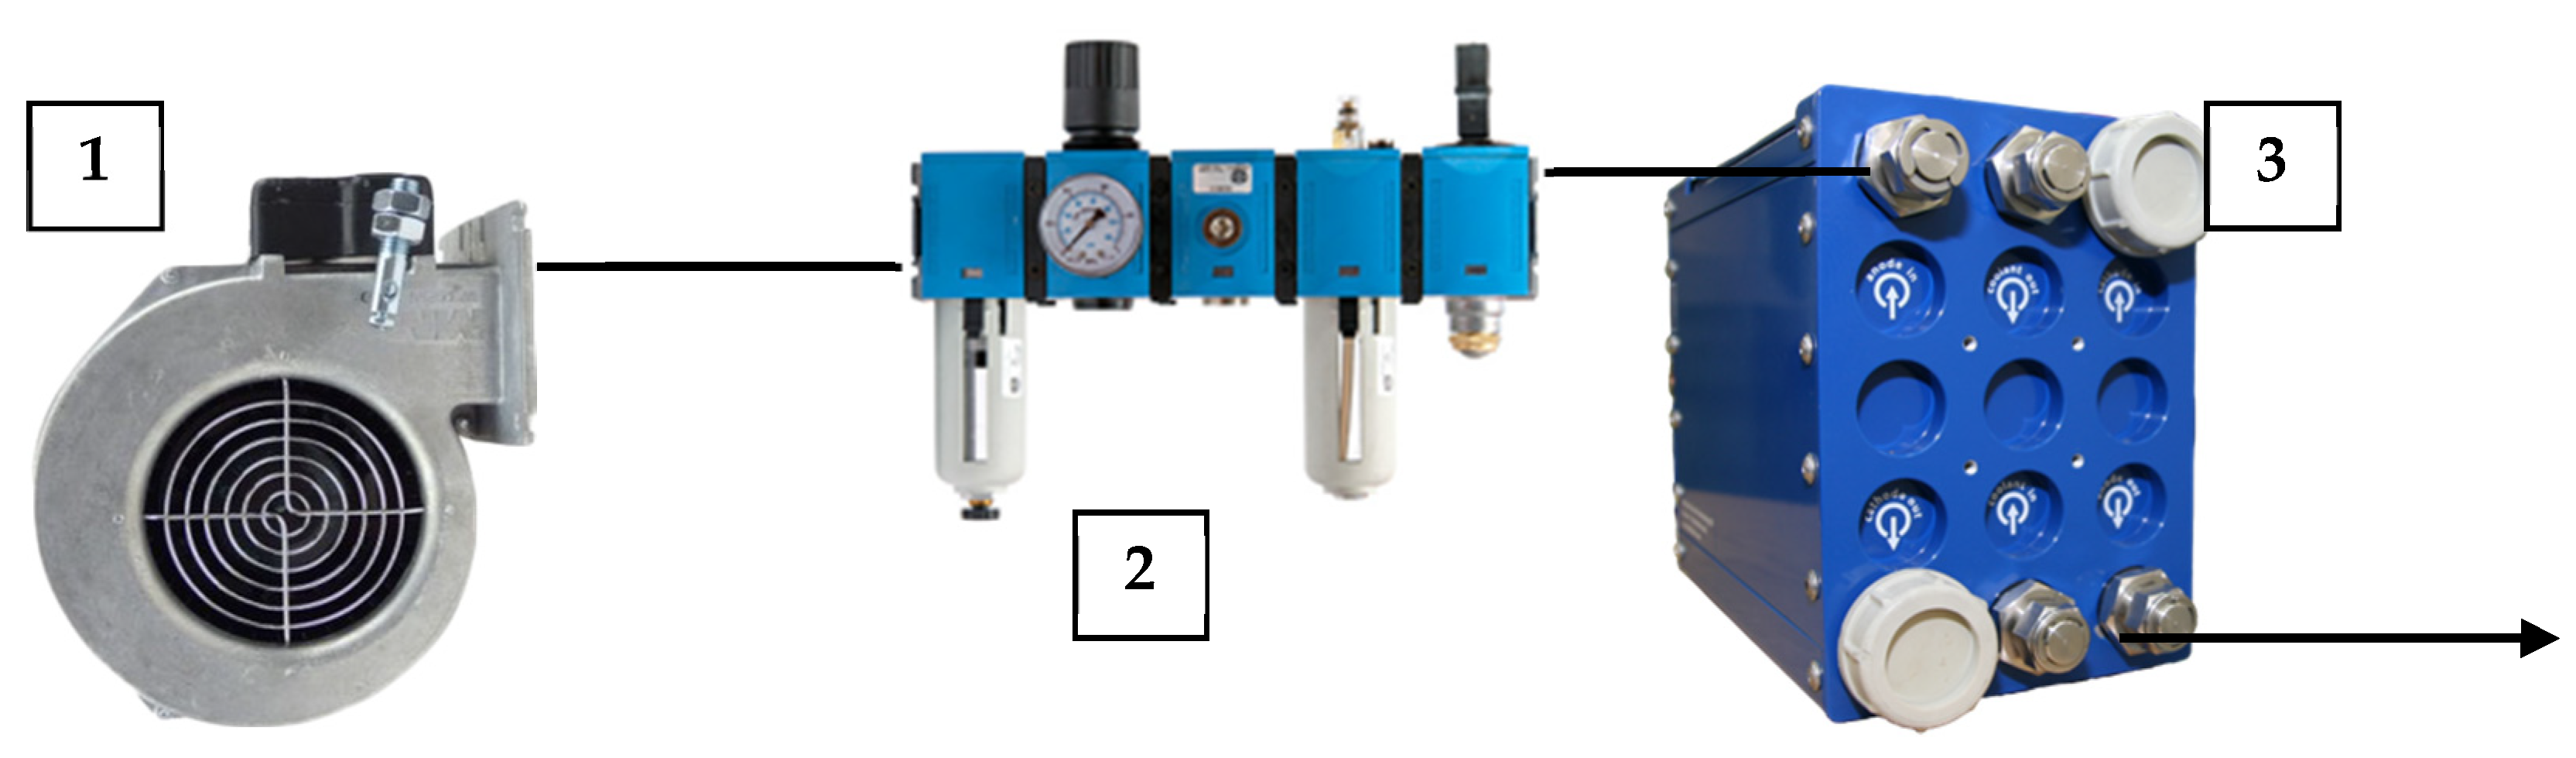
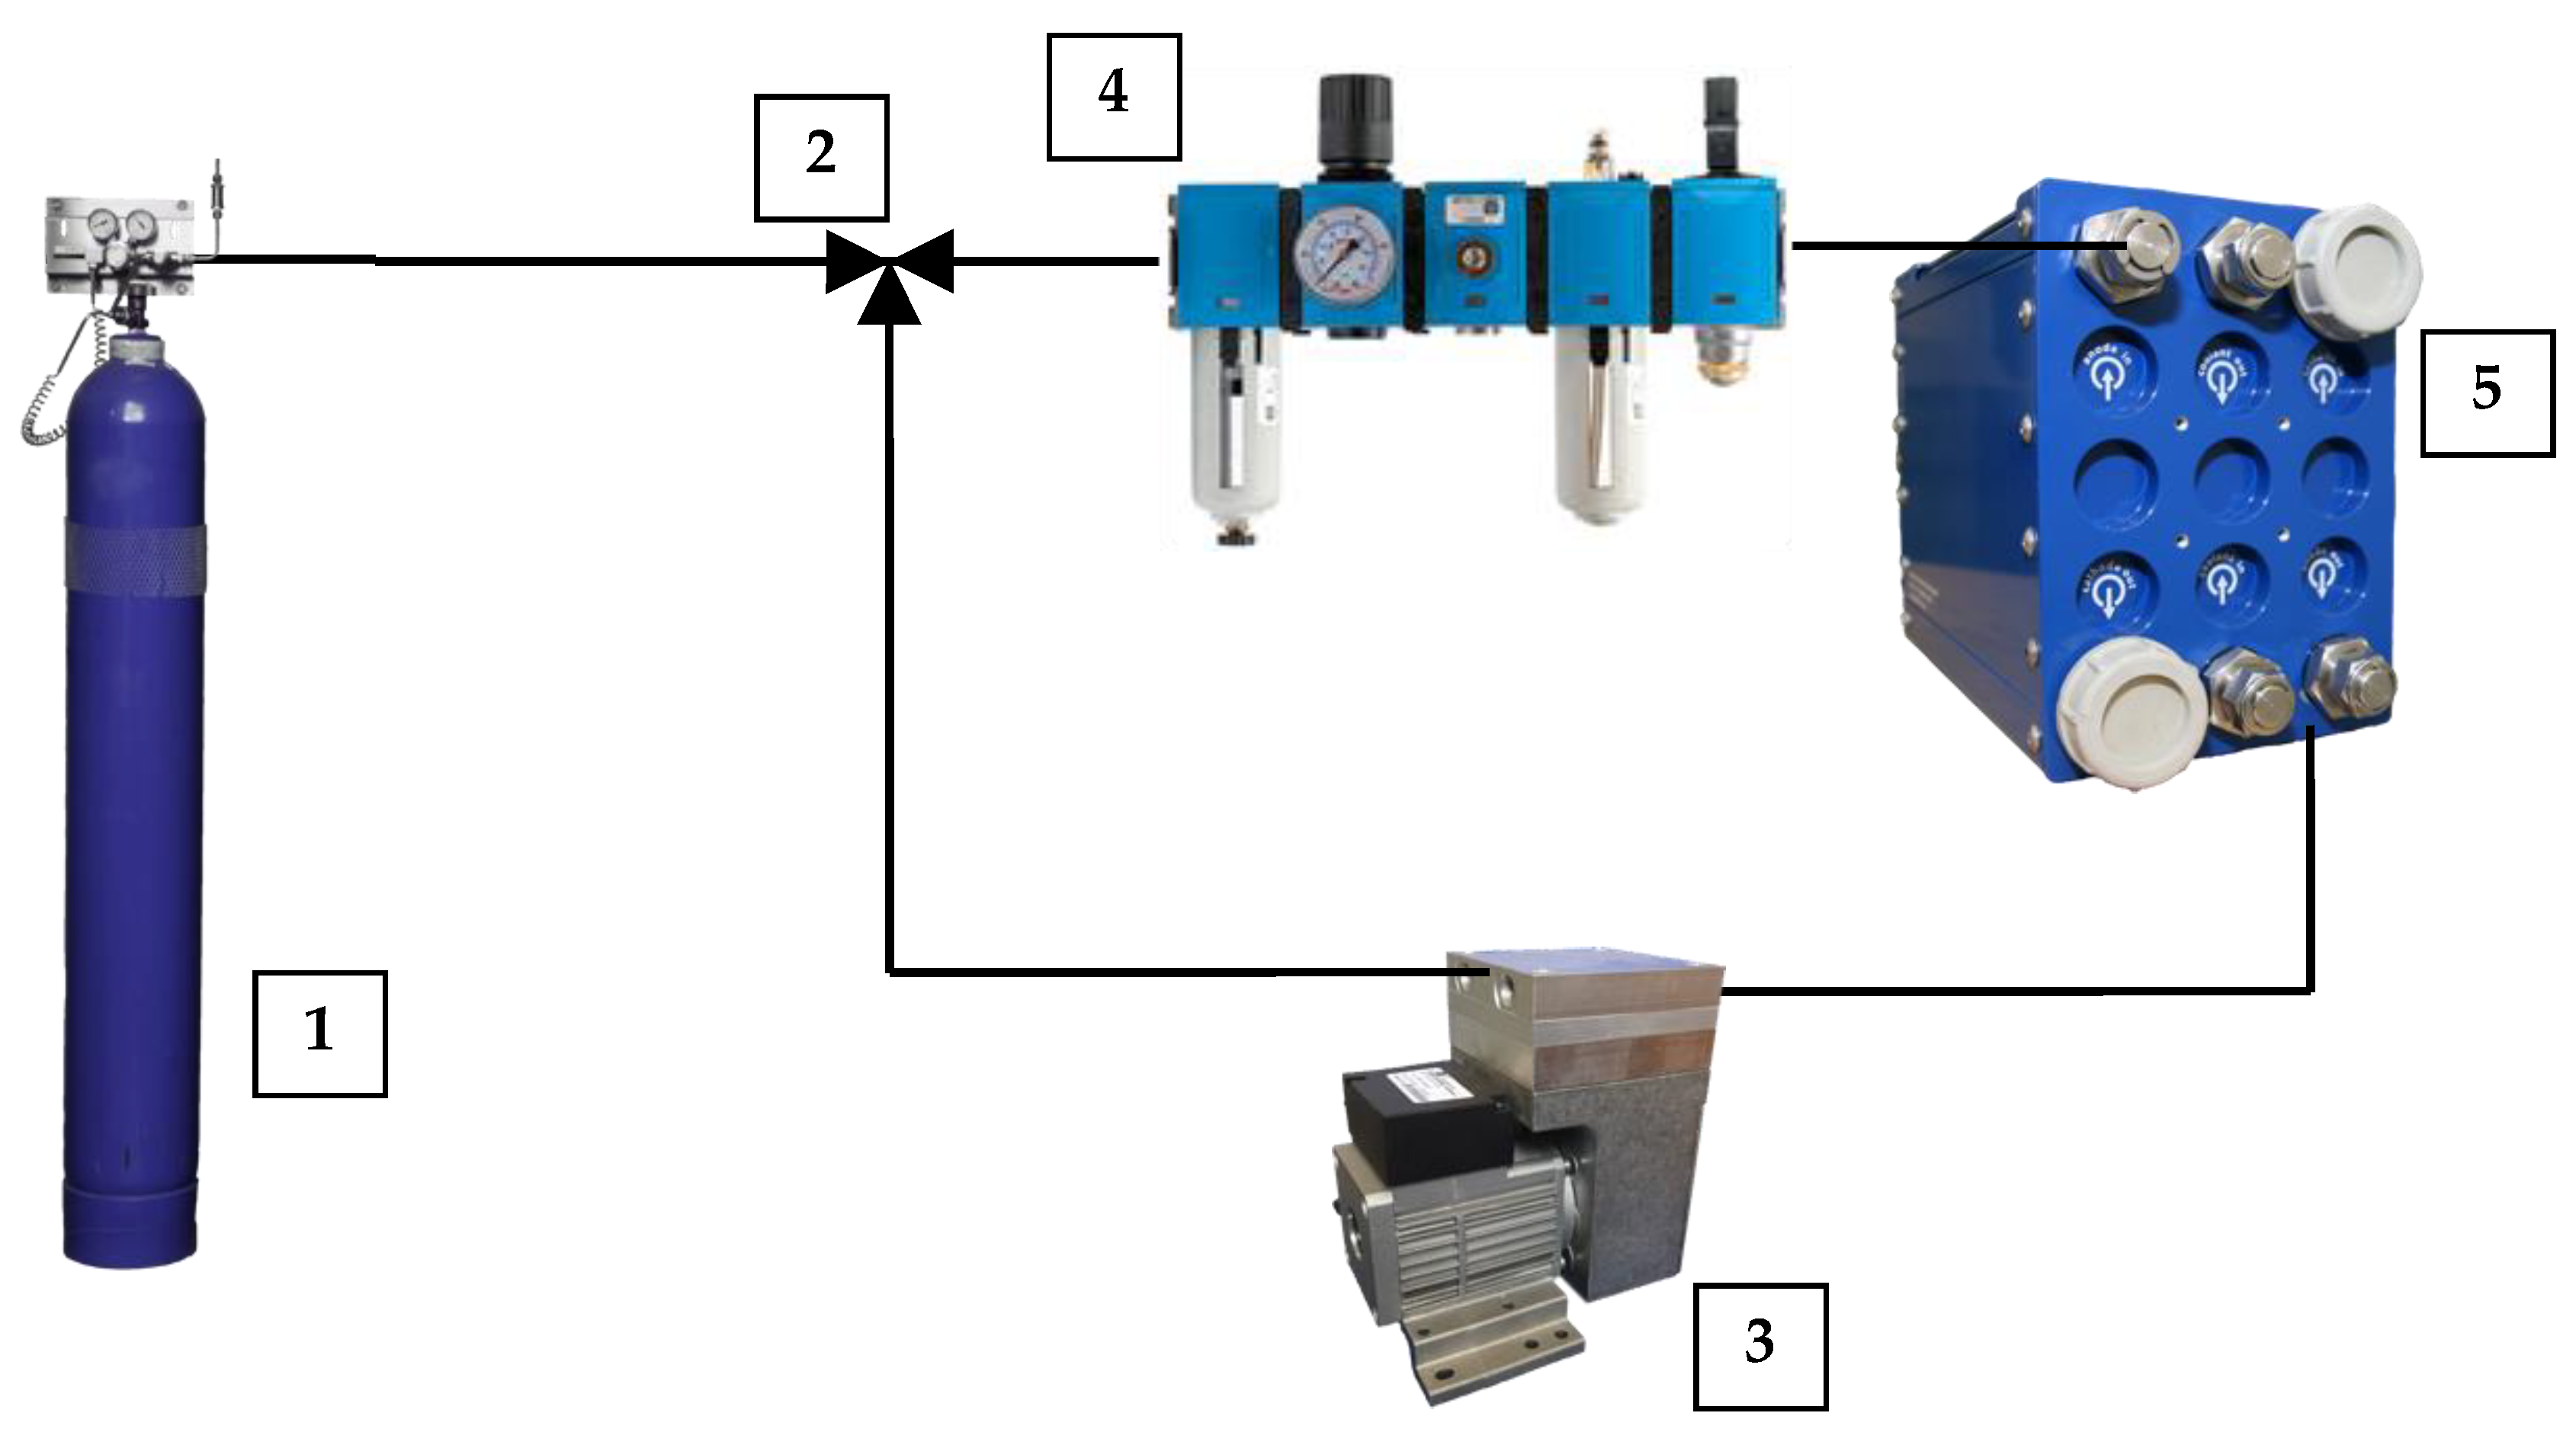
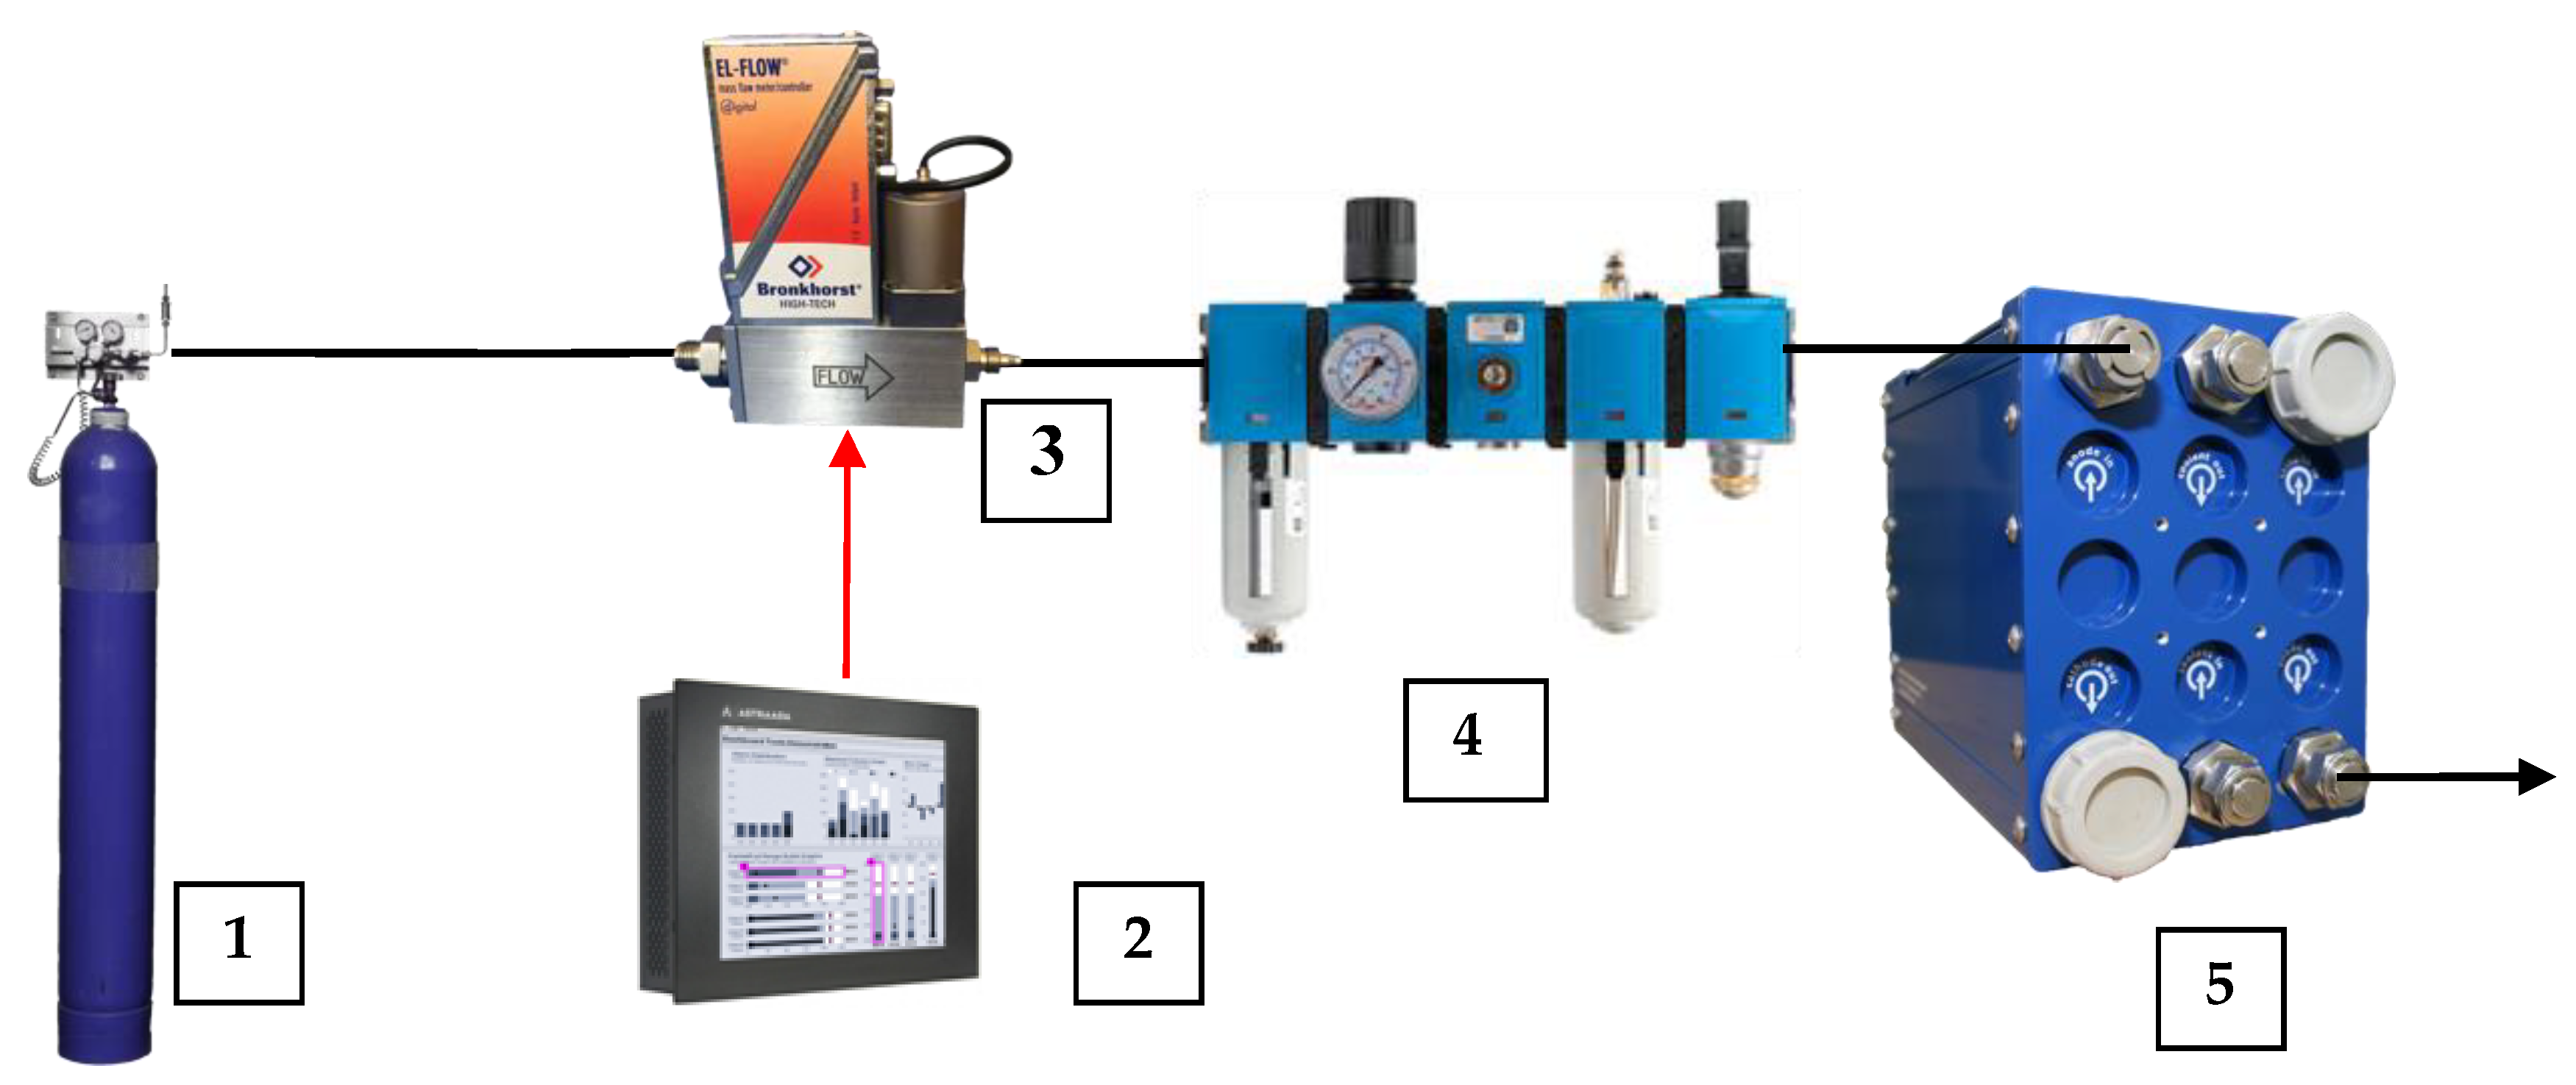
2.1. Oxydizer Subsystem Configuration
- (1)
- State 1: Starting the fuel cell system. The system performs the actions necessary to bring the stack to nominal operating conditions. At this stage, the anode and cathode are flushed with an inert gas (nitrogen), flushed with reaction gases (hydrogen and oxygen), and the stack is heated to the operating temperature.
- (2)
- State 2: Idle operation. Nominal conditions prevail in the stack with an unloaded stack.
- (3)
- State 3: Stack operation under load. The stack delivers electric energy to the load.
- (4)
- State 4: Stopping the fuel cell system. Actions necessary to stop the fuel cell system are applied, i.e., disconnection from the load, closing the supply of reaction gases, and flushing the cathode and anode with inert gas.
2.2. Control Assumptions
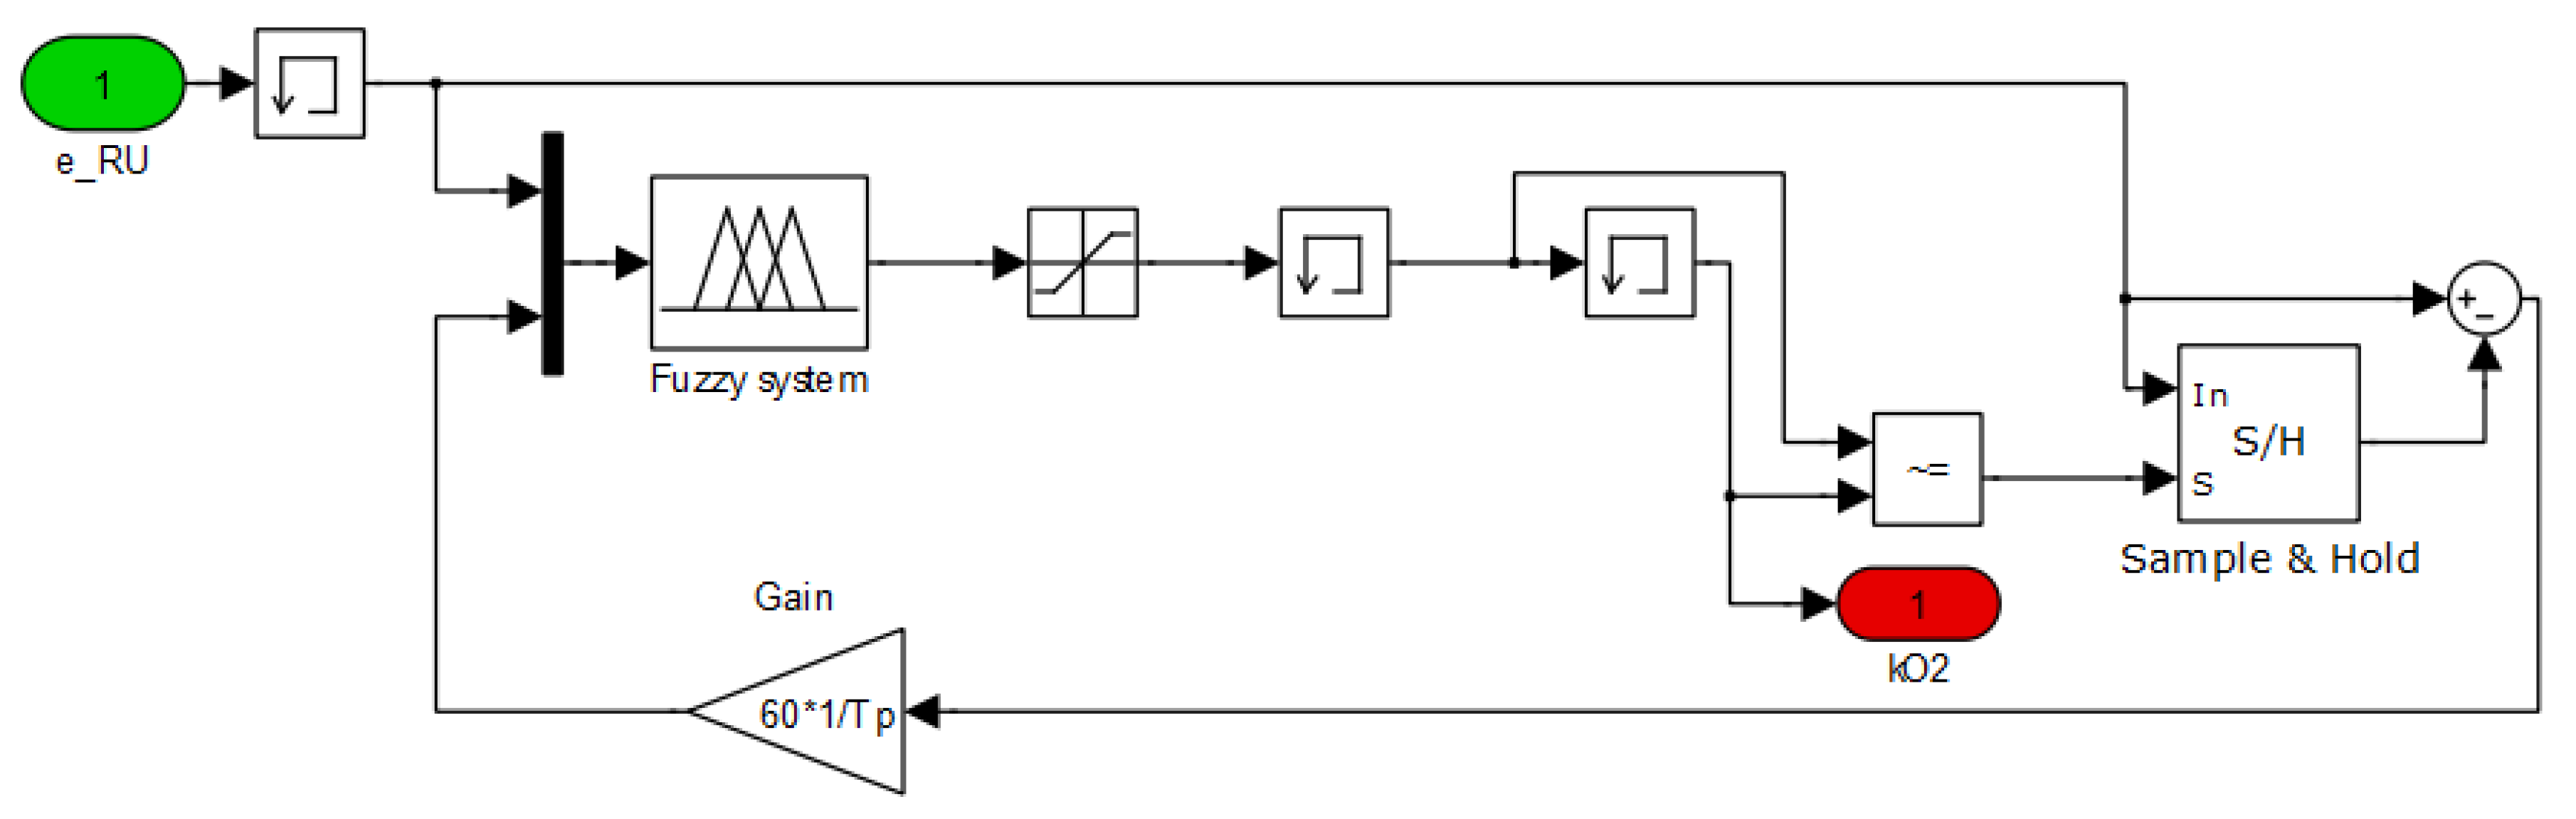
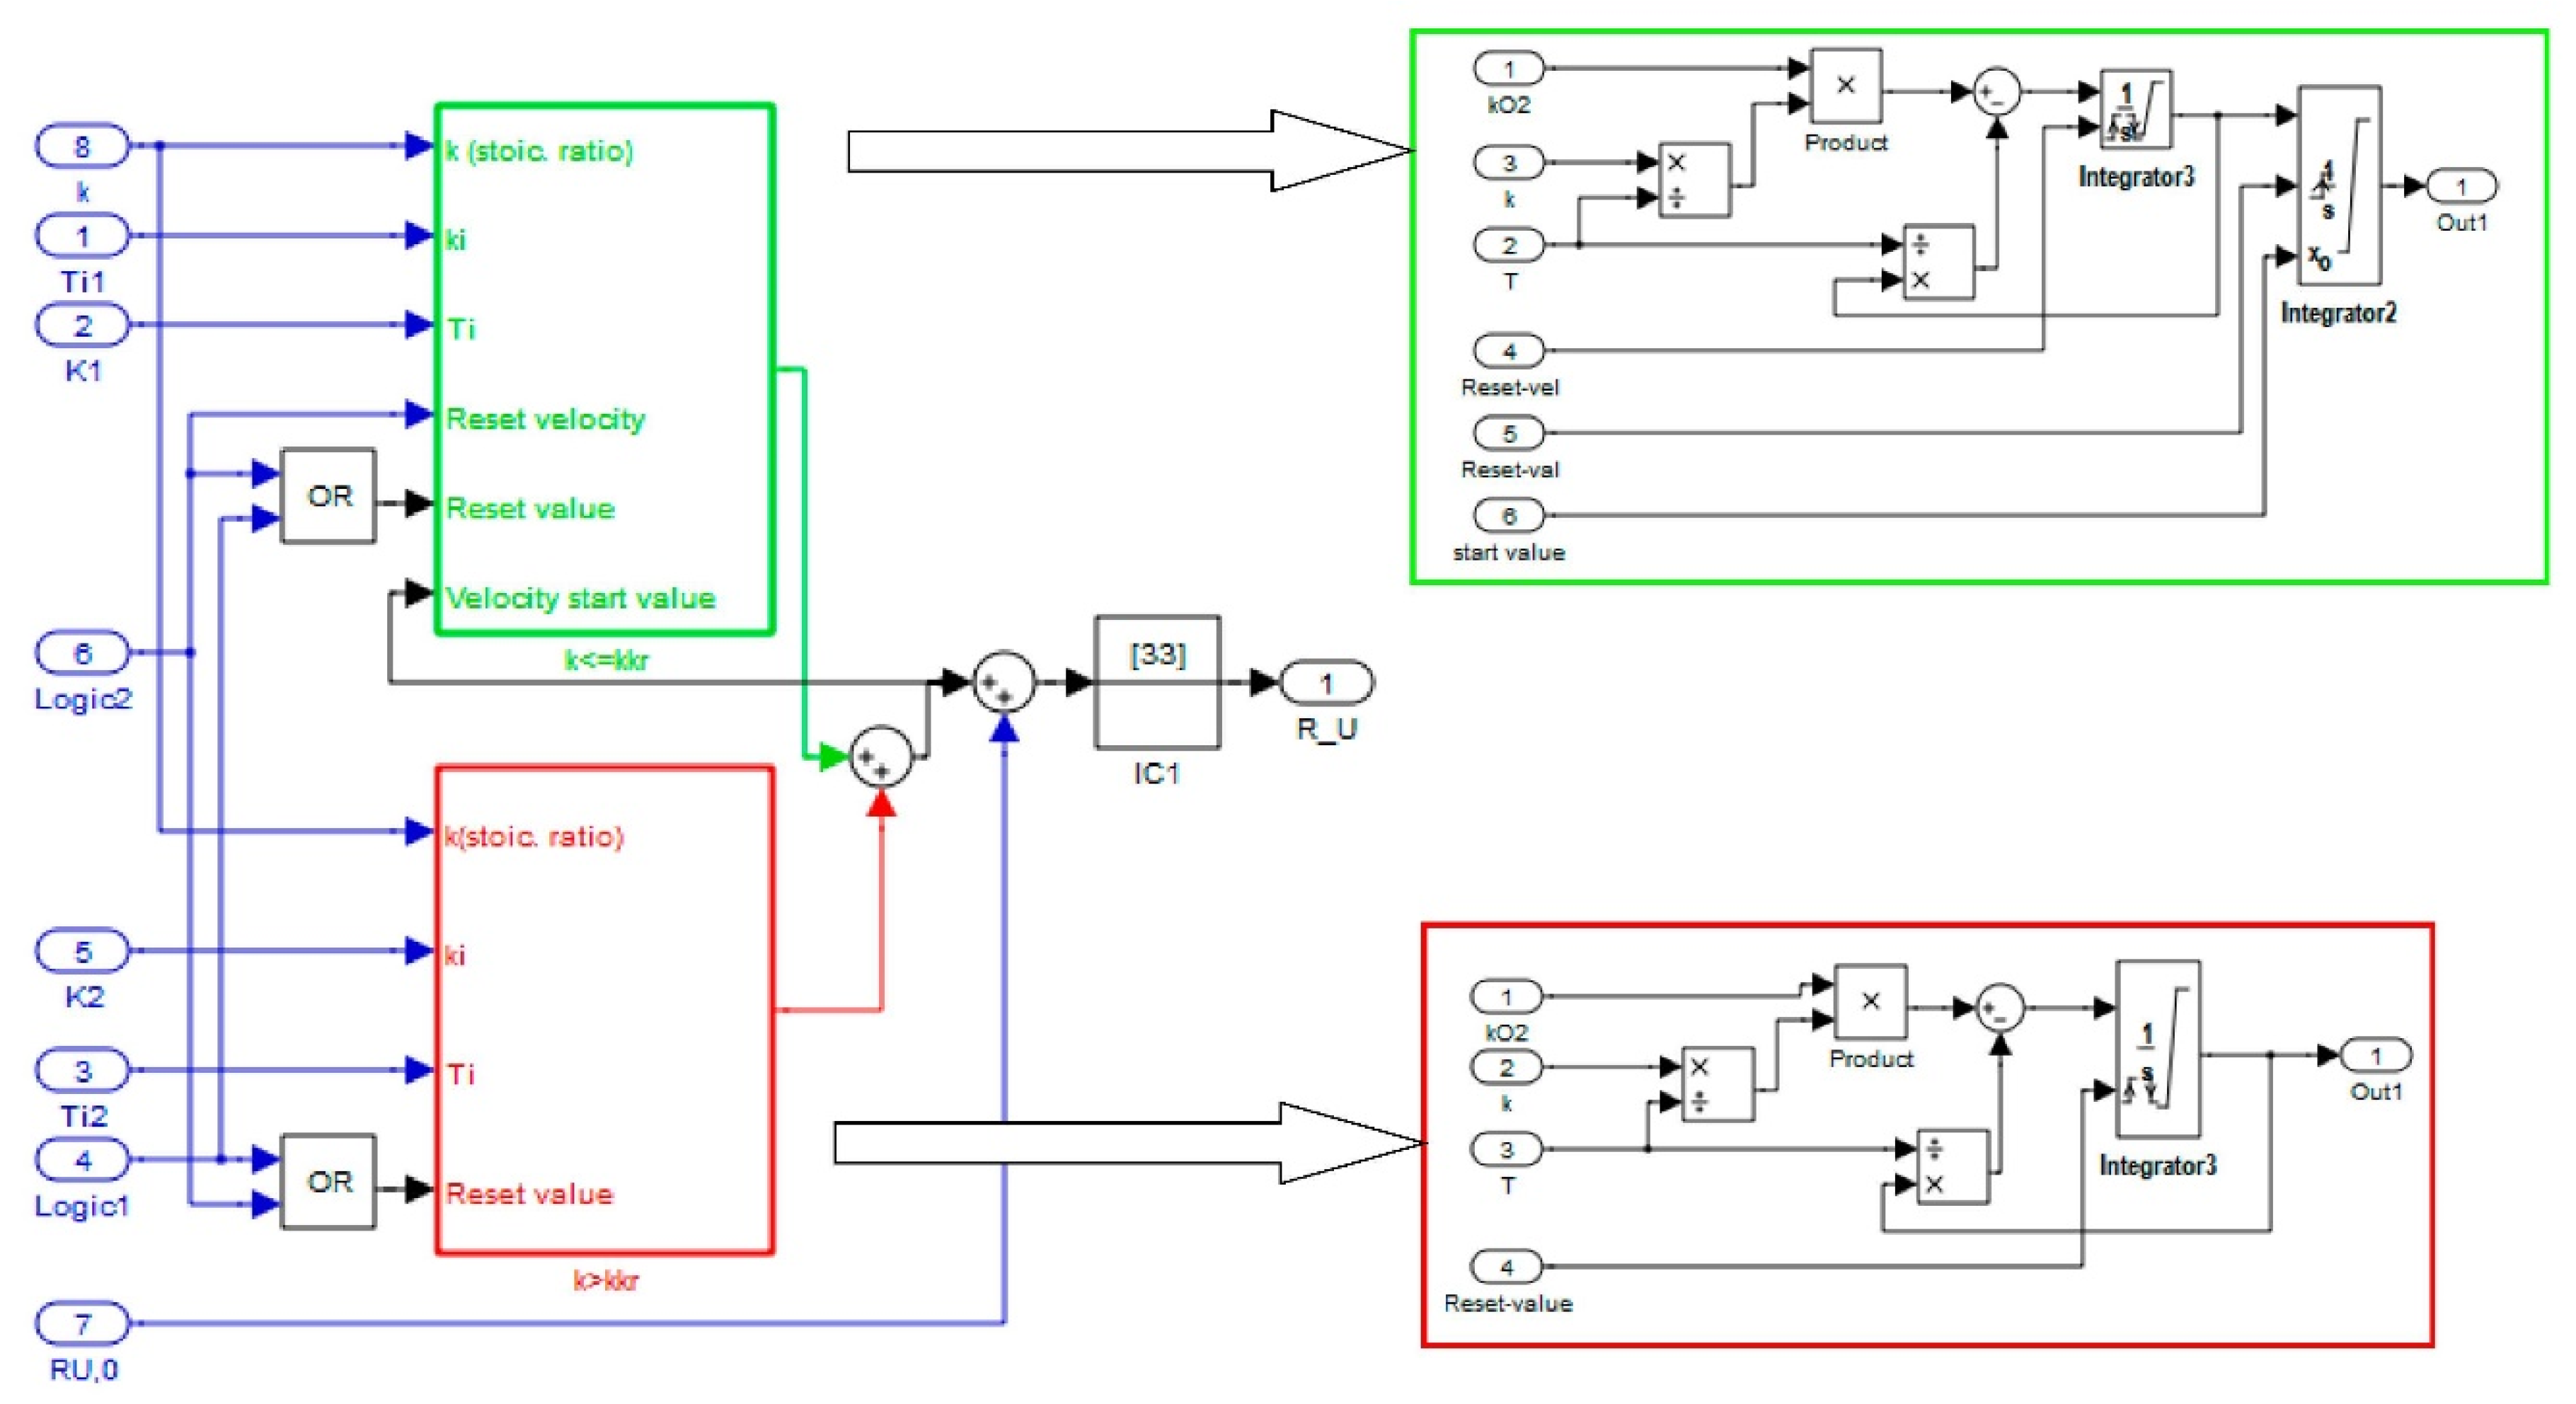
2.3. Fuzzy Controller
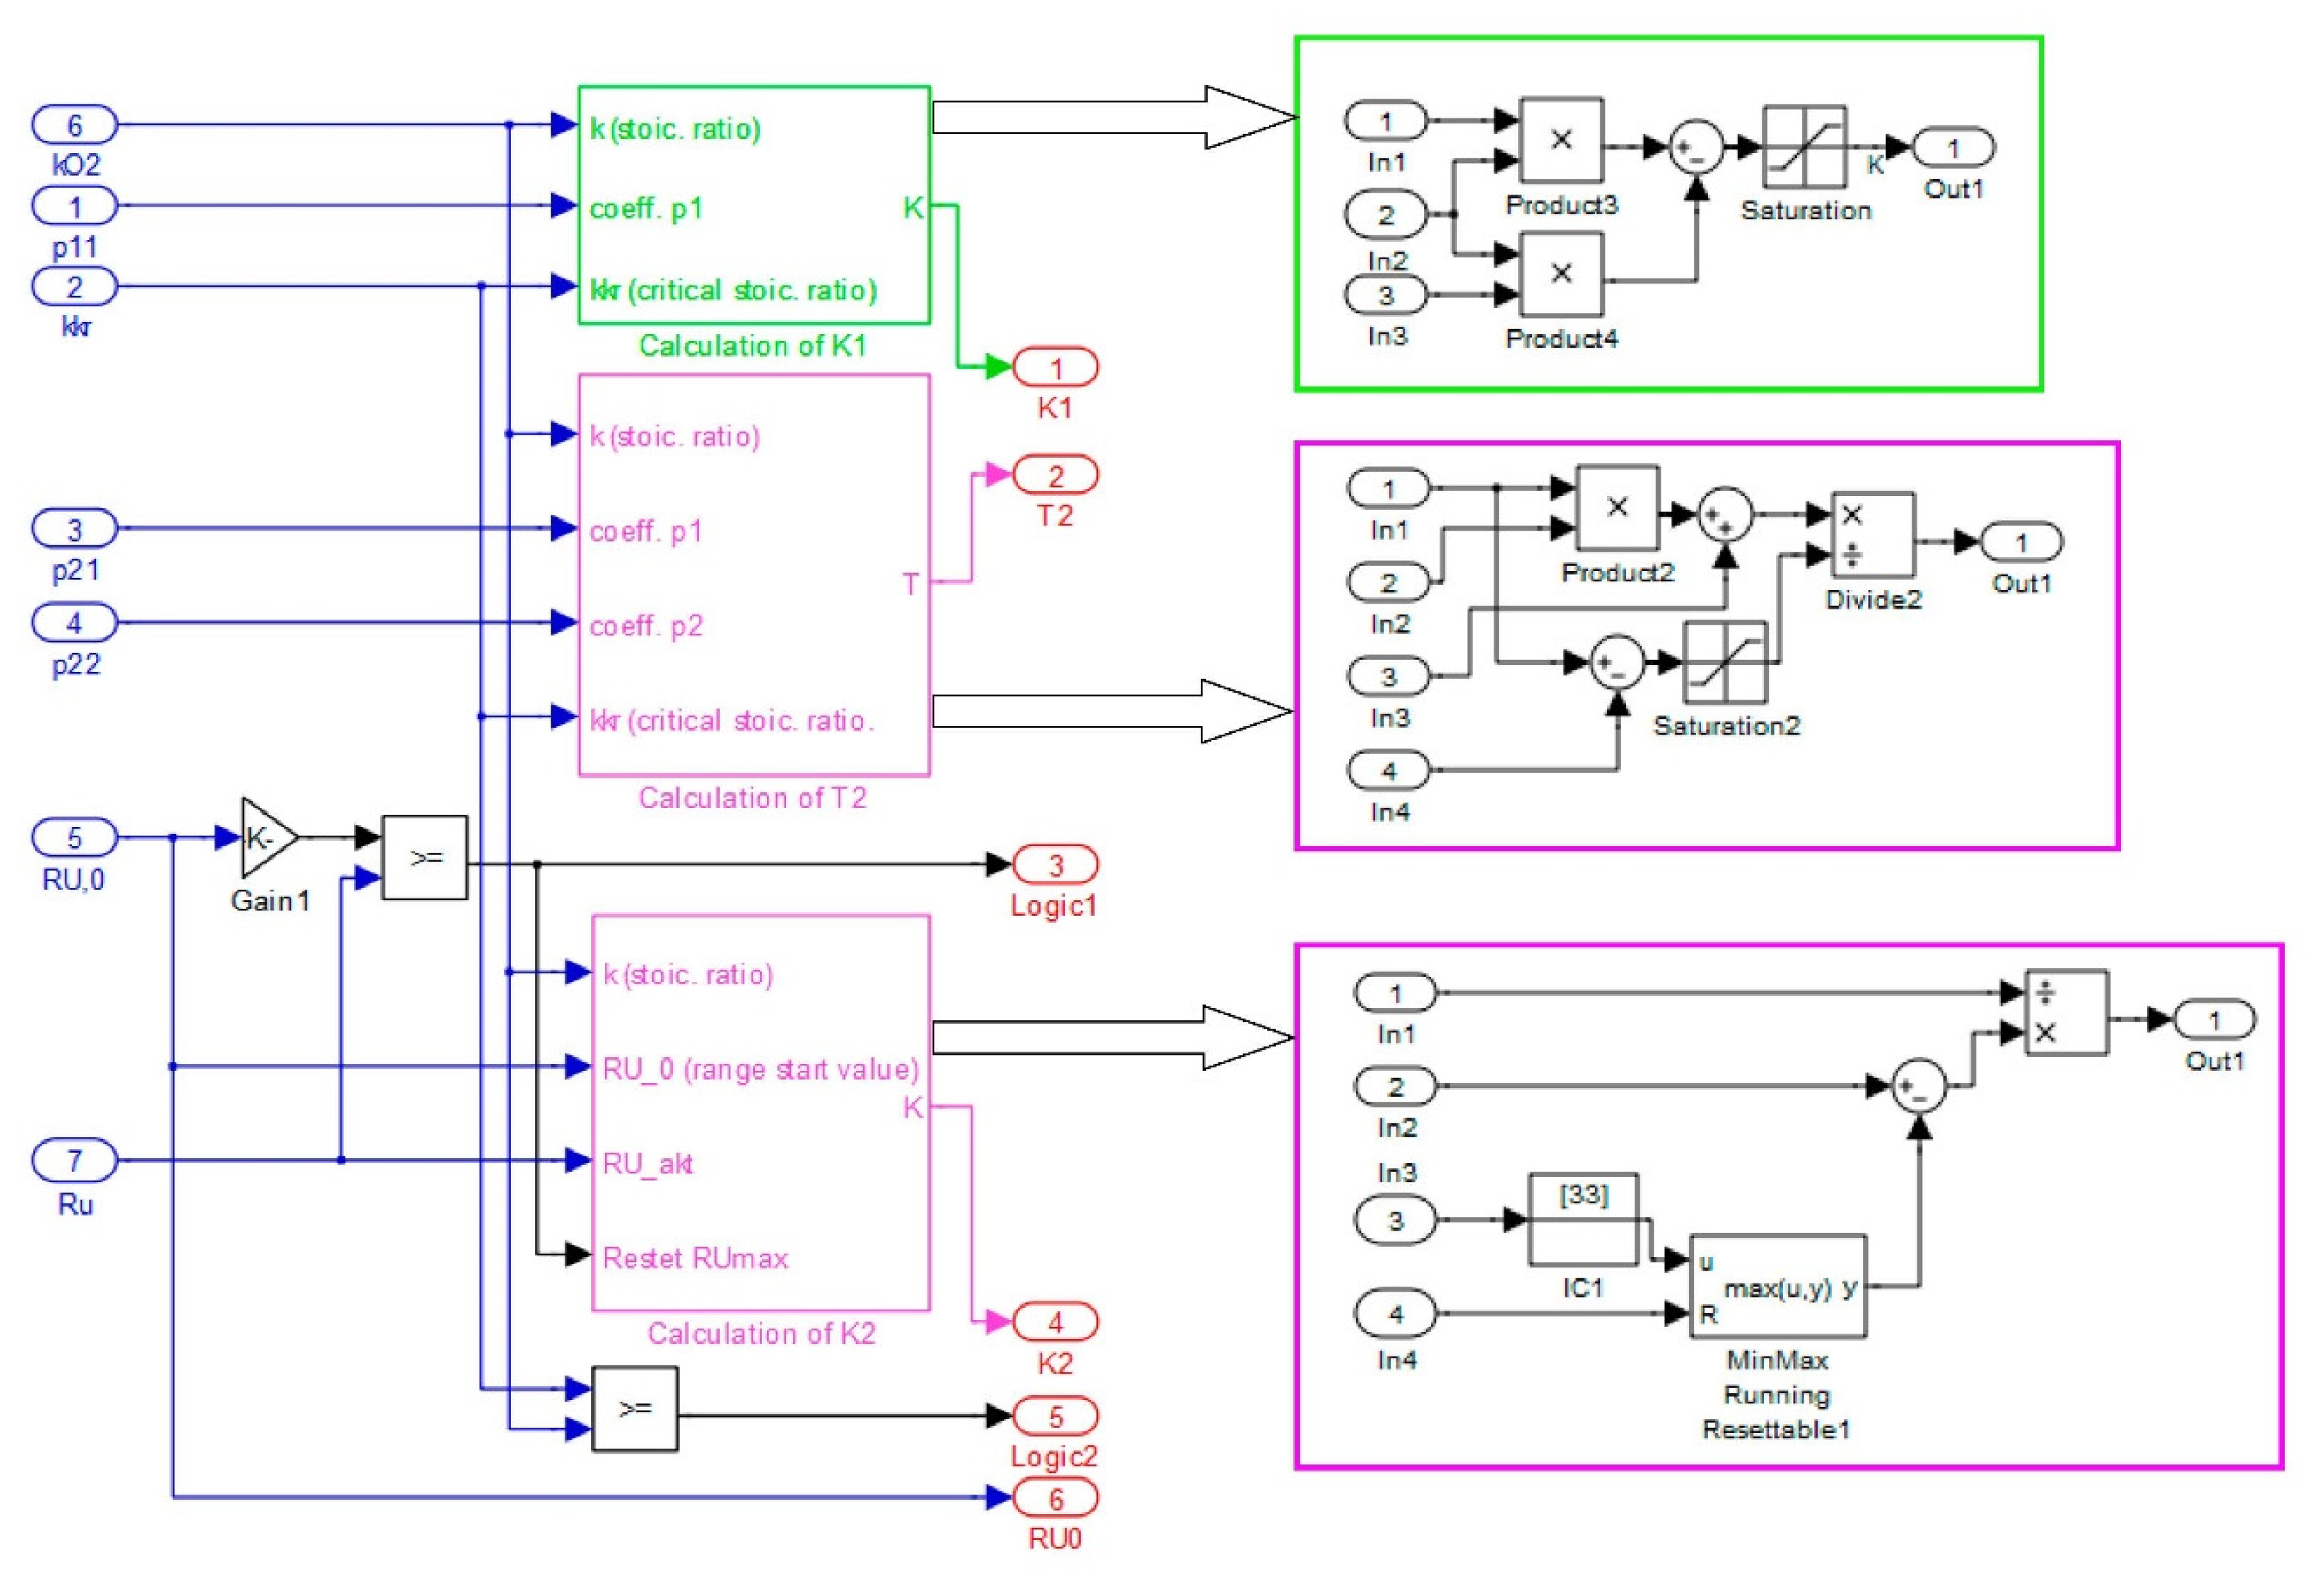
2.4. Assessment of the Control Process
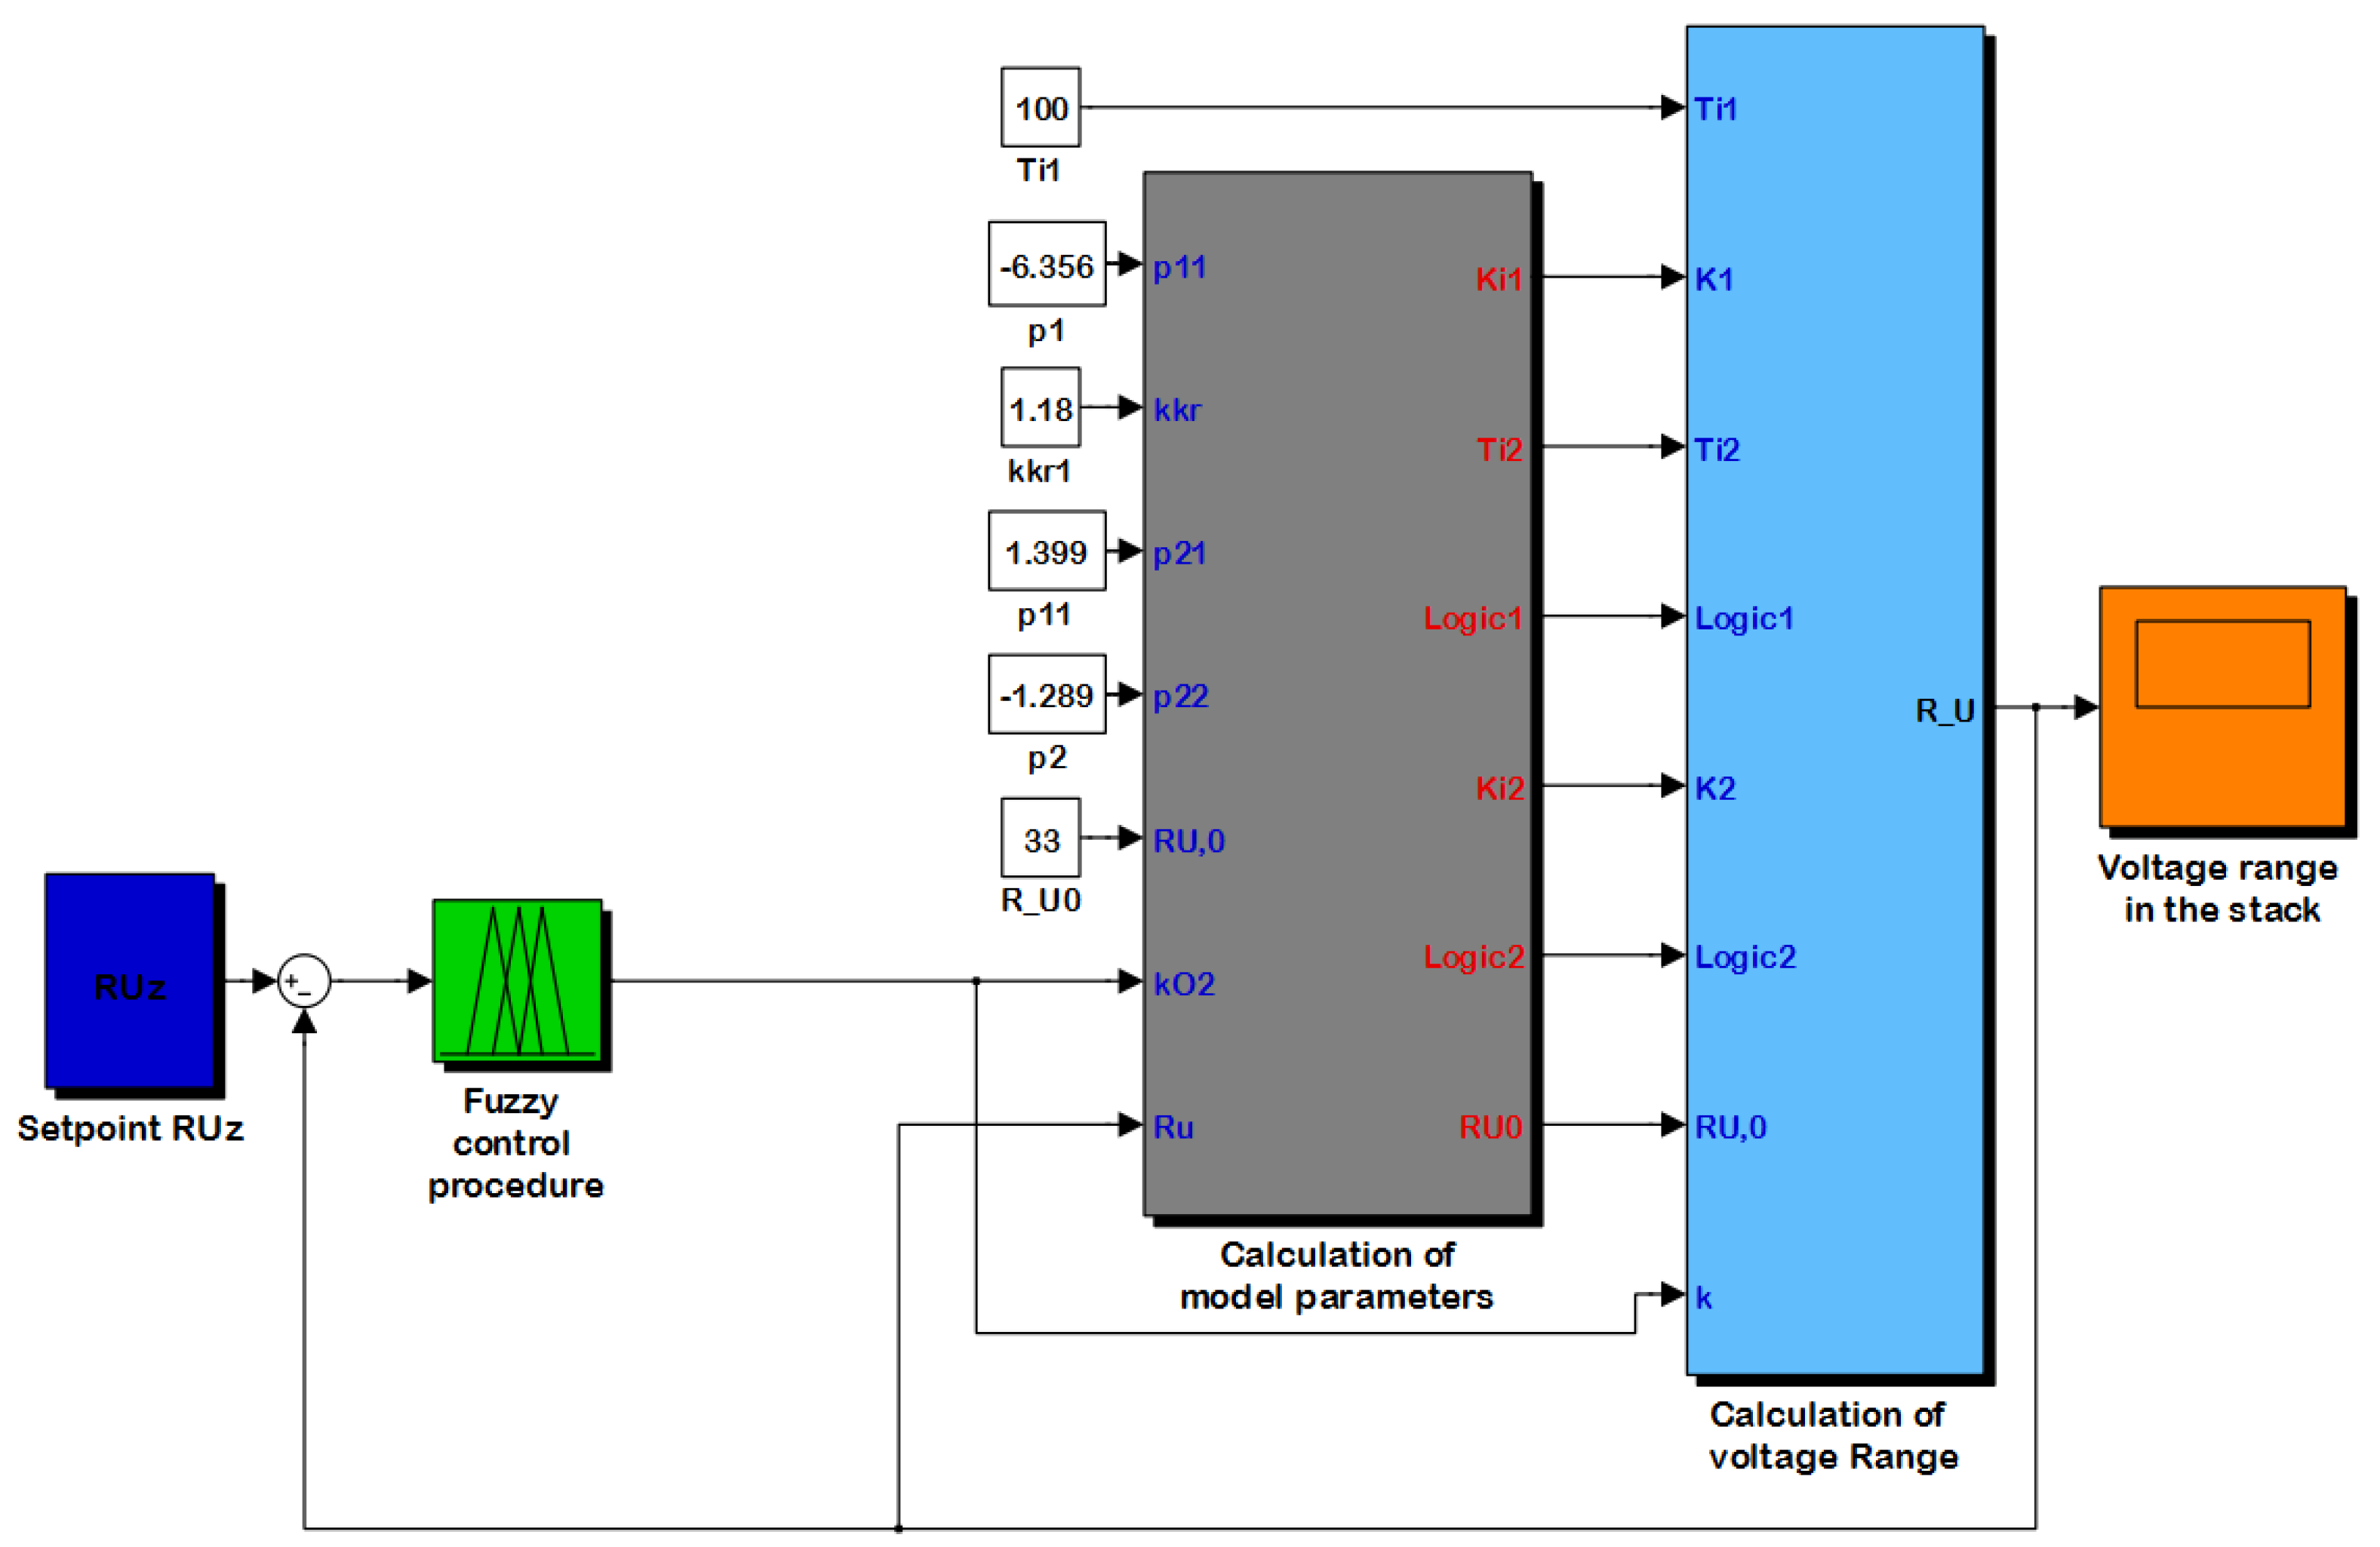
2.5. Selection of Fuzzy Controller Parameters
3. Simulation Environment
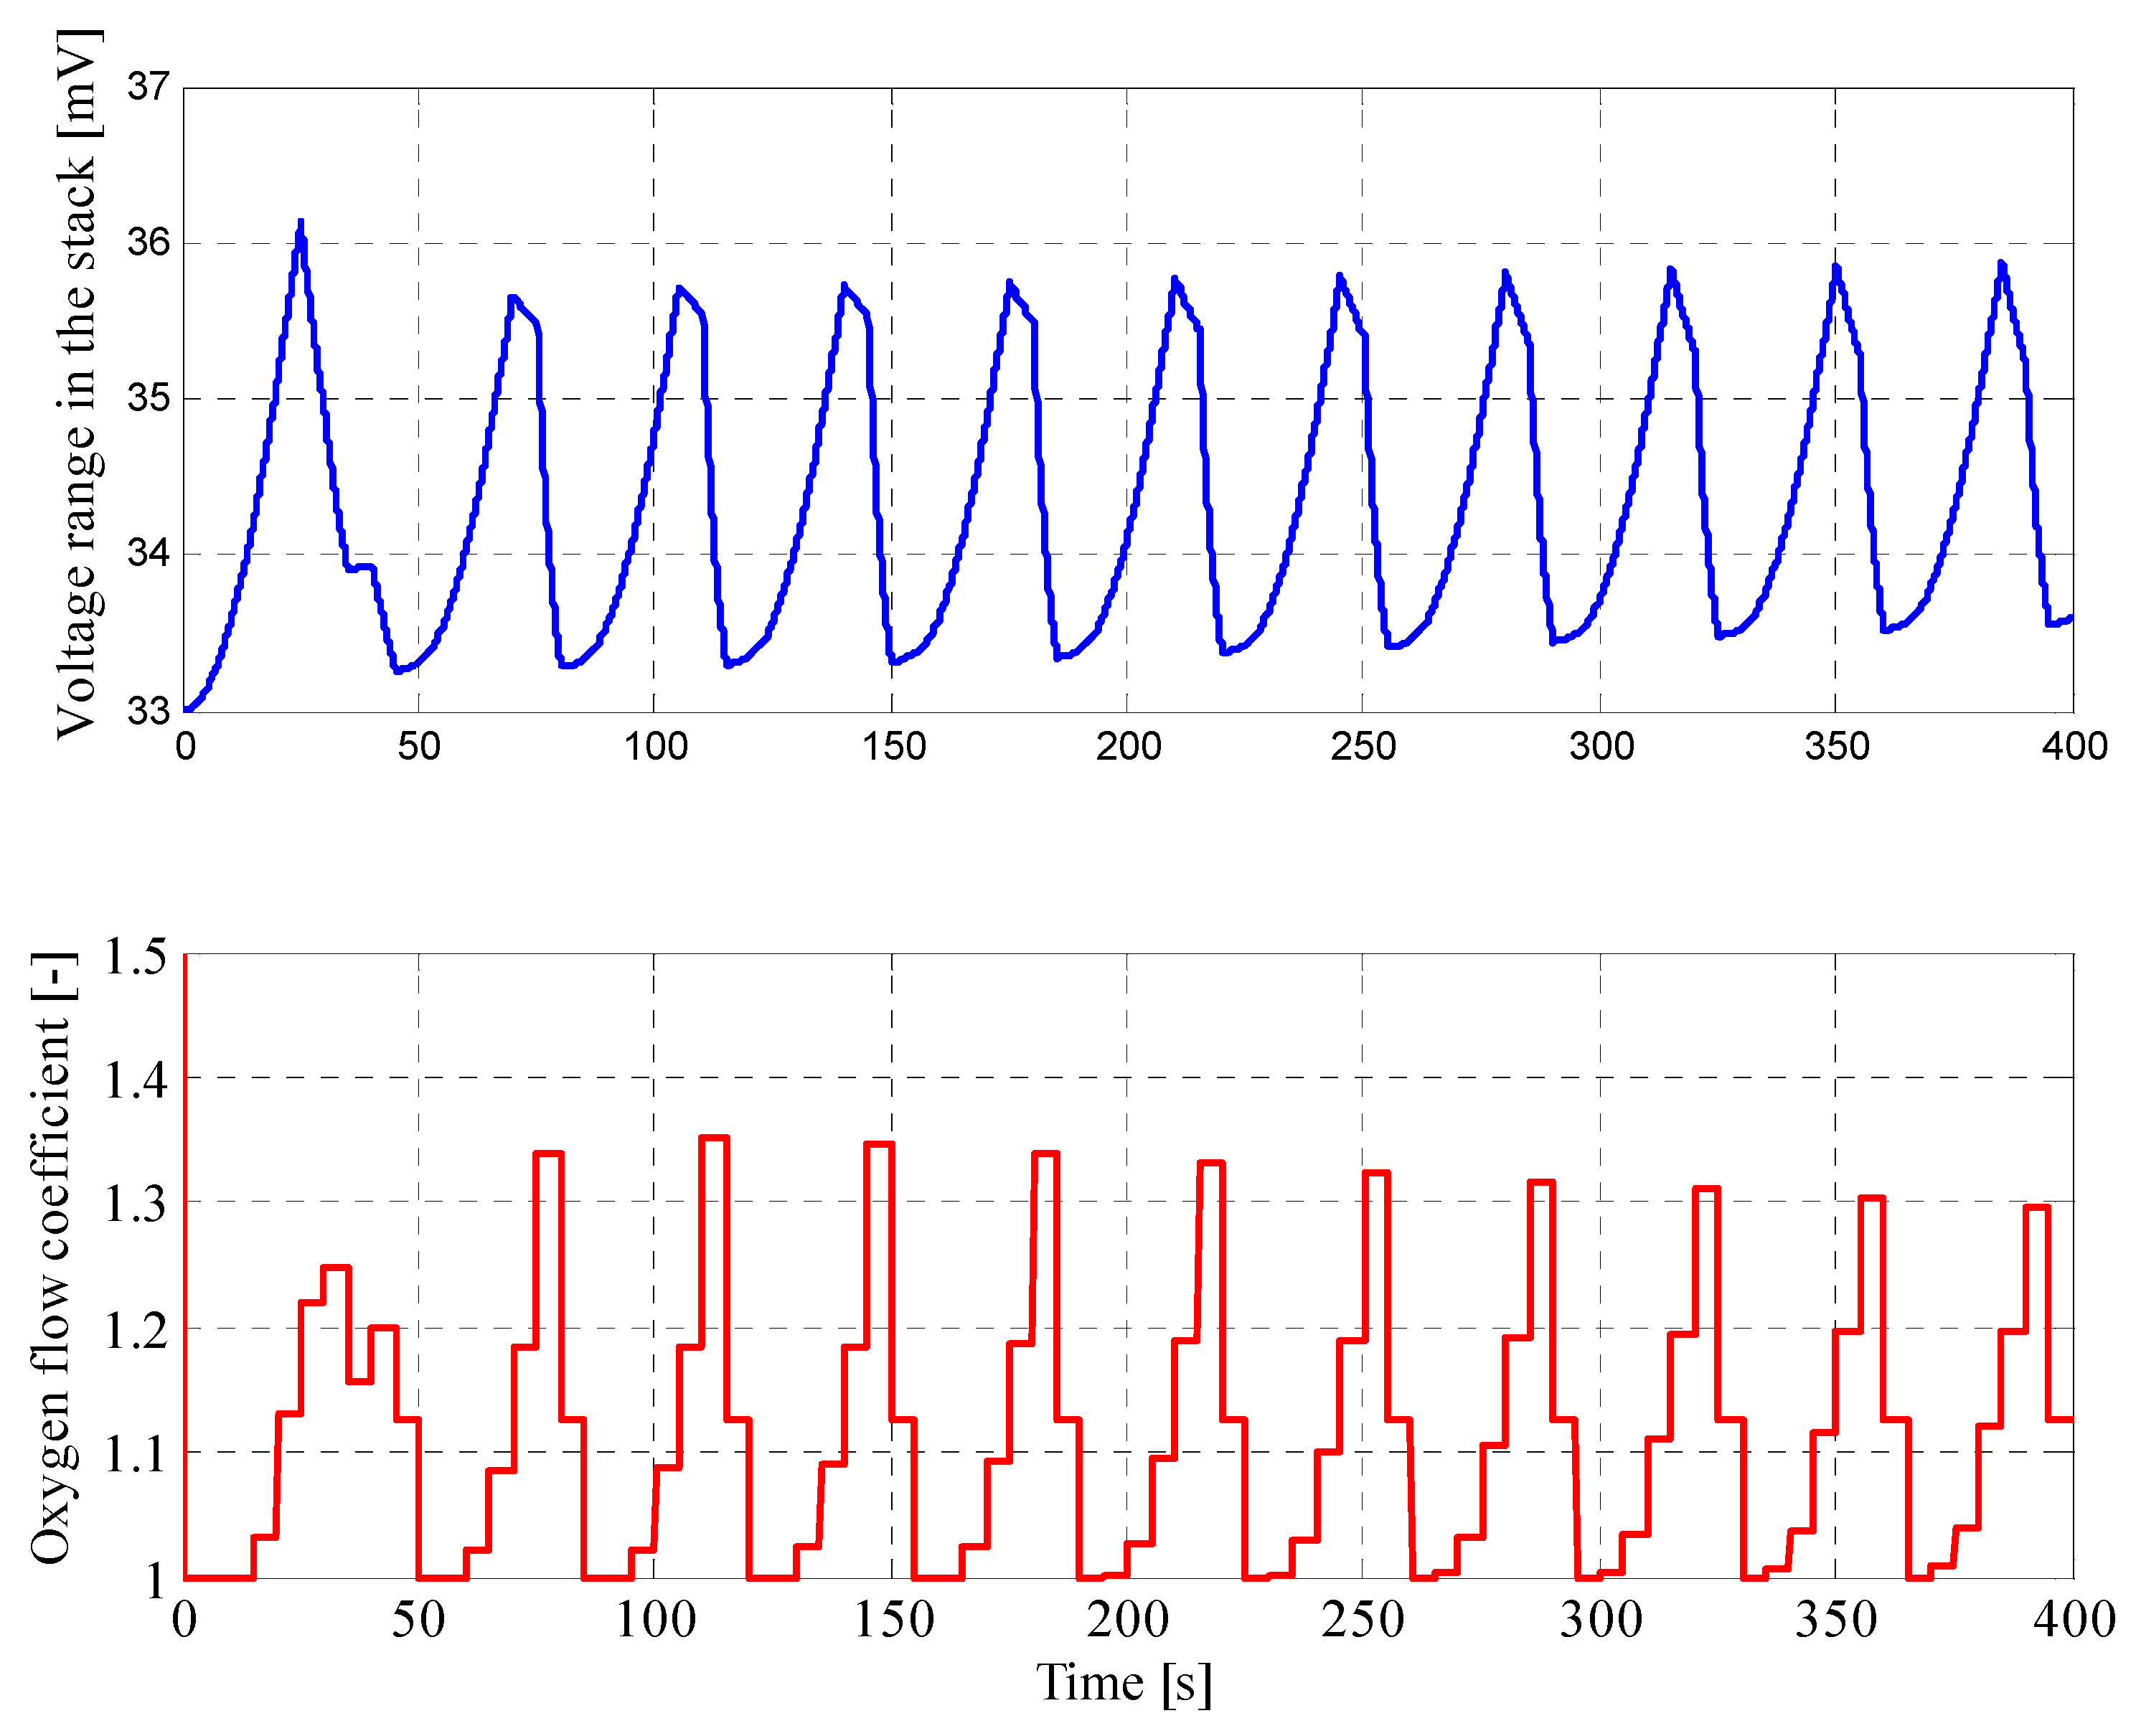
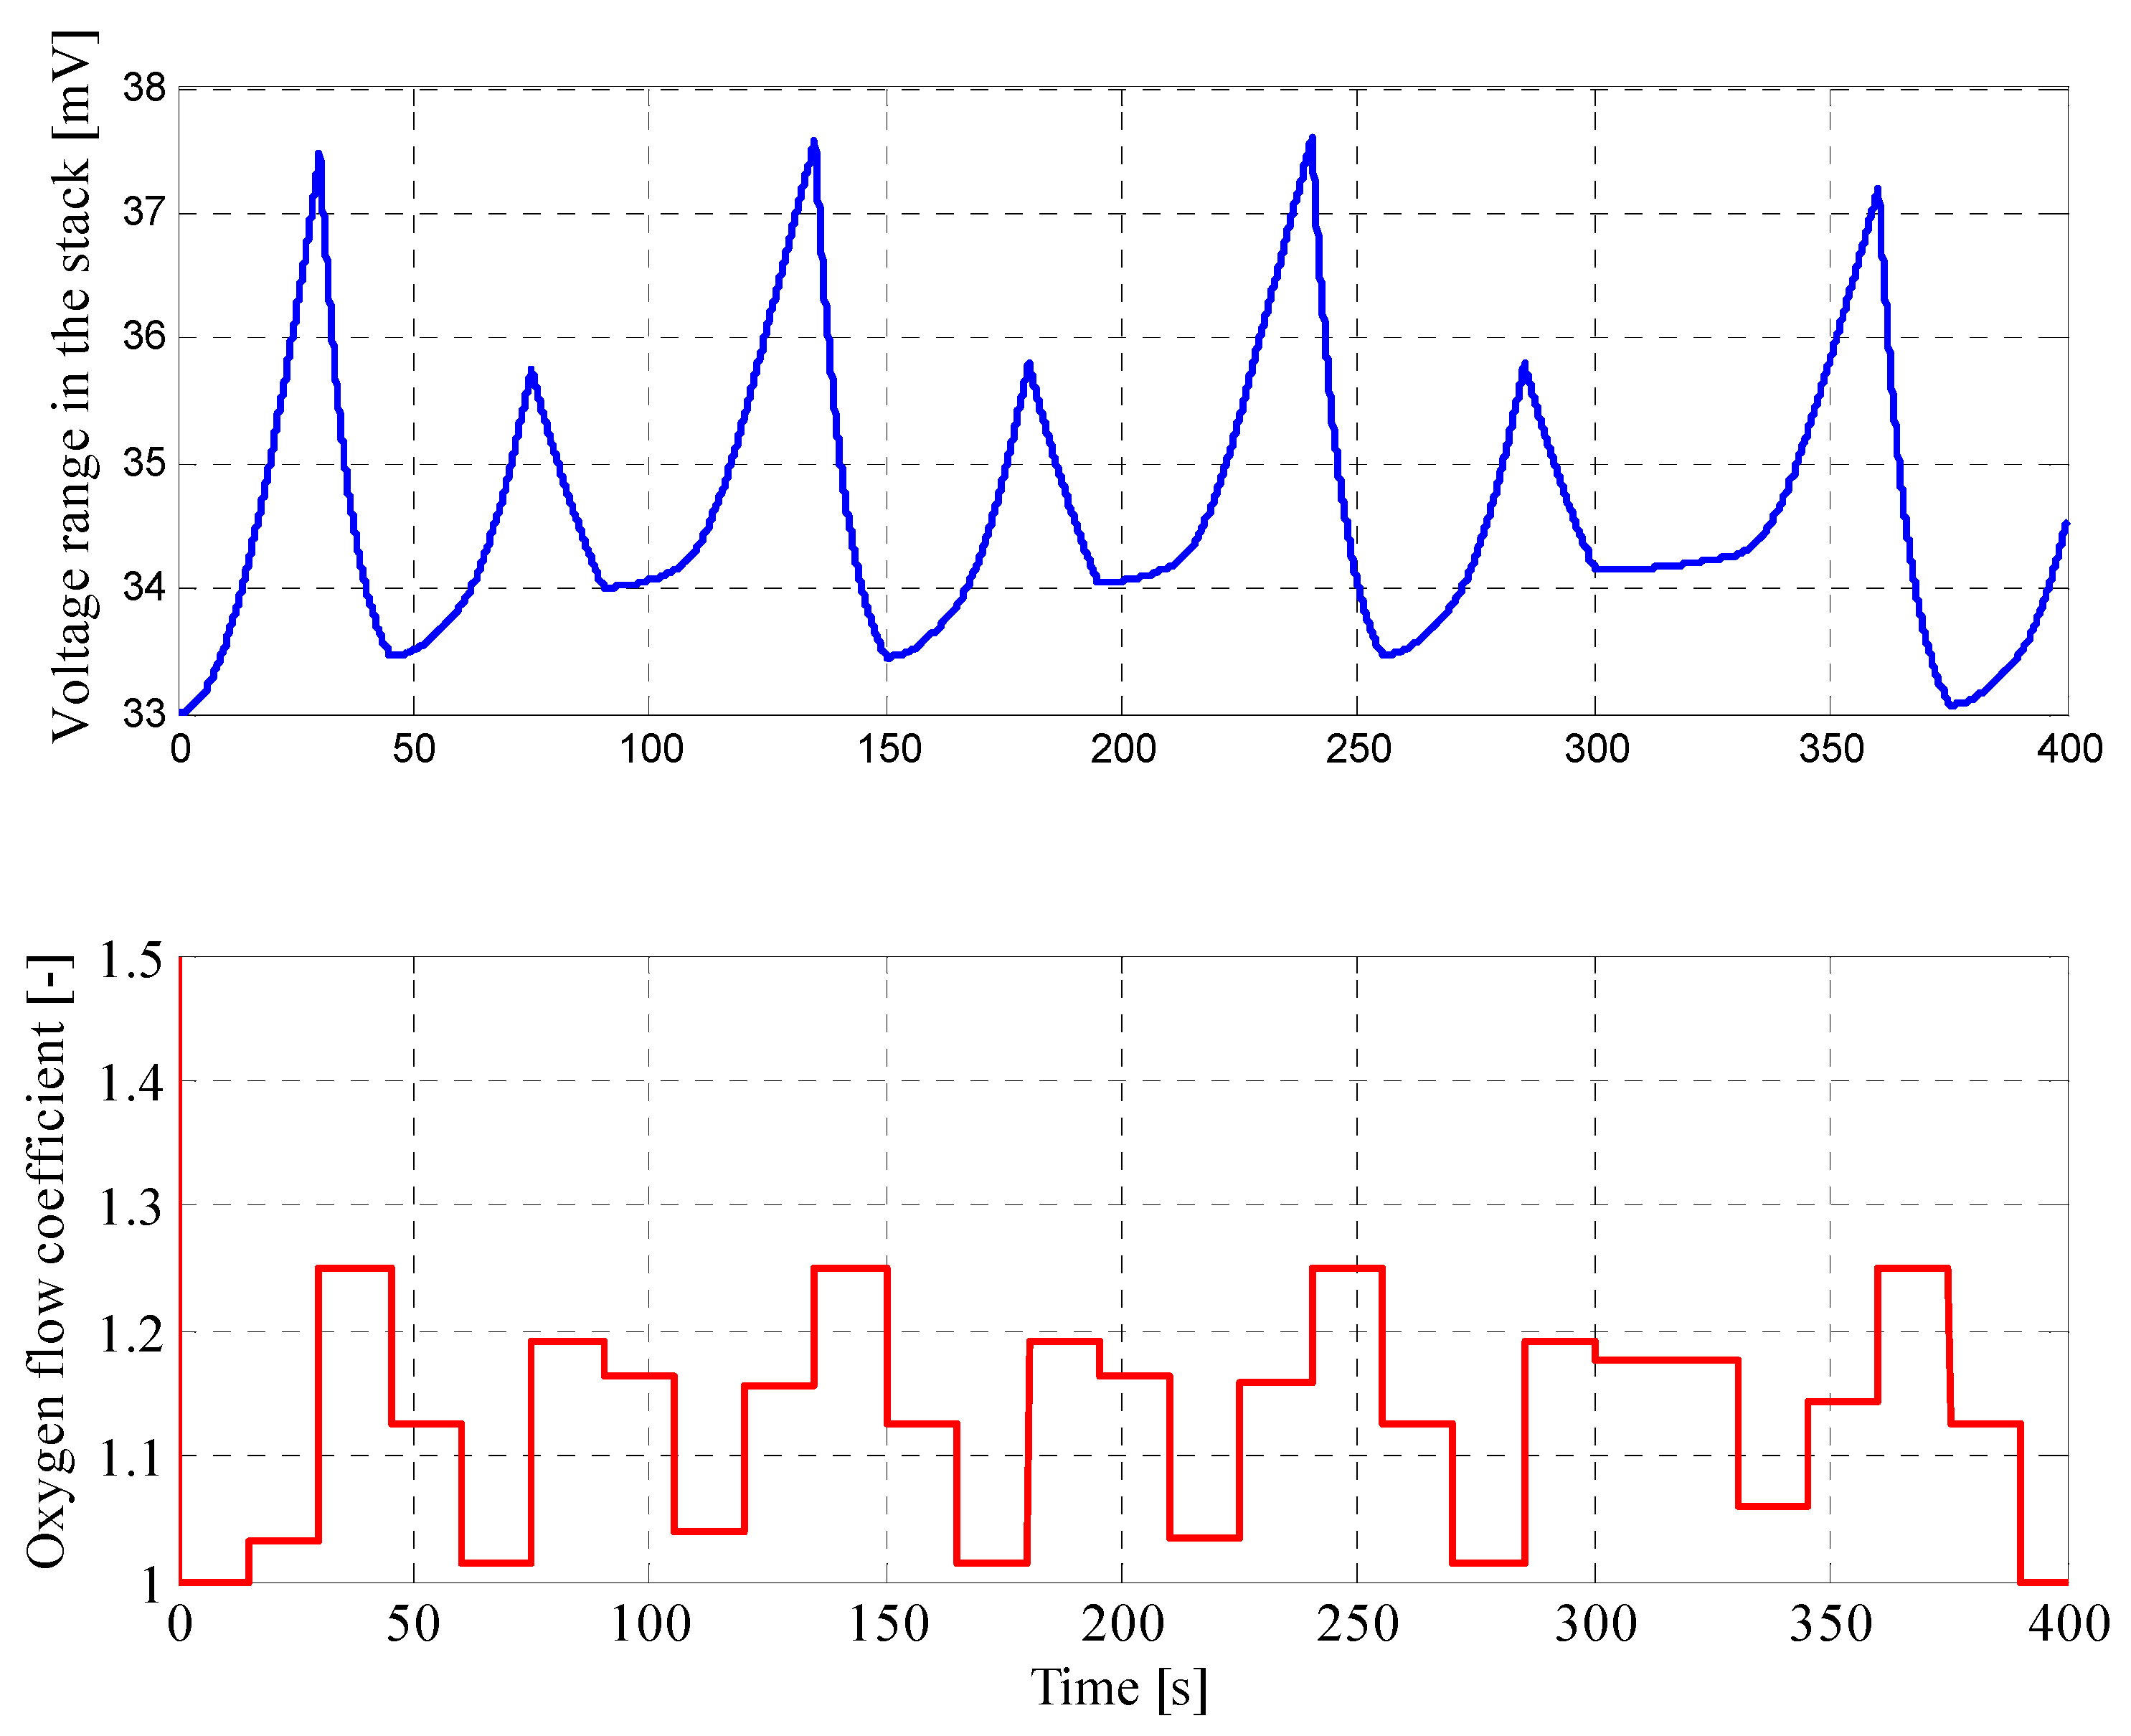
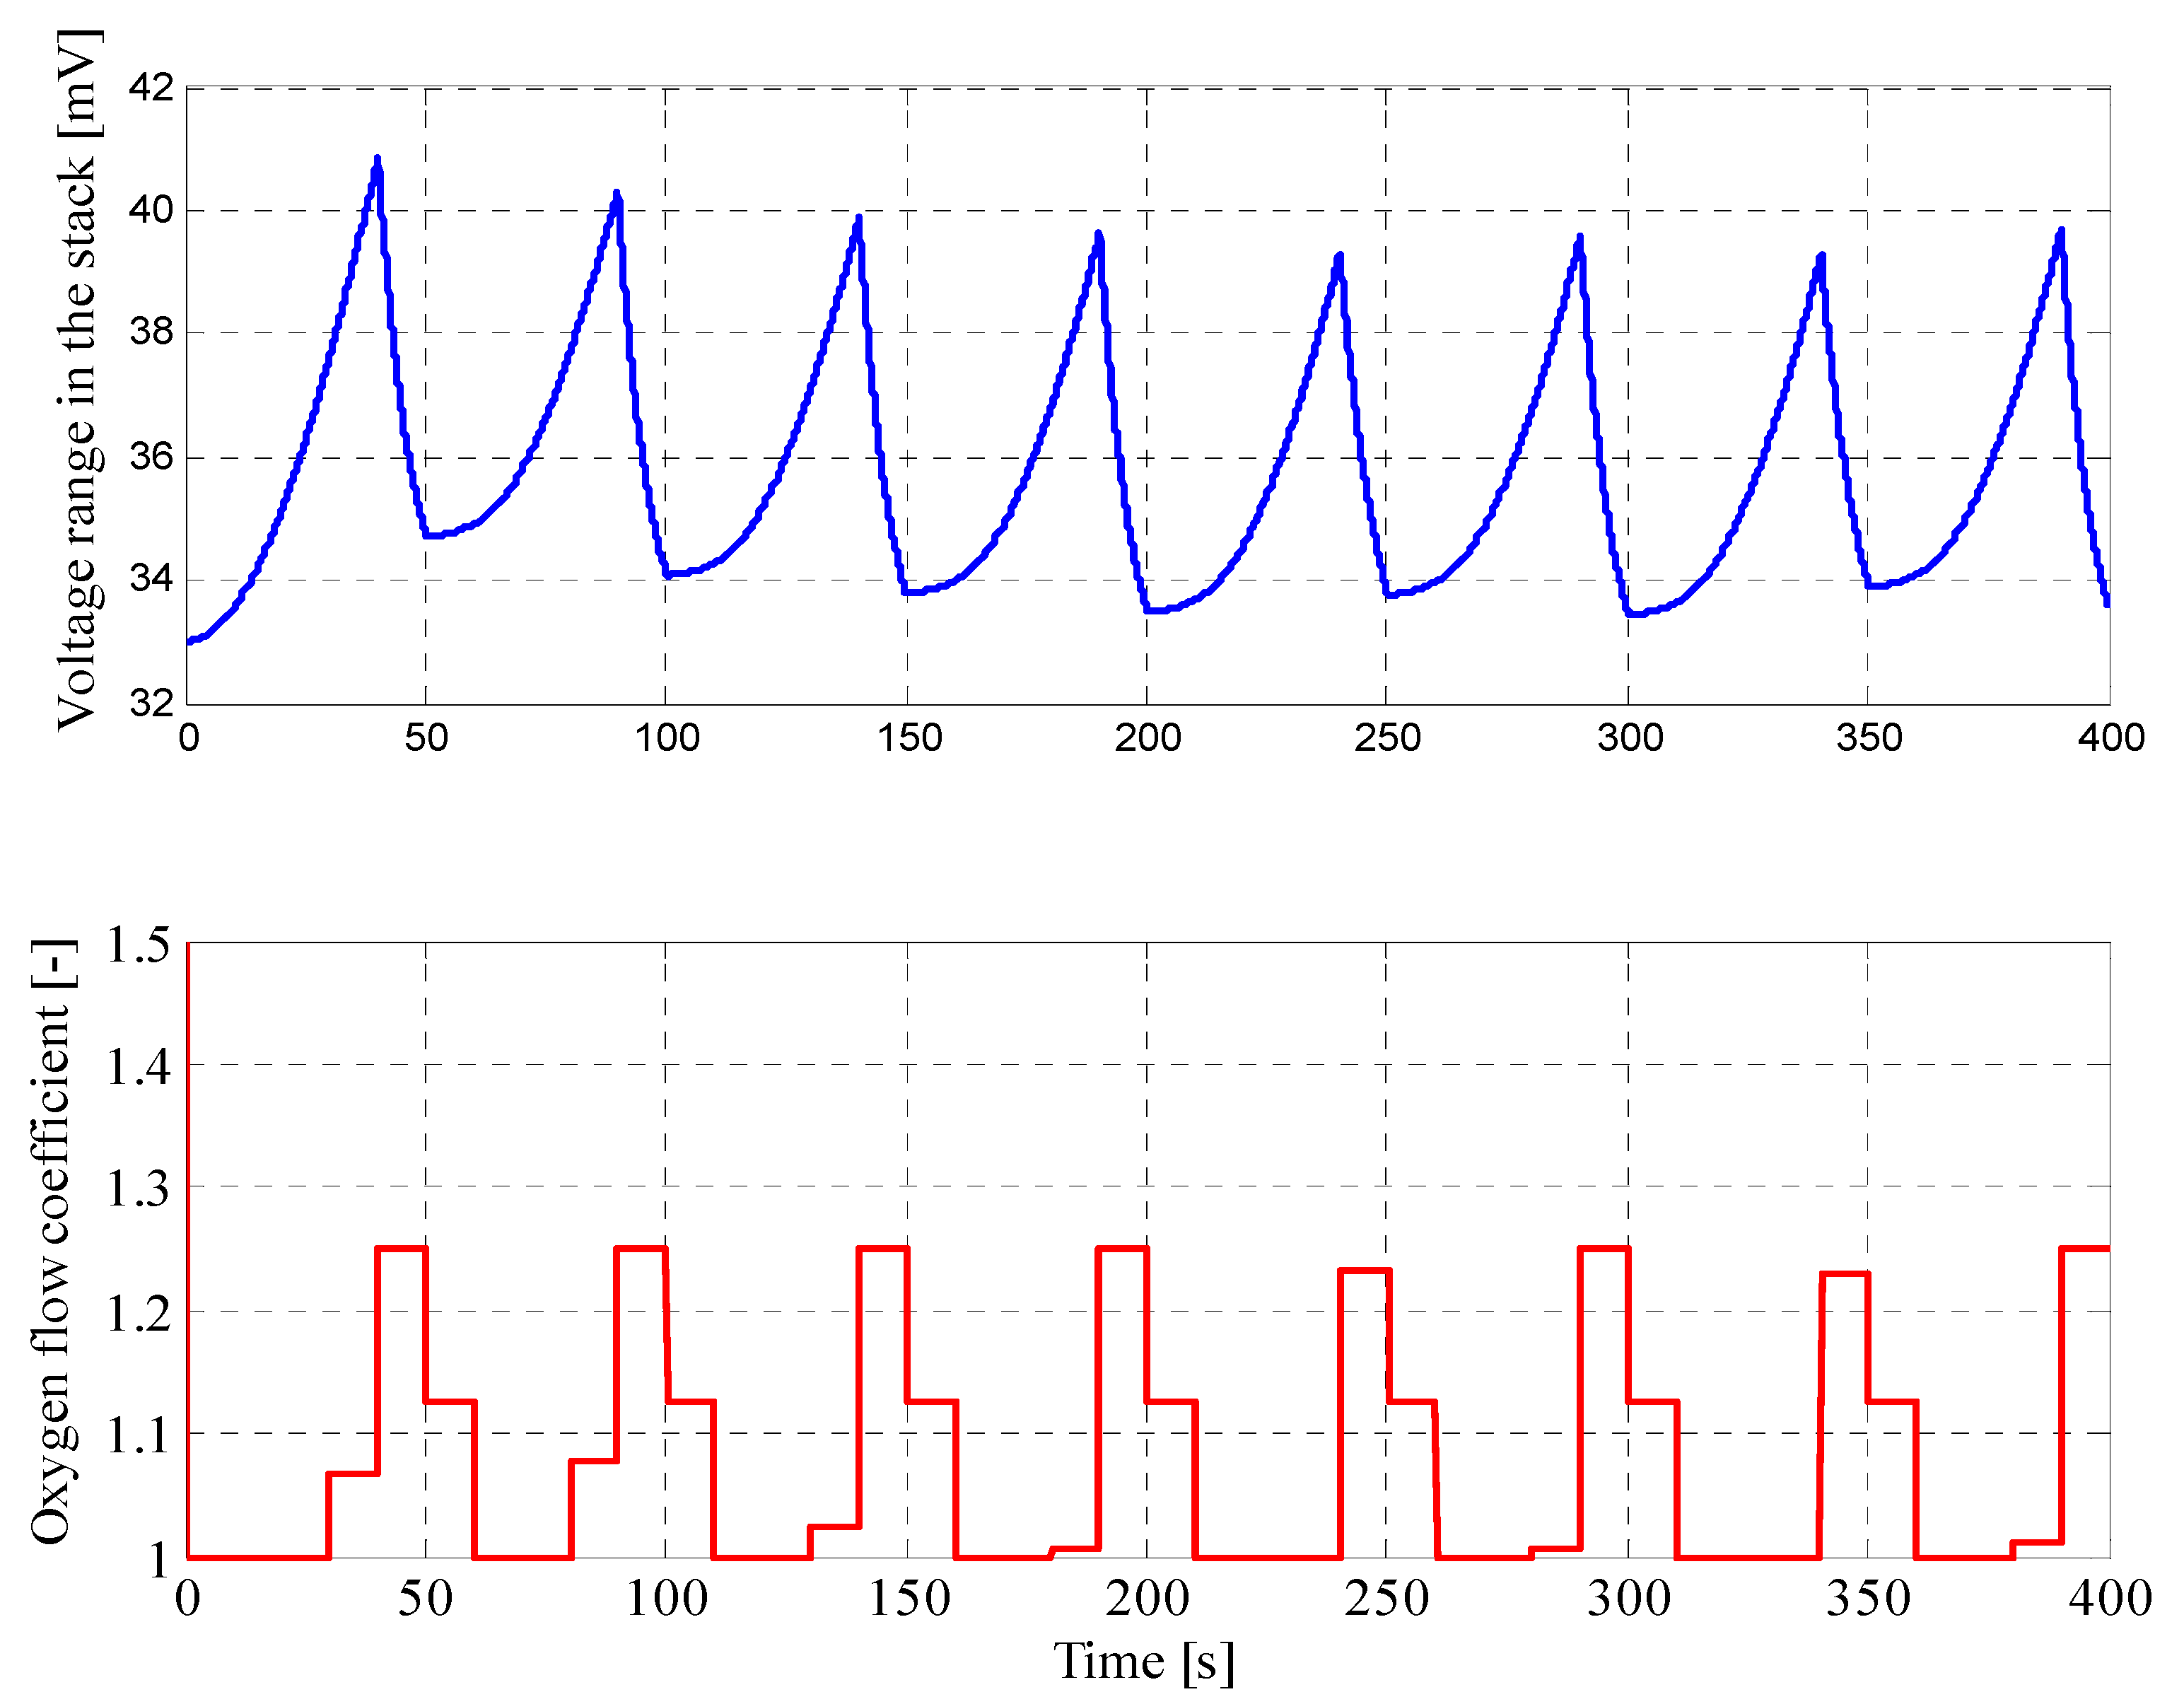
4. Simulations Results and Discussion
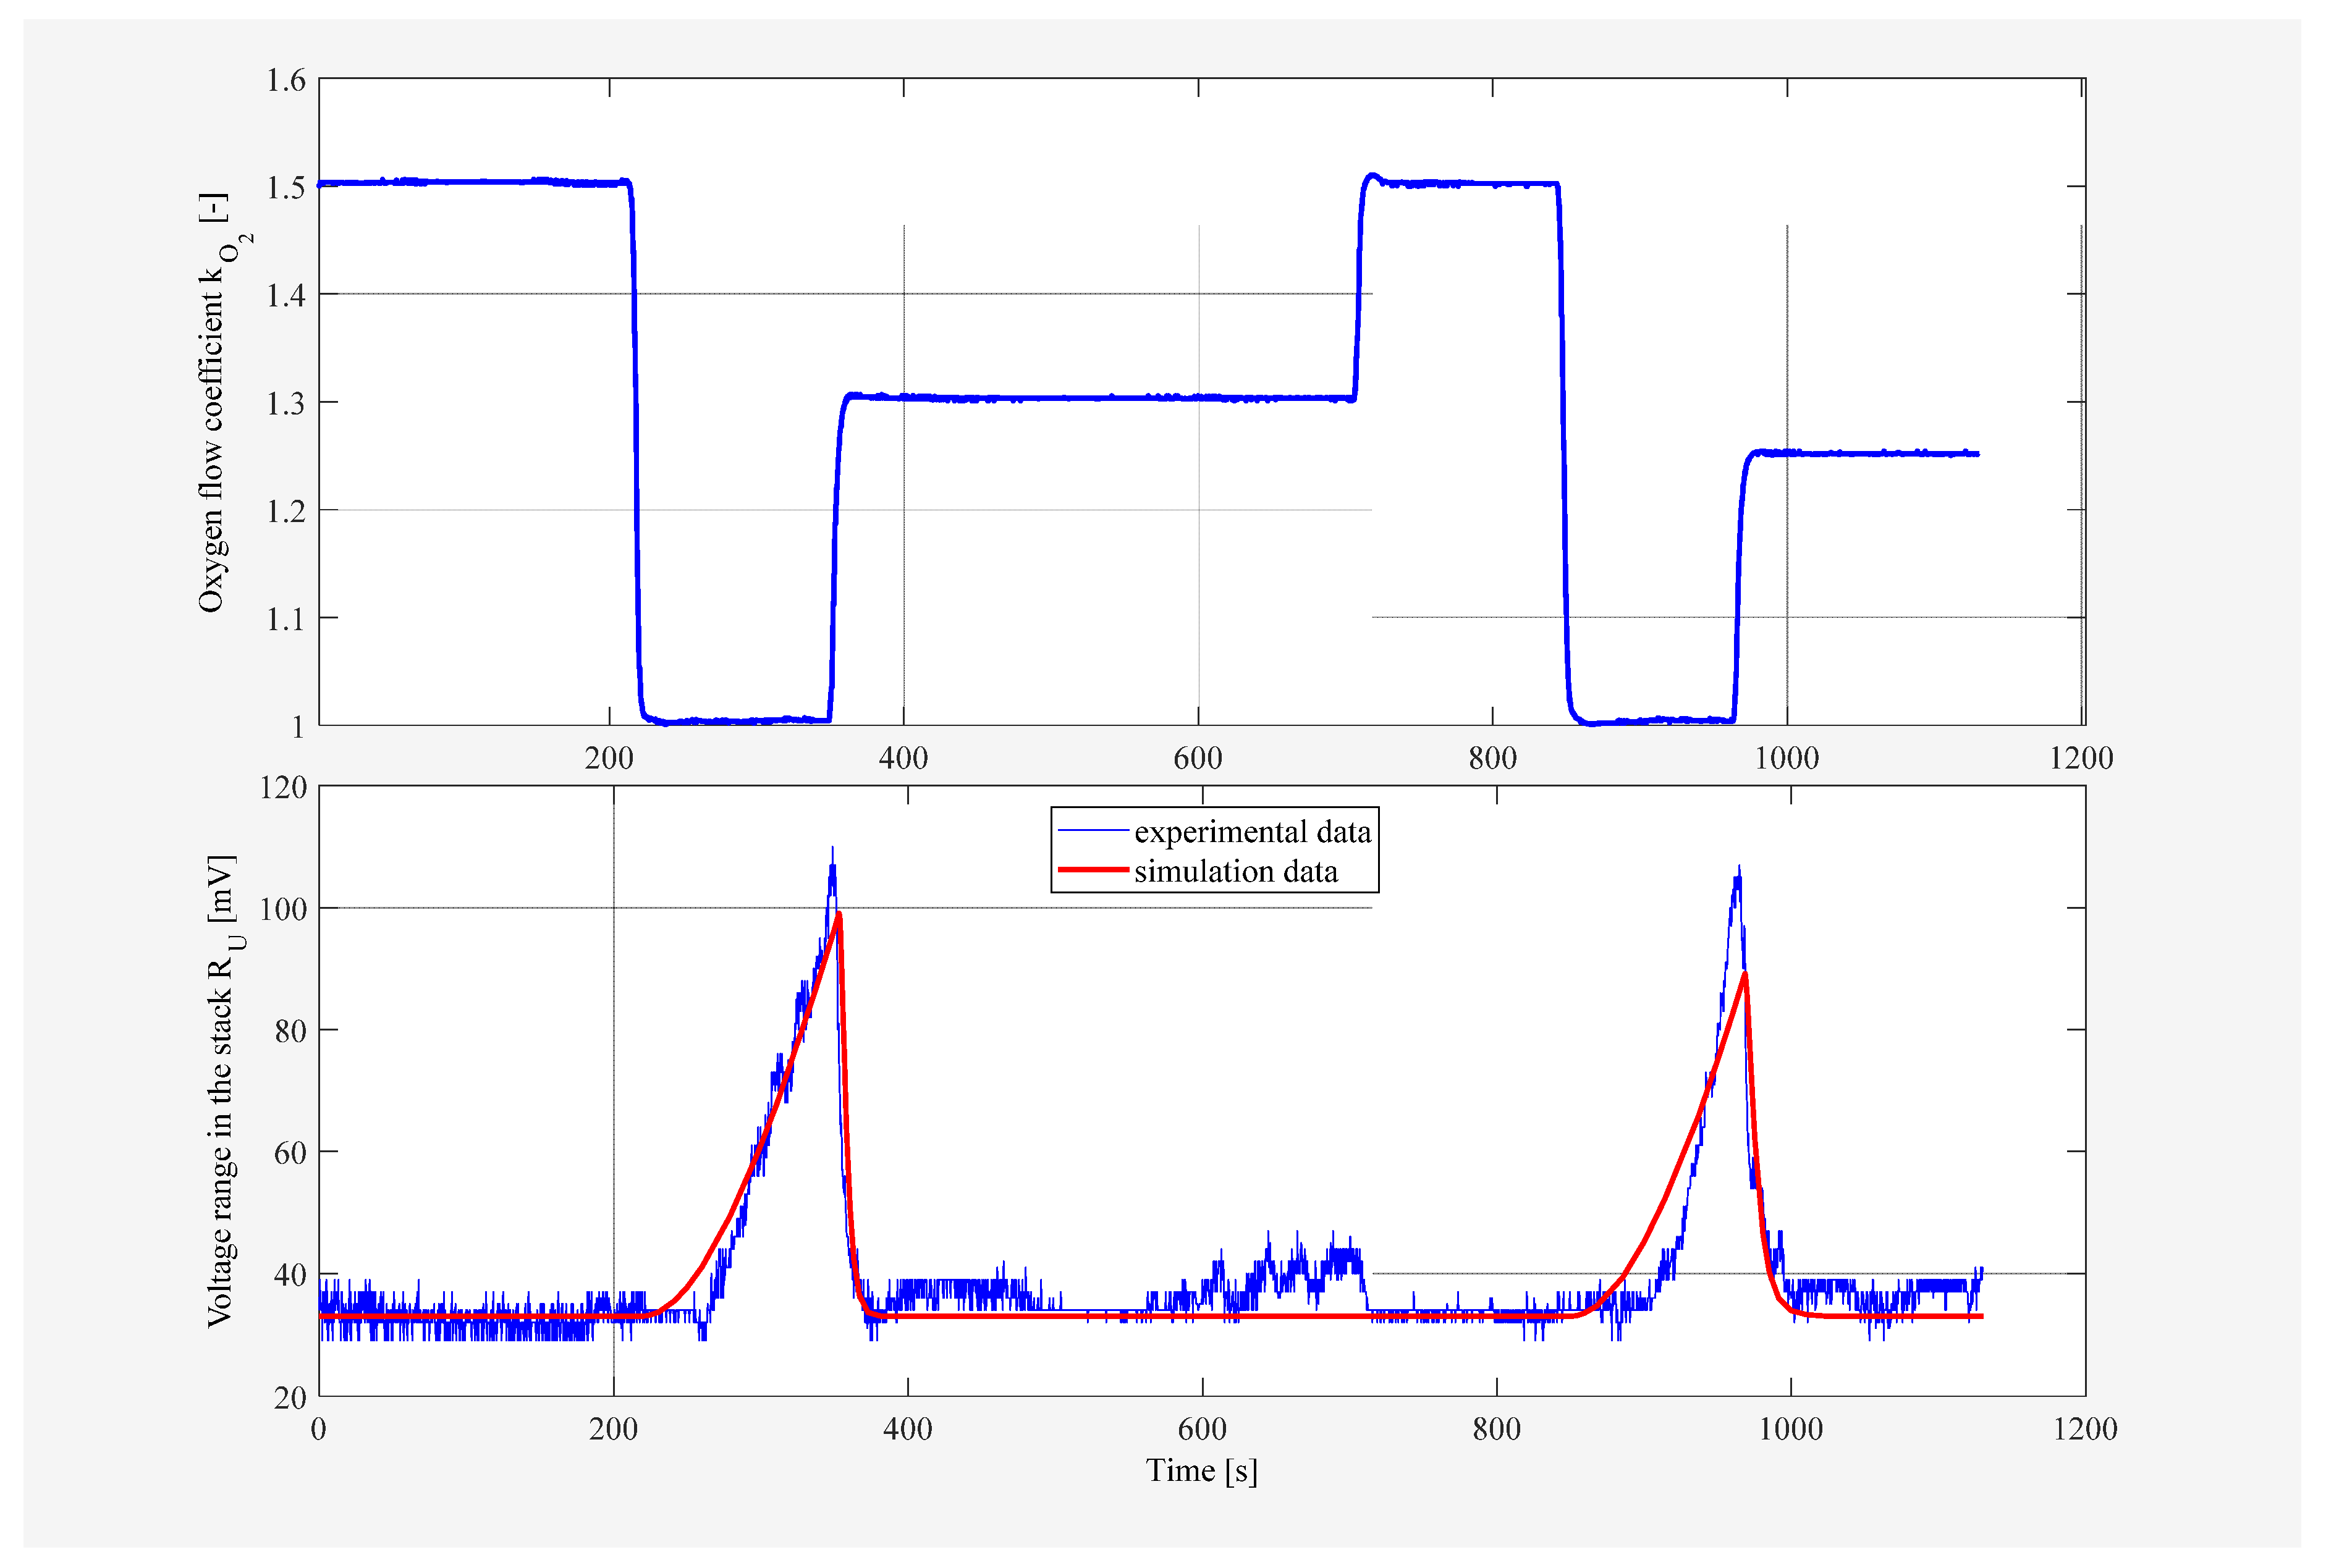
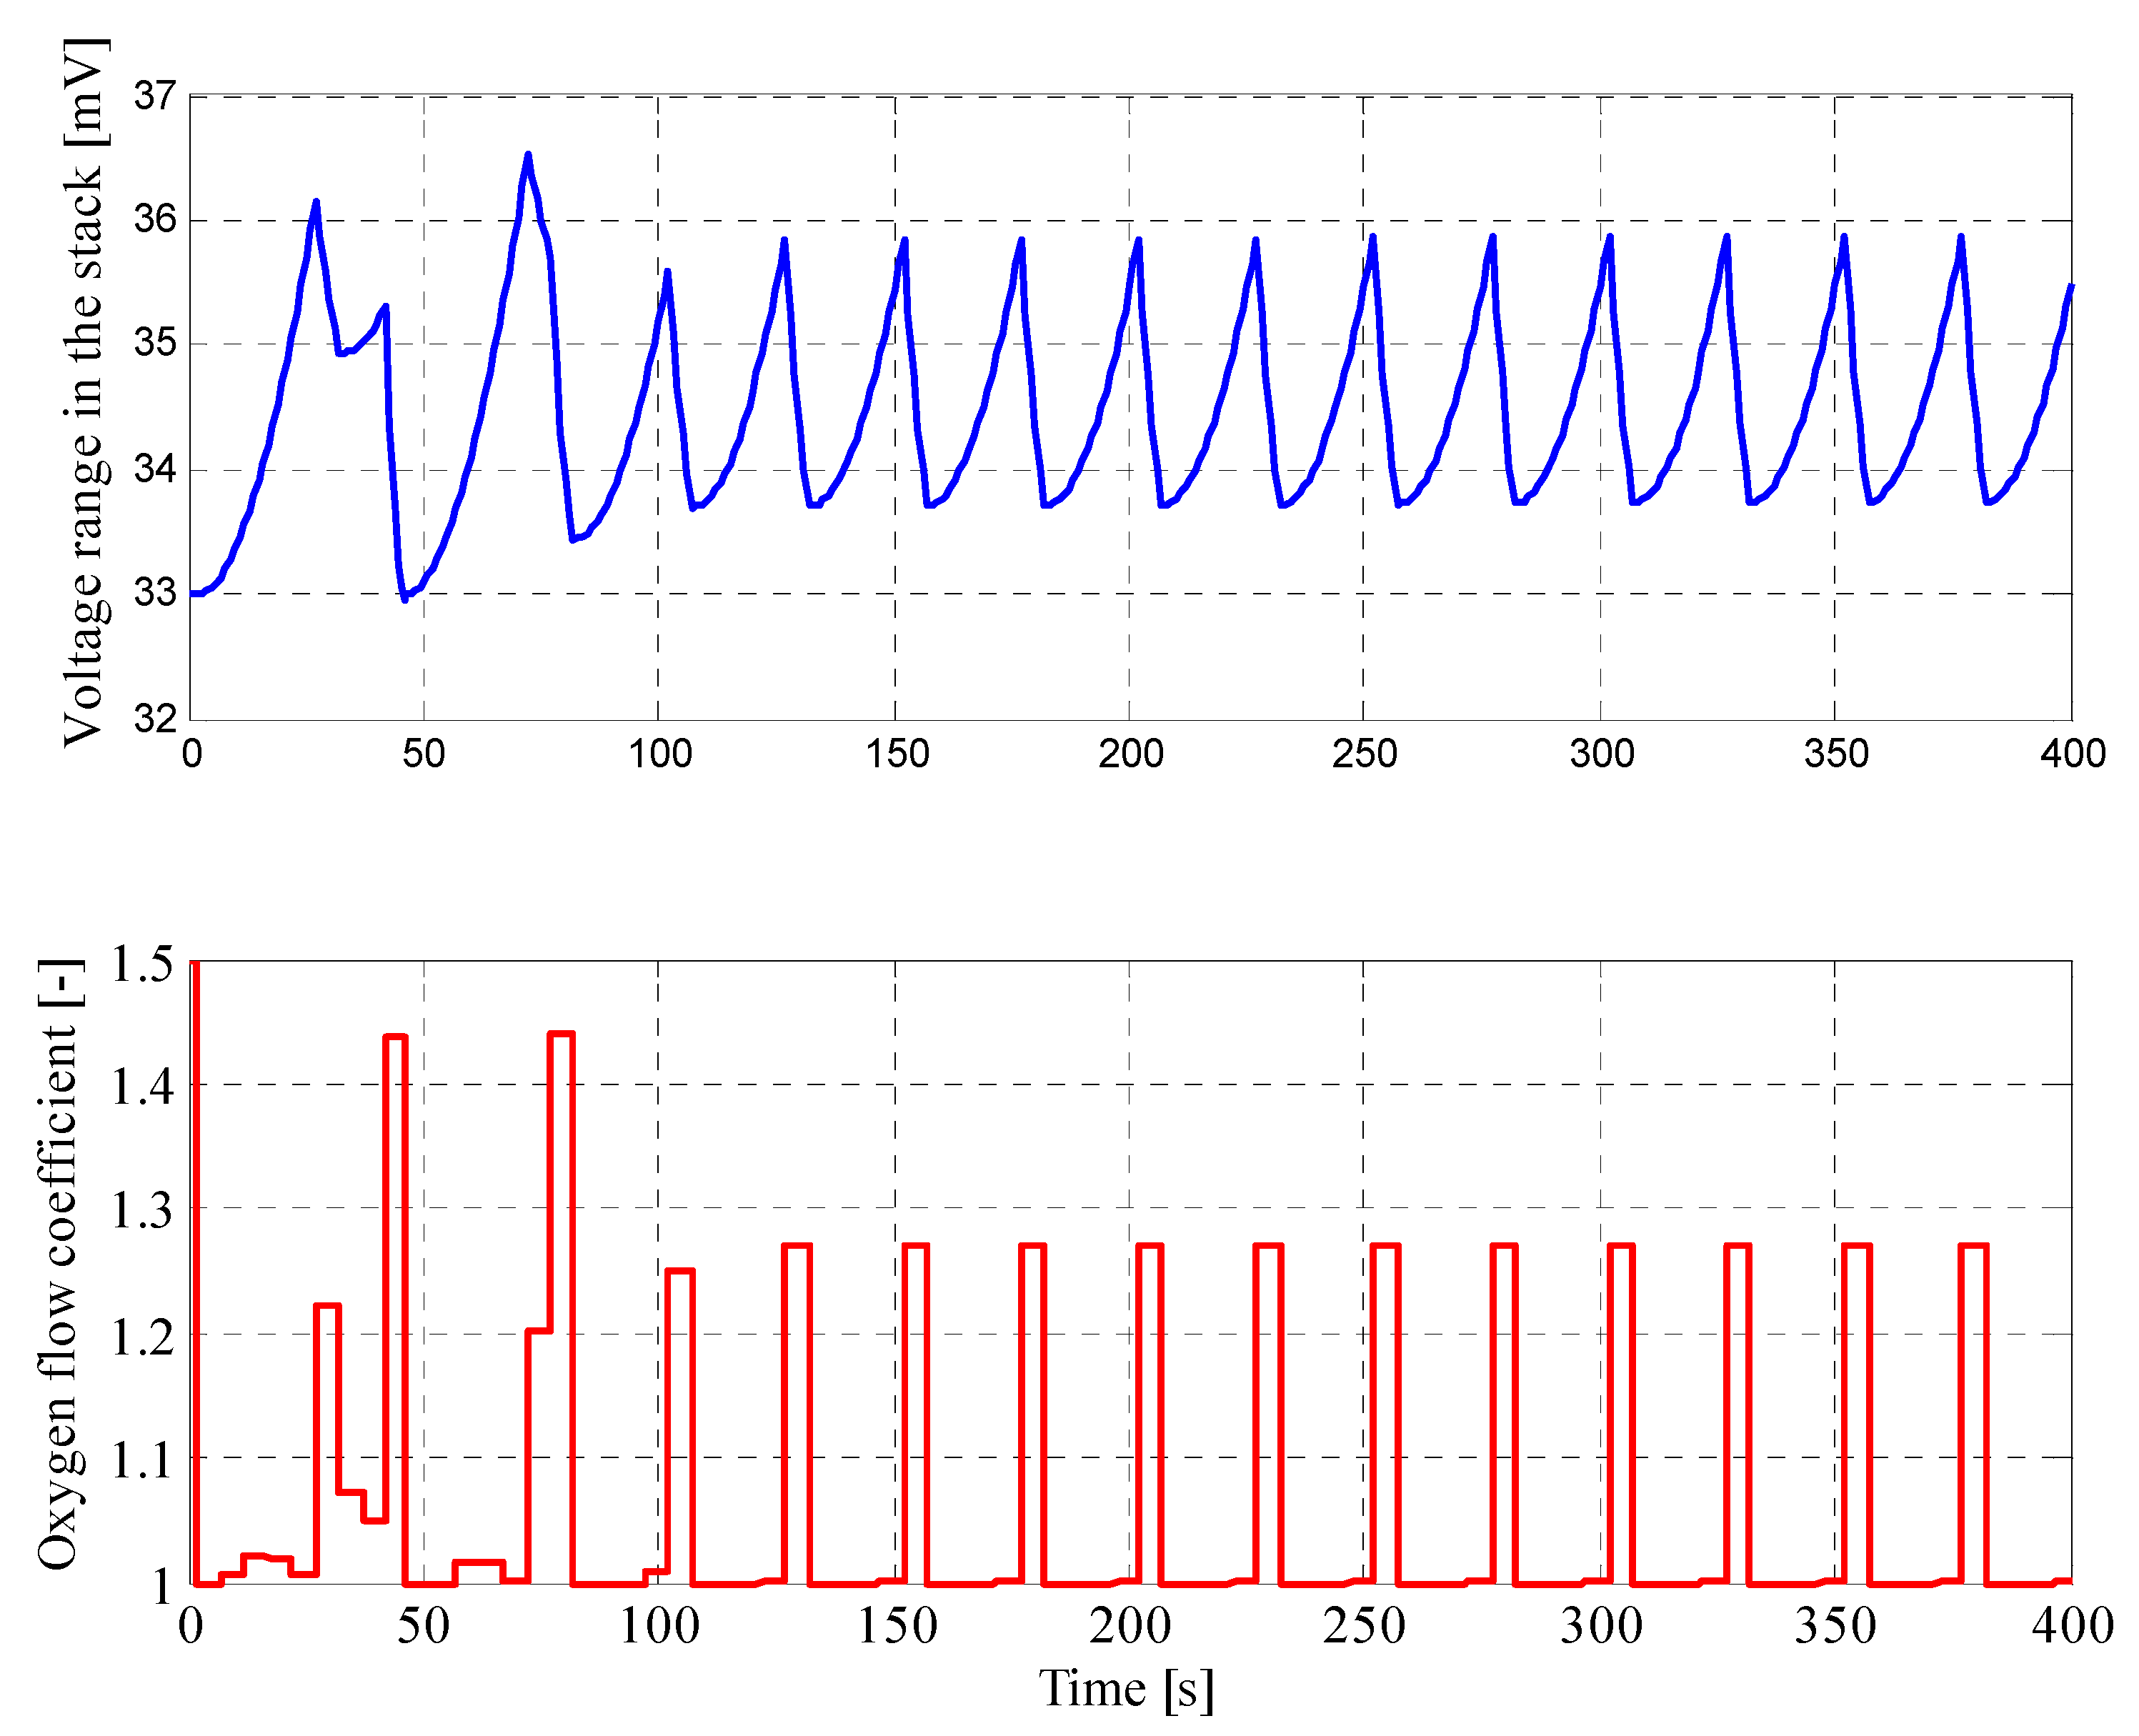
4.1. Results for Fuzzy Control Procedure of Oxygen Flow with Manually Selected Parameters
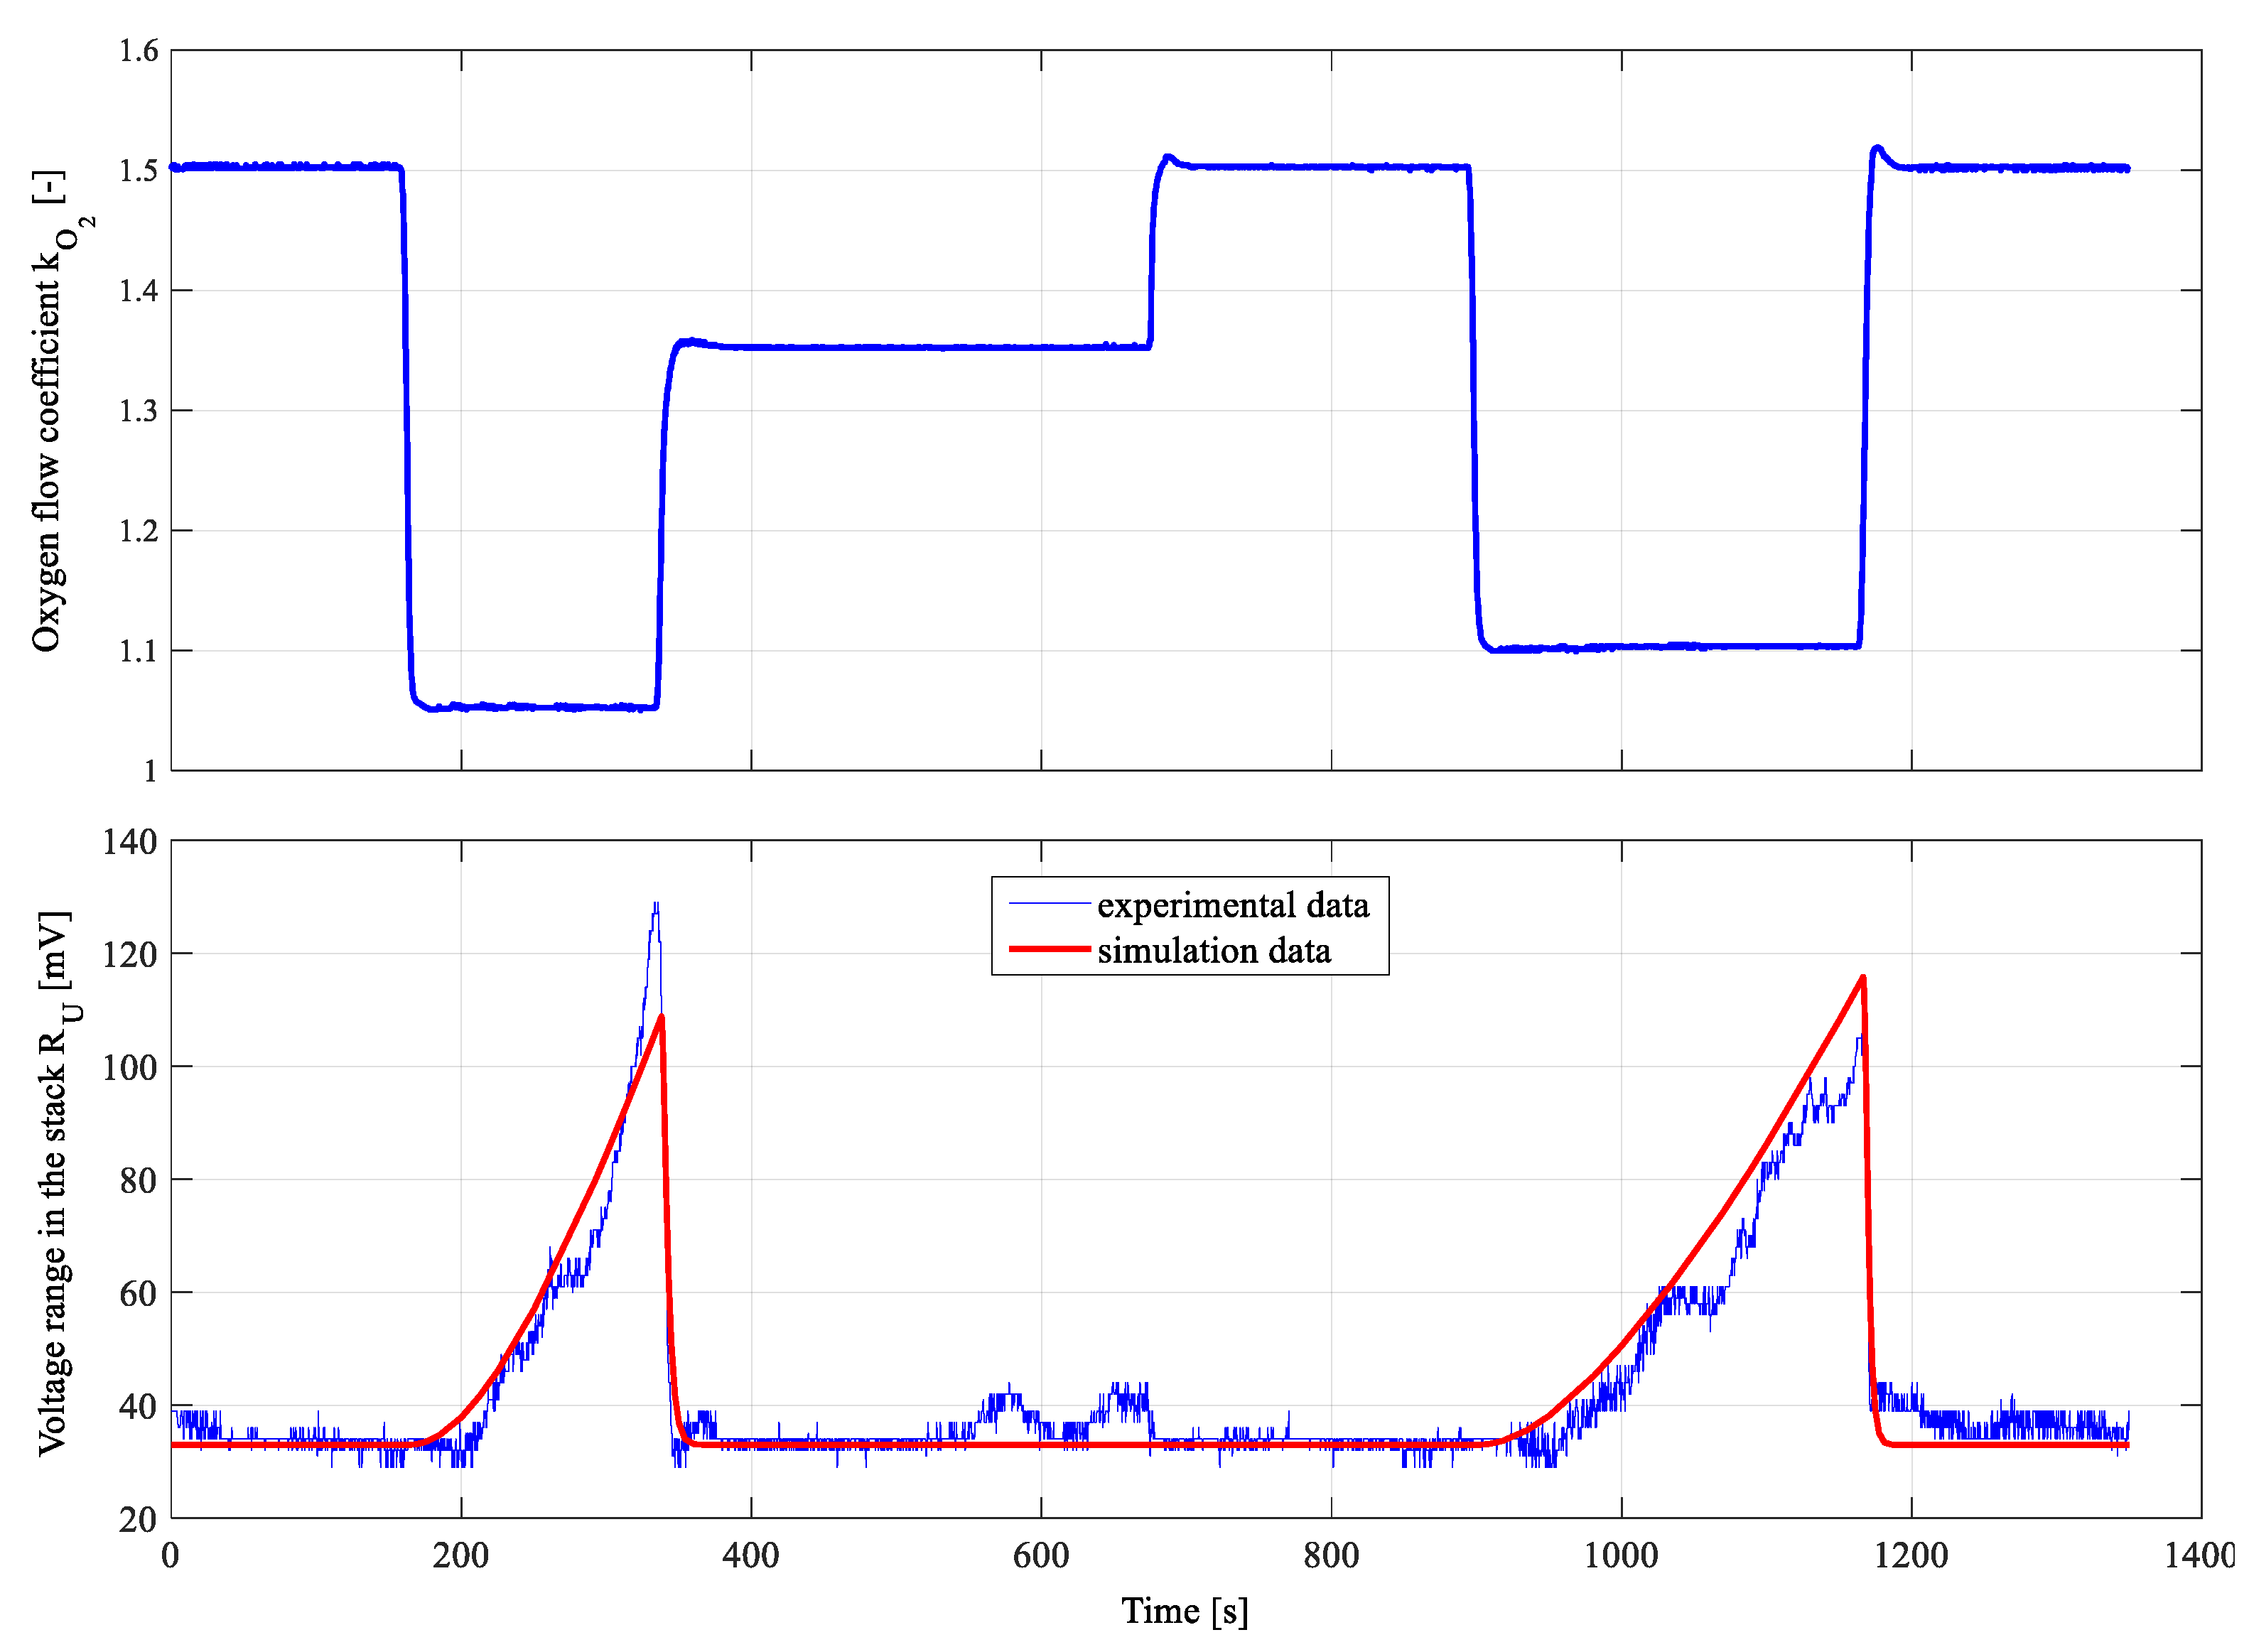
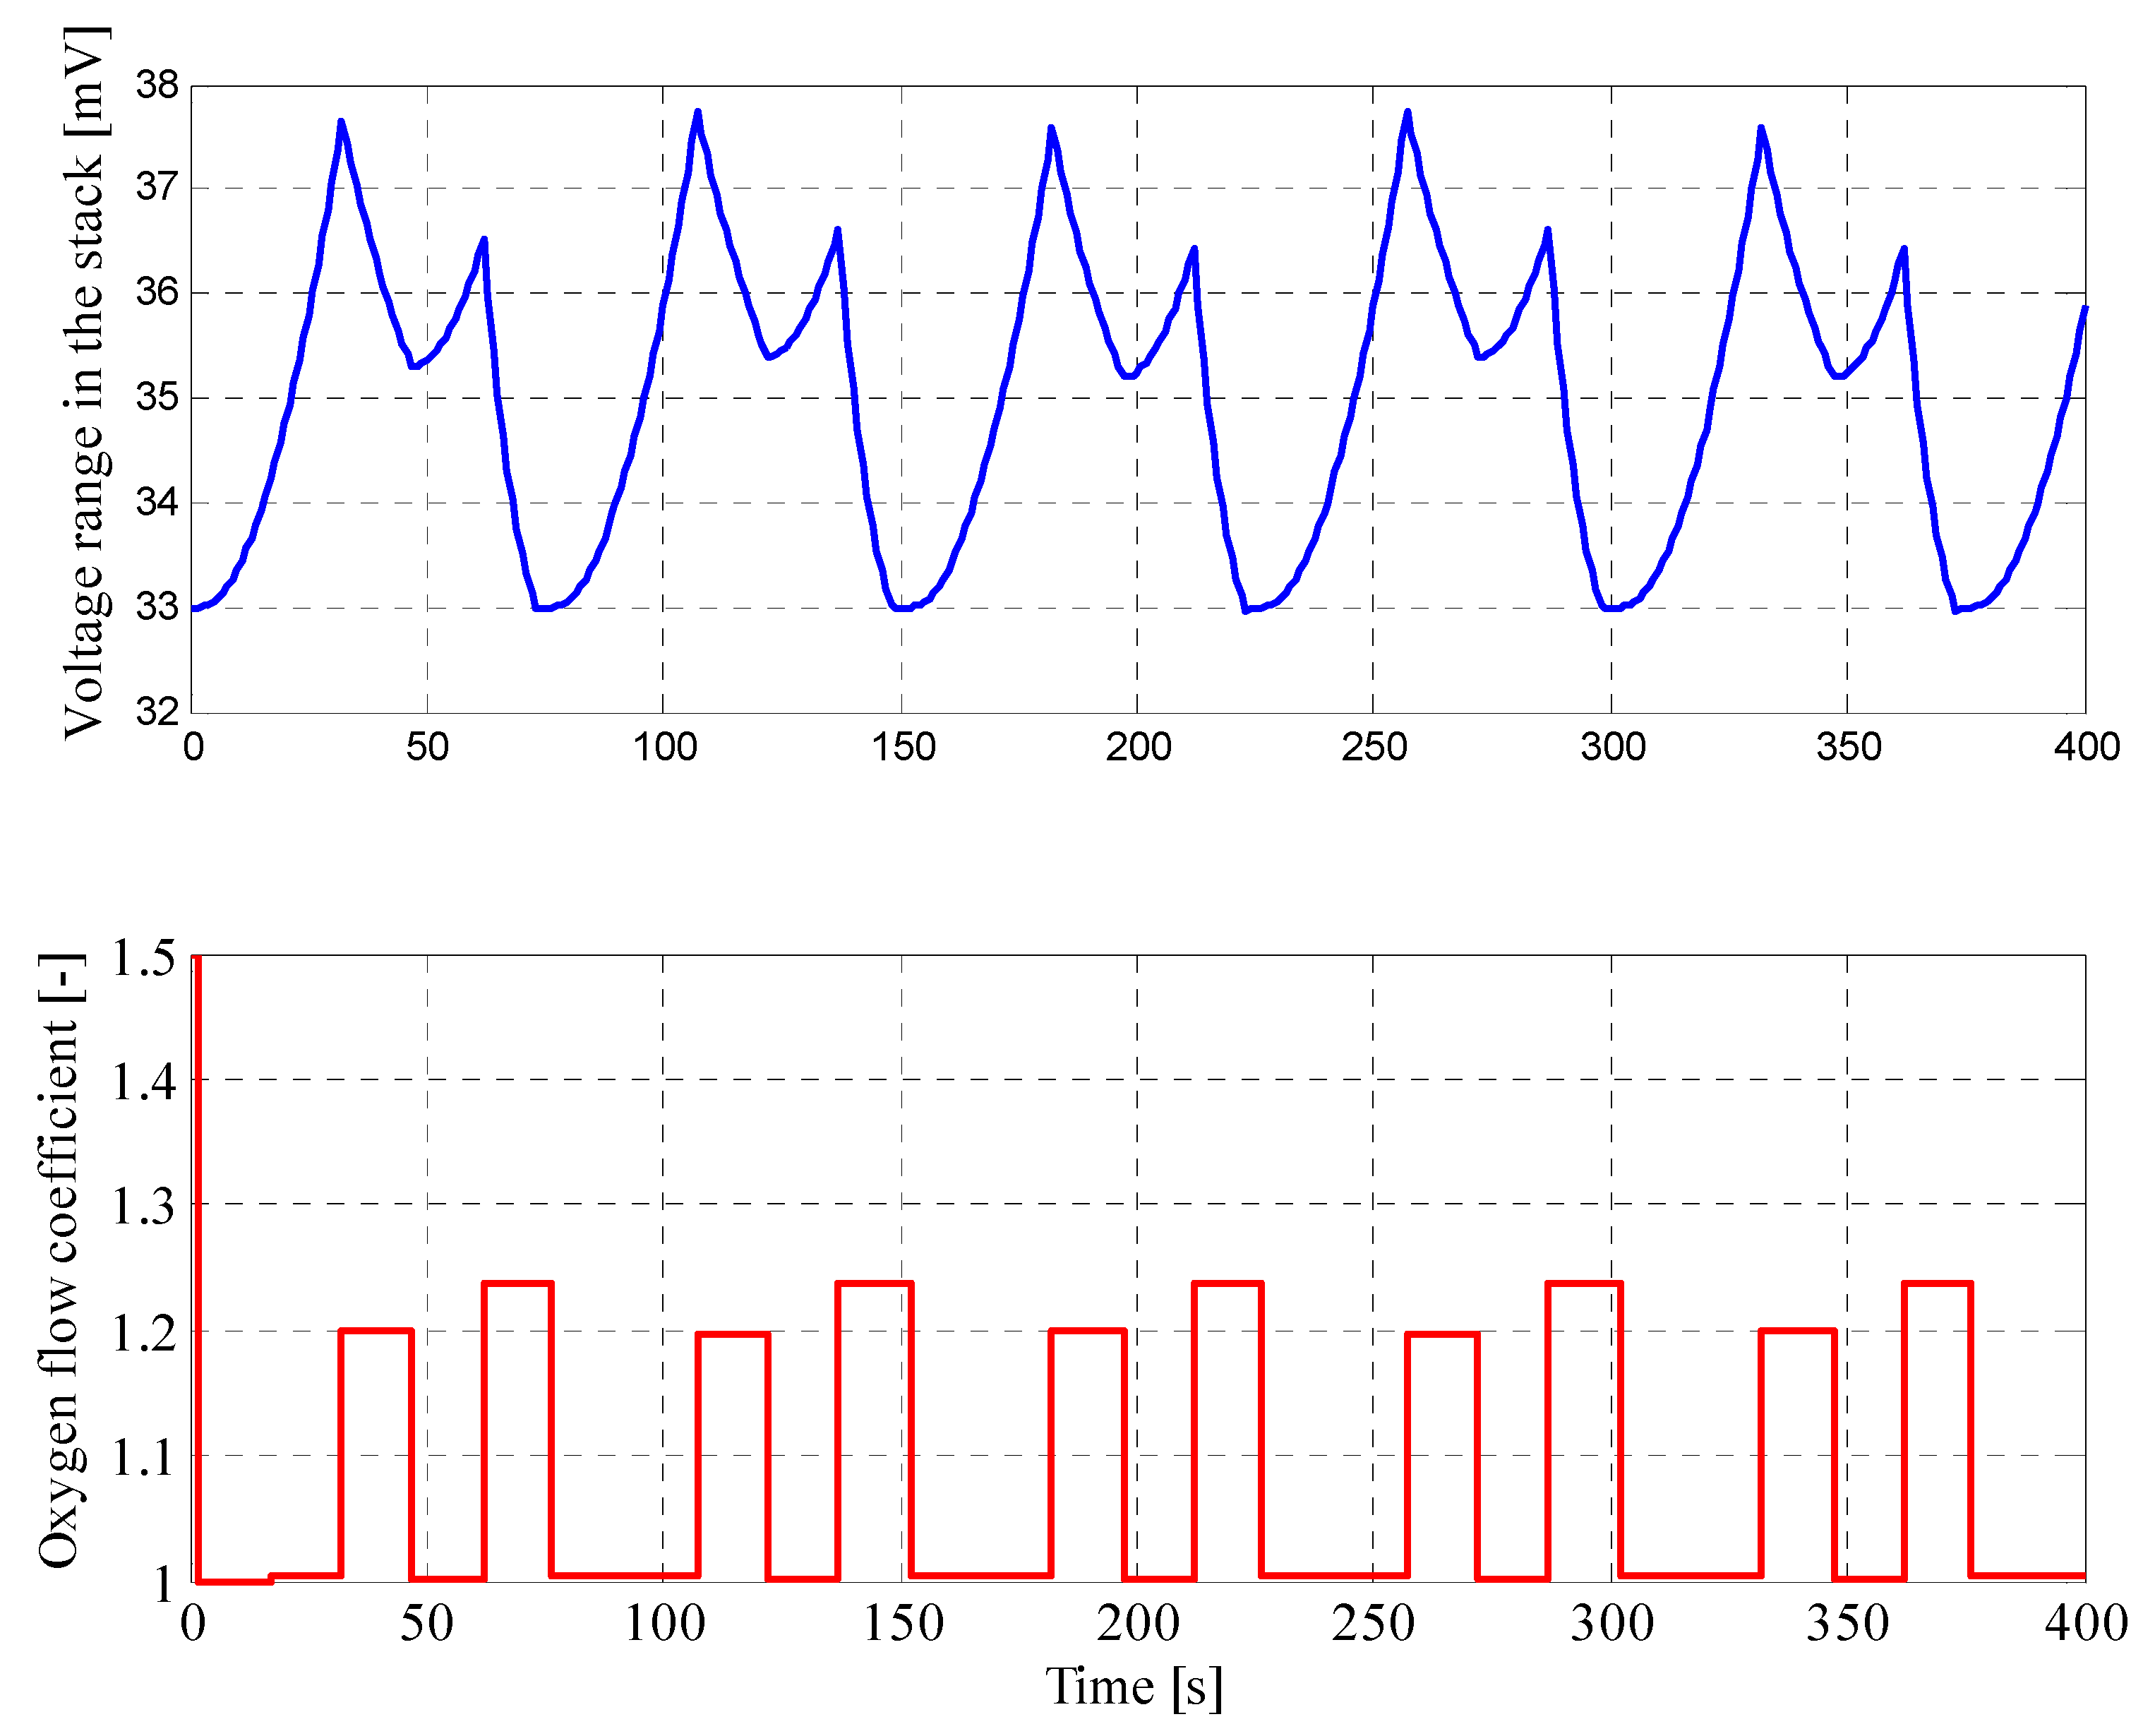
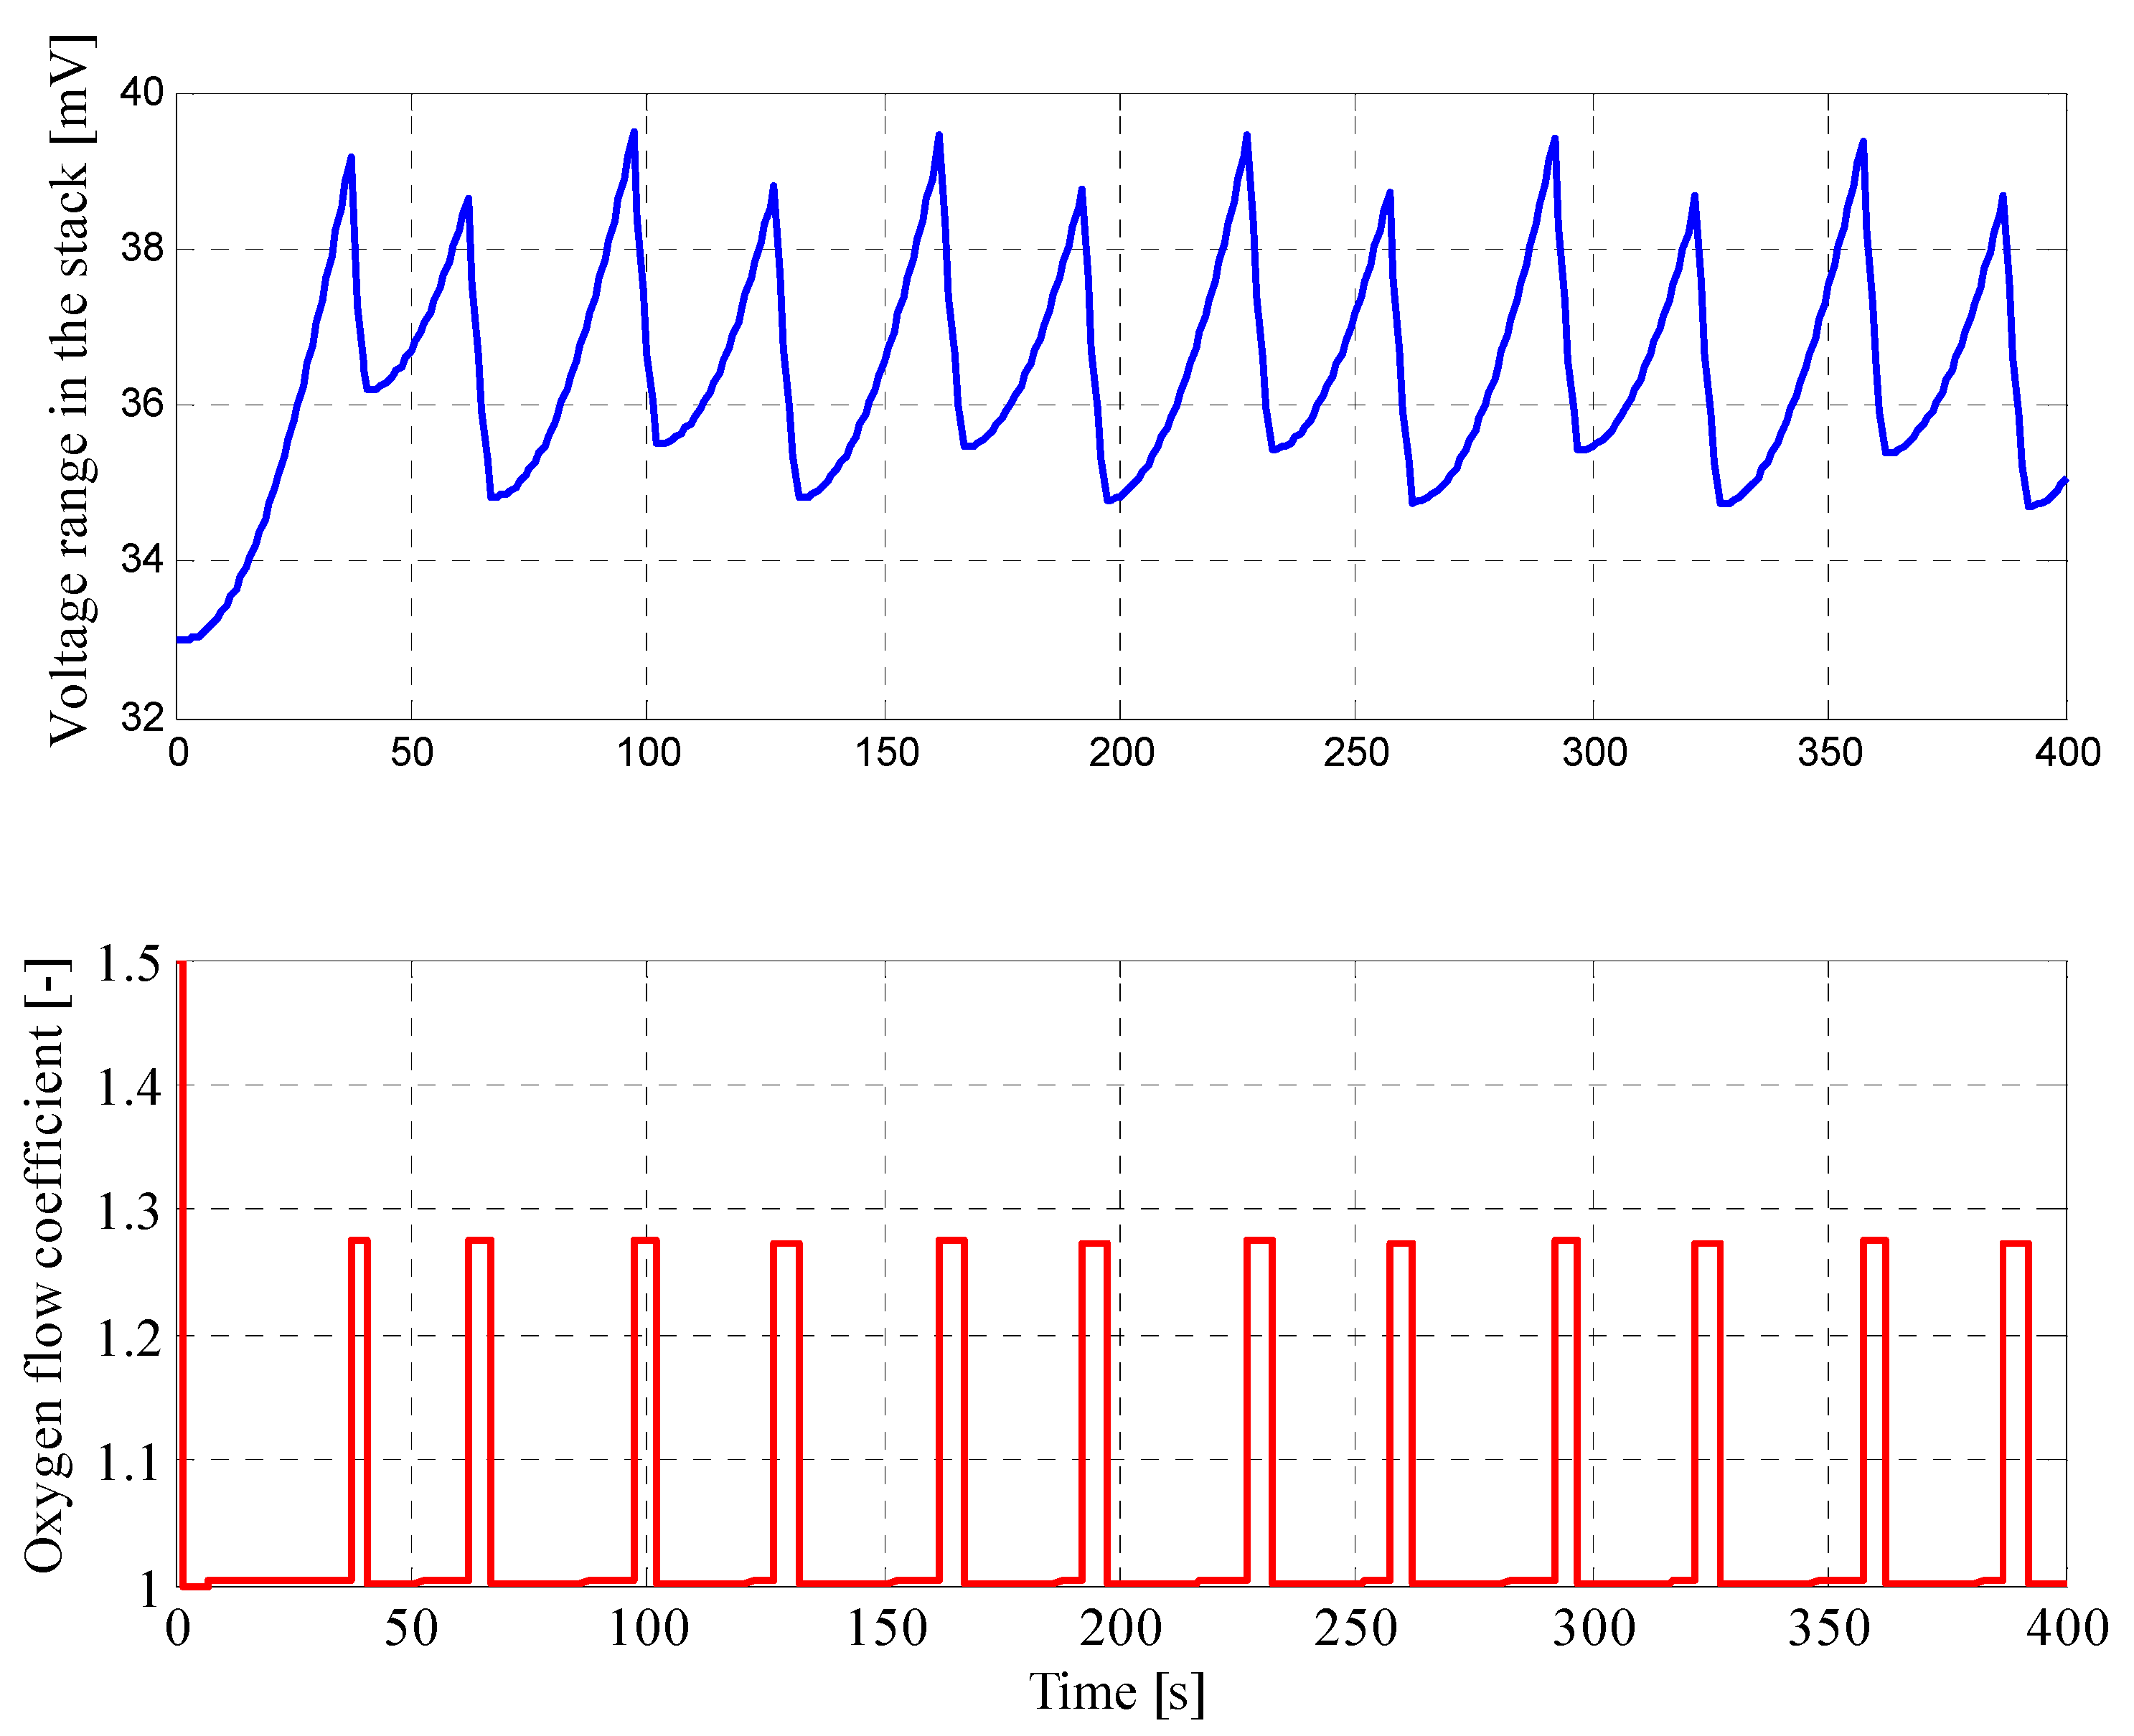
4.2. Results for Fuzzy Control Procedure of Oxygen Flow with Parameters Determined by Genetic Algorithms
5. Conclusions
Funding
Conflicts of Interest
References
- STO/NATO Technical Report, TR-SET-173-Part-II: Fuel Cells and Other Emerging Manportable Power Technologies for the NATO Warfighter–Part II: Power Sources for Unmanned Applications. 2014. Available online: https://www.sto.nato.int/publications/STO%20Technical%20Reports/STO-TR-SET-173-Part-II/$$TR-SET-173-Part-II-ALL.pdf (accessed on 28 March 2020).
- Barbir, F. PEM Fuel Cell Theory and Practice; Elsevier: Amsterdam, The Netherlands; Academic Press: Cambridge, MA, USA, 2005; ISBN 978-0-12-078142-3. [Google Scholar]
- Larminie, J.; Dicks, A. Fuel Cell Systems Explained; Wiley: New York, NY, USA, 2003; Volume 2, ISBN 047084857X. [Google Scholar]
- Cai, Q.; Brett, D.J.L.; Browning, D.; Brandon, N.P. A sizing-design methodology for hybrid fuel cell power systems and its application to an unmanned underwater vehicle. J. Power Source 2010, 195, 6559–6569. [Google Scholar] [CrossRef]
- EG&G Technical Services, Inc. Fuel Cell Handbook, 7th ed.; EG&G Technical Services, Inc.: Las Vegas, NV, USA, 2016. [Google Scholar]
- Thomas, D. Submarine Developments: Air-Independent Propulsion. Can. Naval Rev. 2008, 3, 35–36. [Google Scholar]
- Mart, P.L.; Margeridis, J. Fuel Cell Air Independent Propulsion of Submarines; Defence Science and Technology Group: Canberra, Australia, 1995. [Google Scholar]
- Pein, M. Fuel cells ideal for demanding maritime applications. Fuel Cells Bull. 2012, 2012, 14–15. [Google Scholar] [CrossRef]
- Barbir, F. PEM Fuel Cells. In Fuel Cell Technology; Springer: London, UK, 2006; pp. 27–51. ISBN 978-1-84628-207-2. [Google Scholar]
- Pukrushpan, J.T.; Stefanopoulou, A.G.; Peng, H. Modeling and Control for PEM Fuel Cell Stack System. In Proceedings of the American Control Conference, Anchorage, AK, USA, 8–10 May 2002; Volume 4, pp. 3117–3122. [Google Scholar]
- Daud, W.R.W.; Rosli, R.E.; Majlan, E.H.; Hamid, S.A.A.; Mohamed, R.; Husaini, T. PEM fuel cell system control: A review. Renew. Energy 2017, 113, 620–638. [Google Scholar] [CrossRef]
- Kulikovsky, A.A.; Kucernak, A.; Kornyshev, A.A. Feeding PEM fuel cells. Electrochim. Acta 2005, 50, 1323–1333. [Google Scholar] [CrossRef]
- Kulikovsky, A. Polarization curve of a non-uniformly aged pem fuel cell. Energies 2014, 7, 351–364. [Google Scholar] [CrossRef]
- Dalvi, A.; Guay, M. Control and real-time optimization of an automotive hybrid fuel cell power system. Control Eng. Pract. 2009, 17, 924–938. [Google Scholar] [CrossRef]
- Shih, N.C.; Weng, B.J.; Lee, J.Y.; Hsiao, Y.C. Development of a 20 kW generic hybrid fuel cell power system for small ships and underwater vehicles. Int. J. Hydrogen Energy 2014, 39, 13894–13901. [Google Scholar] [CrossRef]
- Hatti, M.; Tioursi, M. Dynamic neural network controller model of PEM fuel cell system. Int. J. Hydrogen Energy 2009, 34, 5015–5021. [Google Scholar] [CrossRef]
- Williams, J.G.; Liu, G.; Chai, S.; Rees, D. Intelligent control for improvements in PEM fuel cell flow performance. Int. J. Autom. Comput. 2008, 5, 145–151. [Google Scholar] [CrossRef]
- Garus, J. Modeling of fuel cell energy system for use in auv. Int. J. Arts Sci. 2013, 6, 15–22. [Google Scholar]
- Linden, D.; Reddy, T.B. Handbook of Batteries, 3rd ed.; The McGraw Companies: New York, NY, USA, 2002; ISBN 0071359788. [Google Scholar]
- Rayment, C.; Sherwin, S. Introduction to Fuel Cell Technology. Dep. Aerosp. Mech. Eng. Univ. Notre Dame 2003, 46556, 11–12. [Google Scholar]
- Woo, C.H.; Benziger, J.B. PEM fuel cell current regulation by fuel feed control. Chem. Eng. Sci. 2007, 62, 957–968. [Google Scholar] [CrossRef]
- Garus, J.; Polak, A. Piecewise control method of oxygen flow in PEM fuel cell. In Mechatronics: Ideas, Challenges, Solutions and Applications; Springer: Cham, Switzerland, 2016; Volume 414. [Google Scholar]
- Niroumand, A.M.; Mérida, W.; Saif, M. PEM fuel cell low flow FDI. J. Process Control 2011, 21, 602–612. [Google Scholar] [CrossRef]
- Al-Dabbagh, A.W.; Lu, L.; Mazza, A. Modelling, simulation and control of a proton exchange membrane fuel cell (PEMFC) power system. Int. J. Hydrogen Energy 2010, 35, 5061–5069. [Google Scholar] [CrossRef]
- Rgab, O.; Yu, D.L.; Gomm, J.B. Polymer electrolyte membrane fuel cell control with feed-forward and feedback strategy. Int. J. Eng. Sci. Technol. 2010, 2, 56–66. [Google Scholar] [CrossRef][Green Version]
- Methekar, R.N.; Prasad, V.; Gudi, R.D. Dynamic analysis and linear control strategies for proton exchange membrane fuel cell using a distributed parameter model. J. Power Source 2007, 165, 152–170. [Google Scholar] [CrossRef]
- Alizadeh, E.; Khorshidian, M.; Saadat, S.H.M.; Rahgoshay, S.M.; Rahimi-Esbo, M. The experimental analysis of a dead-end H2/O2 PEM fuel cell stack with cascade type design. Int. J. Hydrogen Energy 2017, 42, 11662–11672. [Google Scholar] [CrossRef]
- Garcia-Gabin, W.; Dorado, F.; Bordons, C. Real-time implementation of a sliding mode controller for air supply on a PEM fuel cell. J. Process Control 2010, 20, 325–336. [Google Scholar] [CrossRef]
- Rodatz, P.; Paganelli, G.; Sciarretta, A.; Guzzella, L. Optimal power management of an experimental fuel cell/supercapacitor- powered hybrid vehicle. Control Eng. Pract. 2005, 13, 41–53. [Google Scholar] [CrossRef]
- Rojas, A.C.; Lopez, G.L.; Gomez-Aguilar, J.F.; Alvarado, V.M.; Torres, C.L.S. Control of the air supply subsystem in a PEMFC with balance of plant simulation. Sustainability 2017, 9, 73. [Google Scholar] [CrossRef]
- AbouOmar, M.S.; Zhang, H.J.; Su, Y.X. Fractional order fuzzy PID control of automotive PEM fuel cell air feed system using neural network optimization algorithm. Energies 2019, 12, 1435. [Google Scholar] [CrossRef]
- Morán-Durán, A.; Martínez-Sibaja, A.; Rodríguez-Jarquin, J.P.; Posada-Gómez, R.; González, O.S. PEM fuel cell voltage neural control based on hydrogen pressure regulation. Processes 2019, 7, 434. [Google Scholar] [CrossRef]
- Ariza, H.E.; Correcher, A.; Sánchez, C.; Pérez-Navarro, Á.; García, E. Thermal and electrical parameter identification of a proton exchange membrane fuel cell using genetic algorithm. Energies 2018, 11, 2099. [Google Scholar] [CrossRef]
- Derbeli, M.; Barambones, O.; Sbita, L. A robust maximum power point tracking control method for a PEM fuel cell power system. Appl. Sci. 2018, 8, 2449. [Google Scholar] [CrossRef]
- Pukrushpan, J.T.; Stefanopoulou, A.G.; Varigonda, S.; Pedersen, L.M.; Ghosh, S.; Peng, H. Control of natural gas catalytic partial oxidation for hydrogen generation in fuel cell applications. IEEE Trans. Control Syst. Technol. 2005, 13, 3–14. [Google Scholar] [CrossRef]
- Jiao, K.; Park, J.; Li, X. Experimental investigations on liquid water removal from the gas diffusion layer by reactant flow in a PEM fuel cell. Appl. Energy 2010, 87, 2770–2777. [Google Scholar] [CrossRef]
- Kim, S.I.; Baik, K.D.; Kim, B.J.; Lee, N.W.; Kim, M.S. Experimental study on mitigating the cathode flooding at low temperature by adding hydrogen to the cathode reactant gas in PEM fuel cell. Int. J. Hydrogen Energy 2013, 38, 1544–1552. [Google Scholar] [CrossRef]
- Kunusch, C.; Puleston, P.F.; Mayosky, M.A.; Fridman, L. Control Engineering Practice Experimental results applying second order sliding mode control to a PEM fuel cell based system. Control Eng. Pract. 2013, 21, 719–726. [Google Scholar] [CrossRef]
- Mendez, A.; Leo, T.J.; Herreros, M.A. Fuel Cell Power Systems for Autonomous Underwater Vehicles: State of the Art. In Proceedings of the 1st International e-Conference on Energies, e-Conference, Basel, Switzerland, 14–31 March 2014; pp. 1–19. [Google Scholar]
- Mendez, A.; Leo, T.; Herreros, M. Current State of Technology of Fuel Cell Power Systems for Autonomous Underwater Vehicles. Energies 2014, 7, 4676–4693. [Google Scholar] [CrossRef]
- Grzeczka, G.; Polak, A. Fuel cells for autonomous underwater vehicles. In Solid State Phenomena; Trans Tech Publications: Zurich, Switzerland, 2013; Volume 198. [Google Scholar]
- Ghosh, P.C.; Vasudeva, U. Analysis of 3000T class submarines equipped with polymer electrolyte fuel cells. Energy 2011, 36, 3138–3147. [Google Scholar] [CrossRef]
- Weaver, G. Marine applications of fuel cell technology. Fuel Cells Bull. 2003, 2003, 11–12. [Google Scholar] [CrossRef]
- Lee, C.-H.; Yang, J.-T. Modeling of the Ballard-Mark-V proton exchange membrane fuel cell with power converters for applications in autonomous underwater vehicles. J. Power Sources 2011, 196, 3810–3823. [Google Scholar] [CrossRef]
- Burke, A.A.; Carreiro, L.G. System modeling of an air-independent solid oxide fuel cell system for unmanned undersea vehicles. J. Power Sources 2006, 158, 428–435. [Google Scholar] [CrossRef]
- Aoki, T.; Hyakudome, T.; Murashima, T.; Tsukioka, S.; Nakajoh, H. Cruising Autonomous Underwater Vehicle URASHIMA. In Proceedings of the Twelfth (2002) International Offshore and Polar Engineering Conference, Kitakyoushu, Japan, 26–31 May 2002; pp. 315–318. [Google Scholar]
- Maeda, T.T. Toshio, Yokoyama Kazuhisa, Hisatome Nagao, Ishiguro Shinji, Hirokawa Kiyoshi. Fuel Cell Auv Urashima. Tech. Rev. 2006, 43, 24–25. [Google Scholar]
- Maeda, T.; Ishiguro, S.; Yokoyama, K.; Hirokawa, K.; Hashimoto, A.; Okuda, Y.; Tani, T. Development of Fuel Cell AUV. Mitsubishi Heavy Ind. Ltd. Tech. Rev. 2004, 41, 344–347. [Google Scholar]
- Yoshida, H.; Hyakudome, T.; Ishibashi, S.; Sawa, T.; Tsukioka, S.; Aoki, T.; Tani, T.; Iwata, M.; Moriga, T. A Compact High Efficiency PEFC System for Underwater Platforms. 2009 Fuel Cell Semin. Expos. 2010, 26, 67–76. [Google Scholar]
- Lakeman, J.B.; Browning, D. The role of fuel cells in the supply of silent power for operations in littoral waters. In Proceedings of the Paper presented at the RTO AVT Symposium on “Novel Vehicle Concepts and Emerging Vehicle Technologies”, Brussels, Belgium, 7–10 April 2003. and published in RTO-MP-104. 2004. [Google Scholar]
- Dhathathreyan, K.S.; Rajalakshmi, N. Polymer electrolyte membrane fuel cell. In Recent Trends in Fuel Cell Science and Technology; Anamaya Publisher: New Delhi, India, 2007; pp. 40–115. [Google Scholar]
- Ross, C.T.F. A conceptual design of an underwater vehicle. Ocean Eng. 2005, 32, 85–99. [Google Scholar] [CrossRef]
- Shih, N.-C.; Weng, B.-J.; Lee, J.-Y.; Hsiao, Y.-C. Development of a small fuel cell underwater vehicle. Int. J. Hydrogen Energy 2013, 38, 11138–11143. [Google Scholar] [CrossRef]
- Hornfeld, W. DeepC the German AUV Development Project; Computer: Long Beach, CA, USA, 1999. [Google Scholar]
- Hornfeld, W. DeepC, the AUV for Ultra-Deep Water; STN ATLAS Elektronik GmbH: Bremen, Germany, 2004. [Google Scholar]
- Davies, K.L.; Moore, R.M. Unmanned Underwater Vehicle Fuel Cell Energy/Power System Technology Assessment. EEE J. Ocean. Eng. 2007, 32, 365–372. [Google Scholar] [CrossRef]
- Davies, K.L.; Moore, R.M. UUV FCEPS Technology Assessment and Design Process. Univ. Hawaii (Manoa) 2006. Available online: https://auvac.org/uploads/publication_pdf/UUV_FCEPS_ReportRev5.pdf (accessed on 28 March 2020).
- Hasvold, Ø.; Størkersen, N. Electrochemical power sources for unmanned underwater vehicles used in deep sea survey operations. J. Power Source 2001, 96, 252–258. [Google Scholar] [CrossRef]
- Kim, M.-J.; Sohn, Y.-J.; Lee, W.-Y. Cathodic Recirculation System Using a Dual-ejector to Improve Oxygen Utilization of a Submarine Fuel Cell. J. Korean Electrochem. Soc. 2010, 13, 193–197. [Google Scholar] [CrossRef]
- Han, I.; Jeong, J.; Kho, B.H.; Shin, K. Development of a PEM Fuel Cell Stack for Dead-End Operation. In Proceedings of the Fuel ell Seminar, Orlando, FL, USA, 31 October–3 November 2011. [Google Scholar]
- Han, I.-S.; Kho, B.-K.; Cho, S. Development of a polymer electrolyte membrane fuel cell stack for an underwater vehicle. J. Power Sources 2016, 304, 244–254. [Google Scholar] [CrossRef]
- Corbo, P.; Migliardini, F.; Veneri, O. Performance investigation of 2.4 kW PEM fuel cell stack in vehicles. Int. J. Hydrogen Energy 2007, 32, 4340–4349. [Google Scholar] [CrossRef]
- Corbo, P.; Migliardini, F.; Veneri, O. Experimental analysis of a 20 kWe PEM fuel cell system in dynamic conditions representative of automotive applications. Energy Convers. Manag. 2008, 49, 2688–2697. [Google Scholar] [CrossRef]
- Polak, A. Optimization of Oxygen Supply Subsystem in PEM Fuel Cells System for Underwater Applications. Ph.D. Thesis, Polish Naval Academy, Gdynia, Poland, 2019. [Google Scholar]
- St-Pierre, J.; Jia, N. Successful Demonstration of Ballard PEMFCS for Space Shuttle Applications. J. New Mater. Electrochem. Syst. 2002, 5, 263–271. [Google Scholar]
- Li, Y.; Zhao, X.; Liu, Z.; Li, Y.; Chen, W.; Li, Q. Experimental Study on the voltage uniformity for dynamic loading of a PEM fuel cell stack. Int. J. Hydrogen Energy 2015, 23, 7361–7369. [Google Scholar] [CrossRef]
- Golnaraghi, F.; Kuo, B.C. Automatic Control Systems; McGraw-Hill Educatio: New York, NY, USA, 2017; ISBN 978-1-259-64383-5. [Google Scholar]
- Polak, A.; Grzeczka, G.; Piłat, T.; Głuski, M. Research and Modeling of Voltage Uniformity of a Stack of Polymer Proton Exchange Membrane Fuel Cells. Polym. Process. 2018, 24, 22–33. (In Polish) [Google Scholar]
- Jeong, K.-S.; Lee, W.-Y.; Kim, C.-S. Energy management strategies of a fuel cell/battery hybrid system using fuzzy logics. J. Power Sources 2005, 145, 319–326. [Google Scholar] [CrossRef]
- Tekin, M.; Hissel, D.; Pera, M.C.; Kauffman, J.M. Energy management strategy for embedded fuel cell system using fuzzy logic. IEEE Trans. Ind. Electron. 2004, 54, 501–506. [Google Scholar]
- Li, C.-Y.; Liu, G.-P. Optimal fuzzy power control and management of fuel cell/battery hybrid vehicles. J. Power Sources 2009, 192, 525–533. [Google Scholar] [CrossRef]
- Zadeh, L.A. Fuzzy sets. Inf. Control 1965, 8, 338–353. [Google Scholar] [CrossRef]
- Sakhare, A.; Davari, A.; Feliachi, A. Fuzzy logic control of fuel cell for stand-alone and grid connection. J. Power Sources 2004, 135, 165–176. [Google Scholar] [CrossRef]
- Goldberg, D.E. Genetic Algorithms in Search, Optimization and Machine Learning, 1st ed.; Addison-Wesley Longman Publishing Co., Inc.: Boston, MA, USA, 1989; ISBN 0201157675. [Google Scholar]
- Michalewicz, Z. Genetic Algorithms + Data Structures = Evolution Programs; Springer: Berlin/Heidelberg, Germnay, 1996; ISBN 978-3-642-08233-7. [Google Scholar]


| Parameter | Value |
|---|---|
| p1 | −6.356 |
| q1 | 1.399 |
| q2 | −1.289 |
| 1.183 | |
| 33 |
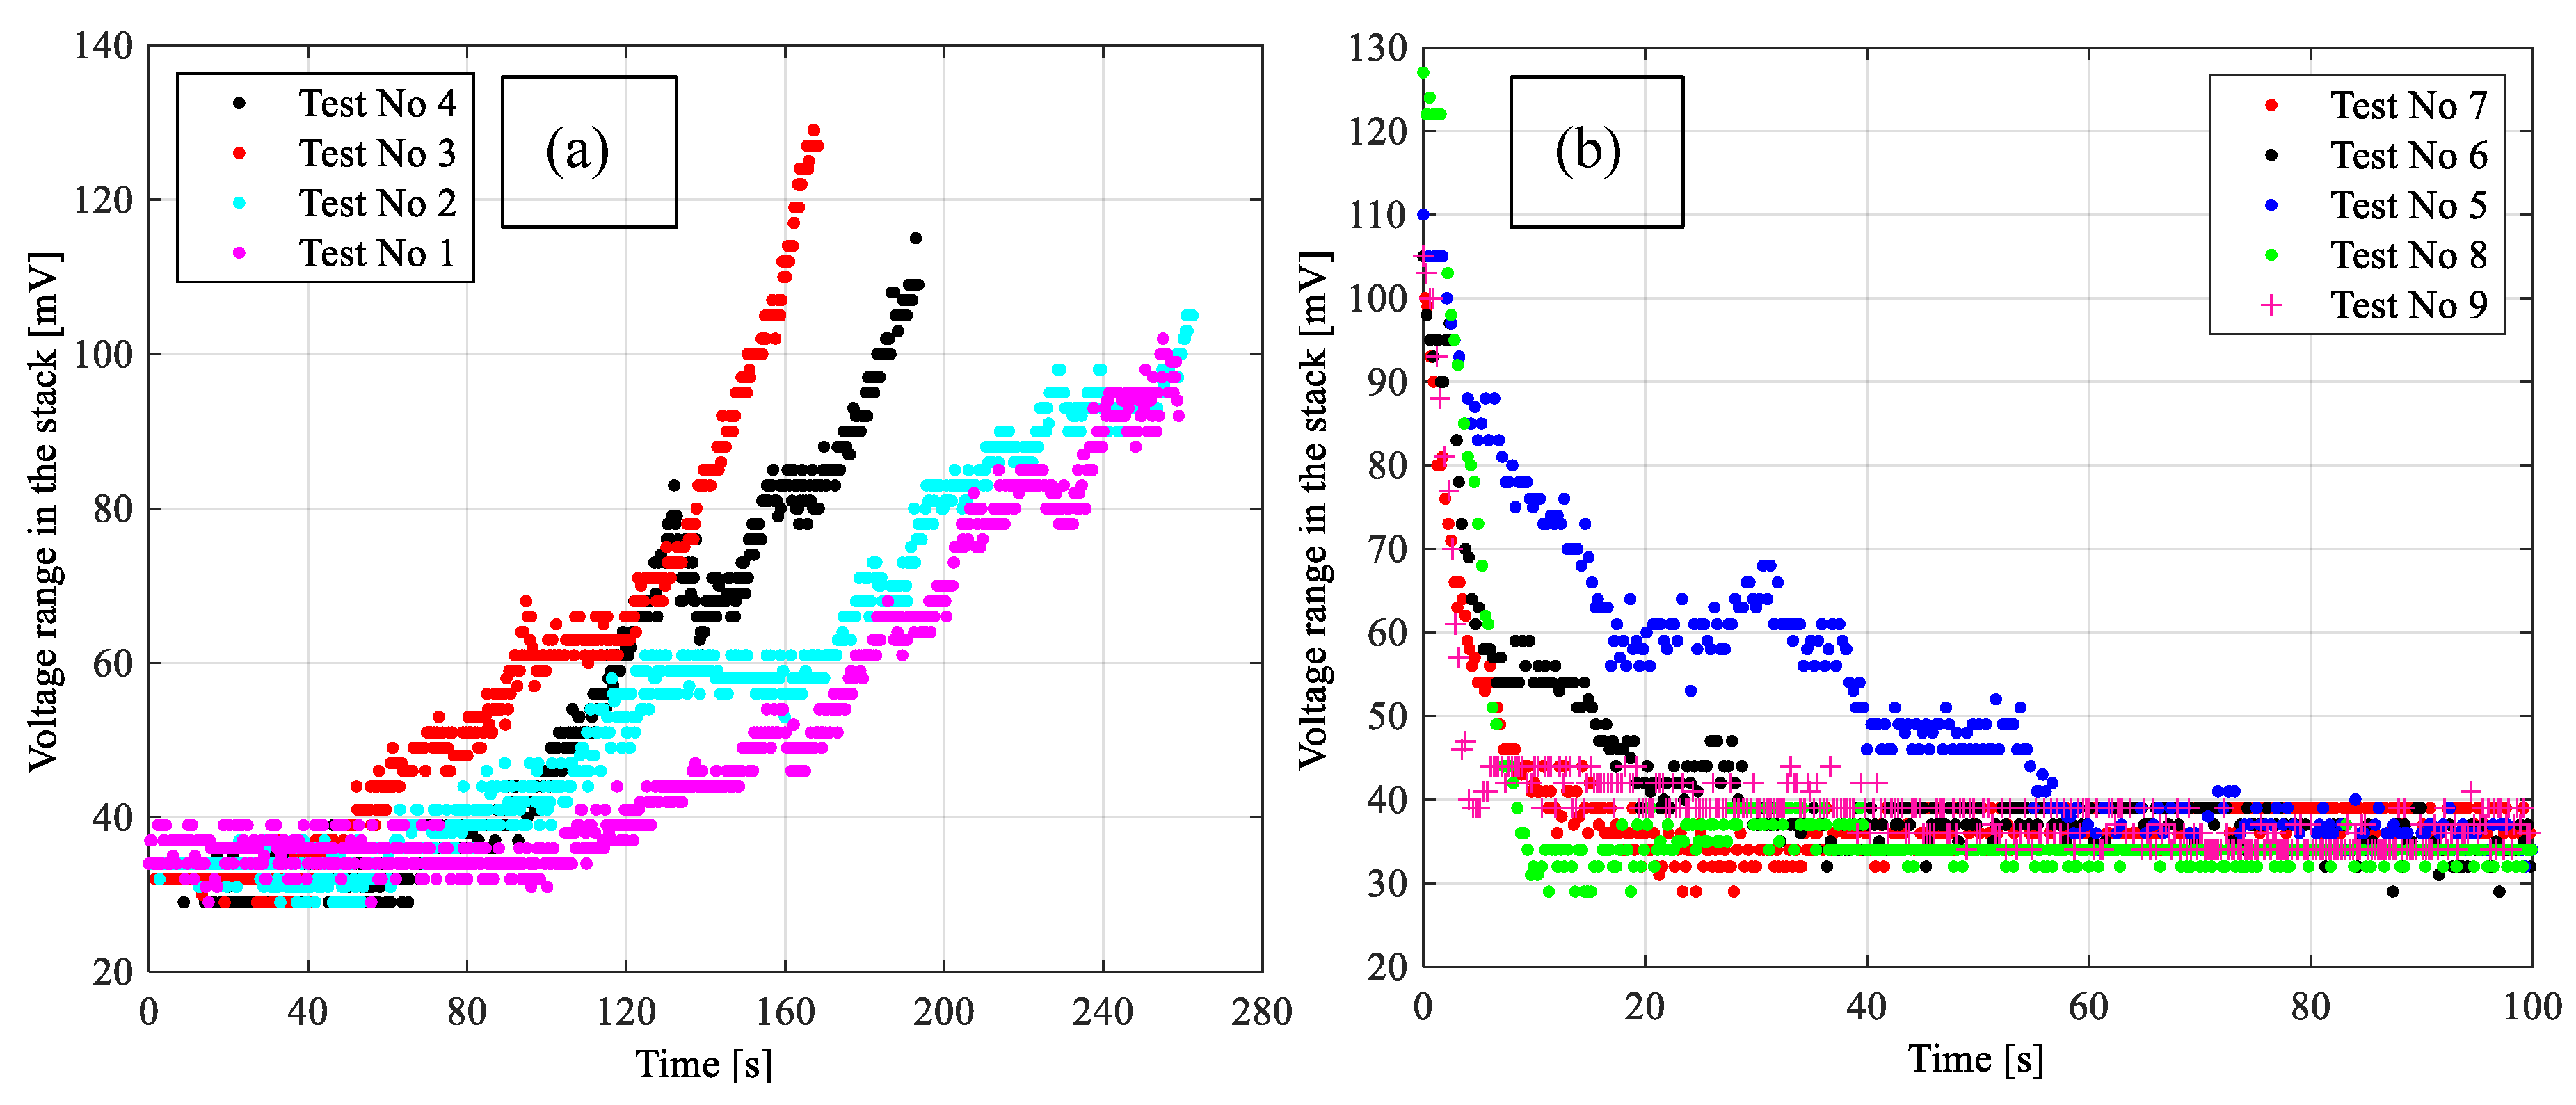
| Test Number | Initial Value of kO2 | Step Value of kO2 |
|---|---|---|
| Part 1—Step Decrease in Oxygen Stoichiometry kO2 | ||
| 1 | 1.50 | 1.15 |
| 2 | 1.50 | 1.10 |
| 3 | 1.50 | 1.05 |
| 4 | 1.50 | 1.00 |
| Part 2—Step Increase in Oxygen Stoichiometry kO2 | ||
| 5 | 1.00 | 1.20 |
| 6 | 1.00 | 1.25 |
| 7 | 1.00 | 1.30 |
| 8 | 1.00 | 1.35 |
| 9 | 1.00 | 1.50 |
| Parameter | Unit | Value |
|---|---|---|
| Nominal power | W | 6000 |
| Number of cells | - | 68 |
| Idle voltage | V | 68 |
| Nominal voltage | V | 40 |
| Nominal current | A | 150 |
| Maximal current | A | 250 |
| Cell active area | cm2 | 200 |
| Operating temperature | °C | 55–65 |
| Cathode pressure | bar | 1 |
| Oxygen pressure drop | mbar | <150 at max power |
| Anode pressure | bar | 1.25 |
| Hydrogen pressure drop | mbar | <100 at max power |
| MEA pressure difference | bar | <0.3 |
| Oxygen purity | % | 99.999 |
| Hydrogen purity | % | 99.999 |
| No. | Rule |
|---|---|
| 1. | If VRE is positive and IVRE is positive, then OFC is small |
| 2. | If VRE is positive and IVRE is close to zero, then OFC is very small |
| 3. | If VRE is positive and IVRE is negative, then OFC is very small |
| 4. | If VRE is close to zero and IVRE is positive, then OFC is medium |
| 5. | If VRE is close to zero and IVRE is close to zero, then OFC is medium |
| 6. | If VRE is close to zero and IVRE is negative, then OFC is small |
| 7. | If VRE is negative and IVRE is positive, then OFC is very big |
| 8. | If VRE is negative and IVRE is close to zero, then OFC is big |
| 9. | If VRE is negative and IVRE is negative, then OFC is medium |
| Parameter | a11 a13 | a12 a14 a16 | a15 a17 | b11 b13 | b12 b14 b16 | b15 b17 | k1 | k2 | k3 | k4 | k5 |
|---|---|---|---|---|---|---|---|---|---|---|---|
| Value | −1.4 | 0 | 1.4 | −0.5 | 0 | 0.5 | 1 | 1.125 | 1.25 | 1.375 | 1.5 |
| Parameter | Value |
|---|---|
| Crossover | 0.8 |
| Mutation | 0.02 |
| Population size | 200 |
| Number of generations | 200 |
| Parameter | a11 | a12 | a15 | b11 | b15 | k1 | k2 | k3 | k4 | k5 |
|---|---|---|---|---|---|---|---|---|---|---|
| and = 5 s | ||||||||||
| Value | −0.022 | 0.209 | 2.55 | −17.3 | 0.54 | 1.062 | 1 | 1 | 1.48 | 1.073 |
| and = 10 s | ||||||||||
| Value | 0.104 | 0.208 | 0.582 | −13.1 | 1.041 | 1.061 | 1.002 | 1.33 | 1.055 | 1.33 |
| and = 15 s | ||||||||||
| Value | 0.466 | 0.72 | 0.8 | −16.12 | 0.86 | 1.003 | 1.005 | 1.179 | 1.247 | 1 |
| and = 5 s | ||||||||||
| Value | 0.381 | 0.385 | 0.554 | −10.02 | 1.074 | 1.003 | 1 | 1.275 | 1.109 | 1.104 |
| and = 10 s | ||||||||||
| Value | 0.227 | 0.256 | 0.284 | −6.912 | 0.228 | 1.001 | 1.002 | 1.214 | 1.227 | 1.004 |
| and = 15 s | ||||||||||
| Value | −1.136 | −0.5 | 2.489 | −10.867 | 1.814 | 1.009 | 1 | 1.236 | 1.426 | 1.374 |
| Parameter | Symbol | Value | Unit |
|---|---|---|---|
| Operating temperature | T | 60 | °C |
| Anode pressure | pan | 1.23 | bar |
| Hydrogen purity | βH2 | 99.999 | % |
| Hydrogen Stoichiometry | kH2 | 2 | - |
| Anode relative humidity | ARH | 100 | % |
| Cathode pressure | pca | 1 | bar |
| Oxygen purity | βO2 | 99.999 | % |
| Cathode relative humidity | CRH | 100 | % |
| Load stack current | Ist | 100 | A |
| Average cell current density | icell | 500 | mA/cm2 |
| Coolant temperature rise | DTcool | 3 | °C |
| Stable voltage range | RU,st | 33 | mV |
| Average Coefficient | |||||||
|---|---|---|---|---|---|---|---|
| Control Period | s | s | s | ||||
| Voltage Range Setpoint | |||||||
| Procedure | |||||||
| Fuzzy with arbitrary parameters | 1.11 | 1.1 | 1.10 | 1.08 | 1.13 | 1.09 | |
| GA optimized fuzzy | 1.06 | 1.043 | 1.075 | 1.05 | 1.083 | 1.057 | |
© 2020 by the author. Licensee MDPI, Basel, Switzerland. This article is an open access article distributed under the terms and conditions of the Creative Commons Attribution (CC BY) license (http://creativecommons.org/licenses/by/4.0/).
Share and Cite
Polak, A. Simulation of Fuzzy Control of Oxygen Flow in PEM Fuel Cells. Energies 2020, 13, 2372. https://doi.org/10.3390/en13092372
Polak A. Simulation of Fuzzy Control of Oxygen Flow in PEM Fuel Cells. Energies. 2020; 13(9):2372. https://doi.org/10.3390/en13092372
Chicago/Turabian StylePolak, Adam. 2020. "Simulation of Fuzzy Control of Oxygen Flow in PEM Fuel Cells" Energies 13, no. 9: 2372. https://doi.org/10.3390/en13092372
APA StylePolak, A. (2020). Simulation of Fuzzy Control of Oxygen Flow in PEM Fuel Cells. Energies, 13(9), 2372. https://doi.org/10.3390/en13092372