Numerical and Experimental Investigation on a Moonpool-Buoy Wave Energy Converter

Abstract
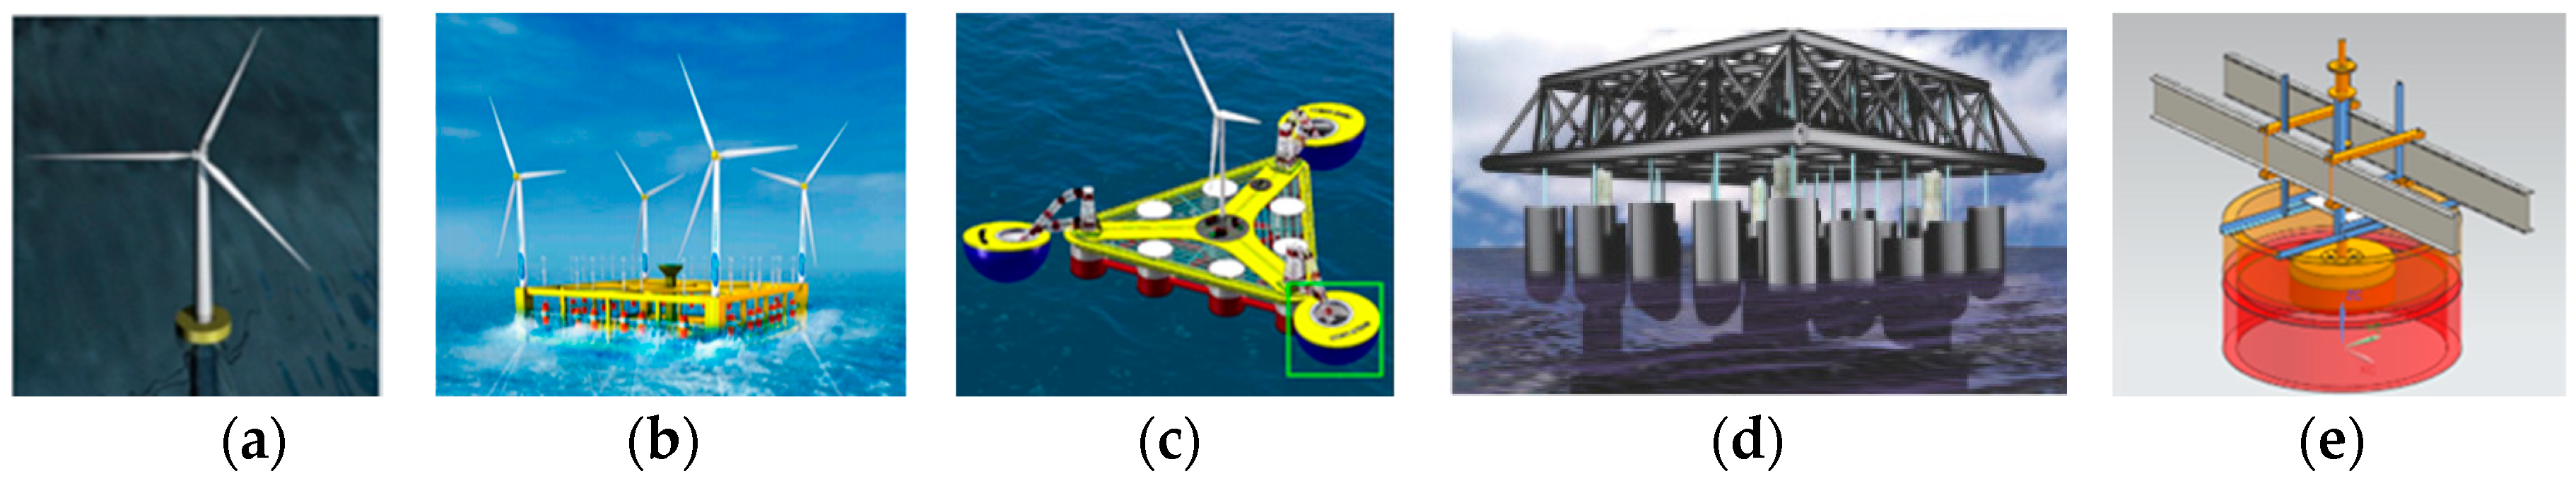
1. Introduction
2. Model Description
2.1. Similar Conditions
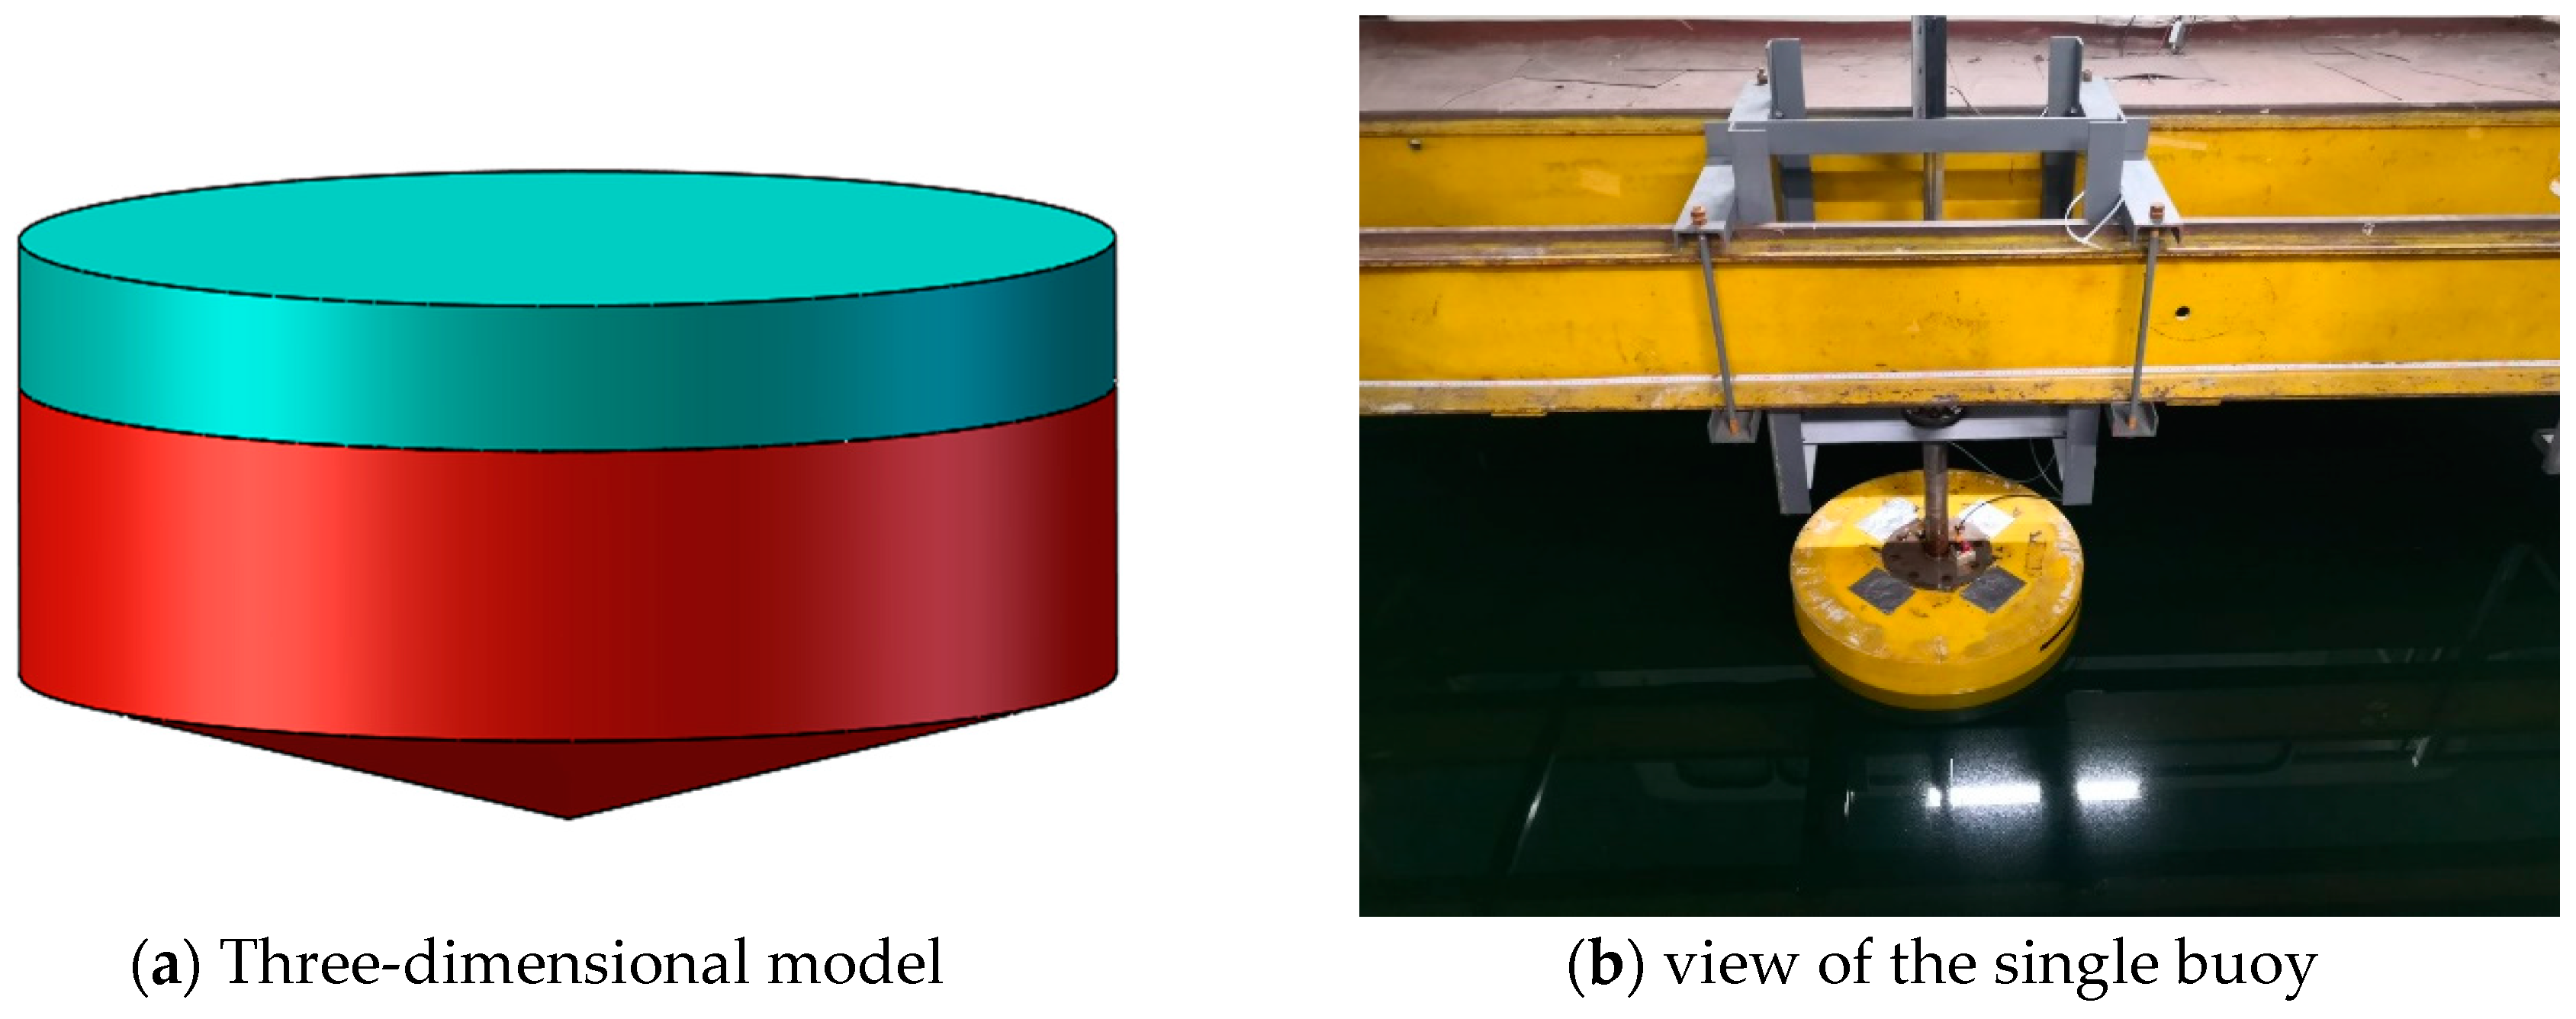
2.2. Single Buoy
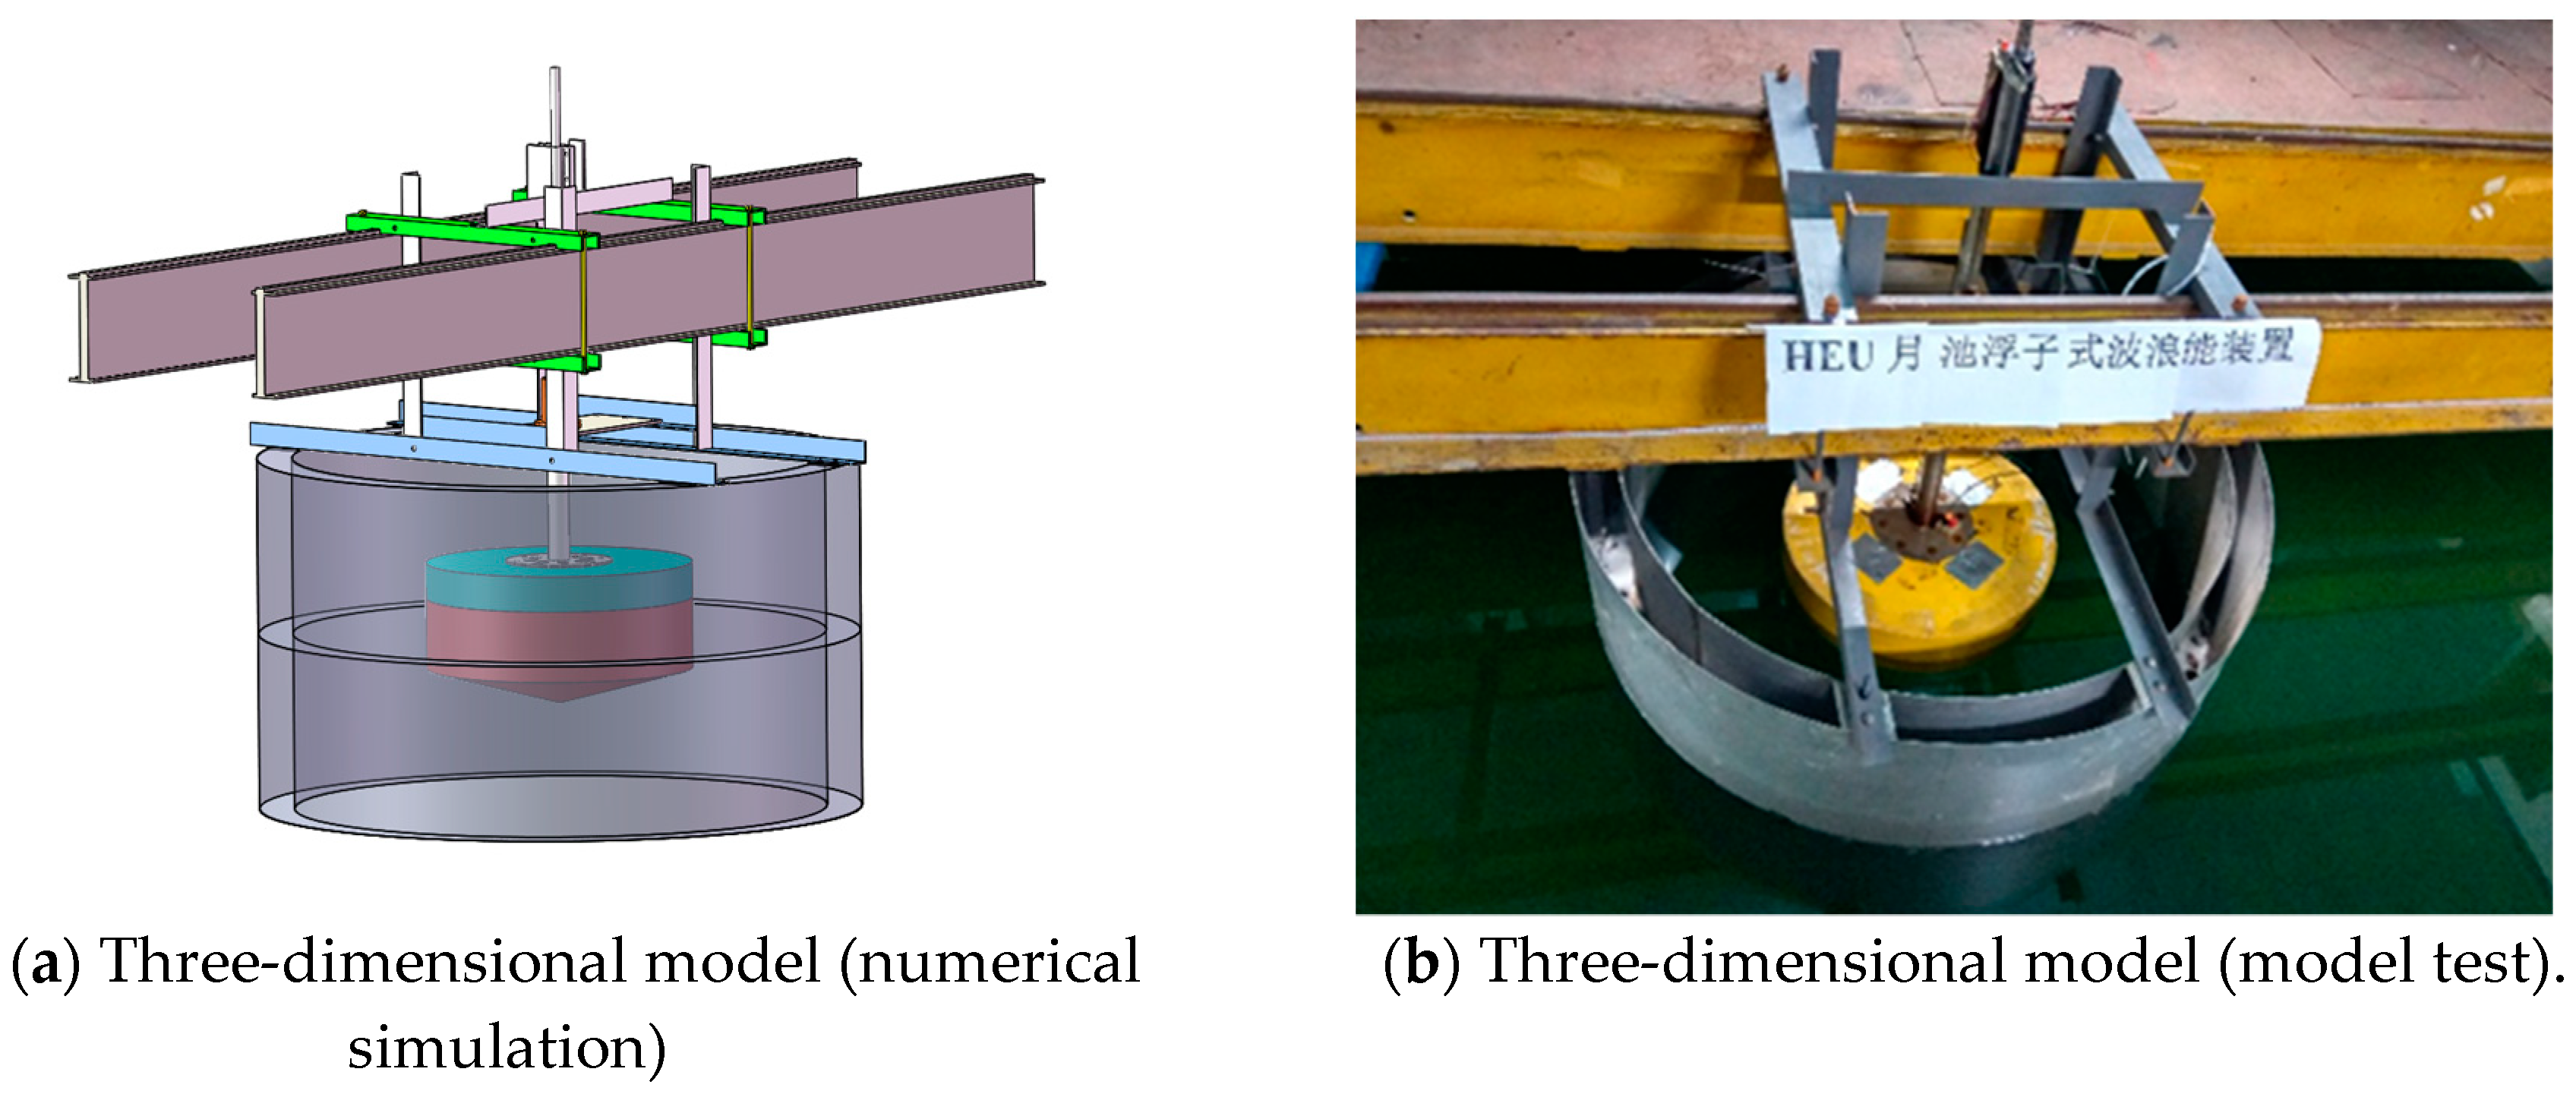
2.3. Moonpool-Buoy (Cylindrical Shell Housing the Moonpool)
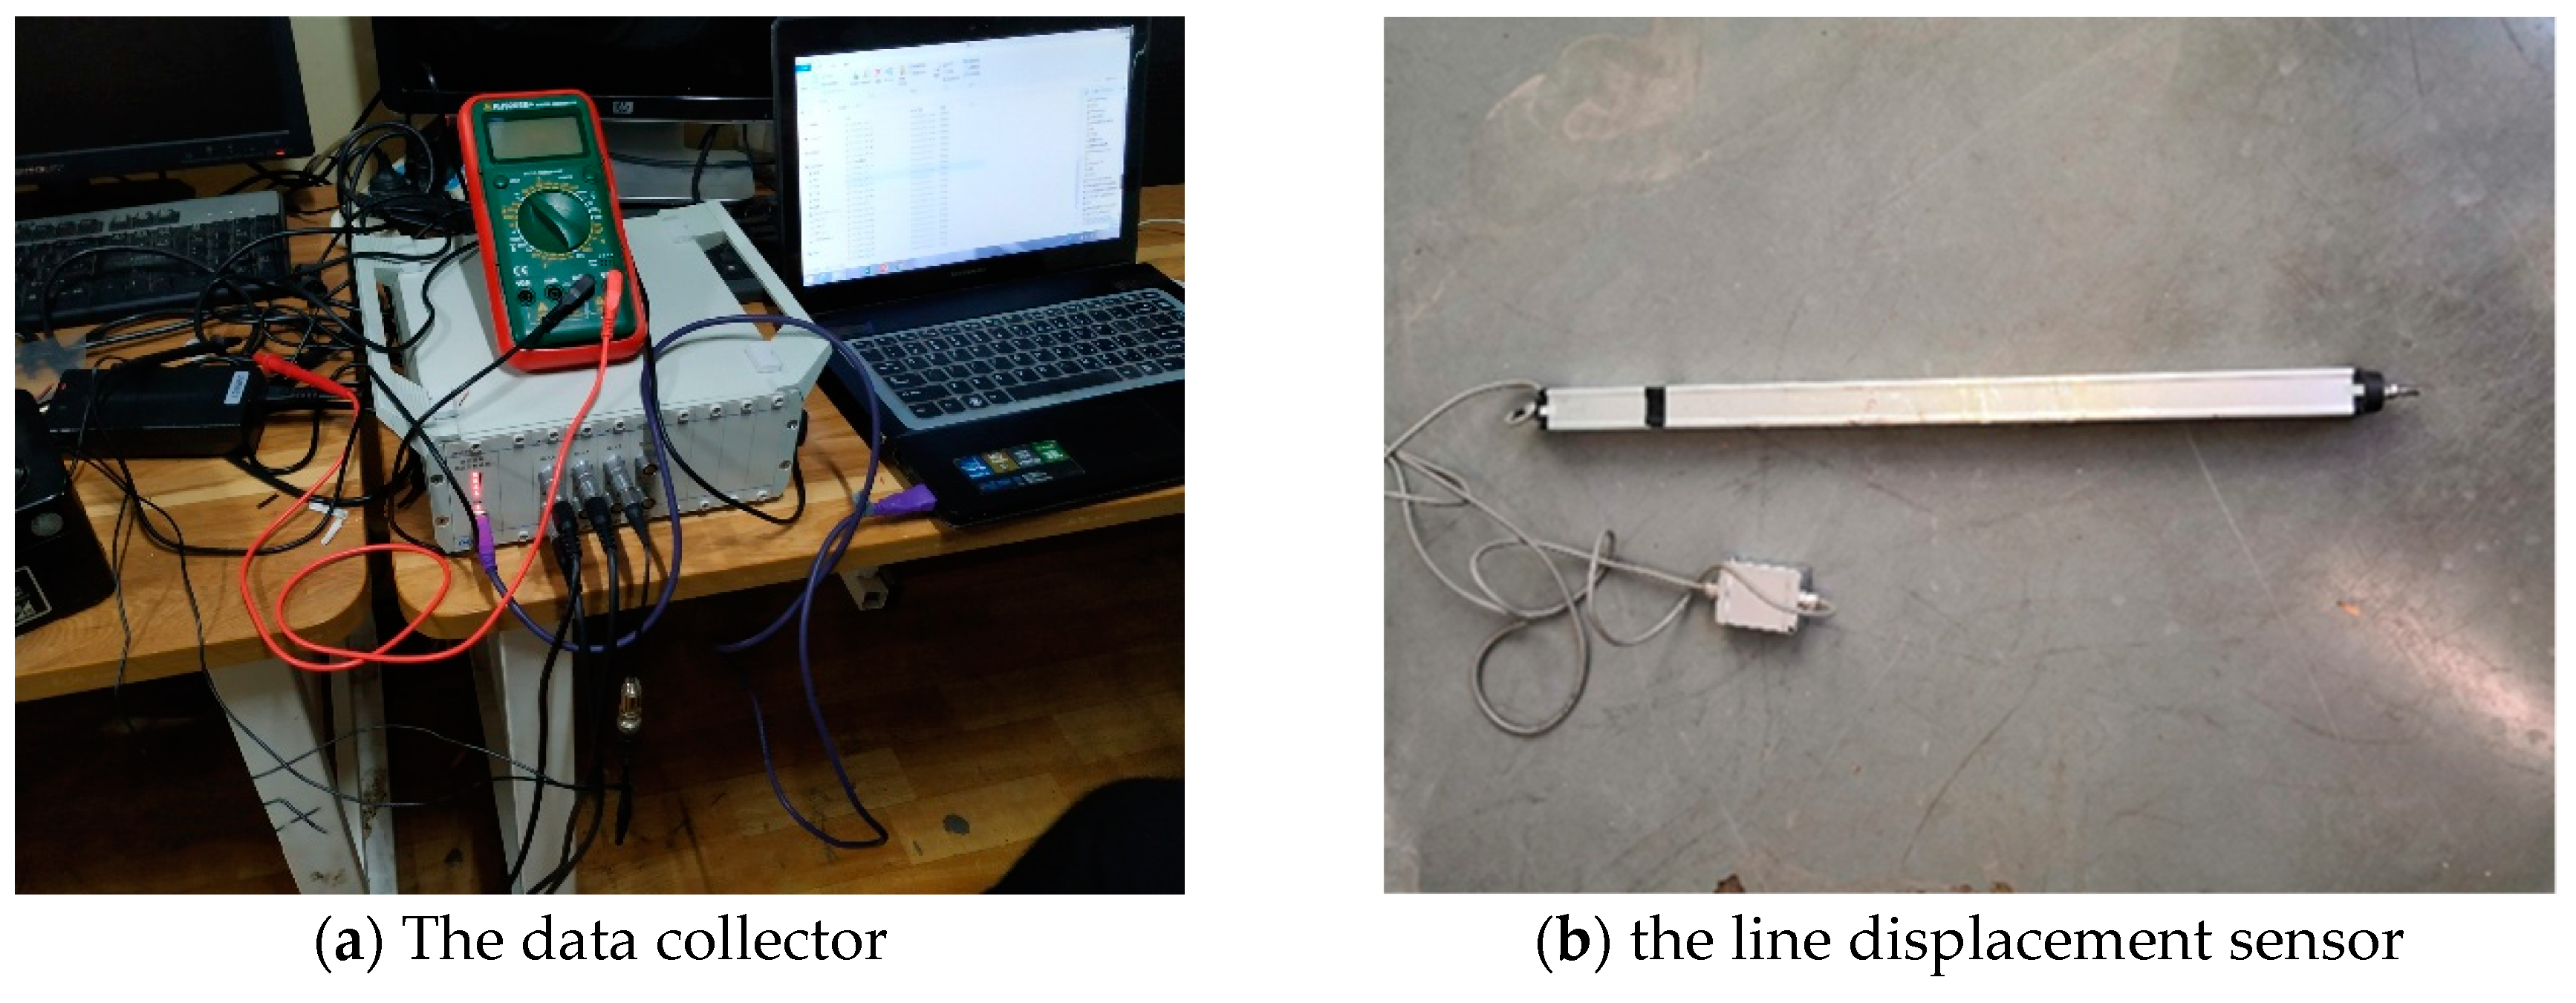
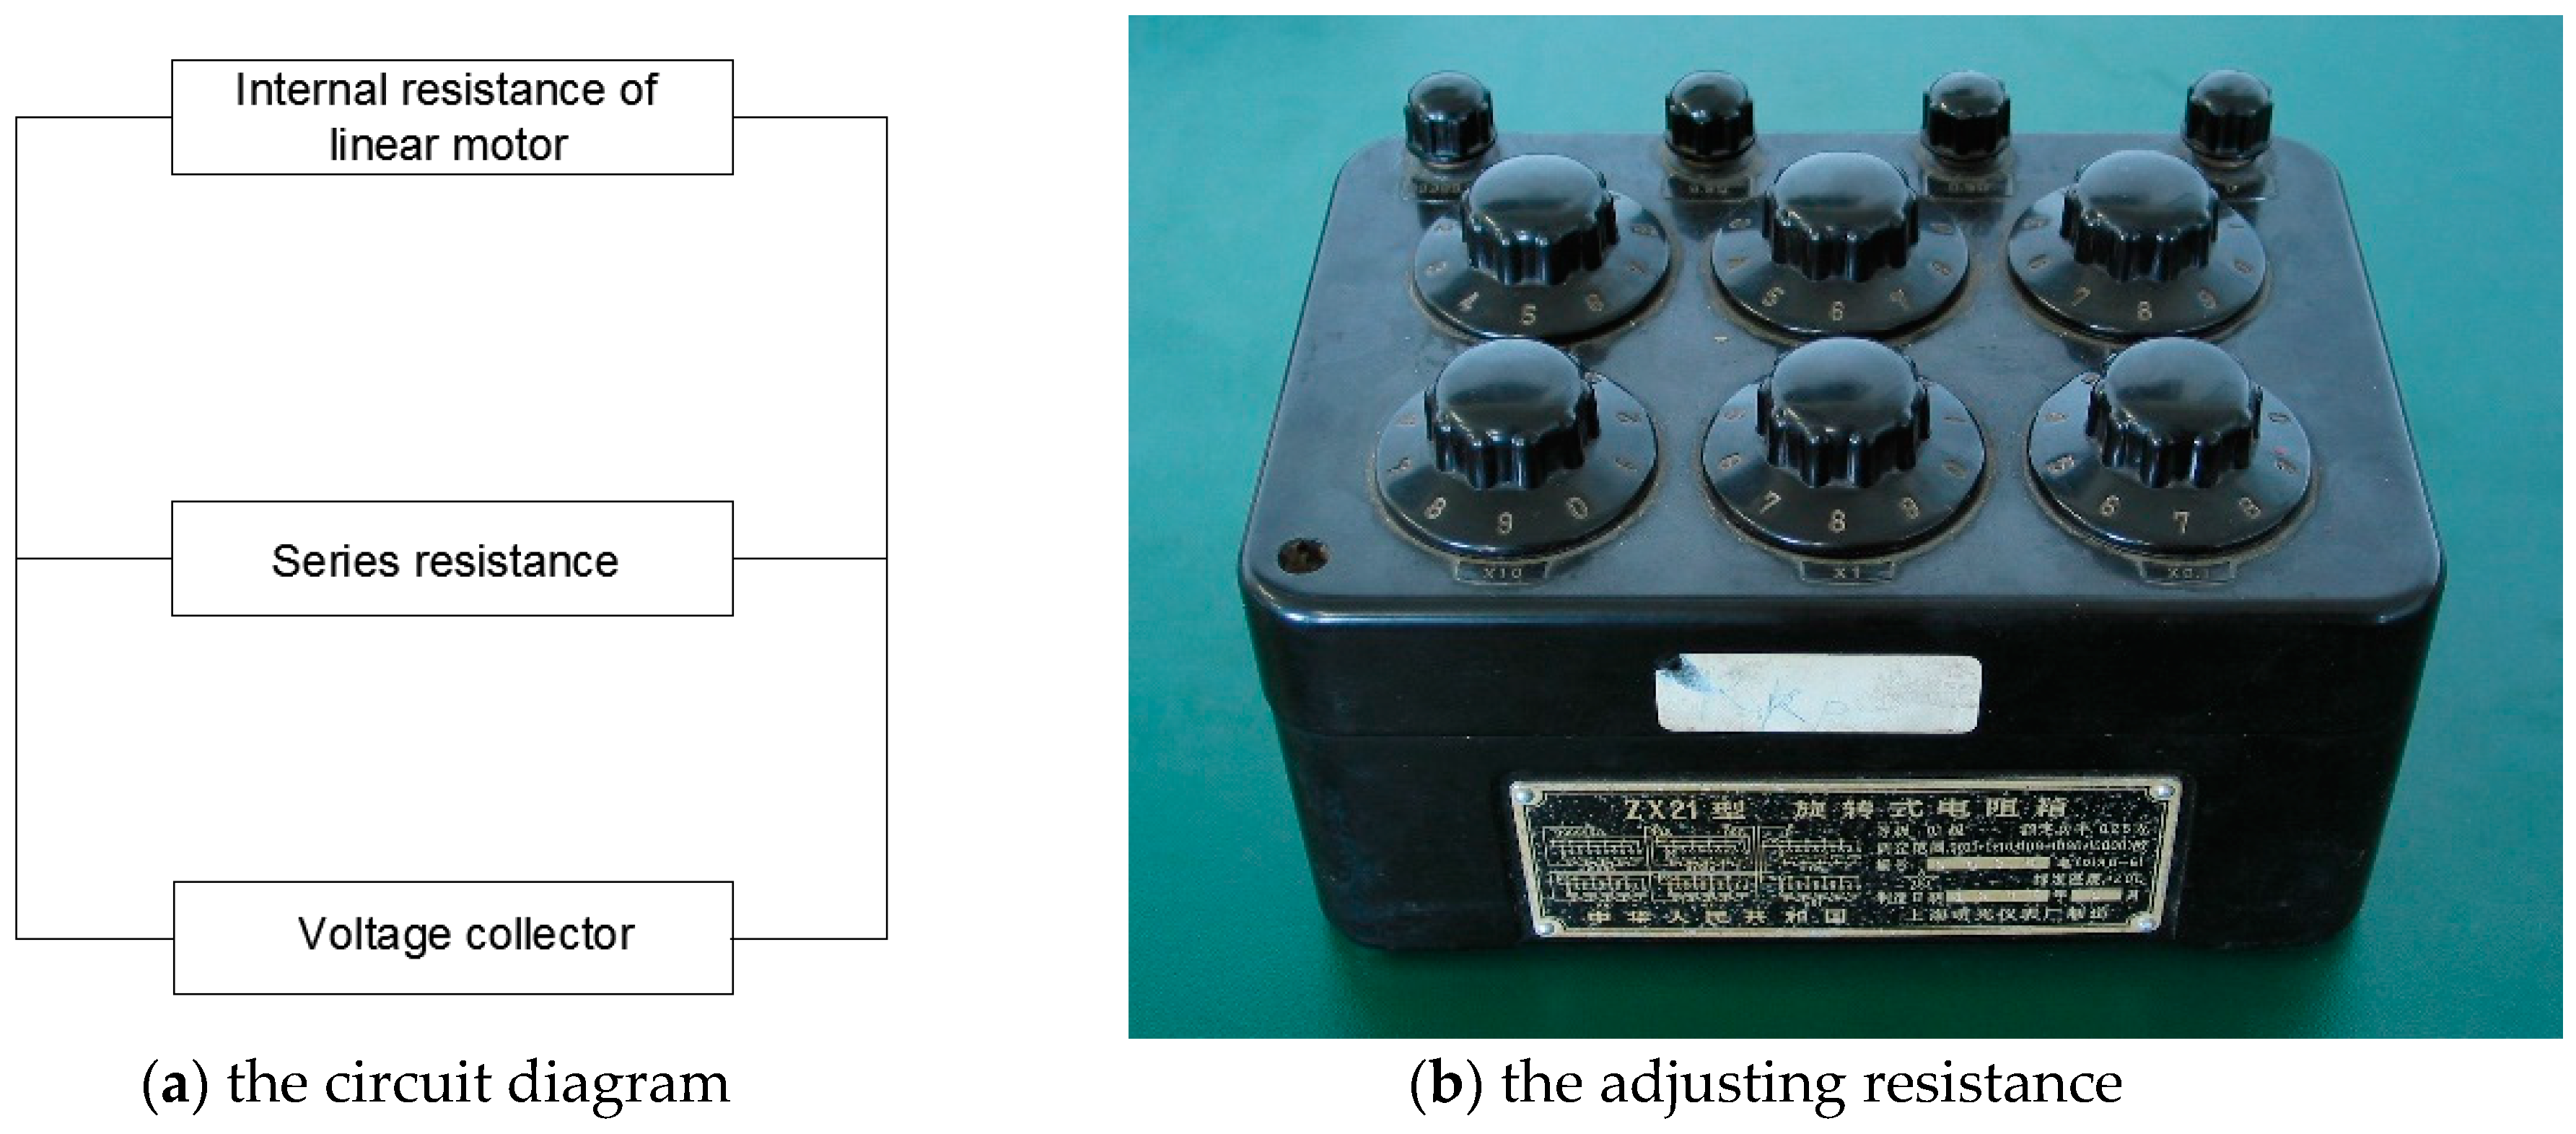
2.4. The Data Acquisition System
3. Numerical Approach
3.1. Potential Flow Method
3.2. RANS Method
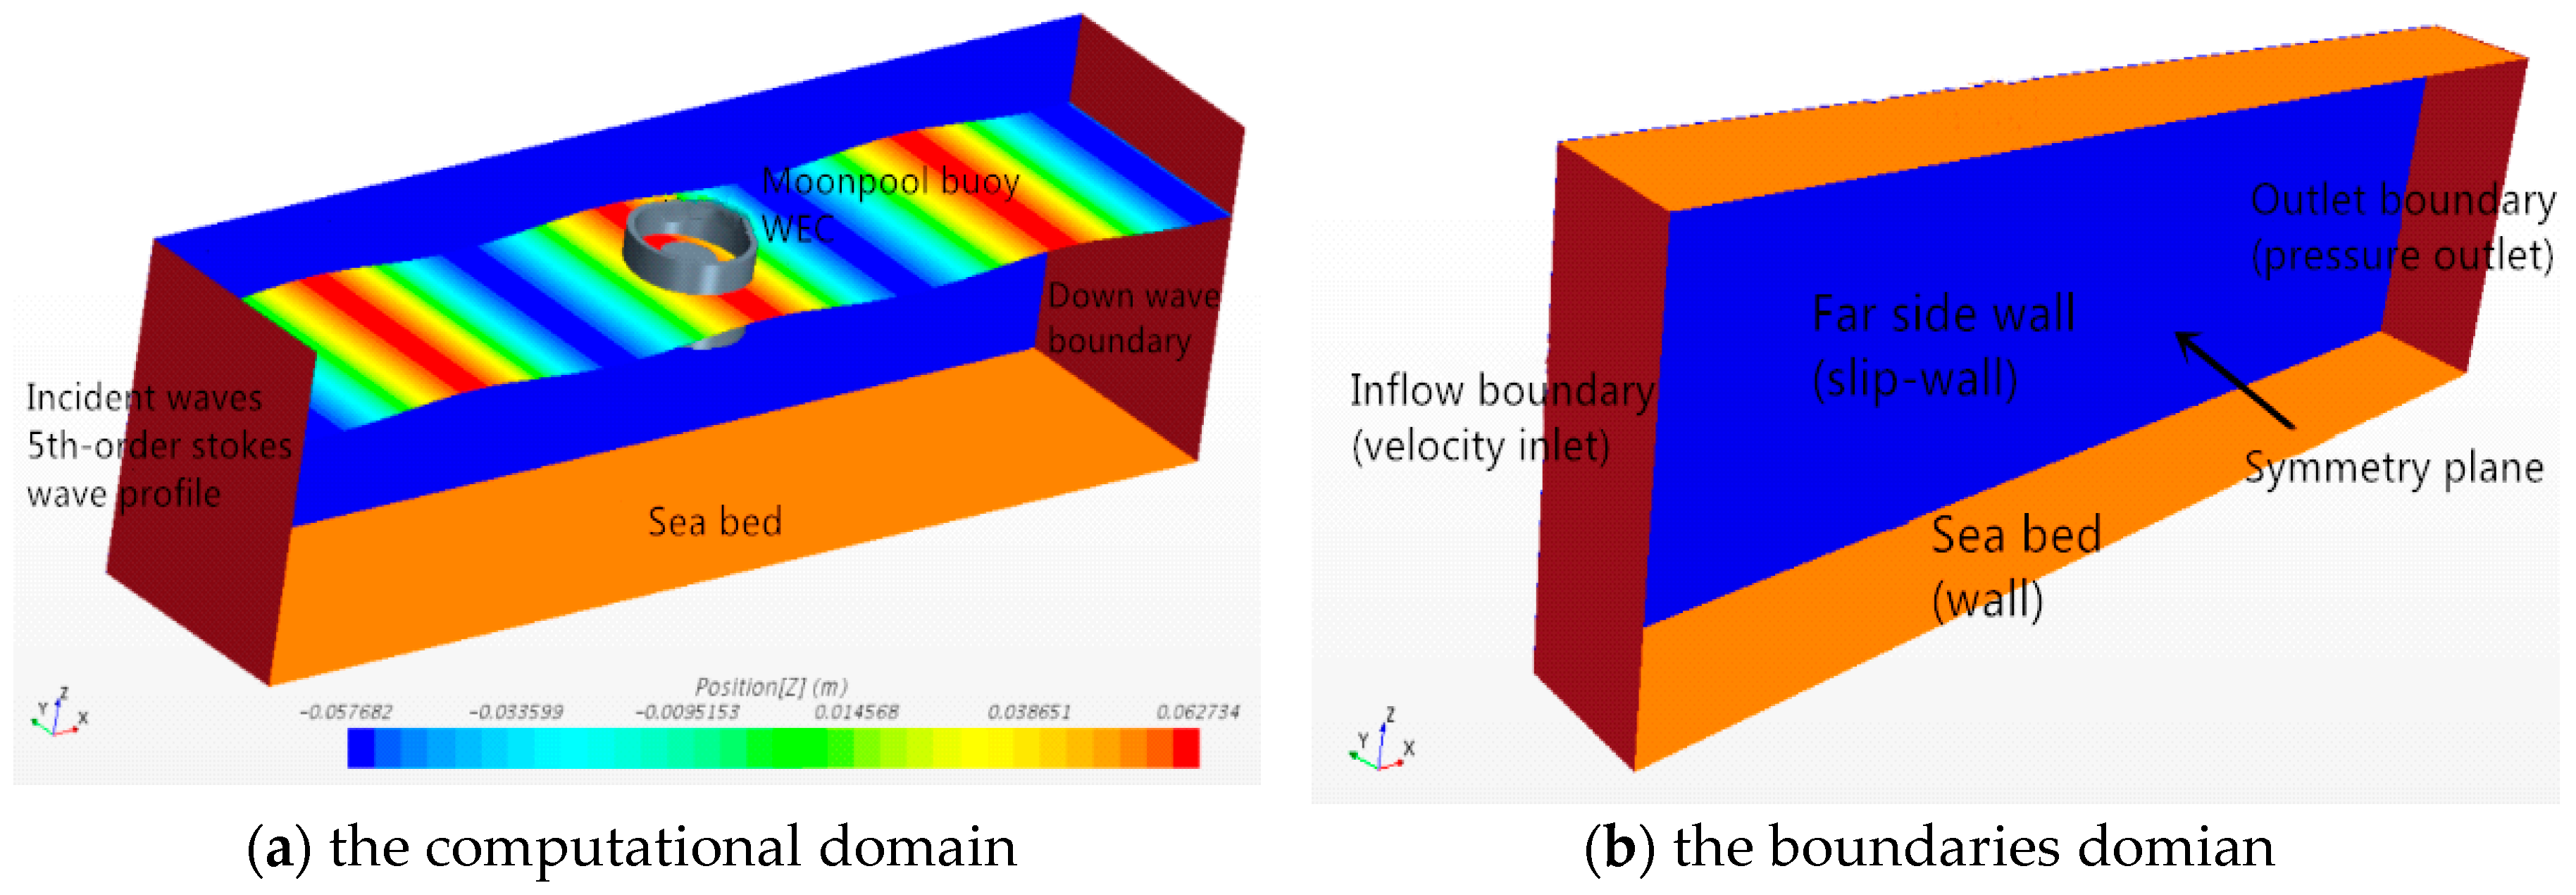
3.2.1. Computational Domain and Boundary Conditions
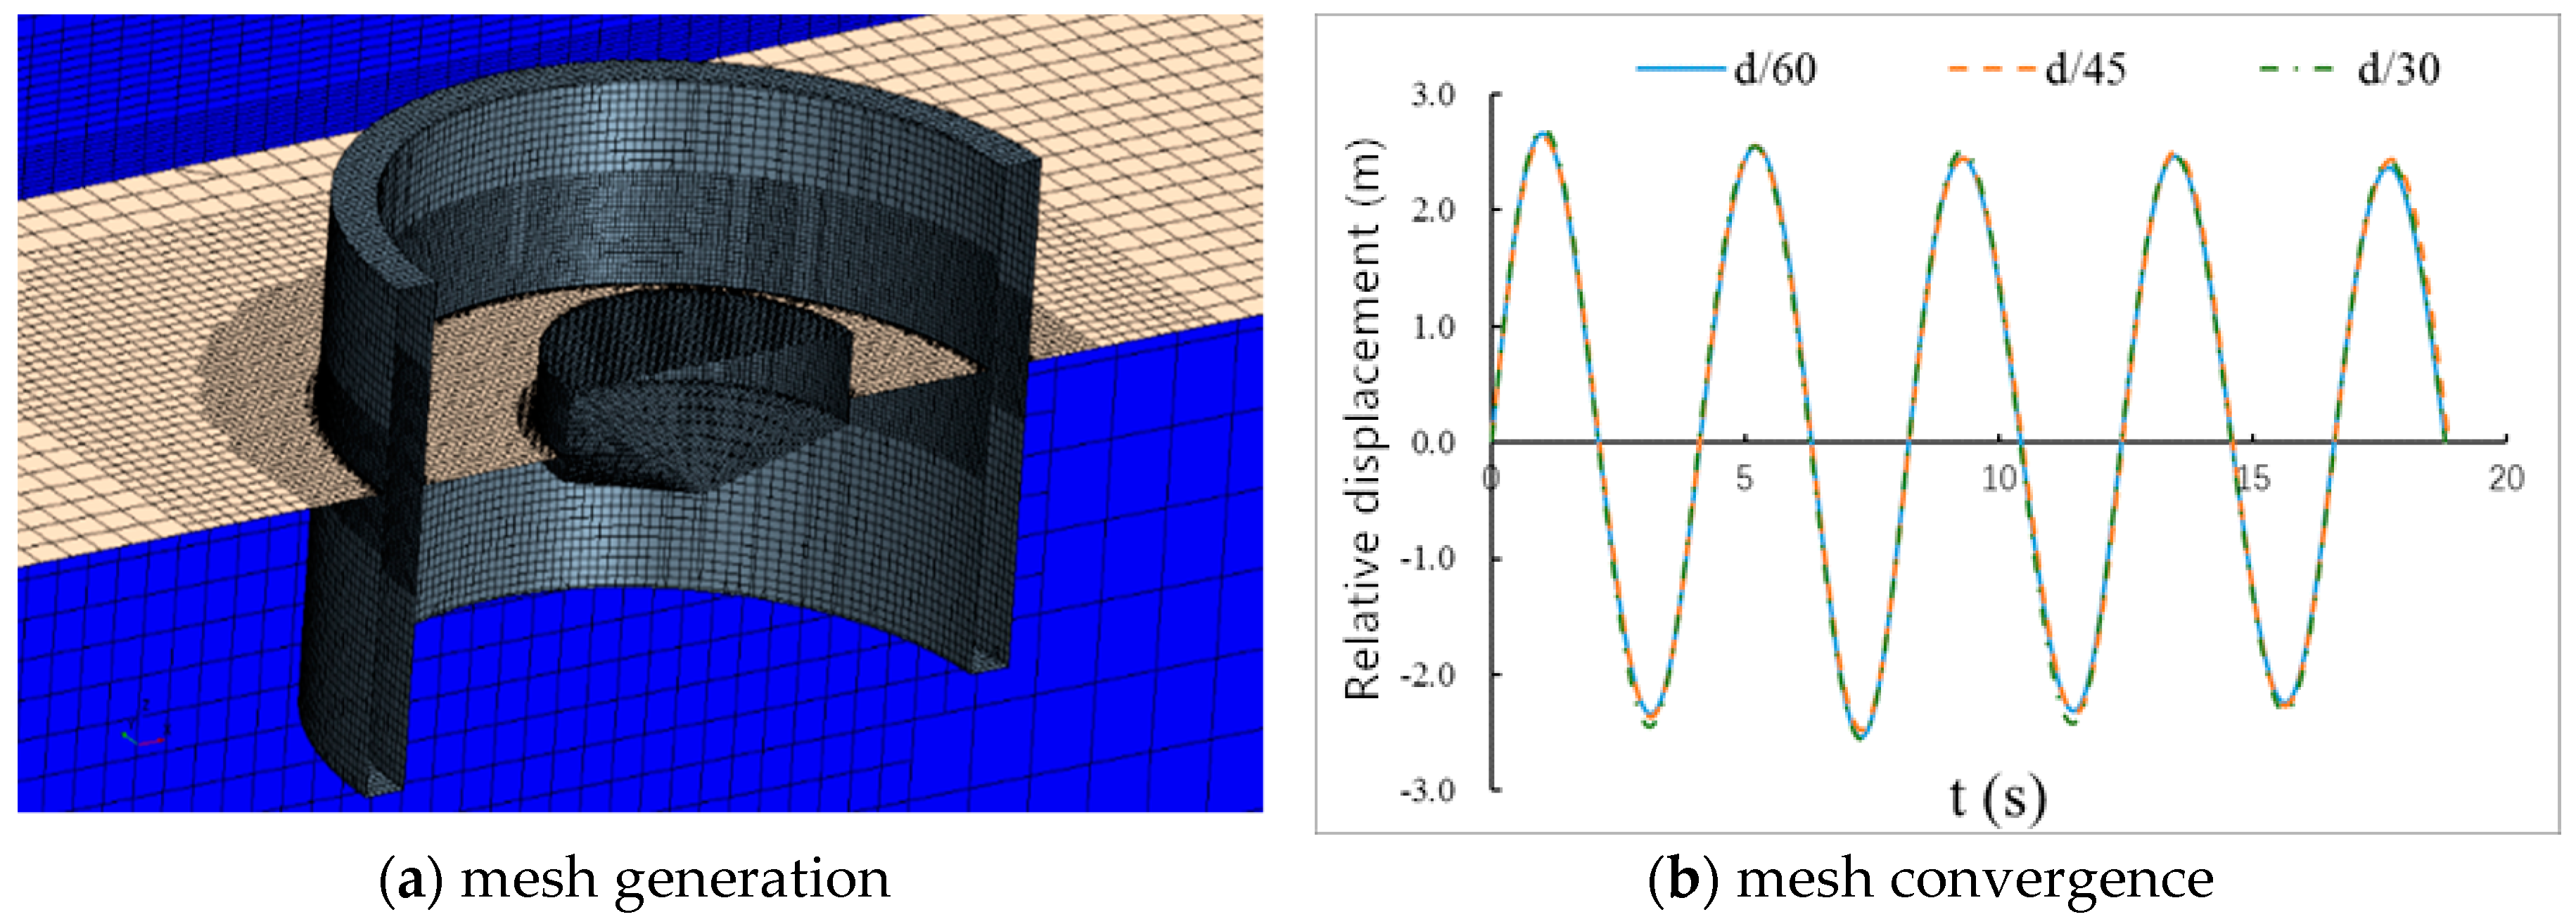
3.2.2. Mesh Generation and Convergence Verification
4. Experiments Process and Results
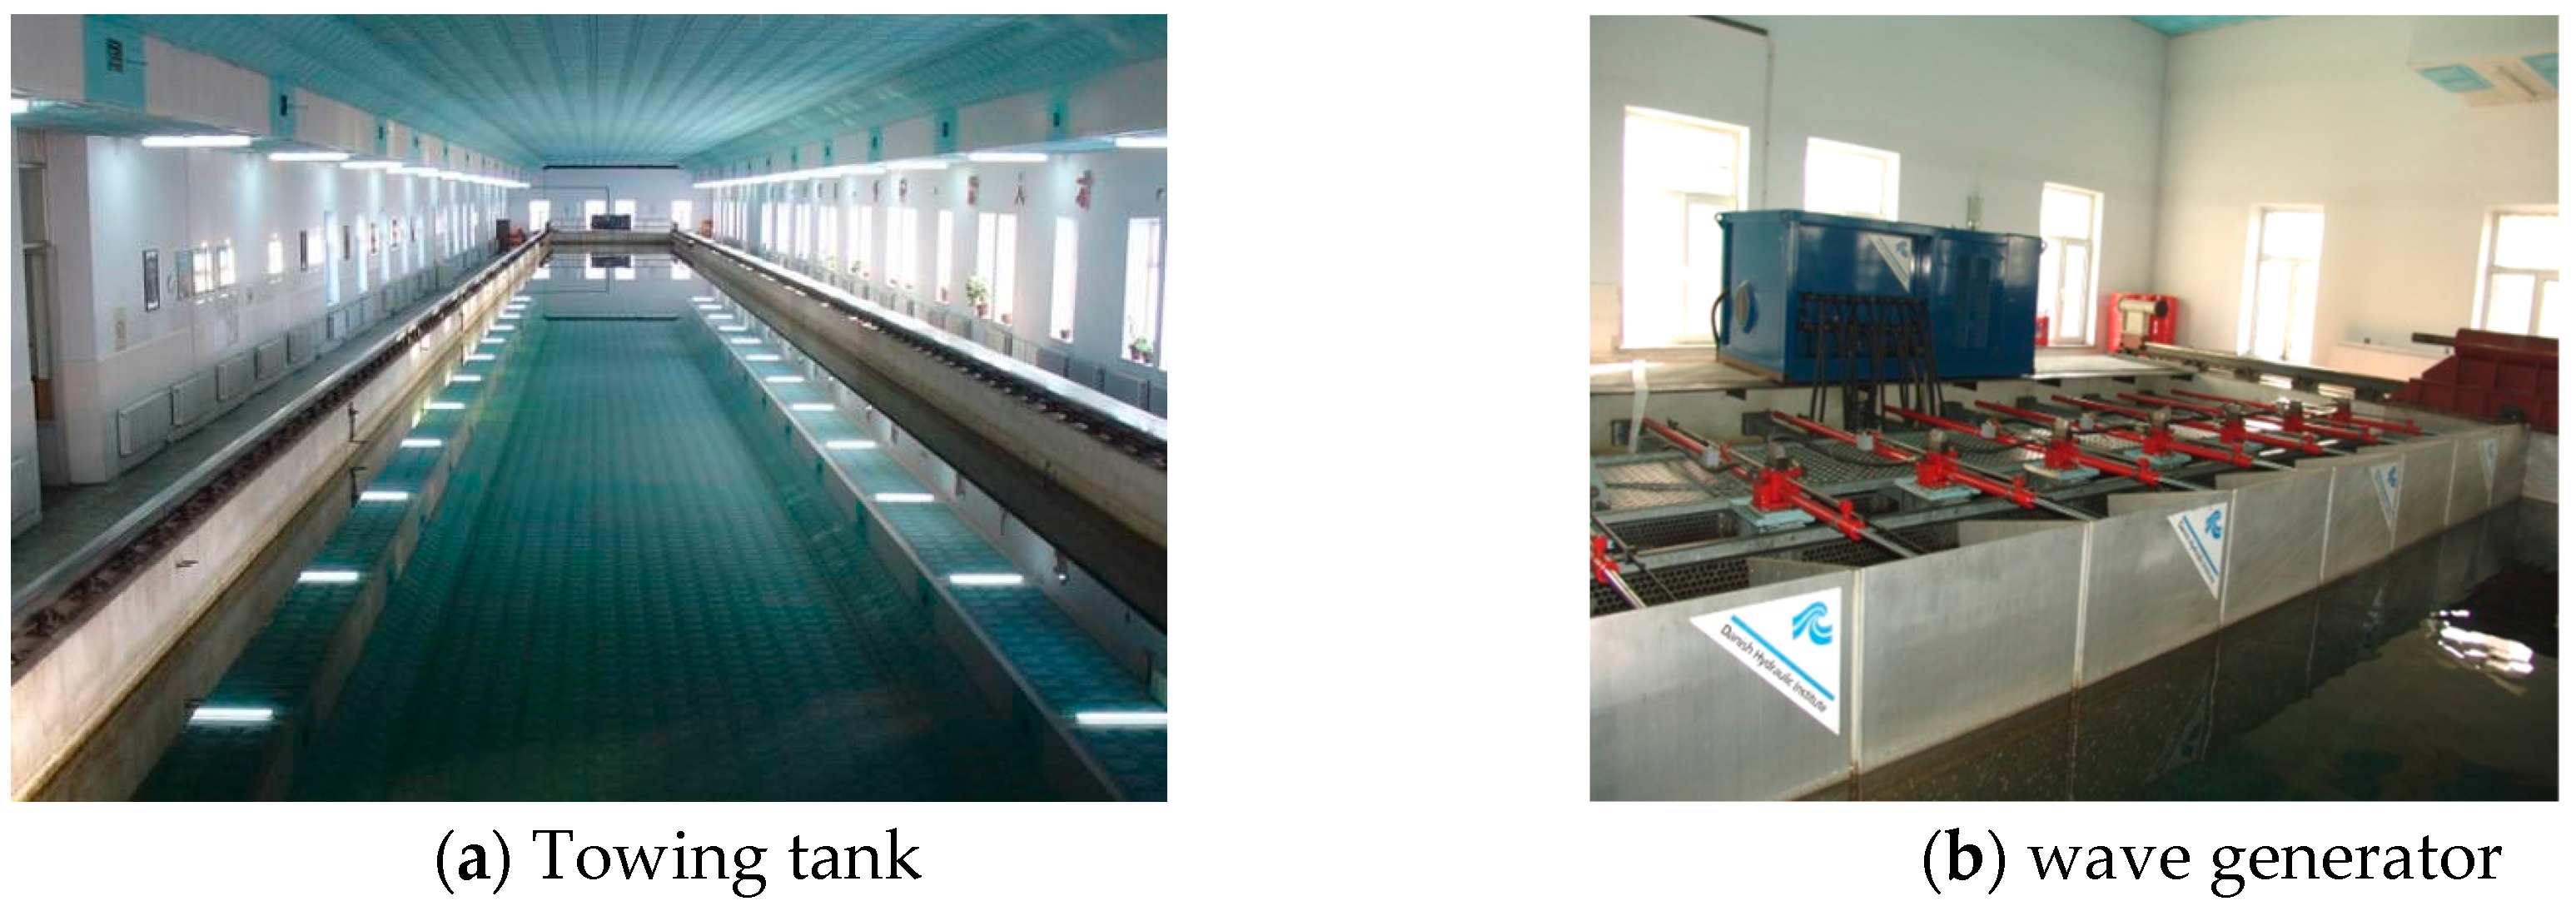
4.1. Experimental Facility
4.2. Wave Parameter
4.3. Single Buoy Model Test
4.3.1. Optimum Damping Coefficient
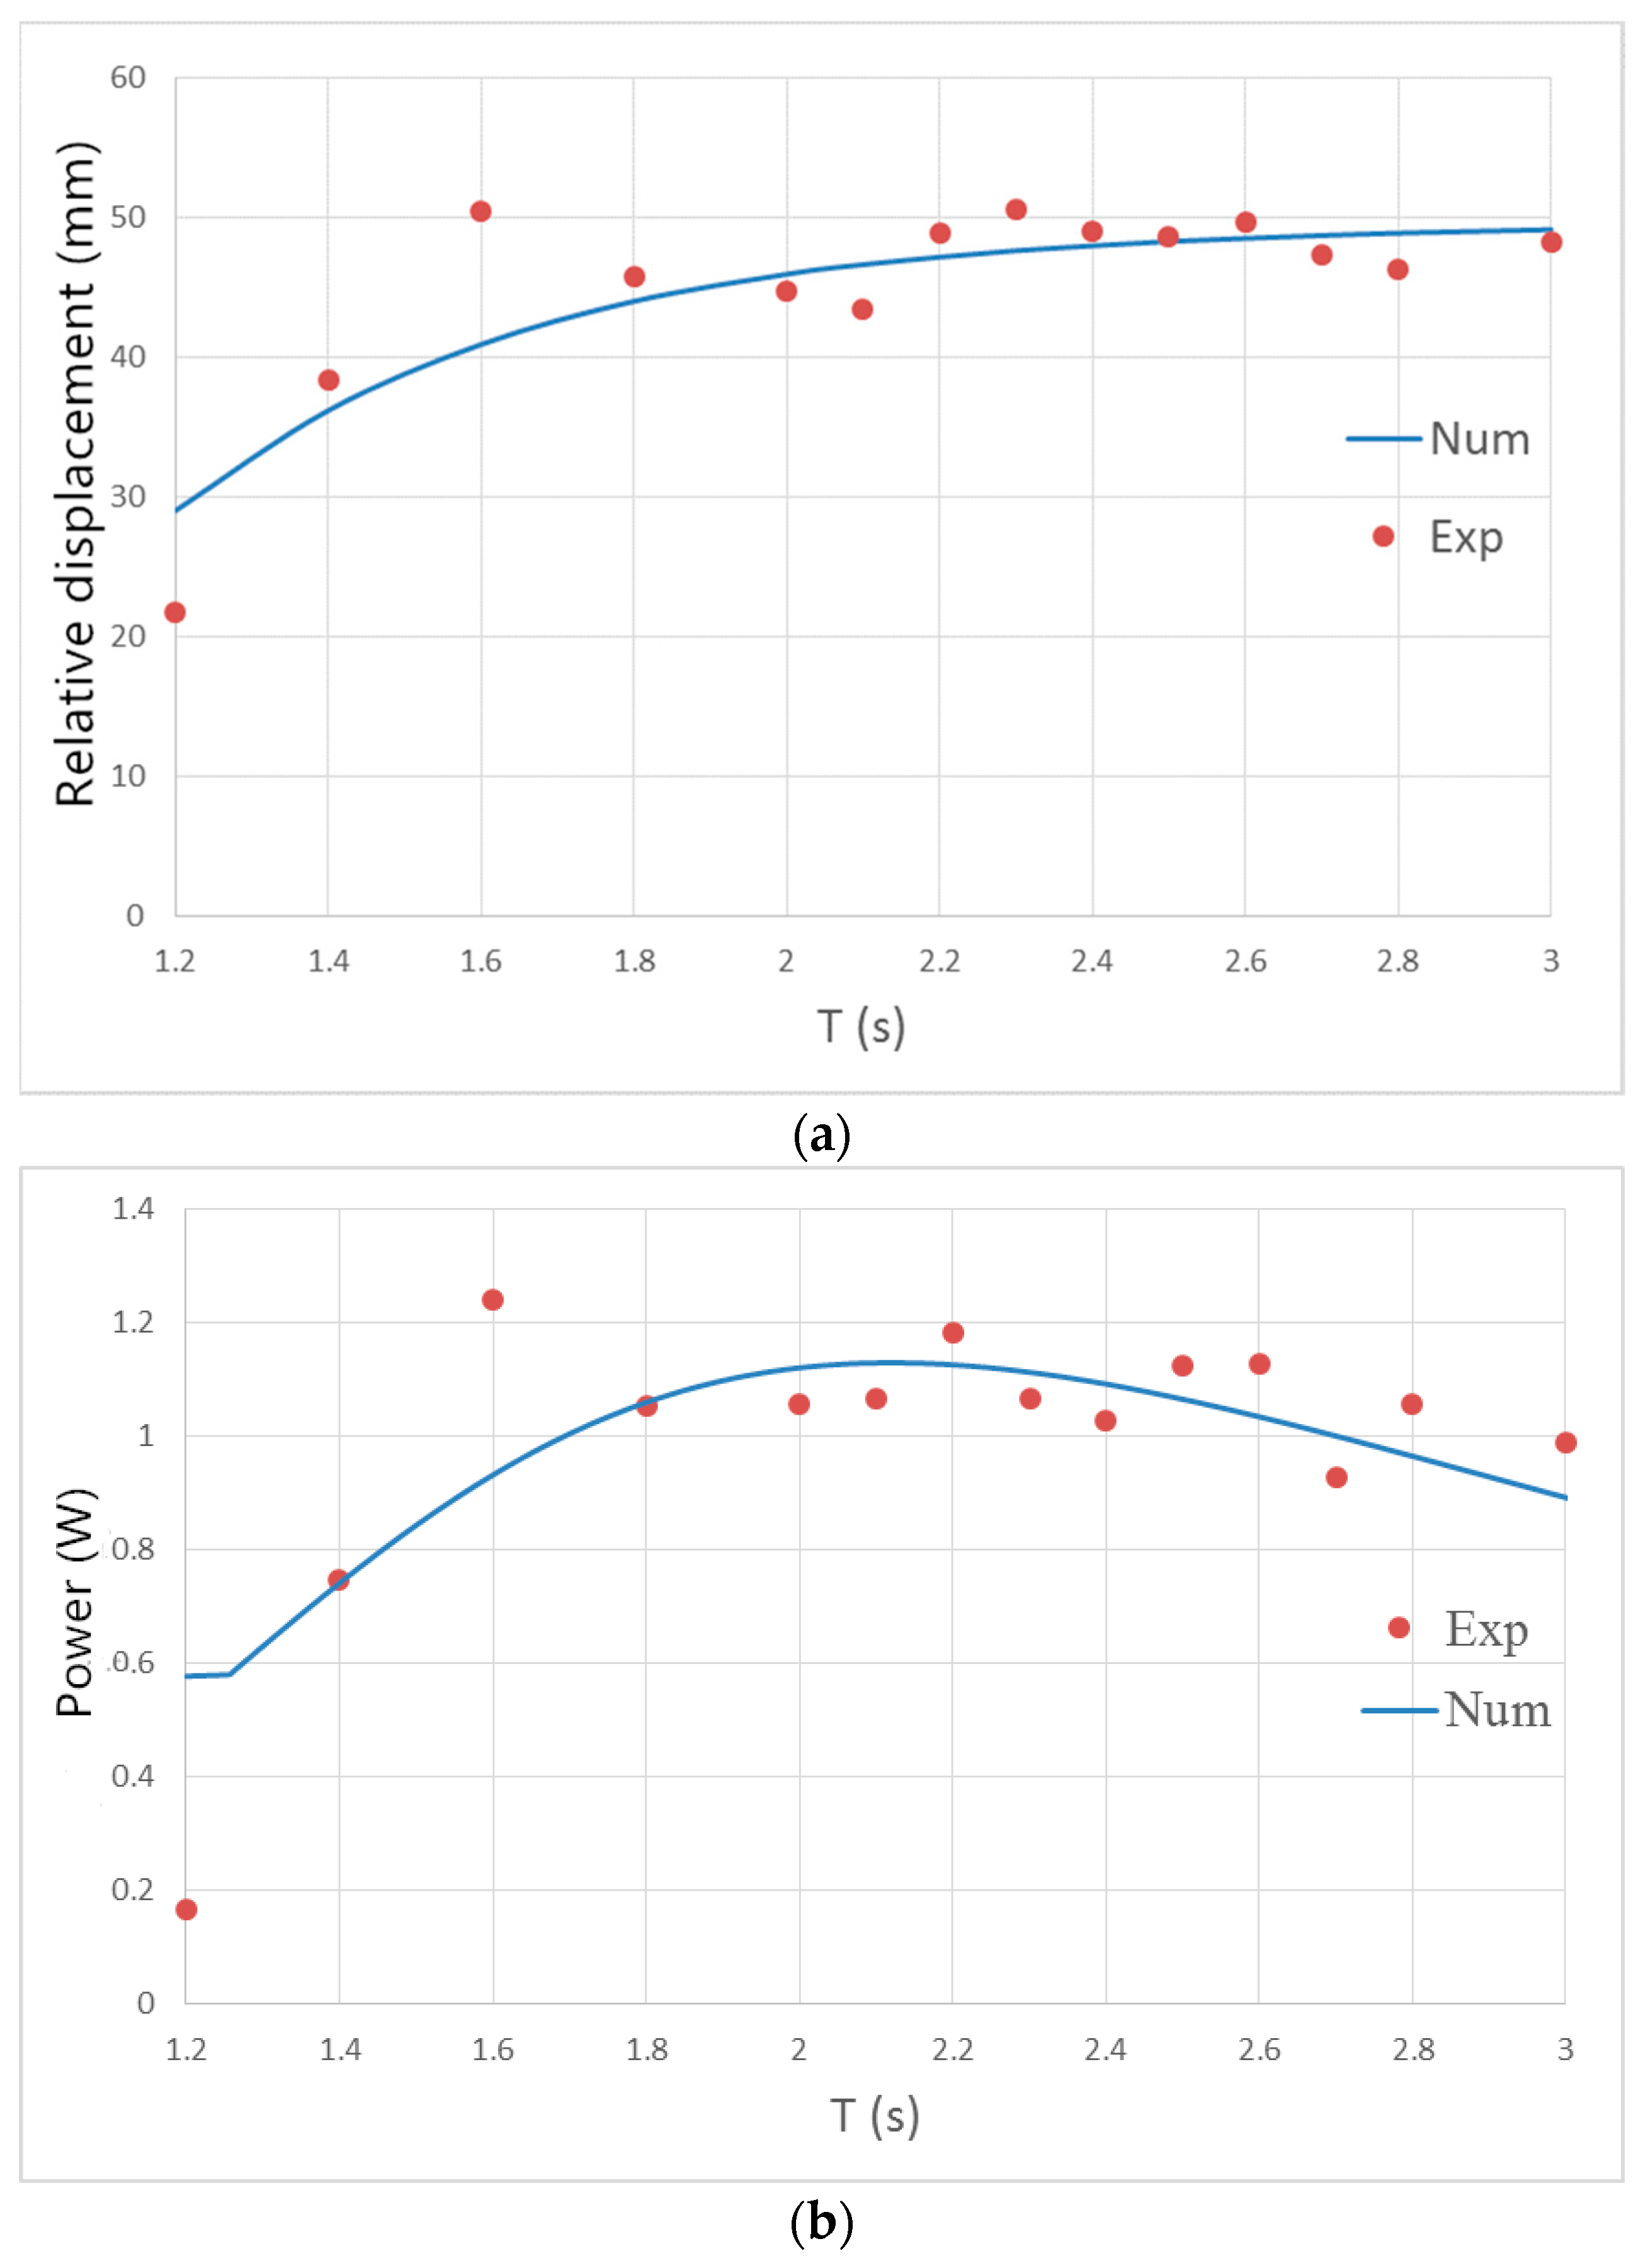
4.3.2. Relative Motion and Power
4.4. Wave Tank Experiment for Moonpool-Buoy and Comparison with Numerical Results
4.4.1. The Moonpool Device
4.4.2. The Optimal Damping
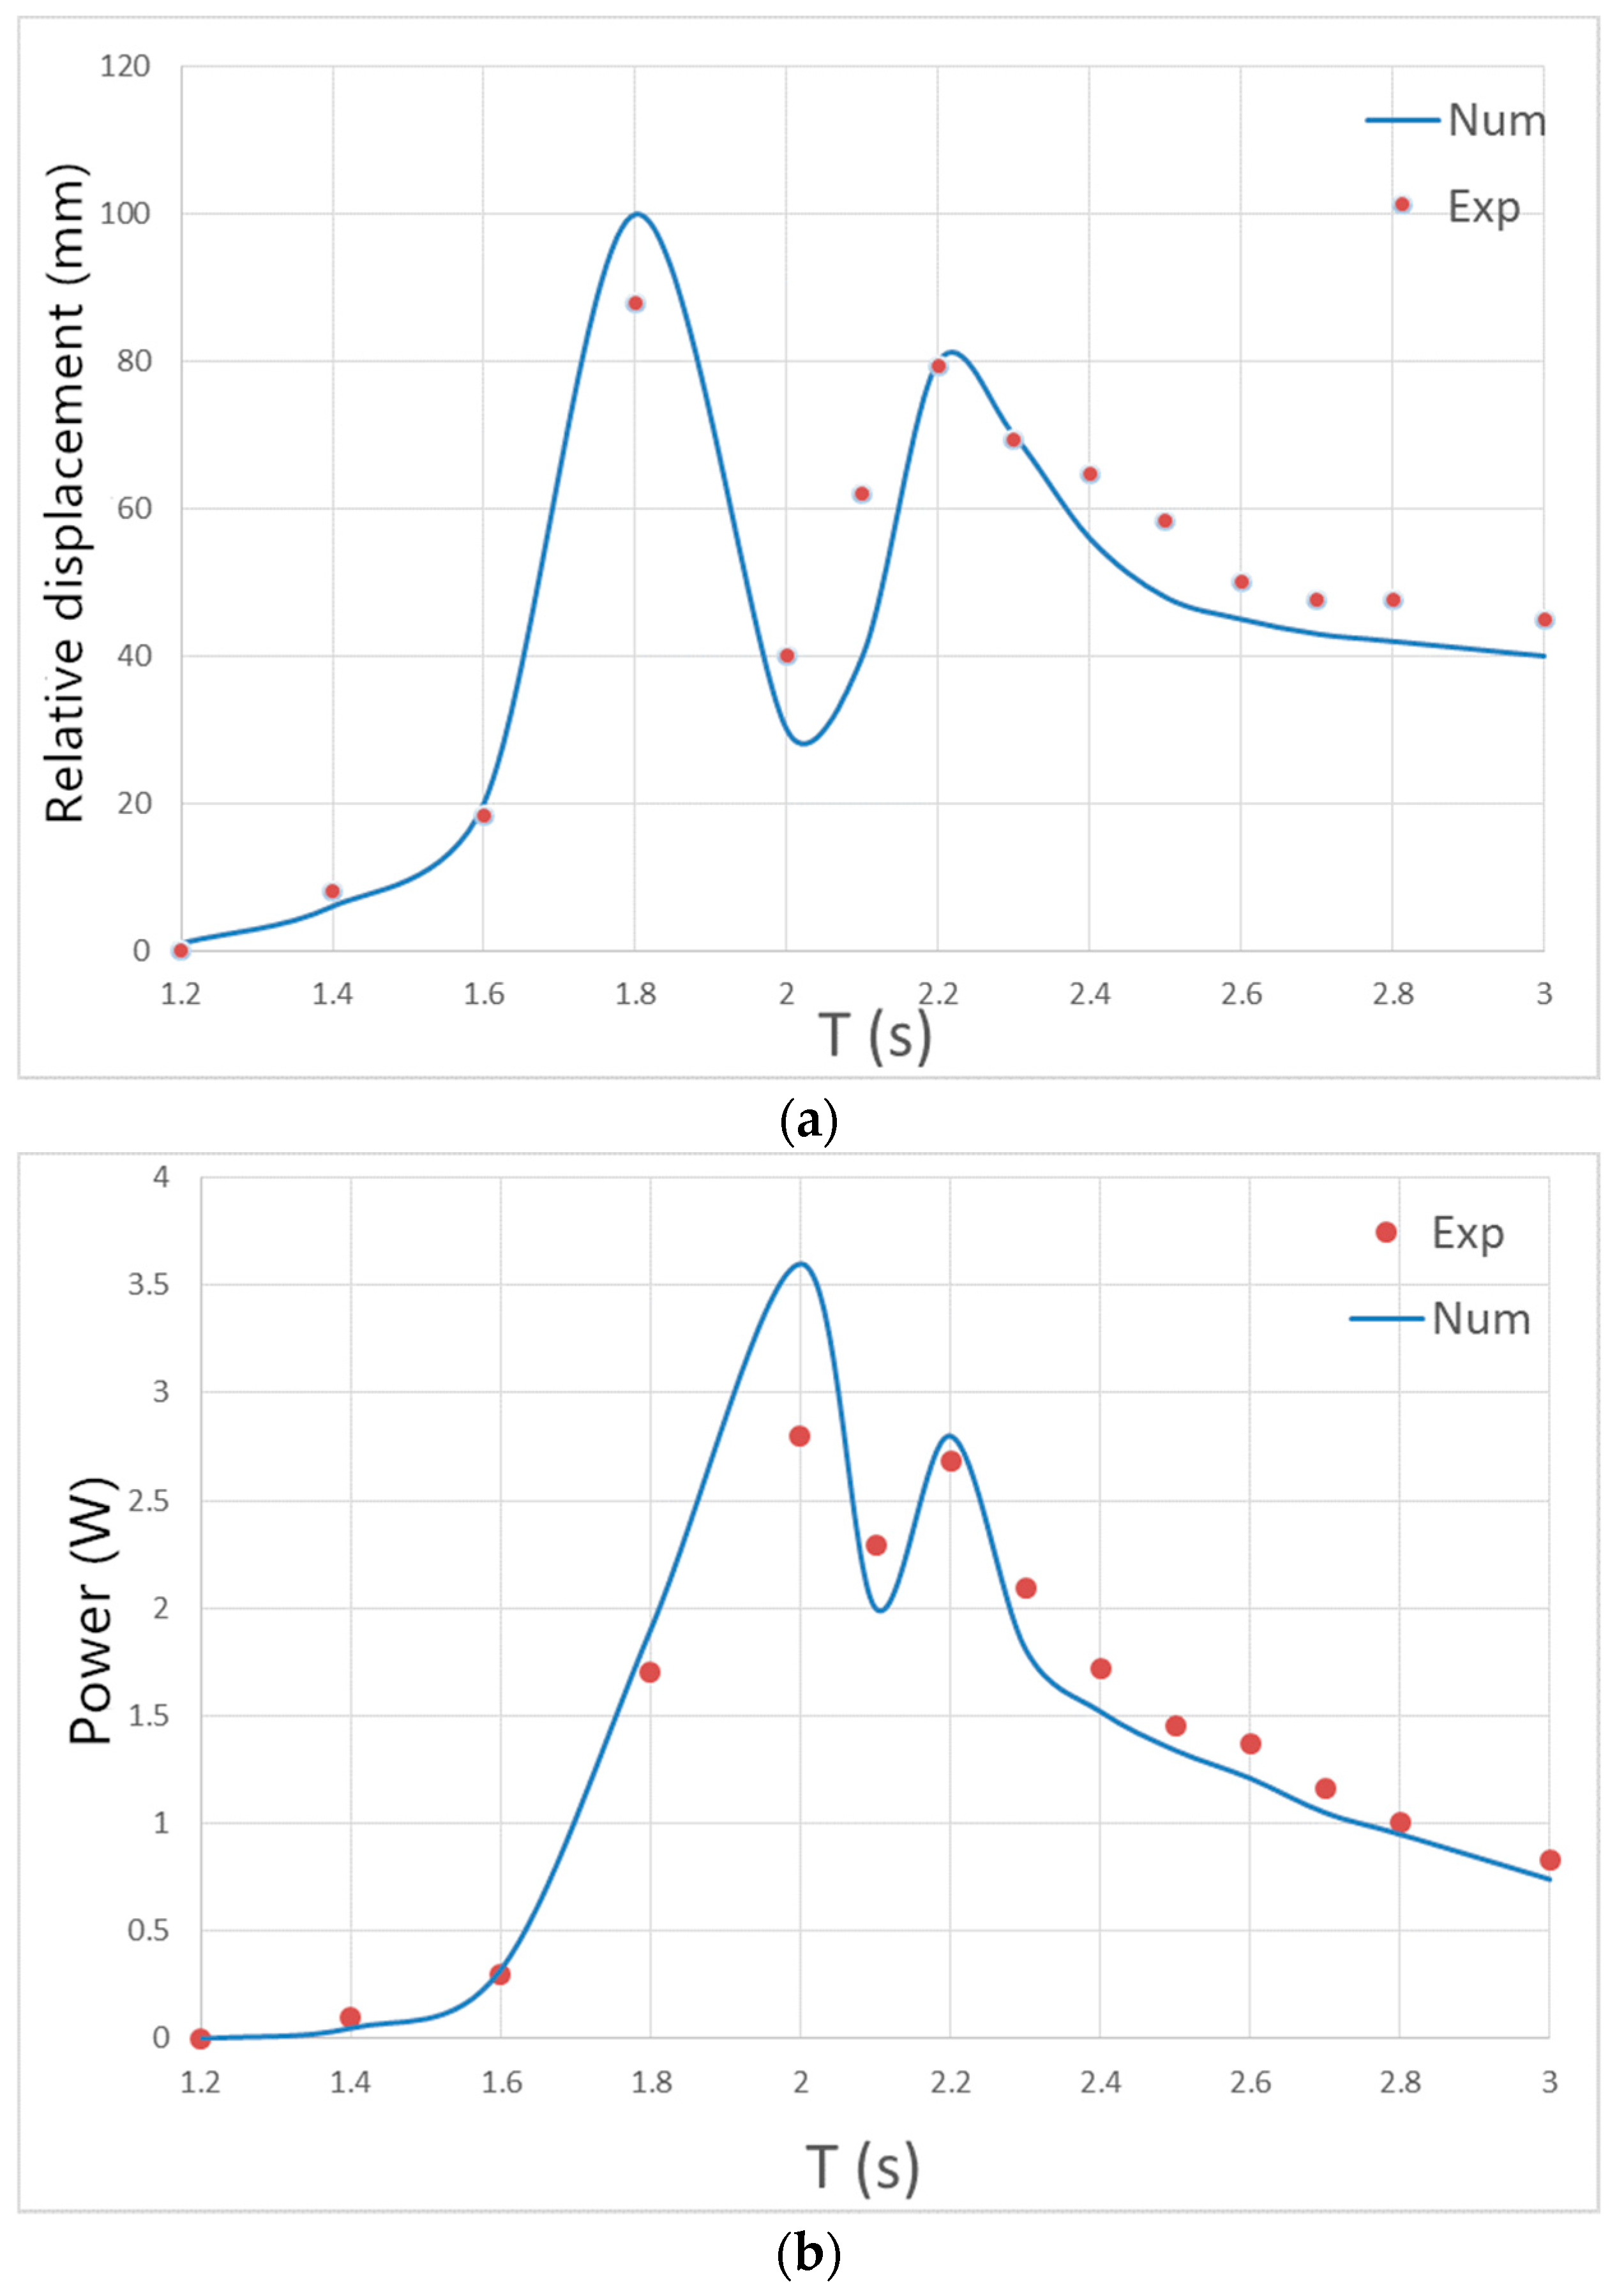
4.4.3. Motion Response and Power Output
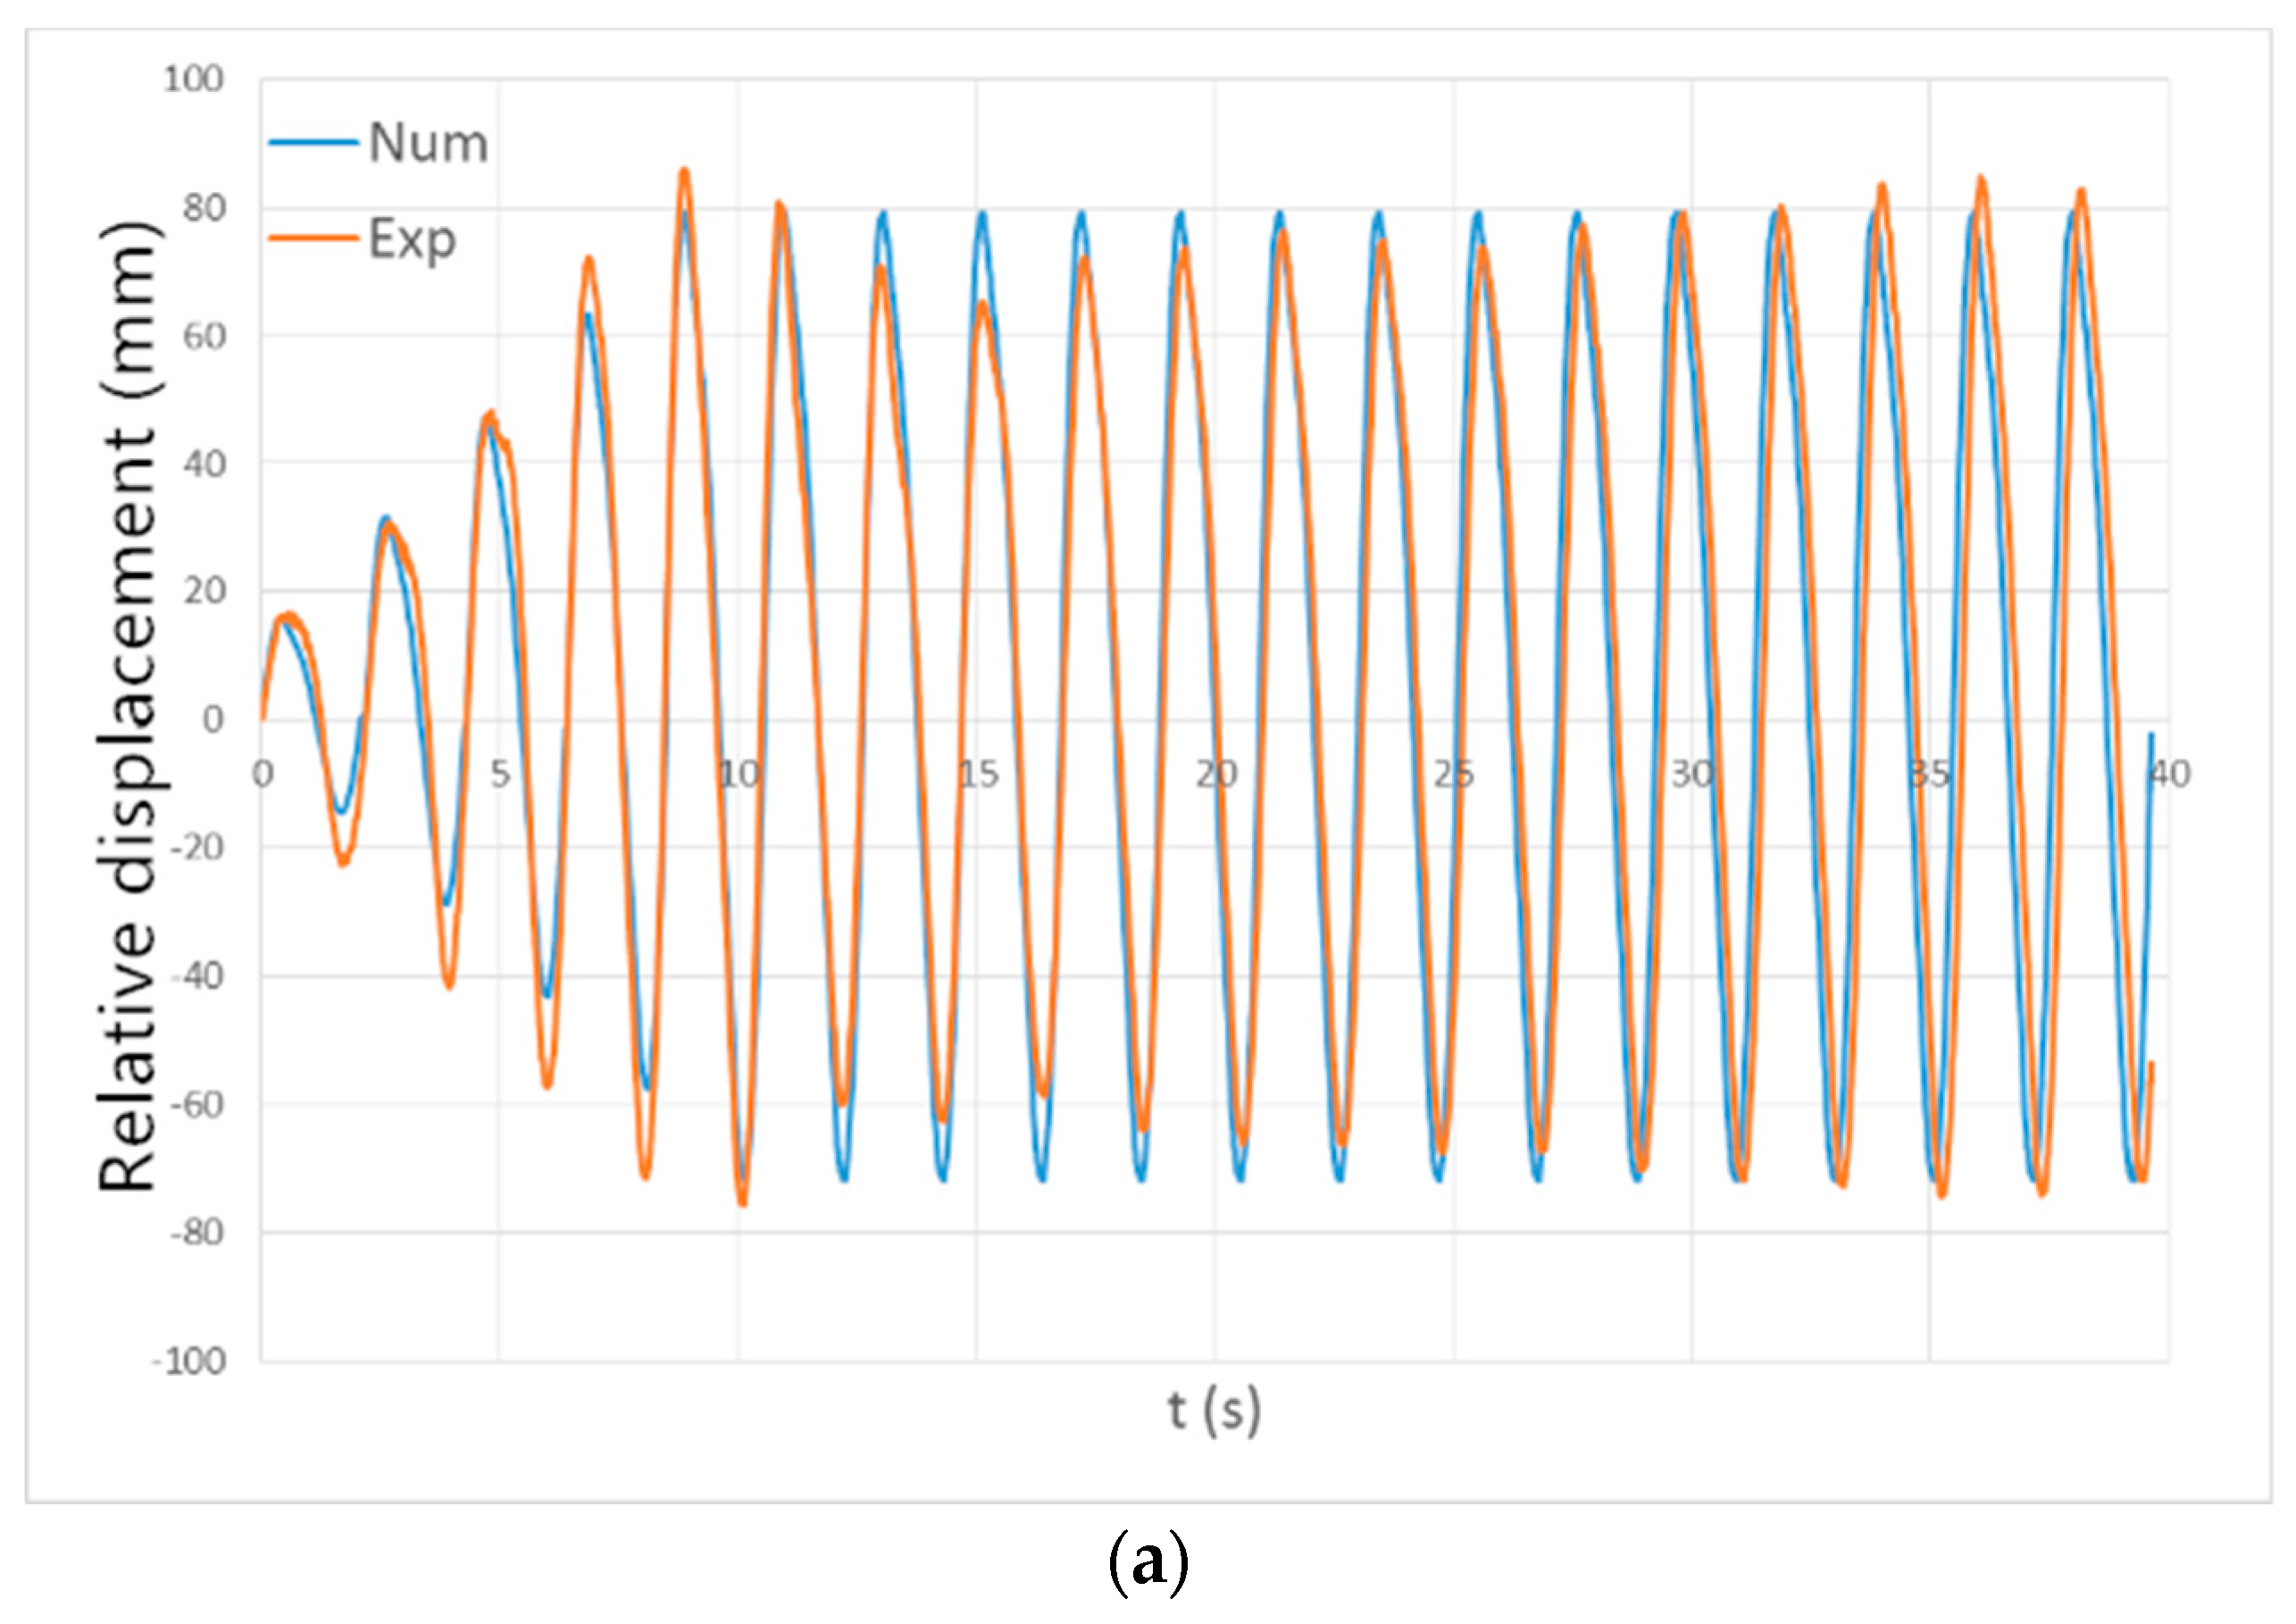
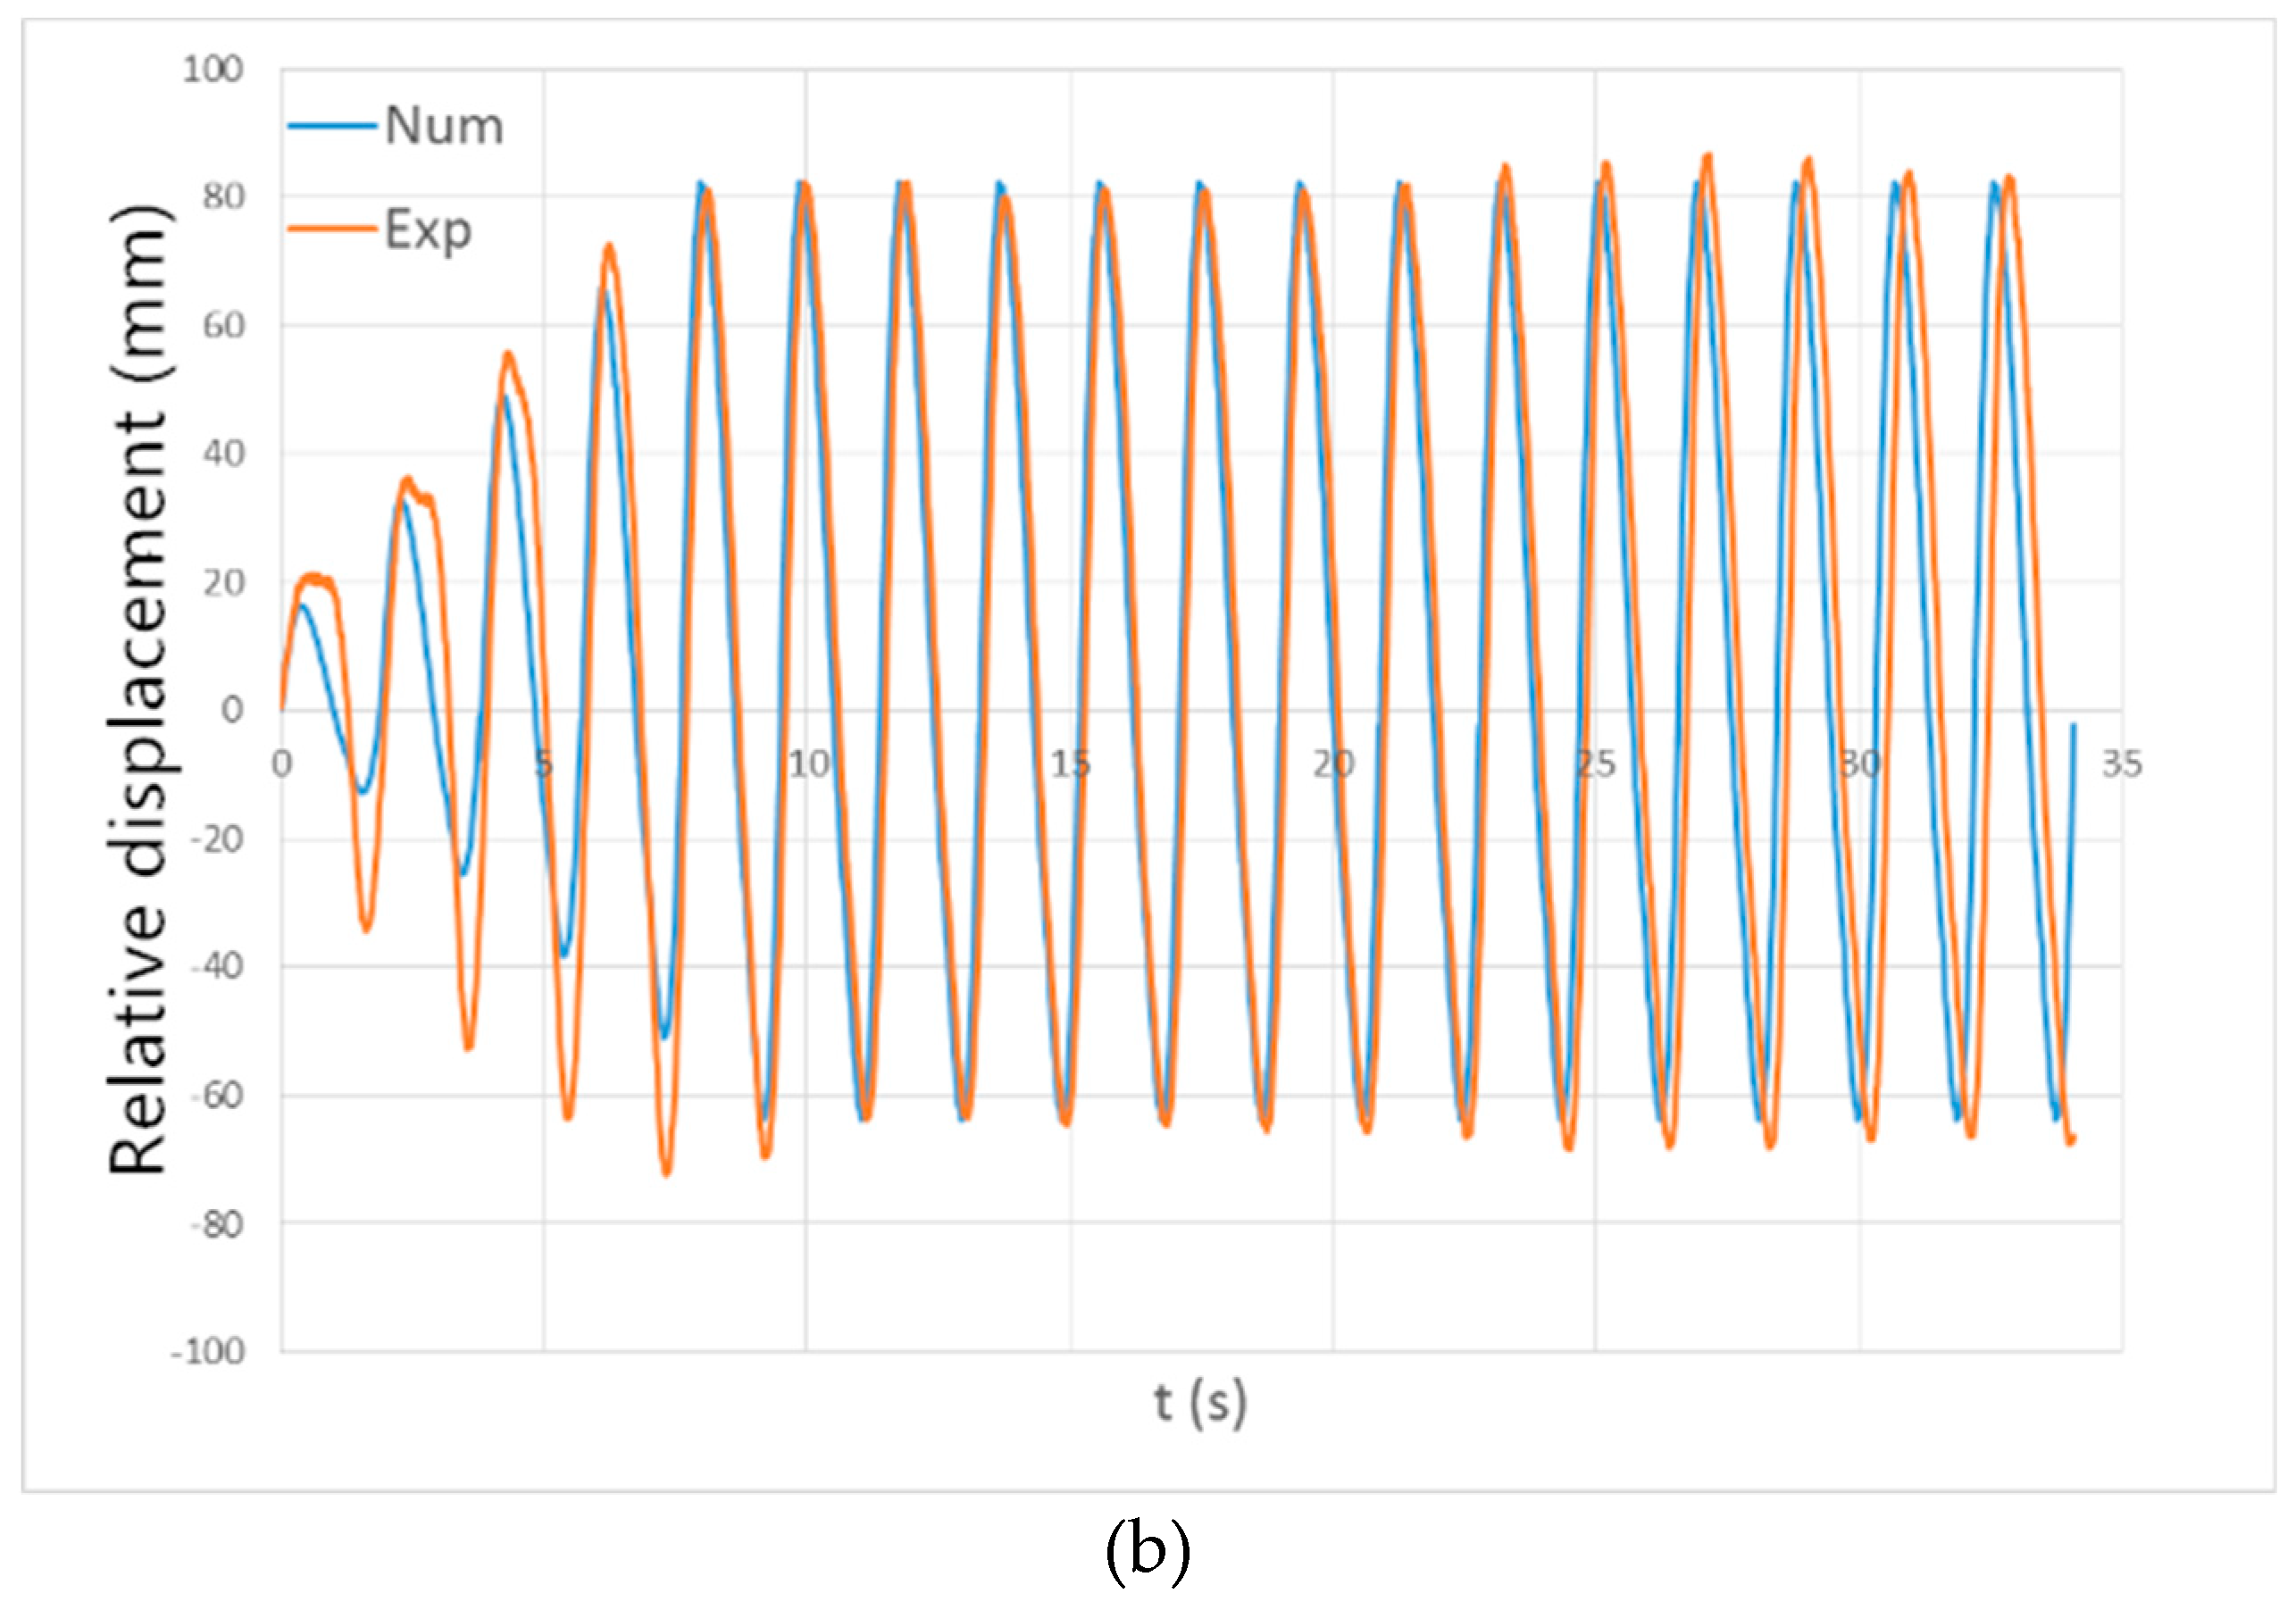
4.4.4. Motion Response Comparation: Time Domain
5. Conclusions
Author Contributions
Funding
Conflicts of Interest
References
- Patel, M.; Neelis, M.; Gielen, D.; Oliver, J.; Simmons, T.; Theunis, J. Carbon dioxide emissions from non-energy use of fossil fuels: Summary of key issues and conclusions from the country analyses. Resour. Conserv. Recycl. 2005, 45, 195–209. [Google Scholar] [CrossRef]
- Cruz, J. Ocean Wave Energy: Current Status and Future Prespectives. Bull. De Lacadémie Natl. De Médecine 2008, 196, 1709–1720. [Google Scholar]
- Chaplin, R.V.; Aggidis, G.A. An Investigation into Power from Pitch-Surge Point-Absorber Wave Energy Converters. In Proceedings of the IEEE ICCEP ’07, International Conference on Clean Electrical Power, Capri, Italy, 21–23 May 2007. [Google Scholar]
- Vicente, P.C.; de O. Falcã, A.F.; Gato, L.M.C.; Justino, P.A.P. Dynamics of arrays of floating point-absorber wave energy converters with inter-body and bottom slack-mooring connections. Appl. Ocean Res. 2009, 31, 267–281. [Google Scholar] [CrossRef]
- Pérez-Collazo, C.; Greaves, D.; Iglesias, G. A review of combined wave and offshore wind energy. Renew. Sustain. Energy Rev. 2015, 42, 141–153. [Google Scholar] [CrossRef]
- Muliawan, M.J.; Karimirad, M.; Moan, T.; Gao, Z. Stc (Spar-Torus Combination): A Combined Spar-Type Floating Wind Turbine and Large Point Absorber Floating Wave Energy Converter—Promising and Challenging. In Proceedings of the ASME 2012 31st International Conference on Ocean, Offshore and Arctic Engineering, Rio de Janeiro, Brazil, 1–6 July 2012; American Society of Mechanical Engineers: New York, NY, USA, 2012; pp. 667–676. [Google Scholar]
- Ohya, Y.; Karasudani, T.; Nagai, T.; Watanabe, K. Wind lens technology and its application to wind and water turbine and beyond. Renew. Energy Environ. Sustain. 2017, 2, 2. [Google Scholar] [CrossRef]
- Pelagic Power AS. W2Power Web Page. 2010. Available online: http://www.pelagicpower.no/ (accessed on 8 May 2020).
- Lee, H.; Bae, Y.H.; Kim, K.H.; Park, S.; Hong, K. Influence of Second-Order Difference-Frequency Wave Loads on the Floating Wind-Wave Hybrid Platform. In Proceedings of the Asme International Conference on Ocean, Trondheim, Norway, 25–30 June 2017. [Google Scholar] [CrossRef]
- Manchester Bobber wave power [Internet]. UK: REUK; c2006-16. 2015 December 18. Available online: http://www.reuk.co.uk/Manchester-Bobber-Wave-Power.htm (accessed on 29 January 2016).
- Karimirad, M.; Koushan, K. WindWEC: Combining Wind and Wave Energy Inspired by Hywind and Wavestar. In Proceedings of the International Conference on Renewable Energy Research & Applications, Birmingham, UK, 20–23 November 2016. [Google Scholar] [CrossRef]
- Arunkumar, C.; Venkateswaran, V.; Kim, S.-J. A fully packed spheroidal hybrid generator for water wave energy harvesting and self-powered position tracking. Nano Energy 2020, 69, 104439. [Google Scholar]
- Chandrasekhar, A.; Vivekananthan, V.; Khandelwal, G.; Kim, S.-J. A Sustainable Blue Energy Scavenging Smart Buoy toward Self-Powered Smart Fishing Net Tracker. ACS Sustain. Chem. Eng. 2020, 8, 4120–4127. [Google Scholar] [CrossRef]
- Liu, H.; Zhang, W. Wave energy converter with funnel-shape moonpool structure. Authorization code: ZL201610293268.8. Available online: http://cprs.patentstar.com.cn/Search/Detail?ANE=9EDA9DHB8HAA9GAD9EFB9HFD9FGE9BCD9IEG6AEAAGFA9HBH (accessed on 8 May 2020).
- Borg, M.; Collu, M.; Brennan, F.P. Use of a Wave Energy Converter as a Motion Suppression Device for Floating Wind Turbines. Energy Procedia 2013, 35, 223–233. [Google Scholar] [CrossRef]
- Taghipour, R.; Moan, T. Efficient Frequency-Domain Analysis of Dynamic Response of the Multi-Body Wave Energy Converter in Multi-Directional Waves. In Proceedings of the Eighteenth International Offshore and Polar Engineering Conference, Vancouver, CA, Canada, 6–11 July 2008. [Google Scholar]
- Lee, H.; Poguluri, S.; Bae, Y. Performance Analysis of Multiple Wave Energy Converters Placed on a Floating Platform in the Frequency Domain. Energies 2018, 11, 406. [Google Scholar] [CrossRef]
- Lee, H.; Bae, Y.H.; Cho, I.H.; Kim, K.H.; Hong, K. One-way Coupled Dynamic Analysis of Floating Platform with Wave Energy Converters. J. Ocean Wind Energy 2016, 3, 53–60. [Google Scholar] [CrossRef]
- Lo, D.C.; Hsu, T.; Yang, C. Hydrodynamic Performances of Wave Pass Two Buoys-Type Wave Energy Converter. Int. Soc. Offshore Polar Eng. 2016, 25–30, Accession number: 20175204583493. [Google Scholar]
- Jin, S.; Patton, R.J.; Guo, B. Viscosity effect on a point absorber wave energy converter hydrodynamics validated by simulation and experiment. Renew. Energy 2018, 129, 500–512. [Google Scholar] [CrossRef]
- Liu, H.-X.; Chen, H.-L.; Zhang, L.; Zhang, W.-C.; Liu, M. Quadratic Dissipation Effect on the Moonpool Resonance. China Ocean Eng. 2017, 31, 665–673. [Google Scholar] [CrossRef]
- Zheng, X.; Yong, M.; Zhang, L.; Jiang, J.; Liu, H.-X. Experimental Investigation on the Hydrodynamic Performance of A Wave Energy Converter. China Ocean Eng. 2017, 31, 1–8. [Google Scholar] [CrossRef]
- Ren, N.; Ma, Z.; Fan, T.; Zhai, G.; Ou, J. Experimental and numerical study of hydrodynamic responses of a new combined monopile wind turbine and a heave-type wave energy converter under typical operational conditions. Ocean Eng. 2018, 159, 1–8. [Google Scholar] [CrossRef]
- Gao, Z.; Moan, T.; Wan, L.; Michailides, C. Comparative numerical and experimental study of two combined wind and wave energy concepts. J. Ocean Eng. Sci. 2015, 1, 36–51. [Google Scholar] [CrossRef]
- Wan, L.; Greco, M.; Lugni, C.; Lugni, C.; Gao, Z.; Moan, T. A combined wind and wave energy-converter concept in survival mode: Numerical and experimental study in regular waves with a focus on water entry and exit. Appl. Ocean Res. 2017, 63, 200–216. [Google Scholar] [CrossRef]
- Wan, L.; Gao, Z.; Moan, T. Experimental and numerical study of hydrodynamic responses of a combined wind and wave energy converter concept in survival modes. Coast. Eng. 2015, 104, 151–169. [Google Scholar] [CrossRef]
- Wan, L.; Gao, Z.; Moan, T.; Lugni, C. Experimental and numerical comparisons of hydrodynamic responses for a combined wind and wave energy converter concept under operational conditions. Renew. Energy 2016, 93, 87–100. [Google Scholar] [CrossRef]
- Liu, H. Stress analysis of the structural interface between the spar and the torus in the combined wind and wave energy concept STC. Pol. Political Leg. Anthropol. Rev. 1955, 16, 16–30. [Google Scholar]
- Chen, W.; Gao, F.; Meng, X.; Chen, B.; Ren, A. W2P: A high-power integrated generation unit for offshore wind power and ocean wave energy. Ocean Eng. 2016, 128, 41–47. [Google Scholar] [CrossRef]
- Chybowski, L.; Grządziel, Z.; Gawdzińska, K. Simulation and Experimental Studies of a Multi-Tubular Floating Sea Wave Damper. Energies 2018, 11, 1012. [Google Scholar] [CrossRef]
- Wu, J.; Yao, Y.; Sun, D.; Ni, Z.; Göteman, M. Numerical and Experimental Study of the Solo Duck Wave Energy Converter. Energies 2019, 12, 1941. [Google Scholar] [CrossRef]
- Thomas, S.; Eriksson, M.; Goyeman, M.; Hann, M.; Isberg, J.; Engström, J. Experimental and Numerical Collaborative Latching Control of Wave Energy Converter Arrays. Energies 2018, 11, 3036. [Google Scholar] [CrossRef]
- Fankai, K.; Hengxu, L.; Weiming, S.; Jingtao, A.; Hailong, C.; Fengmei, J. Analytical and numerical analysis of the dynamics of a moonpool platform-wave energy buoy (MP-WEB). Energies 2019, 10, 21. [Google Scholar]
- Xiaobo, C. Offshore hydrodynamics and applications. Ies J. Part A Civ. Struct. Eng. 2011, 4, 124–142. [Google Scholar]
- Yu, Y.-H.; Li, Y. Reynolds-Averaged Navier–Stokes simulation of the heave performance of a two-body floating-point absorber wave energy system. Comput. Fluids 2013, 73, 104–114. [Google Scholar] [CrossRef]
- Jing, Q. A Simple Fluid Model for CFD Research Based on STAR-CCM+; Hydraulics Pneumatics & Seals: Sichuan, China, 2010; Volume 30, pp. 8–10. [Google Scholar]
- Patankar, S.V.; Spalding, D.B. A calculation procedure for heat, mass and momentum transfer in three-dimensional parabolic flows. Int. J. Heat Mass Transf. 1972, 15, 1787–1806. [Google Scholar] [CrossRef]


| Variables | Entity Symbol | Model Symbol | Scale Factor | Scale Factor |
|---|---|---|---|---|
| Length | 10 | |||
| Area | 100 | |||
| Volume | 1000 | |||
| Fluid density | 1.025 | |||
| Displacement | 1025 | |||
| Wave period | 3.15 | |||
| Wave circular frequency | 0.32 | |||
| Velocity | 3.15 | |||
| Acceleration | 1 | |||
| Power | 3241.3 |
| Working Scenario Number | Wave Height (m) | Period (s) | Working Condition | Wave Height (m) | Period (s) |
|---|---|---|---|---|---|
| 1 | 0.12 | 1.2 | 8 | 0.12 | 2.3 |
| 2 | 0.12 | 1.4 | 9 | 0.12 | 2.4 |
| 3 | 0.12 | 1.6 | 10 | 0.12 | 2.5 |
| 4 | 0.12 | 1.8 | 11 | 0.12 | 2.6 |
| 5 | 0.12 | 2.0 | 12 | 0.12 | 2.7 |
| 6 | 0.12 | 2.1 | 13 | 0.12 | 2.8 |
| 7 | 0.12 | 2.2 | 14 | 0.12 | 3.0 |
| The Resistance of the Resistance Box (Ω) | Output Power (W) |
|---|---|
| 5 | 0.56 |
| 10 | 0.80 |
| 20 | 0.97 |
| 30 | 0.95 |
| 40 | 0.87 |
| 50 | 0.79 |
| Wave Period (s) | Experimental Data (mm) | Numerical Data (mm) | Error Analysis (%) |
|---|---|---|---|
| 1.2 | 21.8 | 29.0 | 33.1 |
| 1.4 | 38.4 | 36.2 | 5.8 |
| 1.6 | 50.4 | 40.9 | 18.9 |
| 1.8 | 45.7 | 44.0 | 3.9 |
| 2.0 | 44.7 | 45.9 | 2.7 |
| 2.1 | 43.4 | 46.6 | 7.4 |
| 2.2 | 48.8 | 47.1 | 3.5 |
| 2.3 | 50.5 | 47.6 | 5.7 |
| 2.4 | 49.0 | 47.9 | 2.1 |
| 2.5 | 48.7 | 48.3 | 0.8 |
| 2.6 | 49.6 | 48.5 | 2.3 |
| 2.7 | 47.3 | 48.7 | 2.9 |
| 2.8 | 46.3 | 48.8 | 5.5 |
| 3.0 | 48.2 | 49.1 | 1.8 |
| The Resistance of Resistance Box (Ω) | Output Power (W) |
|---|---|
| 5 | 0.62 |
| 10 | 1.55 |
| 20 | 1.68 |
| 30 | 0.83 |
| 40 | 0.86 |
| 50 | 0.84 |
| Wave Period (s) | Experimental Data (mm) | Numerical Data (mm) | Error Analysis (%) |
|---|---|---|---|
| 1.2 | 0.0 | 1.0 | 100 |
| 1.4 | 8.0 | 6.3 | 21.3 |
| 1.6 | 18.2 | 20.5 | 12.6 |
| 1.8 | 88.0 | 100.4 | 14.1 |
| 2.0 | 40.0 | 30.5 | 23.8 |
| 2.1 | 62.0 | 40.5 | 34.7 |
| 2.2 | 79.5 | 80.4 | 1.1 |
| 2.3 | 69.5 | 70.7 | 1.7 |
| 2.4 | 64.7 | 56.8 | 12.2 |
| 2.5 | 58.3 | 48.2 | 17.3 |
| 2.6 | 50.1 | 45.1 | 10.0 |
| 2.7 | 47.7 | 43.3 | 9.2 |
| 2.8 | 47.7 | 42.6 | 10.7 |
| 3.0 | 45.0 | 40.3 | 10.4 |
© 2020 by the authors. Licensee MDPI, Basel, Switzerland. This article is an open access article distributed under the terms and conditions of the Creative Commons Attribution (CC BY) license (http://creativecommons.org/licenses/by/4.0/).
Share and Cite
Liu, H.; Yan, F.; Jing, F.; Ao, J.; Han, Z.; Kong, F. Numerical and Experimental Investigation on a Moonpool-Buoy Wave Energy Converter. Energies 2020, 13, 2364. https://doi.org/10.3390/en13092364
Liu H, Yan F, Jing F, Ao J, Han Z, Kong F. Numerical and Experimental Investigation on a Moonpool-Buoy Wave Energy Converter. Energies. 2020; 13(9):2364. https://doi.org/10.3390/en13092364
Chicago/Turabian StyleLiu, Hengxu, Feng Yan, Fengmei Jing, Jingtao Ao, Zhaoliang Han, and Fankai Kong. 2020. "Numerical and Experimental Investigation on a Moonpool-Buoy Wave Energy Converter" Energies 13, no. 9: 2364. https://doi.org/10.3390/en13092364
APA StyleLiu, H., Yan, F., Jing, F., Ao, J., Han, Z., & Kong, F. (2020). Numerical and Experimental Investigation on a Moonpool-Buoy Wave Energy Converter. Energies, 13(9), 2364. https://doi.org/10.3390/en13092364