Abstract
For renewable ocean wave energy to support global energy demands, wave energy converters (WECs) will likely be deployed in large numbers (farms), which will necessarily change the nearshore environment. Wave farm induced changes can be both helpful (e.g., beneficial habitat and coastal protection) and potentially harmful (e.g., degraded habitat, recreational, and commercial use) to existing users of the coastal environment. It is essential to estimate this impact through modeling prior to the development of a farm, and to that end, many researchers have used spectral wave models, such as Simulating WAves Nearshore (SWAN), to assess wave farm impacts. However, the validity of the approaches used within SWAN have not been thoroughly verified or validated. Herein, a version of SWAN, called Sandia National Laboratories (SNL)-SWAN, which has a specialized WEC implementation, is verified by comparing its wave field outputs to those of linear wave interaction theory (LWIT), where LWIT is theoretically more appropriate for modeling wave-body interactions and wave field effects. The focus is on medium-sized arrays of 27 WECs, wave periods, and directional spreading representative of likely conditions, as well as the impact on the nearshore. A quantitative metric, the Mean Squared Skill Score, is used. Results show that the performance of SNL-SWAN as compared to LWIT is “Good” to “Excellent”.
1. Introduction
Renewable energy from ocean waves has the potential to play a large role in the world’s future energy supply; the theoretically available wave power resource is around 2.1 TW [1]. For wave energy to be extracted economically at a large scale, wave energy converters (WECs) need to be deployed in arrays, or farms, consisting of many devices clustered together, facilitating operations and maintenance, and maximizing the use of infrastructure, like subsea cables.
By the conservation of energy, extracting energy from the wave field means that there must be a net reduction of wave heights in the region of the array. It is well understood within the field of coastal engineering that variations in wave heights can result in wave-driven currents and sediment transport. As such, wave farm driven environmental changes have the potential to both positively (e.g., coastal resilience) and negatively (e.g., adverse habitat change) impact adjacent beaches and coastal ecosystems. Evaluation tools must be able to optimize array designs to balance energy generation with environmental impacts.
Researchers have investigated the impact of wave farms on nearshore processes, often using phase-averaged, spectral numerical models, such as SWAN (Simulating WAves Nearshore) [2]. Millar et al. [3] used SWAN to model the impact of a 30 MW Wave Hub farm in Cornwall, UK; WECs were modeled via an energy transmission coefficient constant across frequency. While not wave energy, Ponce de Leon et al. [4] evaluated the effects of an offshore wind farm using SWAN, considering the the impacts on a micro level (a single monopile) and a macro level (an array of monopiles). Smith et al. [5] improved upon Millar et al.’s [3] model of WECs by modifying SWAN to include frequency dependent energy transmission, which is more representative of WEC behavior. Iglesias and Veigas [6] used SWAN with various transmission coefficients in a sensitivity analysis to assess the potential nearshore impacts of a wave farm in Tenerife. Carballo and Iglesias [7] and Abanades et al. [8] used SWAN to model the impact of wave farms where the wave transmission coefficient was extracted from experiments. Rusu and Onea [9] employed a model coupling SWAN with NSSM (Navy Standard Surf Model), capable of evaluating nearshore processes, such as longshore currents, to assess the impacts of large wave farms. Using SWAN, Astariz and Iglesias [10] considered the shielding effect that wave farms could provide for offshore wind farms by reducing wave heights within the wind farm.
In support of this effort to understand the environmental impacts of wave farms, Sandia National Laboratories in Albuquerque, New Mexico, USA, has developed SNL-SWAN [11], in which under one option, WECs can be modeled as a reduction in energy transmission in the lee of an obstacle based on the WEC’s frequency-dependent power capture curve; this results in a so-called wave shadow. While not present at the time of SNL-SWAN’s development, there is also now an equivalent feature available in SWAN, which allows the user to define a frequency-dependent transmission coefficient. However, it should be noted that SNL-SWAN still includes features for modeling WECs not present in baseline SWAN.
SNL-SWAN has been employed by researchers to assess wave farm impacts. Chang et al. [12] used SNL-SWAN to model the impact of WEC arrays in the near- and far-field near Santa Cruz, California considering the sensitivity of the impacts to WEC type and size, and array configuration and size. Luczko et al. [13] used various options in SNL-SWAN to model the impact on the wave field and on power capture for a 5 WEC array.
However, as pointed out by Stratigaki et al. [14], ‘wave propagation models’, such as SWAN, are useful for assessing large farms over large areas and far-field effects, but to properly model wave-structure interactions, wave energy absorption, and near-field wave effects, one should use a ‘wave-structure interaction solver’. This is because, SNL-SWAN and similar software model the impact of wave farms as a down-wave wave shadow; there is no up-wave effect. However, WECs do not just influence the down-wave wave field, they scatter and radiate waves in generally circular patterns.
The validity of the SNL-SWAN approach must be examined by comparing the wave fields it produces to other sources of data. Several studies have verified the performance of spectral wave models at assessing the impact of WECs on the wave field. Özkan Haller [15] carried out experiments on WEC arrays, collecting wave height data that was compared to modeled results from SWAN and modeled results from WAMIT [16]. Greenwood et al. [17] compared the results of modeling a small WEC array using Boussinesq wave model and a spectral wave model using the software MIKE, showing that the agreement between the two depended on wave conditions and the implementation of diffraction in the spectral wave model. Venugopal et al. [18] used WAMIT to produce power capture curves of two types of WECs, which were fed into the spectral wave model in MIKE. The authors verified the performance of the spectral wave model through comparison for a few small array cases.
The authors of this paper have previously carried out two studies comparing the wave field produced by SNL-SWAN to that produced by the linear wave boundary-element method (BEM) code, WAMIT [16]. WAMIT is used as a reference because it solves the linear wave boundary value problem, and within the assumptions of linear wave theory, it accurately represents the scattered and radiated waves of a single WEC or a WEC array. In McNatt et al. [19], the resulting wave fields from SNL-SWAN and WAMIT produced by three types of single WECs were compared over a variety of incident wave types including regular, unidirectional, and directionally spread spectral seas. In McNatt et al. [20], this was extended to small WEC arrays. Qualitative and quantitative comparisons were made of the wave field in what is typically referred to as the “far field”, that is, at some distance from the array. Findings showed that WEC reflection, which is modeled in WAMIT, but not in SNL-SWAN resulted in higher SNL-SWAN error, and that the error also was higher for regular waves and unidirectional waves.
The short-comings of previous comparative studies of WECs in spectral wave models are that they considered only small WEC arrays, and the verification cases consisted of only the near-array region modeled over a flat bathymetry.
Here, SNL-SWAN is further verified by comparison with linear wave-body theory through additional considerations aimed at making the study more representative of real conditions:
- Medium-sized arrays of 27 WECs are modeled, representing a medium-sized wave farm. Smaller arrays of 5 WECs were compared in McNatt et al. [20], and, while larger arrays could be considered in the future, an array of 27 WECs represents a medium-sized wave farm and is a stepping stone in both the development of commercial wave farms and the verification of SNL-SWAN. To model these arrays, an approach referred to as Linear Wave Interaction Theory (LWIT) was used.
- Only directionally spread sea conditions are modeled, based on literature on the range of realistic directional spreading [21]. The range of directional spreading includes highly focused storm waves, however it does not include idealized purely unidirectional seas. In previous studies, SNL-SWAN did not show good agreement with linear wave theory for unidirectional seas because without the SWAN diffraction option on, it is not capably of wave diffraction [19]. However, directional spreading is a form of wave diffraction and unidirectional seas are not representative of real sea conditions.
- A realistic beach bathymetry is used. In previous studies, the authors considered only a flat sea bottom. However, the aim of SNL-SWAN is to assess the impact of wave farms on nearshore processes. As such, the wave fields produced by each method were fed in as boundary conditions for a SWAN model that propagates the wave field to shore.
The verification of SNL-SWAN by comparison with LWIT is appropriate because LWIT solves the linear-wave boundary value problem and is a type of ‘wave-structure interaction solver’ referred to by Stratigaki et al. [14]. Linear-wave-body theory is widely accepted as a good method for computing wave-body interactions [22], and it has been validated experimentally (e.g., Reference [23]); LWIT in particular has been verified by code-to-code comparison (e.g., Reference [24]).
The novelty in this approach includes the verification of a spectral wave model, again, a medium-sized array (previous work considered at most 5 WECs), the focus on realistic wave conditions, and the verification over beach (non-flat) bathymetry.
The results produced by SNL-SWAN and LWIT are compared as plots of the wave field, as well as a quantitative comparative metric: the Mean Squared Skill Score (MSSS). Results show that the main relative errors between SNL-SWAN and LWIT due to wave reflection in shorter waves, which are modeled by LWIT but not in SNL-SWAN. Despite this, the performance of SNL-SWAN when compared to LWIT is “Good” to “Excellent”.
2. Methods
2.1. Computational Methods
2.1.1. SNL-SWAN
SWAN is a spectral (phase-averaged) wave transformation model acting over the two horizontal spatial dimensions that can be used to generate wind waves and transform wave conditions to a nearshore area. SWAN simulates wind-wave generation, transformation on the current, refraction, shoaling, nonlinear wave-wave interactions, and energy dissipation through white-capping and breaking. Obstacles in SWAN can absorb or reflect energy, but the program does not model wave interactions between bodies.
Implementing WECs within SNL-SWAN is done by introducing obstacles within the model domain. The obstacles are set to be approximately equal to the width of the device in the direction of wave travel. The computational grid resolution is set so that the width can be closely approximated. To effectively capture the width of the device, the minimum recommended computational grid spacing is partially dependent on the ratio of the device size to the array spacing. For the arrays used in this analysis, the computational grid spacing was selected as 1/2 the device diameter in order to resolve the devices in each row of the array. Thus, a dense computational grid is typically required near the array; this could be nested inside a larger environmental grid, but for the purposes of this study, it was not.
Transmission of wave energy through the obstacle is set to be frequency dependent. The amount of energy removed from the incident wave spectra at the seaward side of the obstacle is set based on a WEC’s power capture curve which is calculated from linear wave theory and WAMIT. The amount of energy absorbed by the WEC at each frequency is set in the SWAN obstacle so that both linear wave theory calculation and SNL-SWAN simulations remove equal amounts of energy, at each frequency, from the wave spectra.
2.1.2. Linear Wave Interaction Theory
Although not presented explicitly as a conclusion, a key outcome of the authors’ previous work [20] was that, due to the computation time required, WAMIT was not practical for computing the wave fields of large arrays. Instead, herein, the so-called Linear Wave Interaction Theory (LWIT) is used to compute the linear-wave array wave fields.
LWIT was developed by Kagemoto and Yue [25], who stated that the wave interactions between multiple, separated, floating bodies could be computed by knowing a set of characteristics or wave-amplitude coefficients, which describe (1) the waves that each body radiates while moving and (2) the waves that each body scatters due to incident waves. The wave coefficients of each body can be found in a variety of ways: analytically for cylindrical shapes (e.g., Reference [26]), numerically [27], and from numerical or physical measurements of the wave field [28].
As an example, using an array of two bodies: the waves radiated and scattered by Body A become incident waves on Body B, which in turn scatters those waves and moves radiating waves; both the scattered and radiated waves of body B then become incident waves on Body A, and so on.
Unknown amplitudes of the scattered and radiation waves, as well as of the device forces and motions, can be found in a matrix computation. This means that knowing each body’s wave coefficients allows for the computation of hydrodynamic array interactions without precise knowledge of each body’s geometry. This is opposed to the direct method of array computation by BEM codes (e.g., WAMIT) in which the exact surface of each body in the array is represented by panels. There are fewer unknown values in the Interaction Theory computation than in the direct BEM computation, which is important because matrix solution computational time is proportional to the square of the number of unknowns. Typically, the number of unknown wave amplitudes (LWIT) is two orders of magnitude less than the number of unknown panels amplitudes (BEM), which means that LWIT computation is on the order of 10,000 times faster than a direct computation [28].
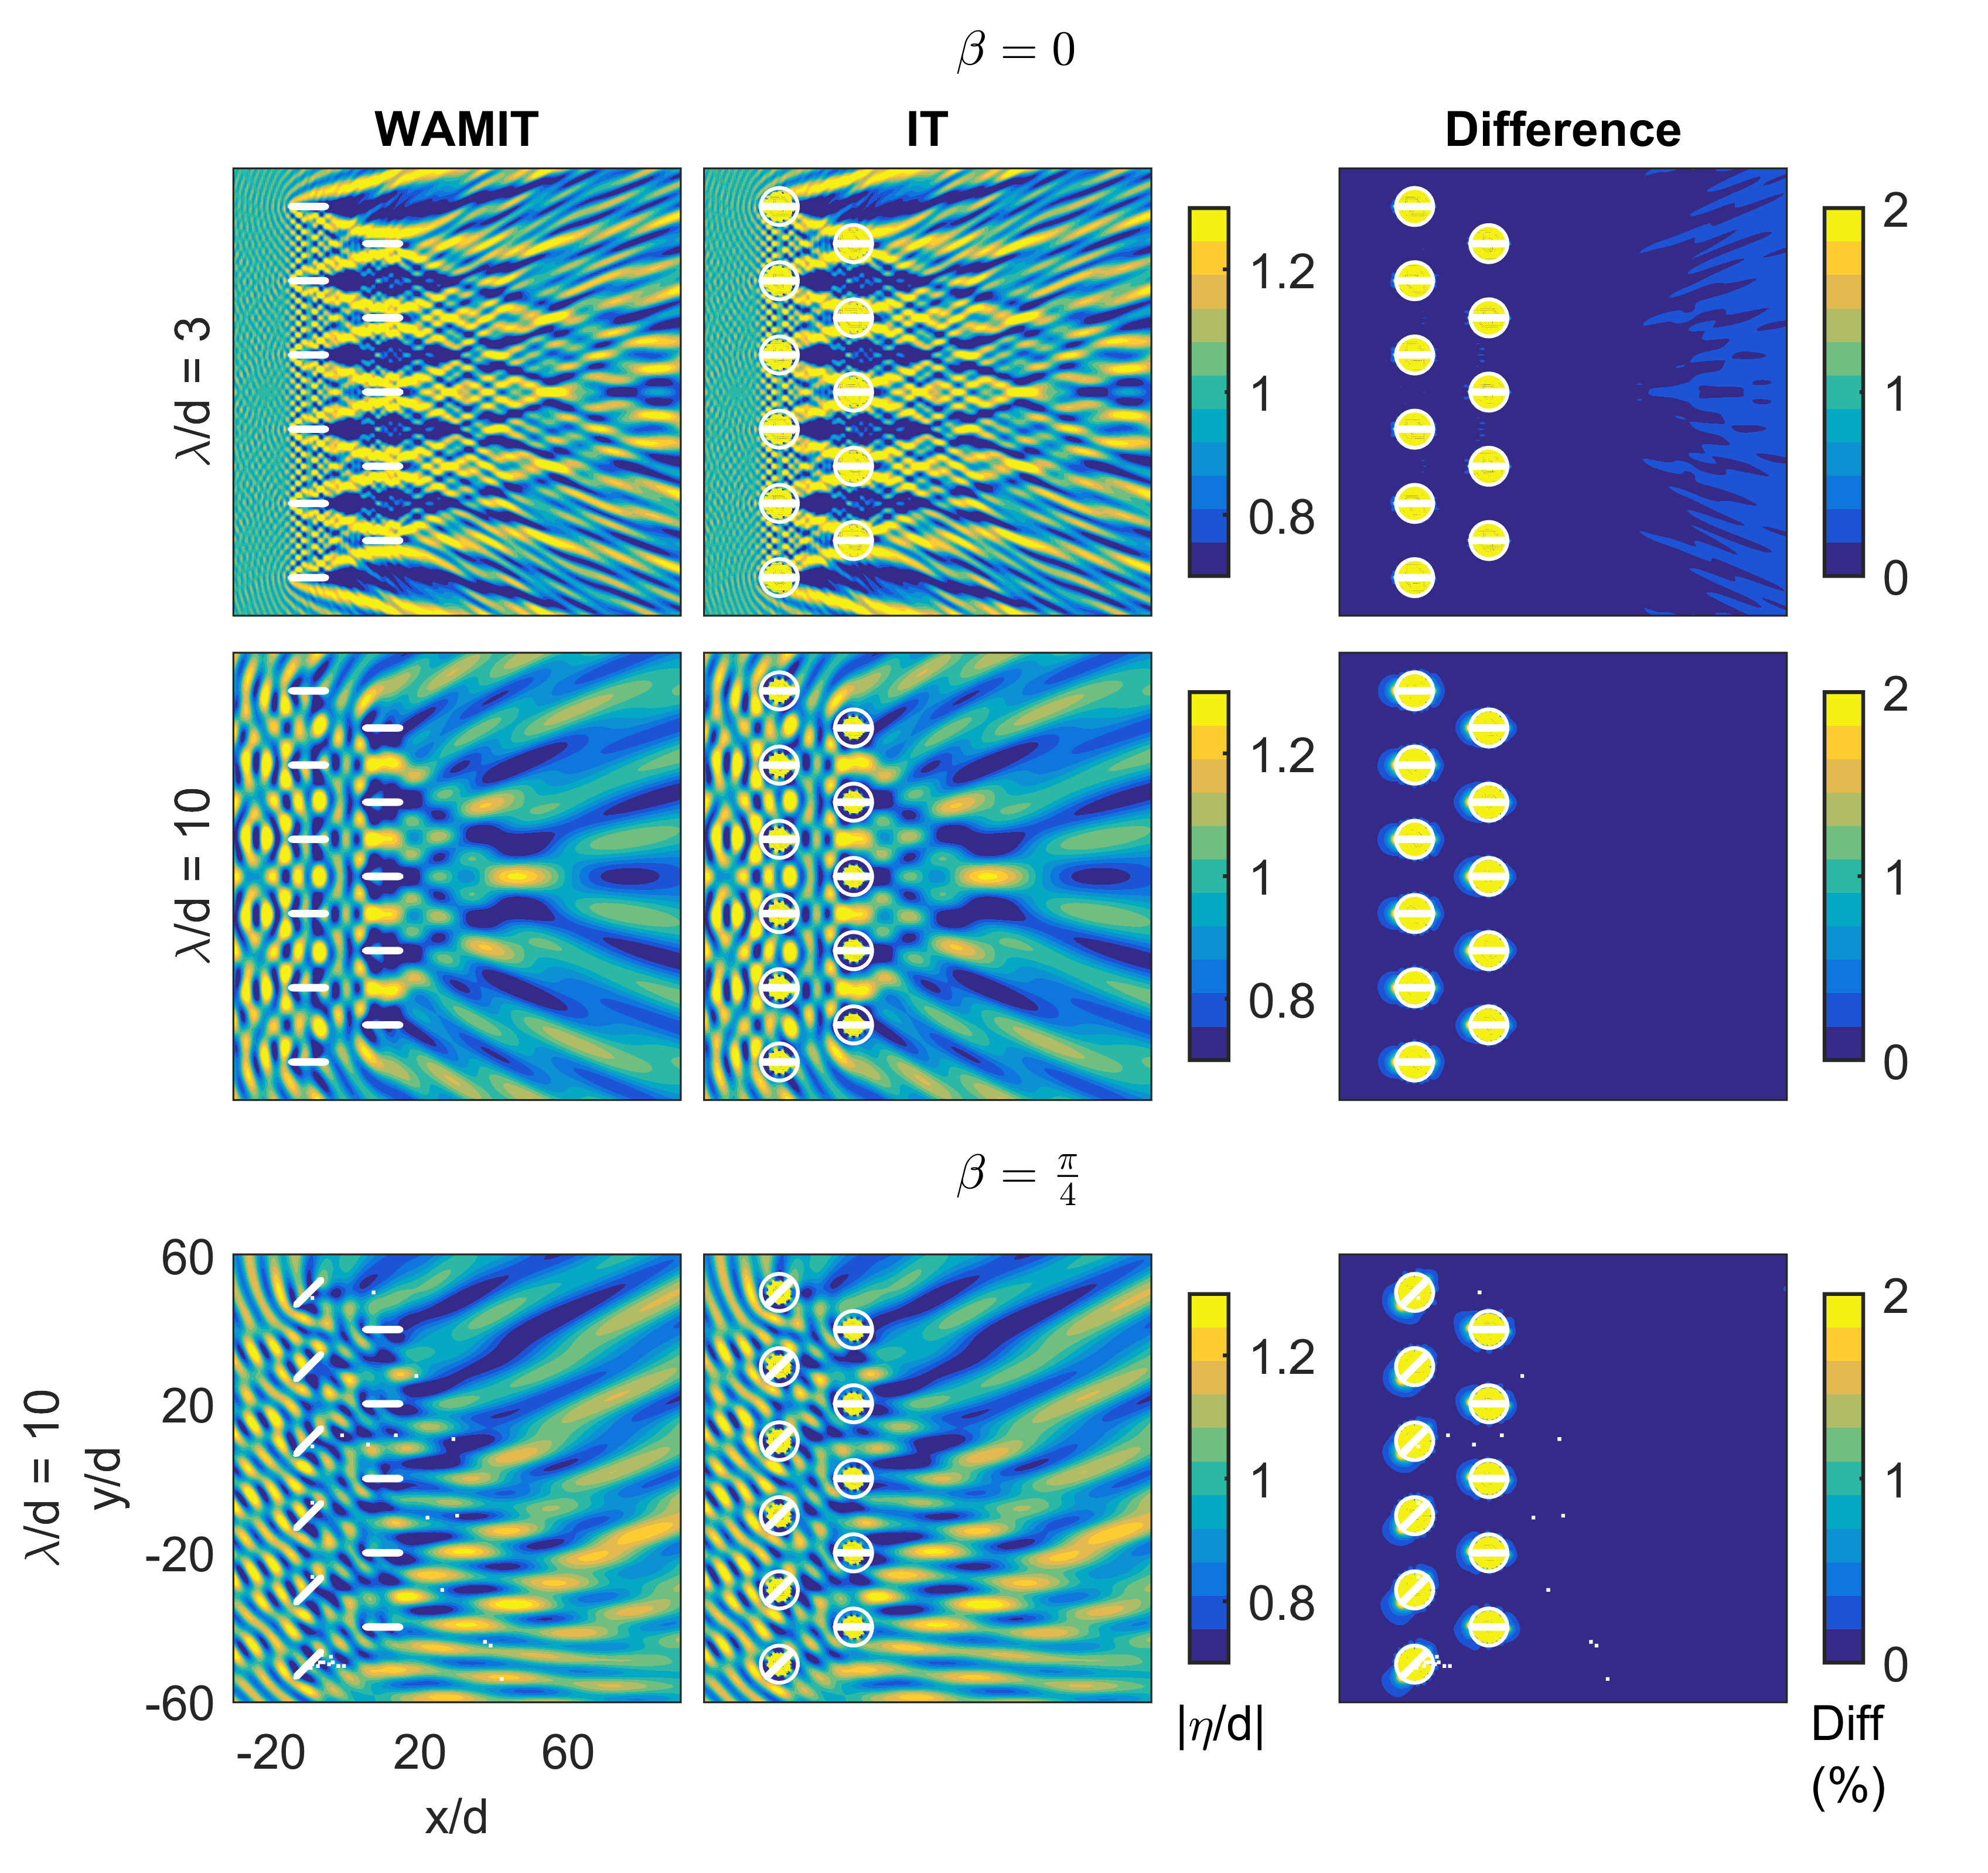
An important aspect of the LWIT is that it is equally as accurate as a direct BEM computation as long as spacing requirements are met, and a sufficient number of wave coefficients are included. Figure 1 shows a comparison of LWIT computation with direct BEM computation using WAMIT from McNatt [28]; except very close to each WEC, there is excellent agreement—the errors in the Interaction Theory compared to WAMIT are less than 0.1% for most of the wave field.

Figure 1.
Result of a verification/comparison of linear wave interaction theory (LWIT) computation to a direct computation using WAMIT from McNatt [28].
2.2. WEC Arrays
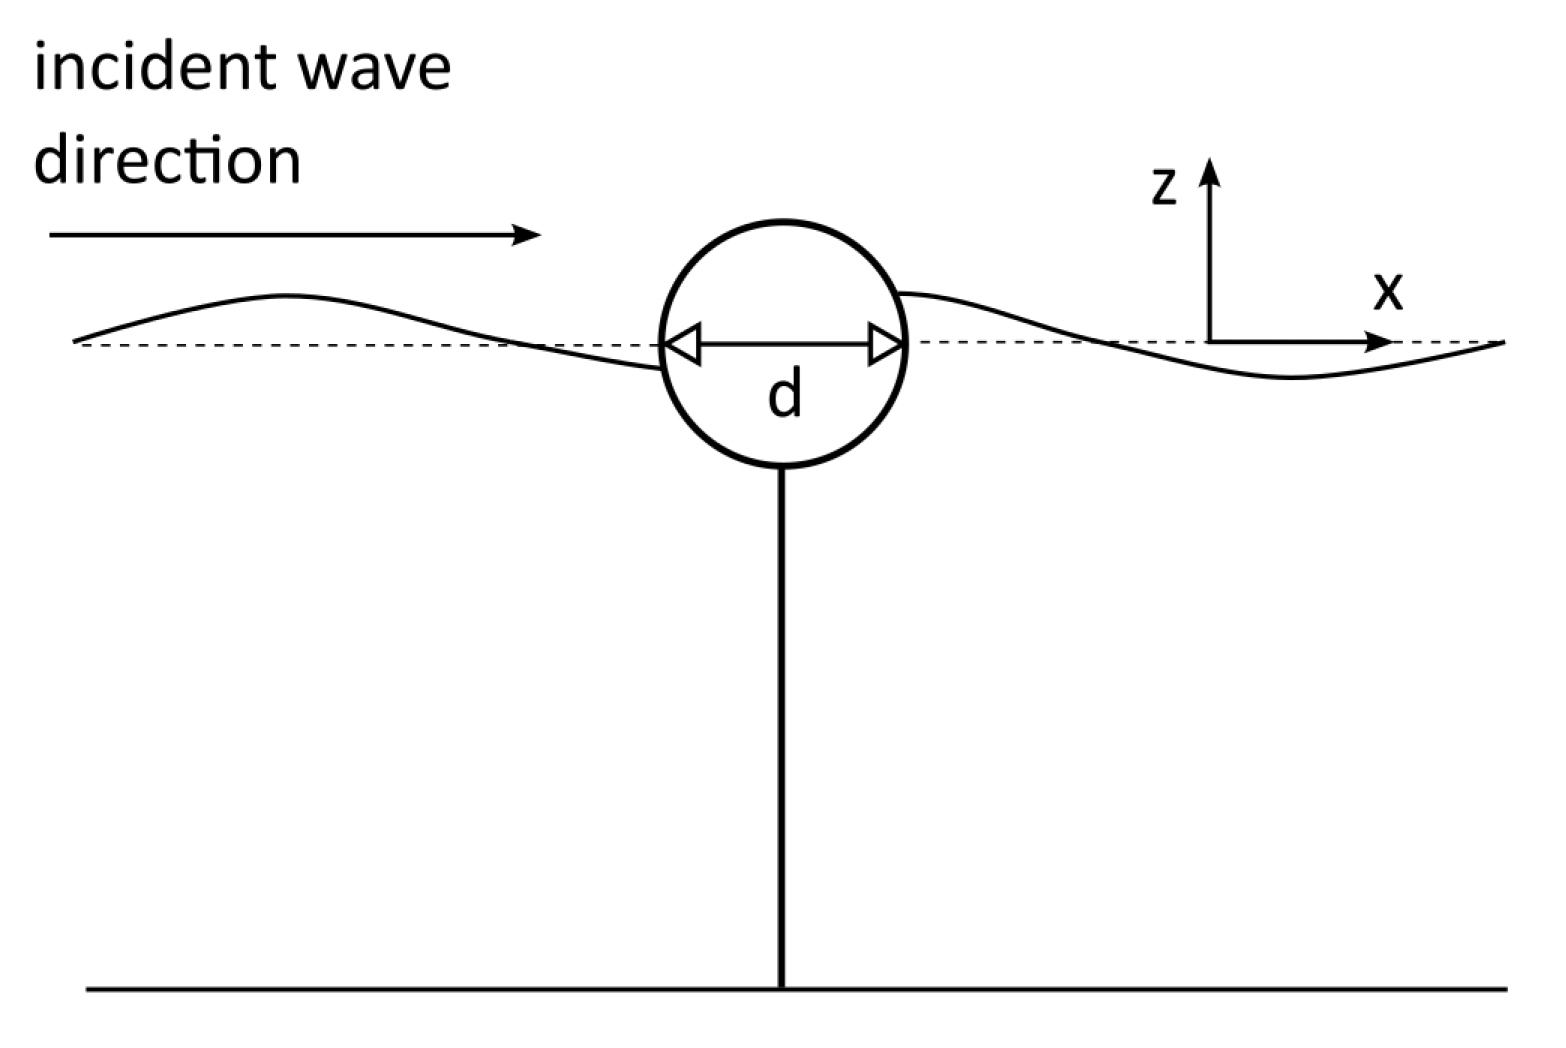
A simple canonical WEC was modeled for the purposes of the study. It is a heaving point absorber consisting of a spherical buoy of diameter, d = 10 m, connected via a taught mooring line to the sea bed, Figure 2. Power is extracted through the heave motion of the buoy. The performance of the WEC was modeled with linear wave theory [22], where the hydrodynamic coefficients were computed with the boundary element method (BEM) code WAMIT [16], in which only the submerged hemisphere of the WEC is modeled.

Figure 2.
Semi-submerged spherical heaving buoy wave energy converter (WEC).
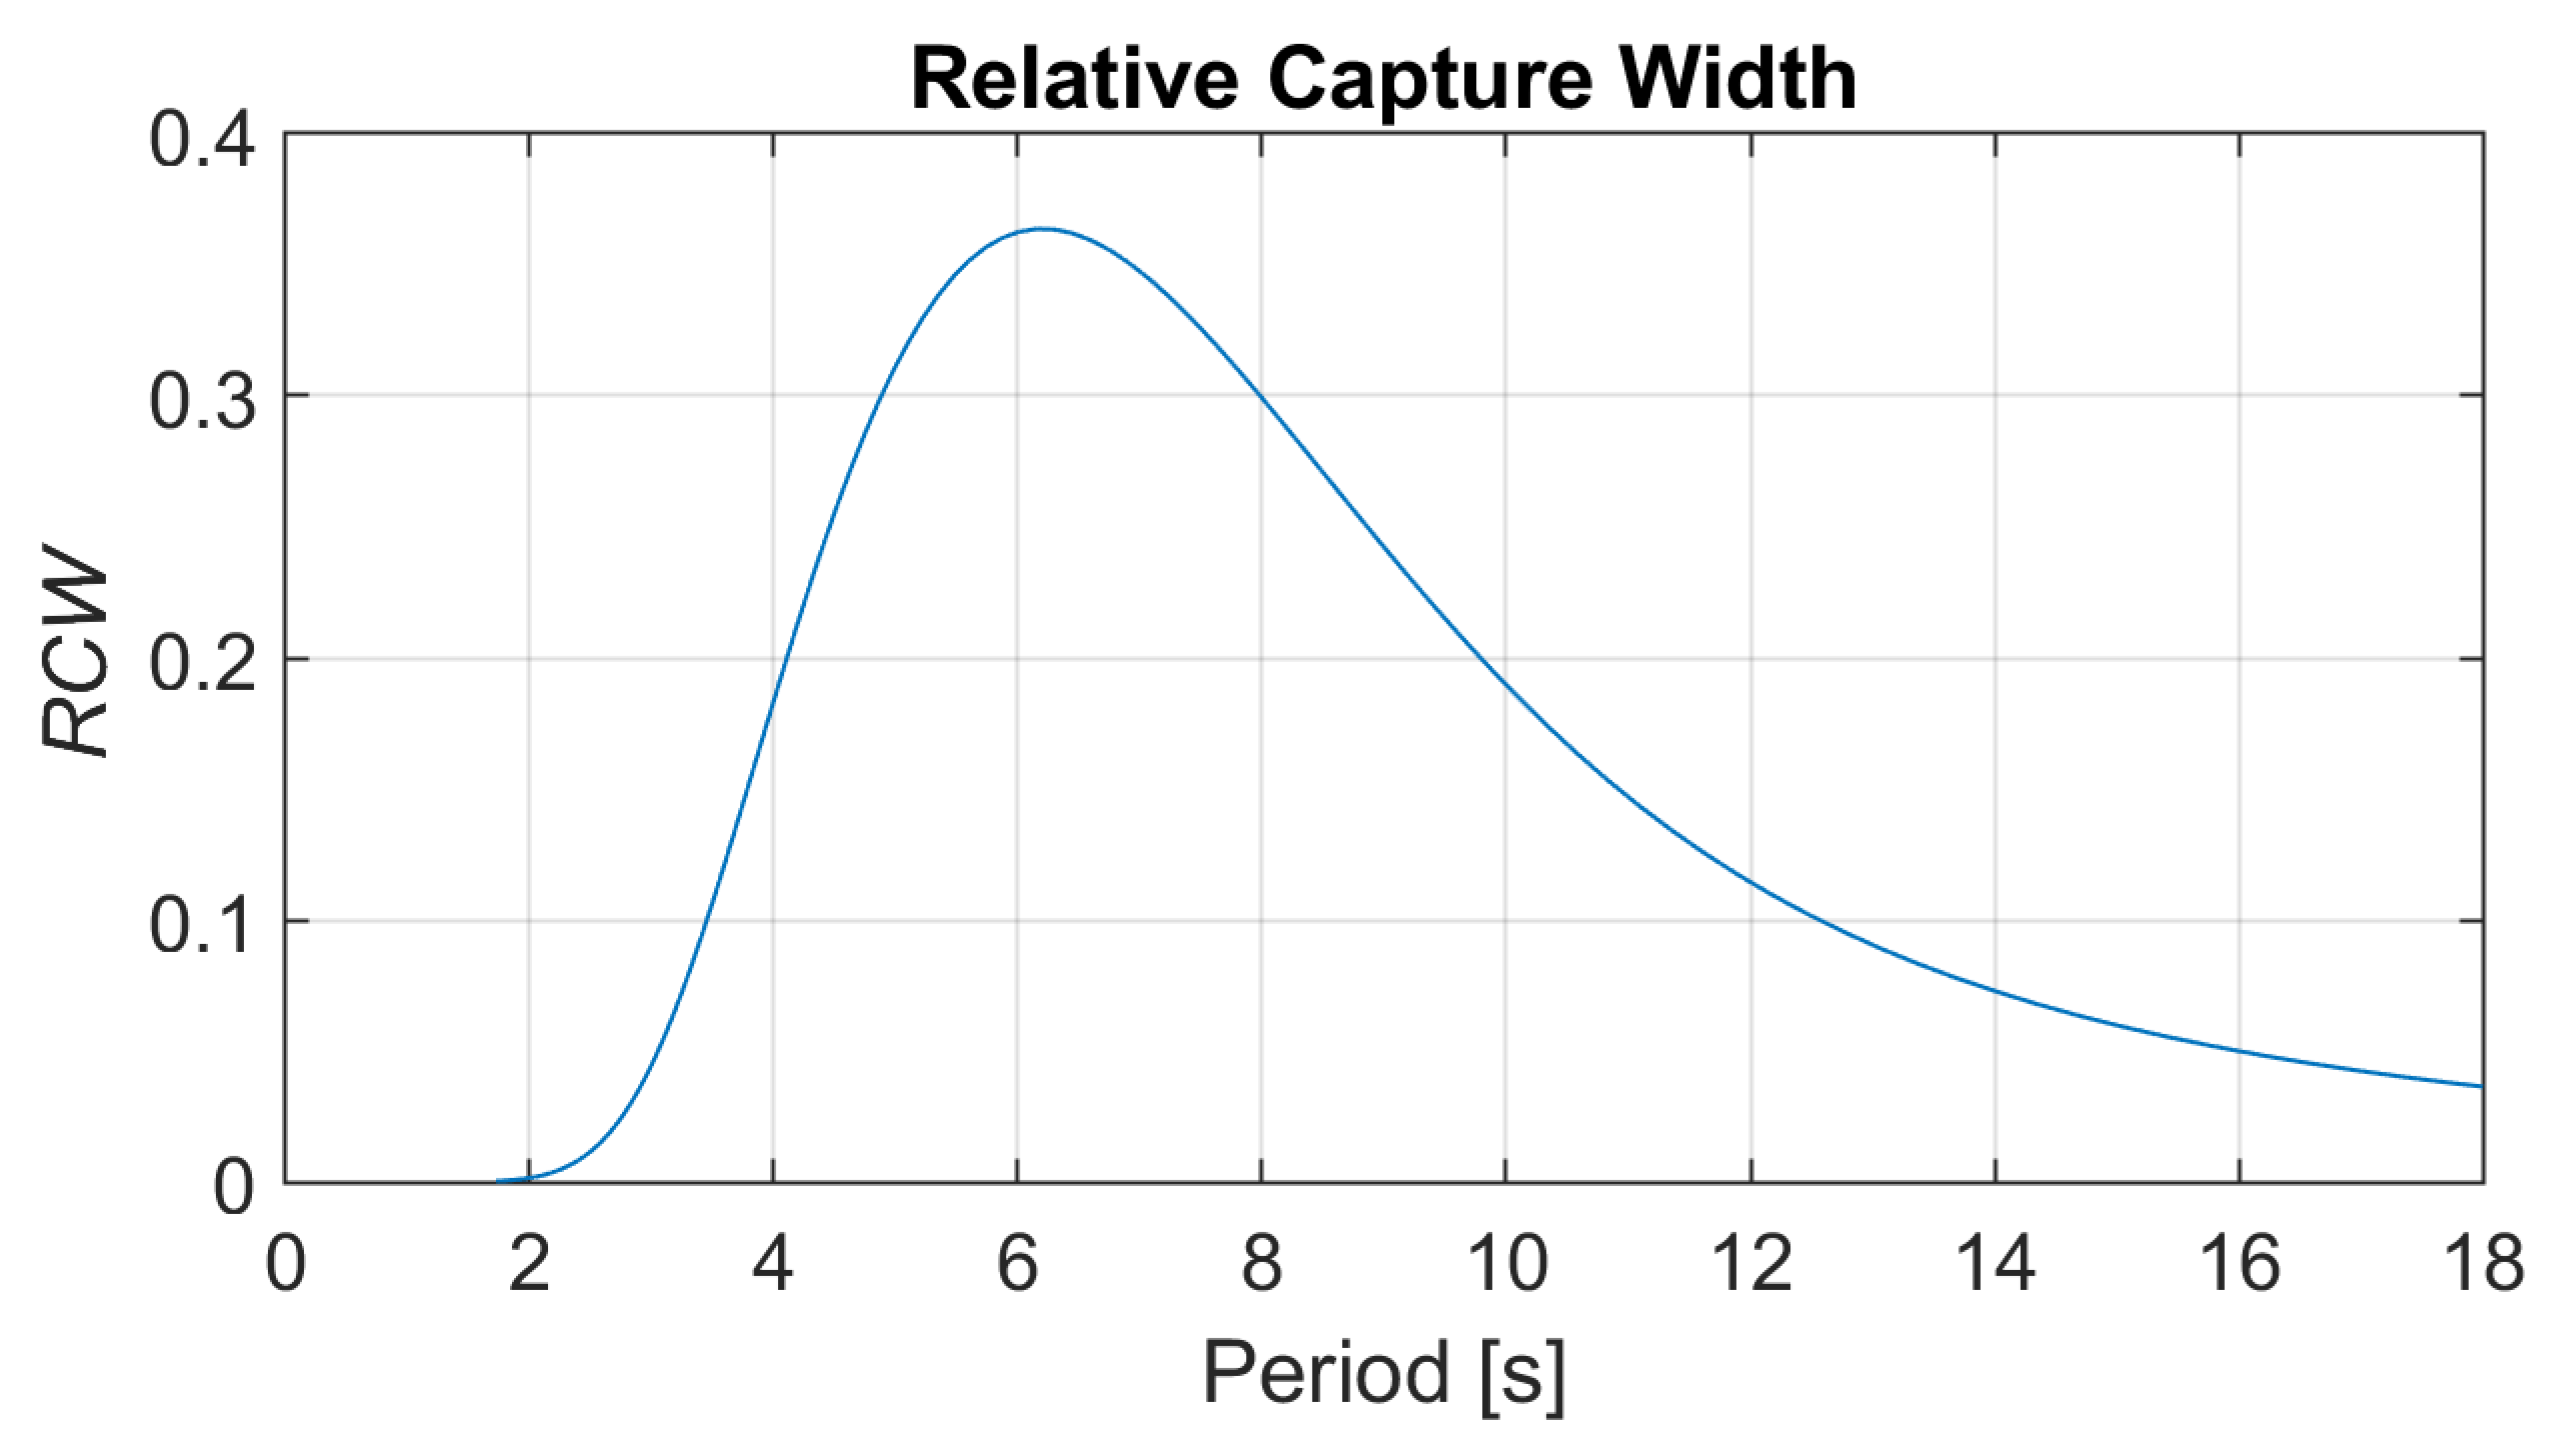
WEC power absorption is characterized by the relative capture width (), which is defined as the ratio of the power absorbed by the WEC to the incident power that passes across the WEC’s width.
where is the radial wave frequency, d is the device width or diameter, is the Please define if appropriate. damping, is the WEC’s motion response, is the water density, g is gravitational constant, and is the wave group velocity, which is a function of and water depth, h. The WEC’s curve is shown in Figure 3.

Figure 3.
The relative capture width () curve of the WEC.
The WEC’s estimated annual energy production at the European Marine Energy Centre (EMEC)’s Billia Croo test site is 520 MWh, which is equivalent to a 150 kW device with a 40% capacity factor.
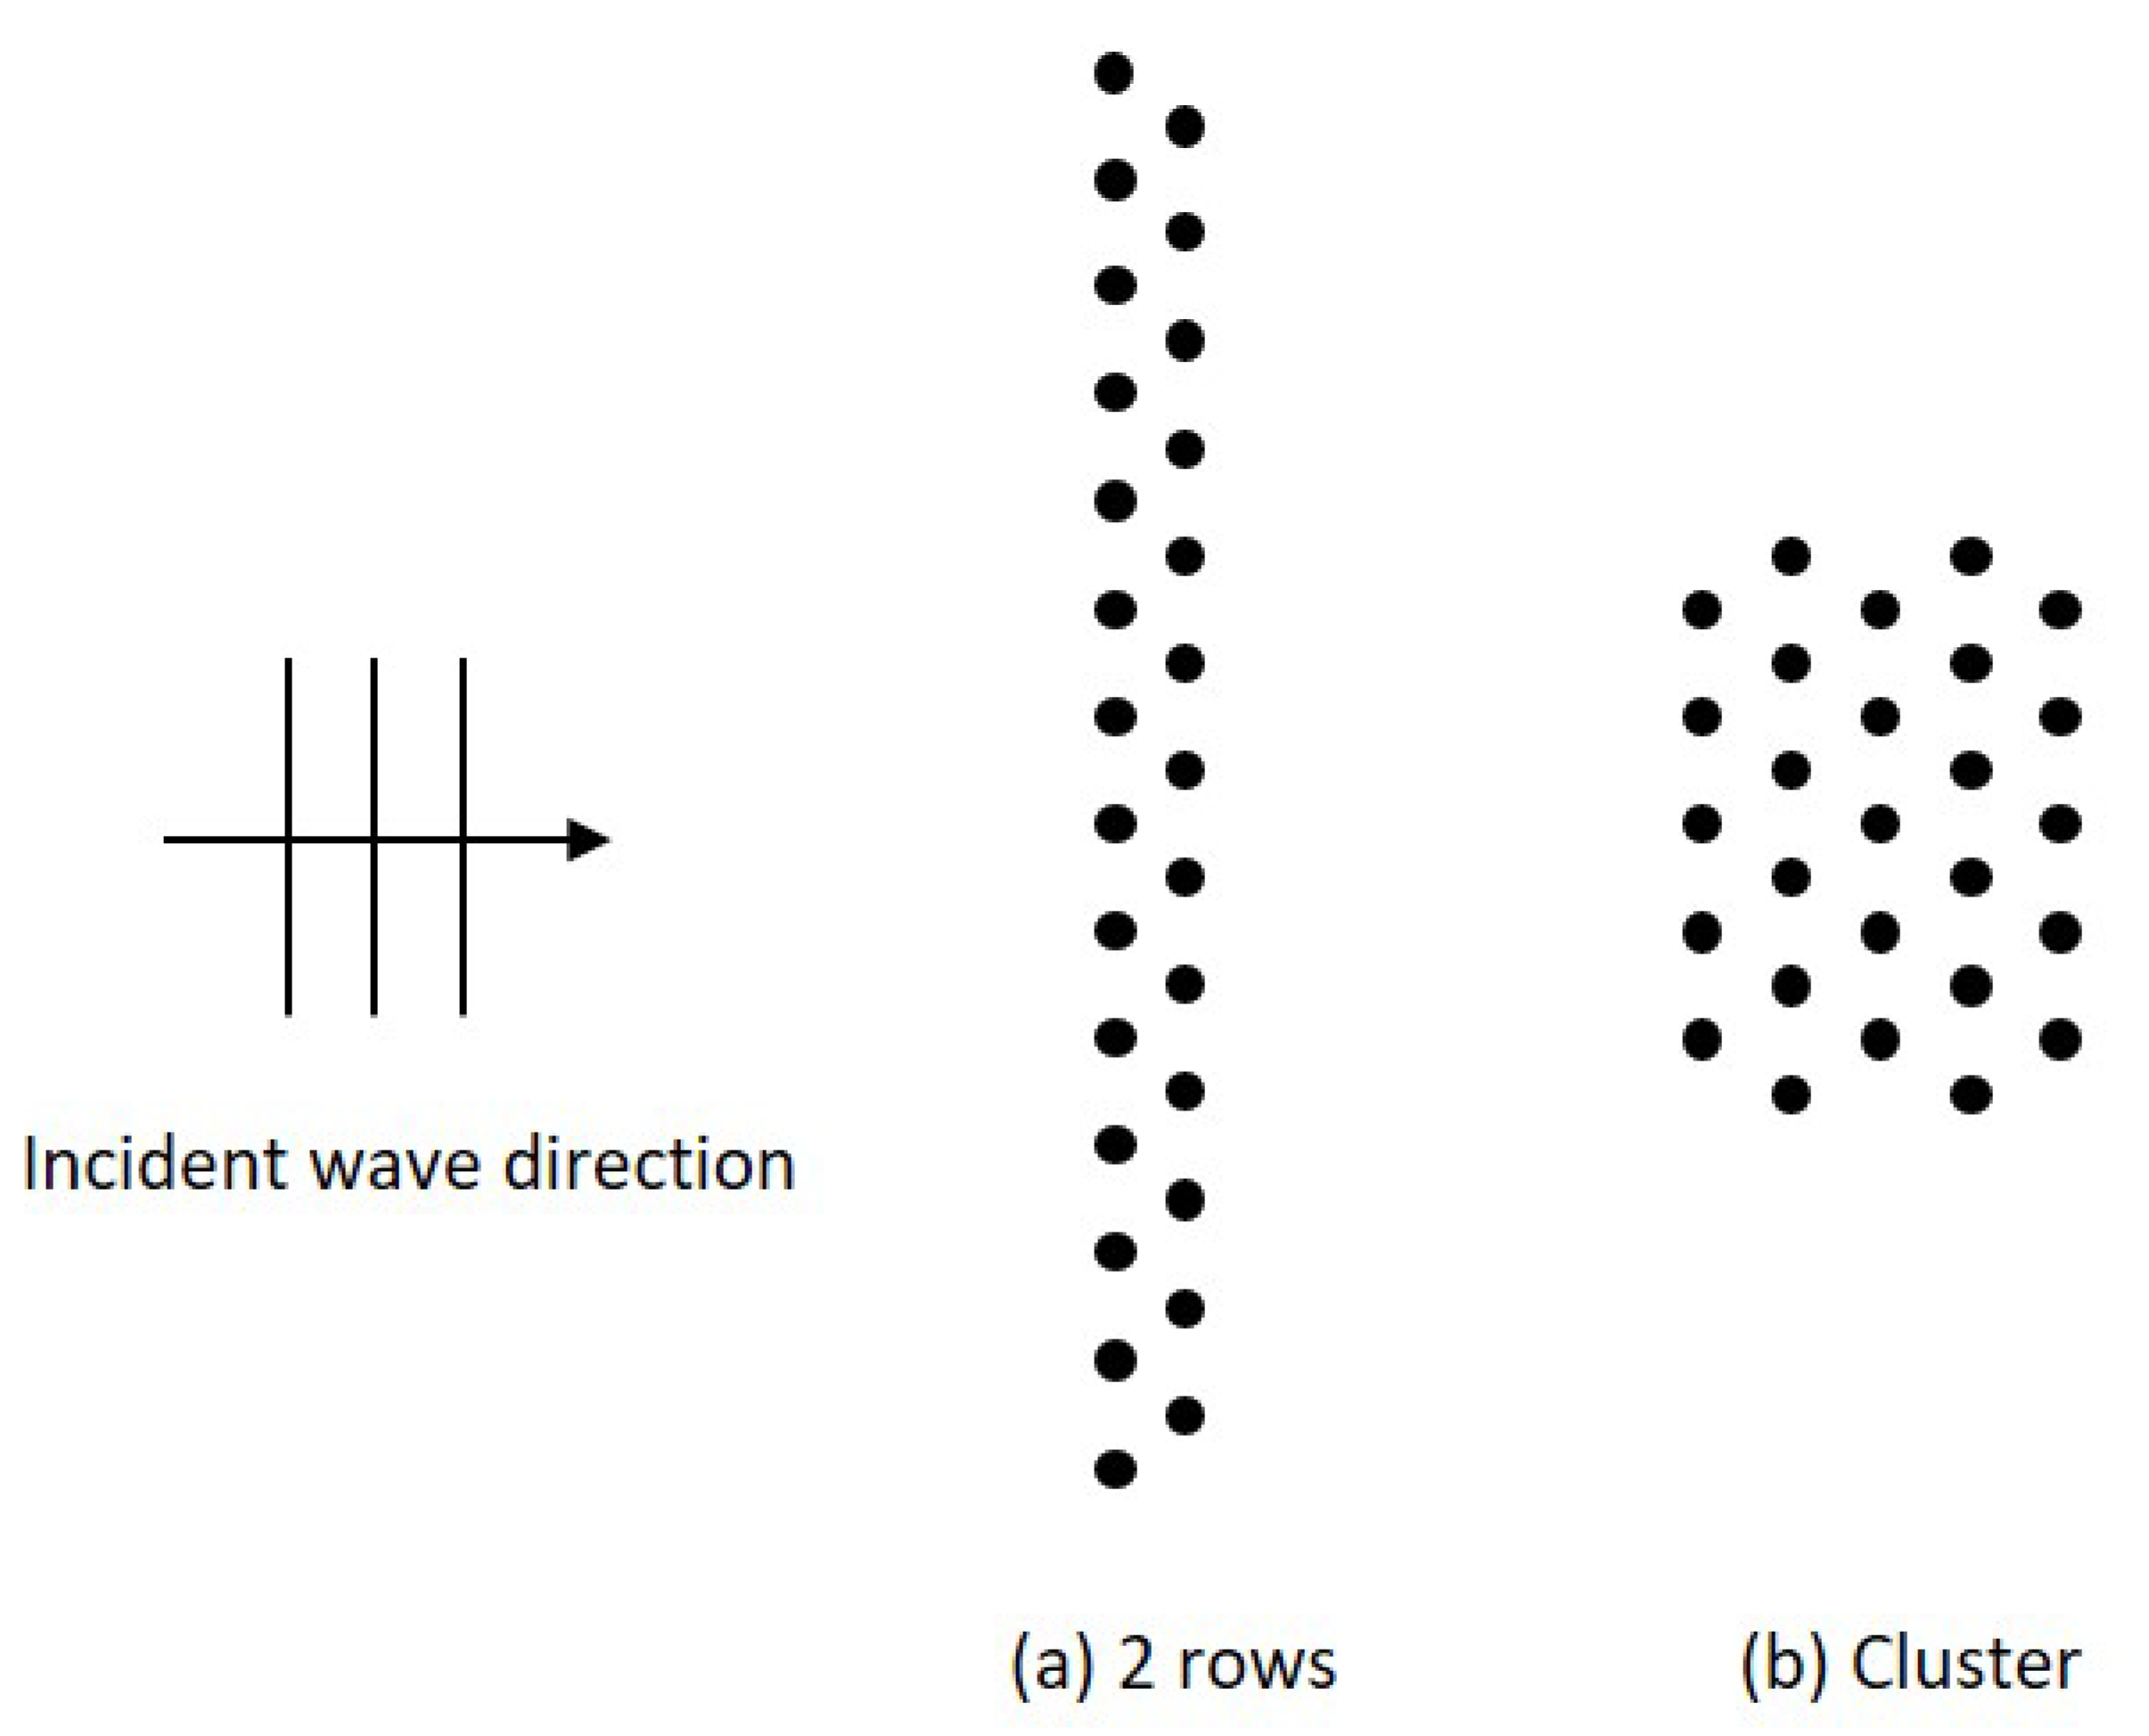
Medium-sized wave farms were created with arrays of 27 WECs arranged in two array configurations: (a) two rows and (b) a cluster; see Figure 4. The spacing between the WECs in each row and between the rows is set to either or where d is the device diameter.

Figure 4.
WEC array configurations were considered in this study: (a) two rows of WECs and (b) a cluster of WECs.
For a farm of 27 WECs, each with a rated power of 150 kW, the farm size is 4 MW.
2.3. Environment
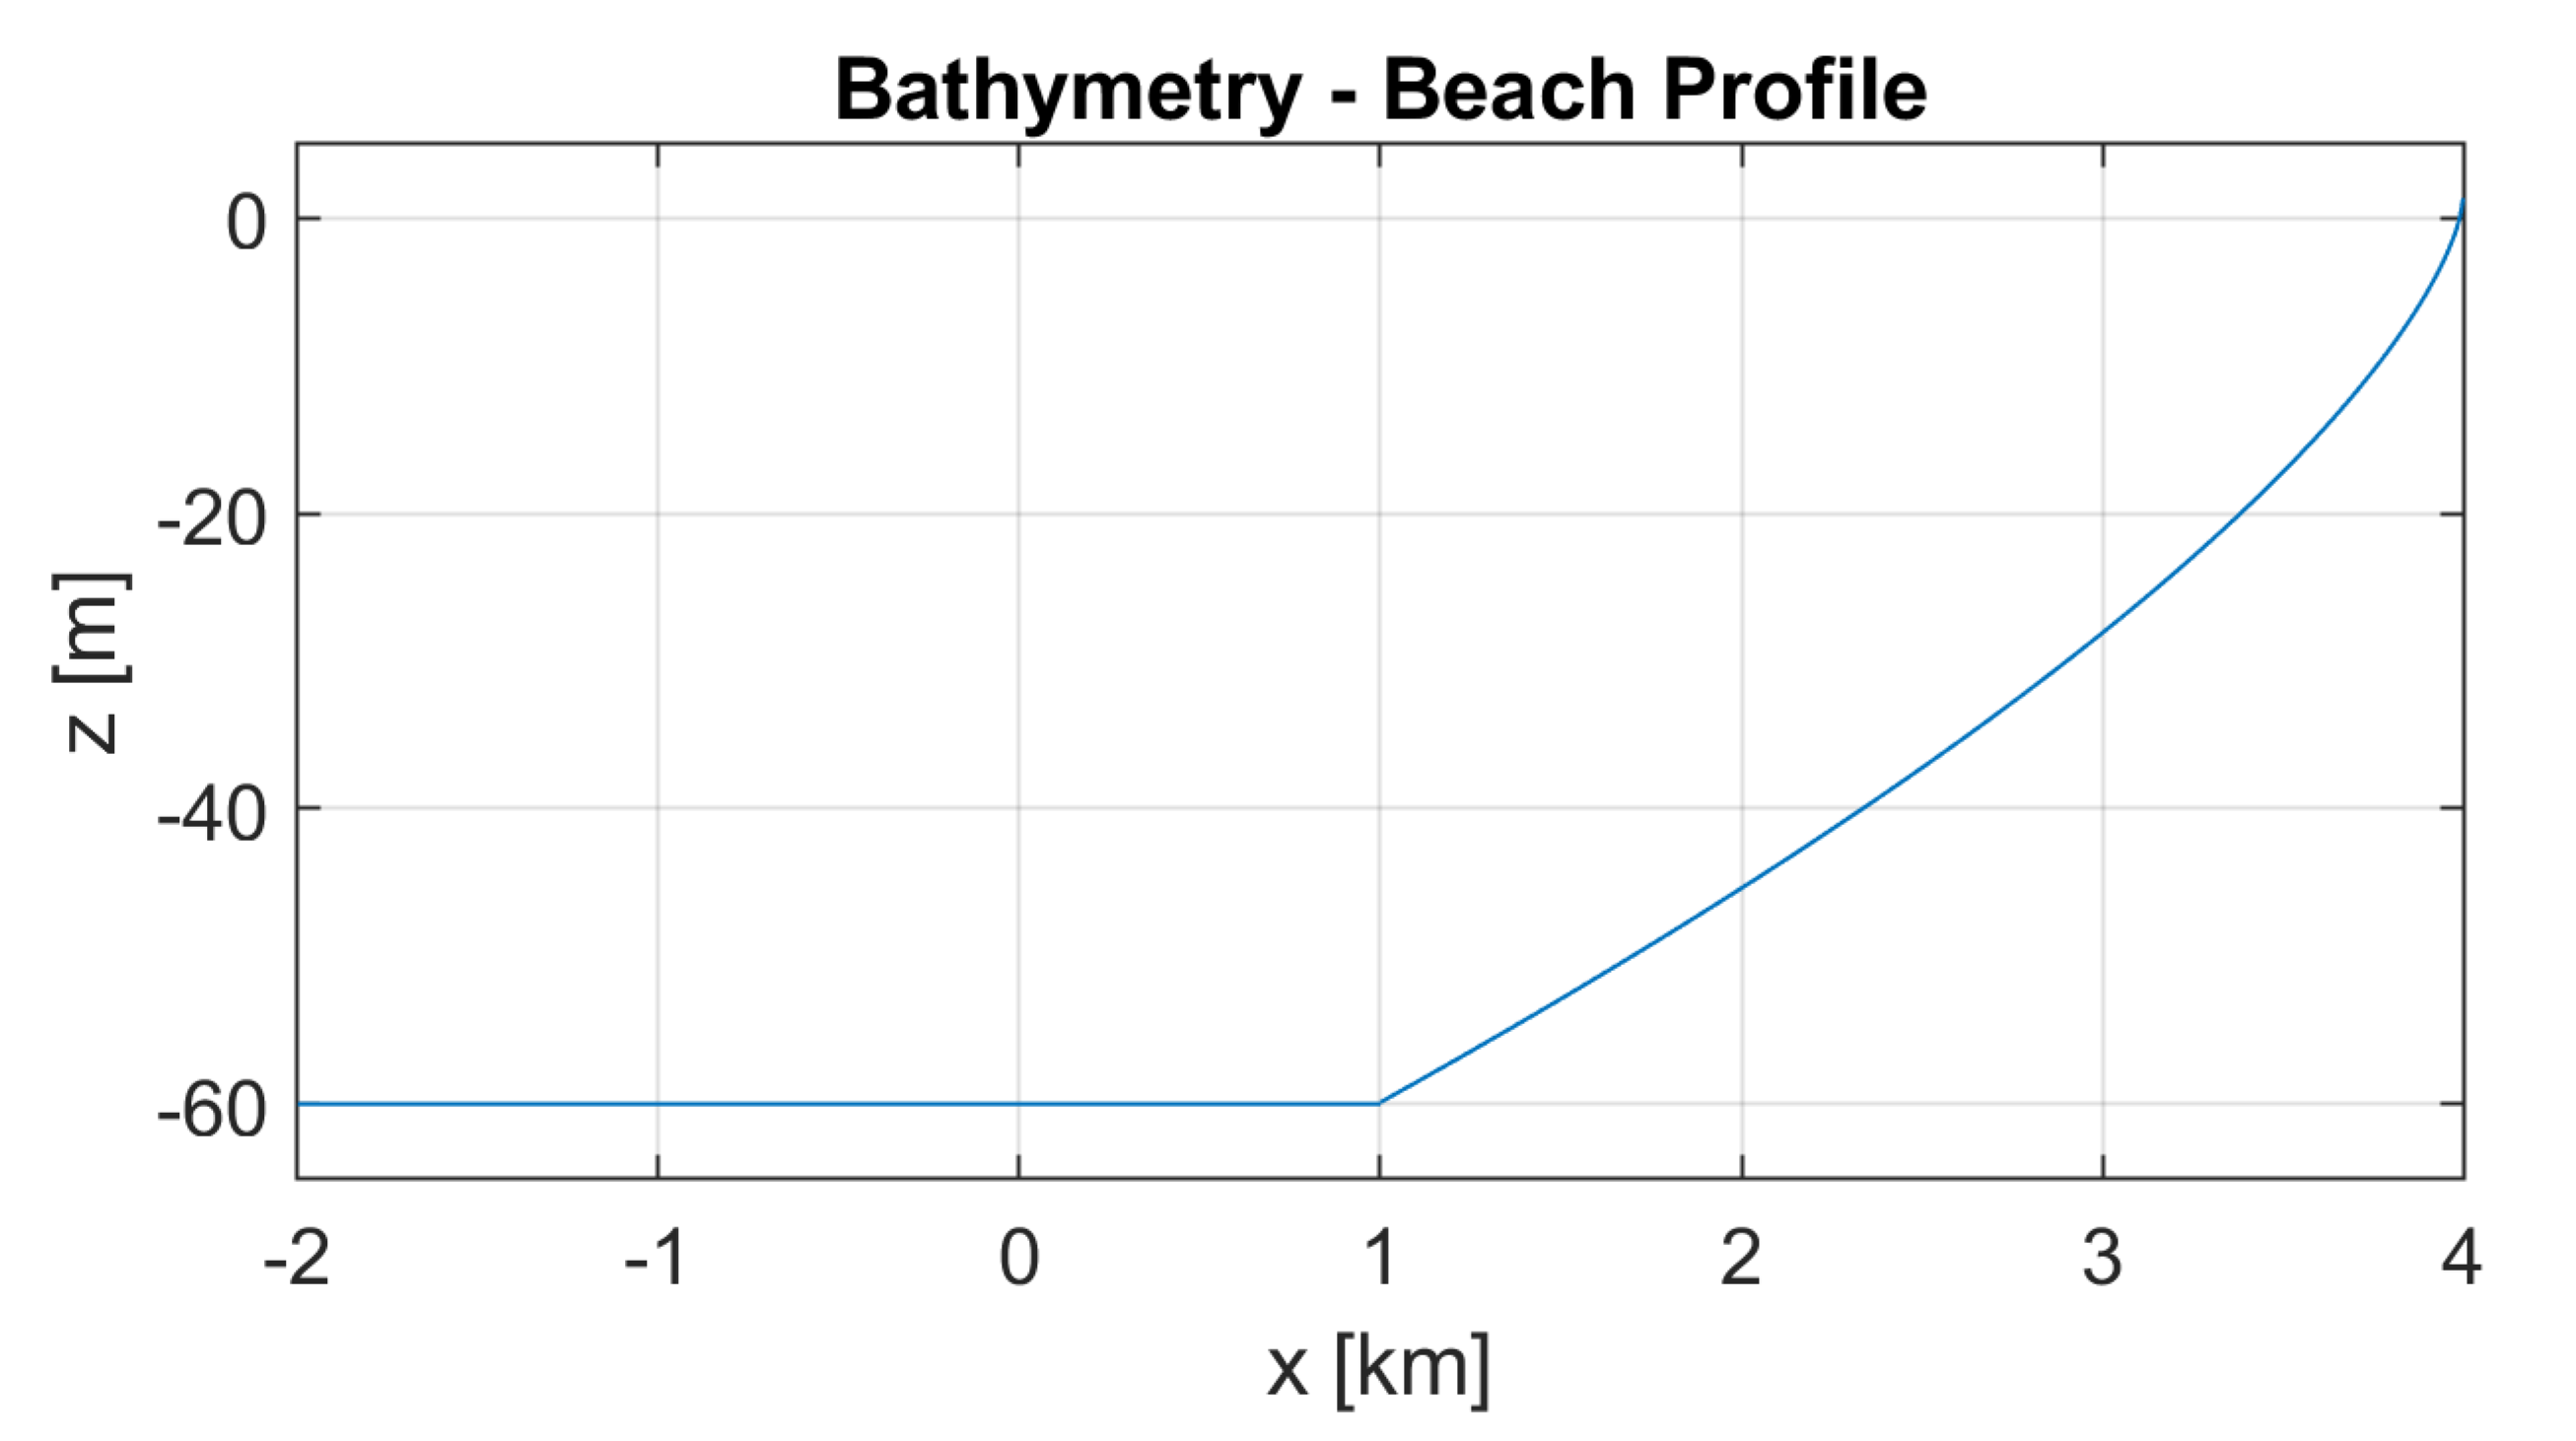
The environment is defined by the bathymetry and wave conditions. The bathymetry consists of a flat bottom at a water depth of 60 m in the region of the WEC arrays, extending to 1 km in the lee of the array. The flat bottom leads into an idealized beach profile that is uniform in the longshore direction and follows a equilibrium beach profile over 3 km to the shoreline [29], as in Figure 5. The WEC array is located at . Idealized bathymetry was selected in order to simplify the problem and view and isolate differences between the the nearshore results.

Figure 5.
The bathymetry modeled in the study consisted of a flat bottom in the region of the WEC array (WEC array centered at ), and an idealized beach profile [29] in the nearshore.
Wave conditions were modeled as directional spectra at three periods and three spreading parameters. The spectral shape considered was a Pierson-Moskovitz spectrum, where the relationship between the peak period, , and the significant wave height, , is given by: . Three peak periods were modeled, representing short, medium, and long waves, respectively, at potential WEC deployment sites in the U.S. [30].
The directional spreading was modeled using a cosine-squared spreading function, parameterized by the spreading coefficient, s [31]. Three spreading values were modeled, , representing high directional spreading, moderate spreading, and highly unidirectional waves. The selection of these values was based on correlating the cosine-squared spreading value, s, against ranges of the spreading parameter, , representing high, moderate, and low directional spreading from Forristall and Ewans [21].
2.4. Computational Domains
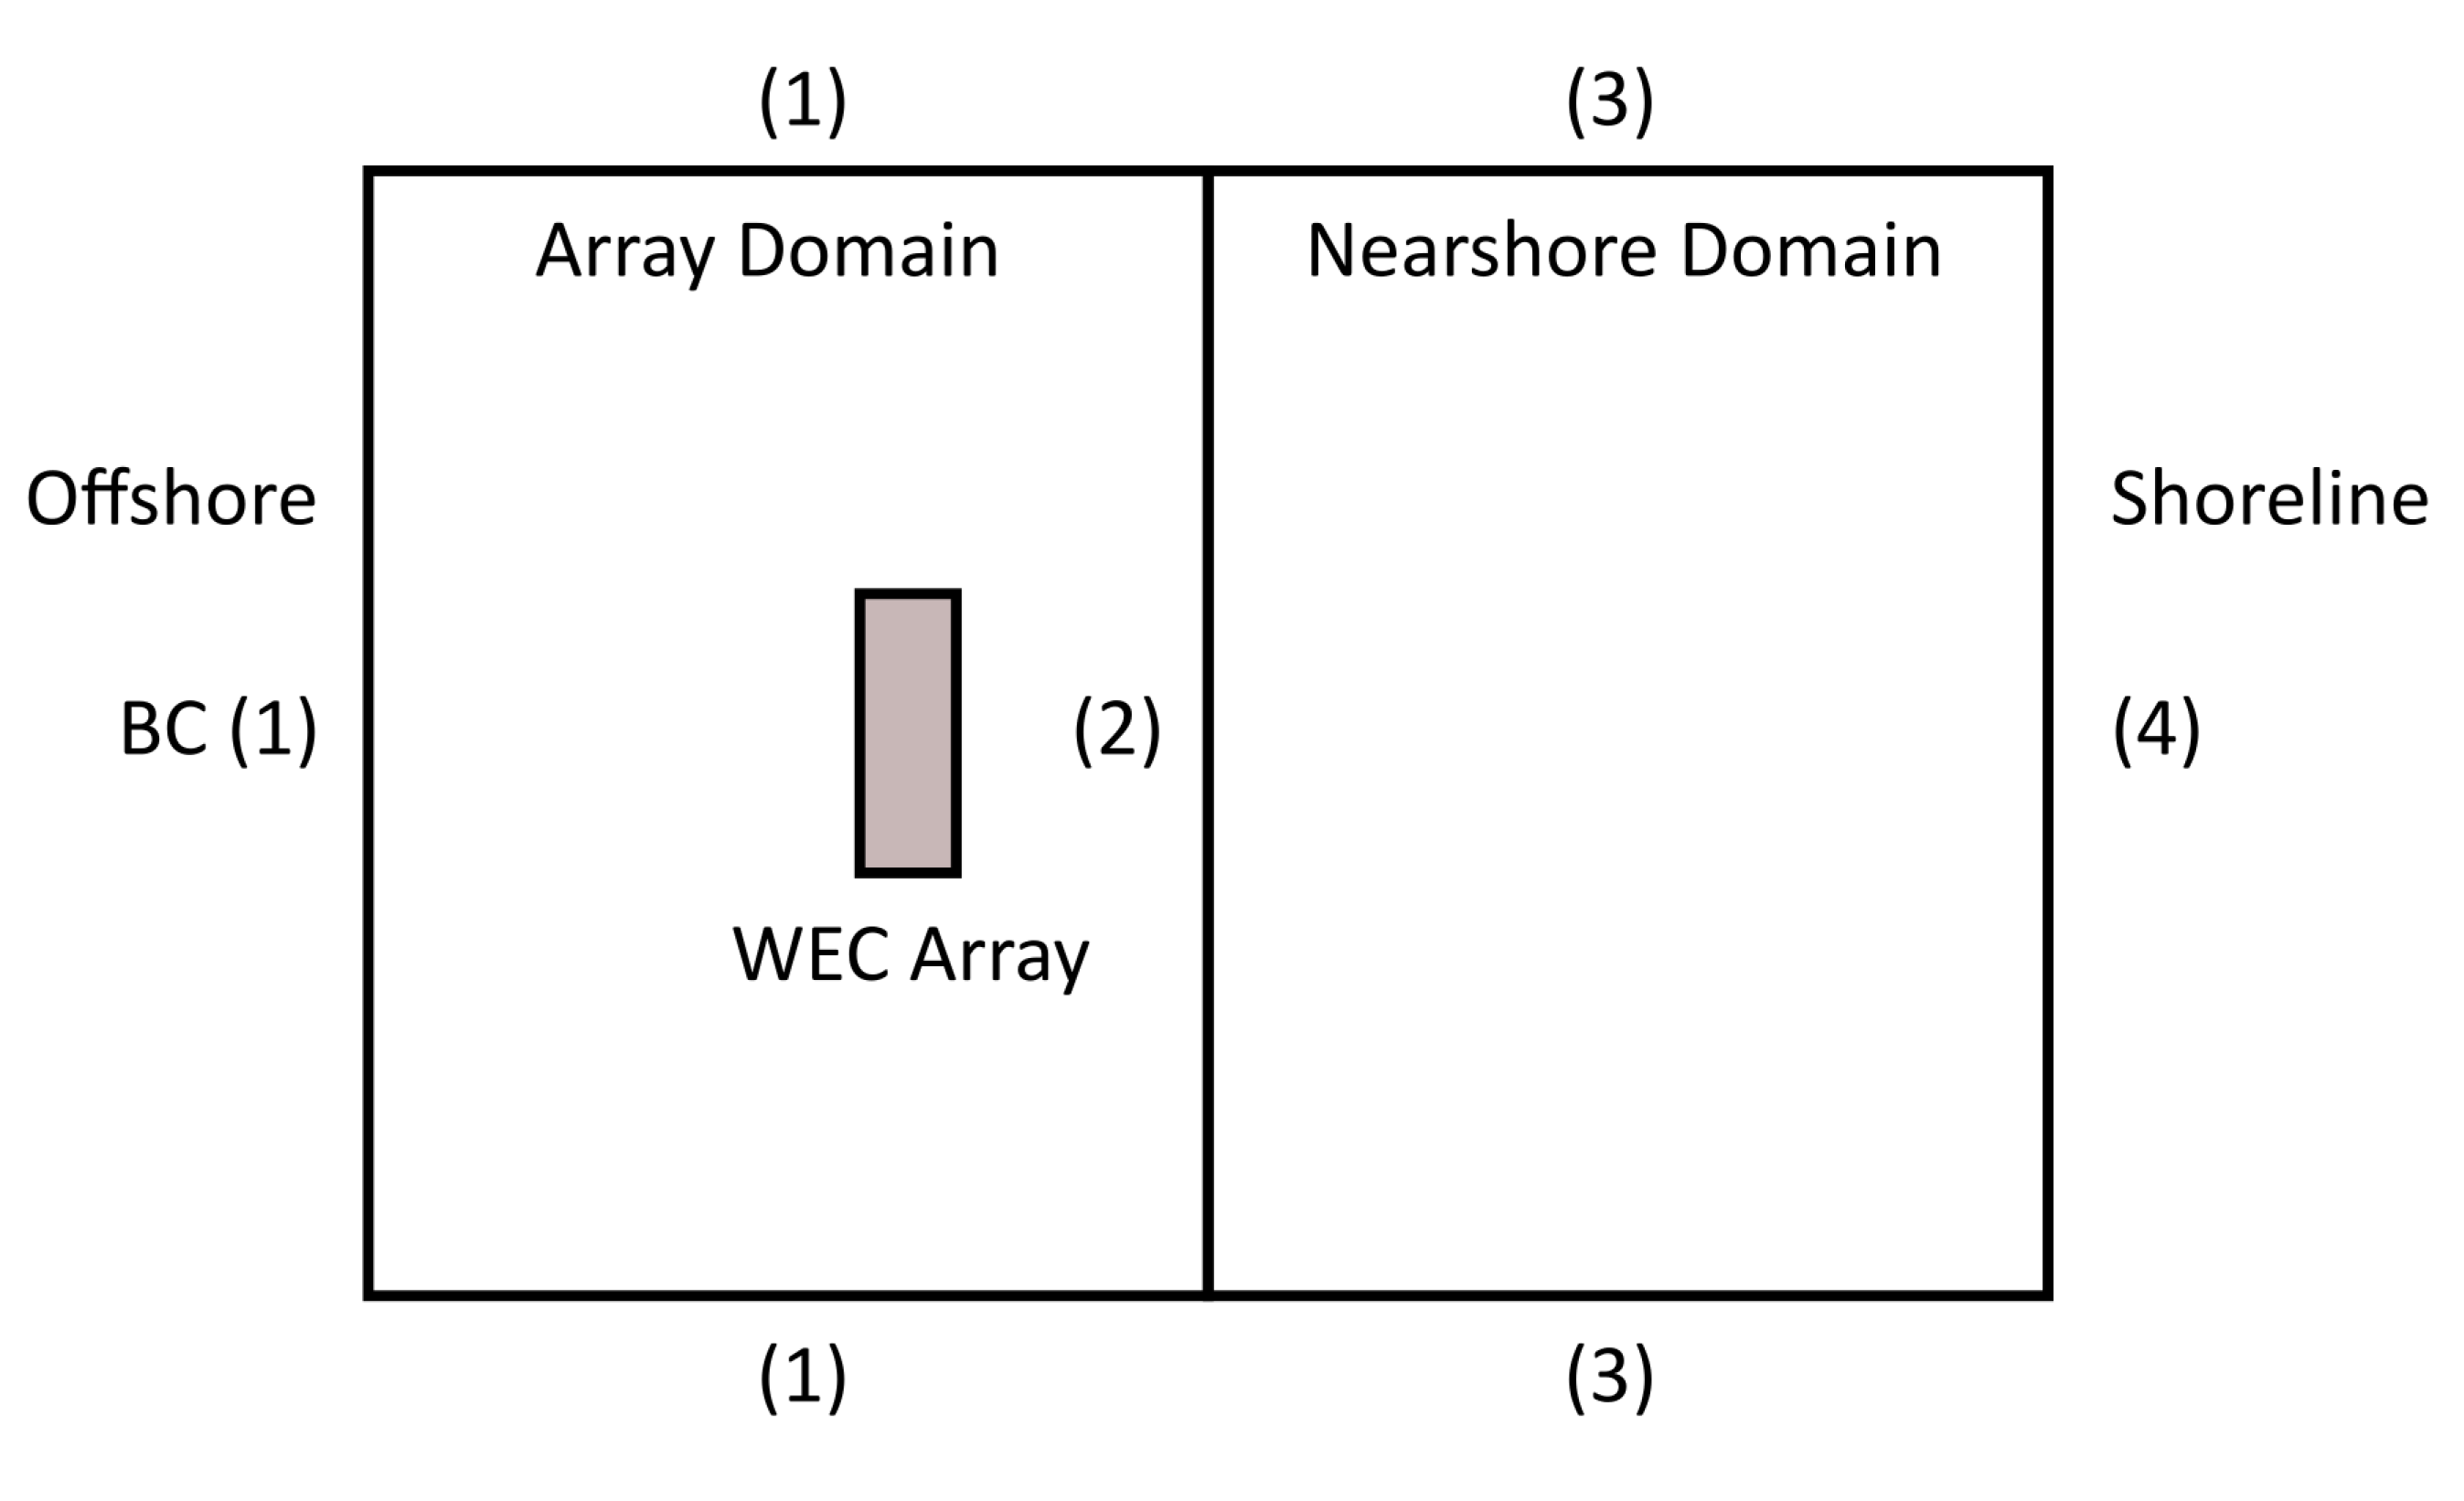
The regions under consideration were divided into two computational domains (see Figure 6):

Figure 6.
The computational domain used herein.
- Array Domain: the domain around the WEC array located offshore. This domain is evaluated either with SNL-SWAN or with LWIT. The bathymetry is a flat bottom.
- Nearshore Domain: the domain with a beach-profile bottom extending to a depth of 0 at the shoreline. It is modeled always with SWAN.
The Array Domain has two boundary conditions (BCs), labeled in Figure 6 as (1) and (2). BC (1) is set to be the incident wave spectra as specified in Section 2.3. However, it should be noted that this BC is only relevant in SNL-SWAN. BCs are treated differently in linear wave theory [22].
BC (2) forms the connection between the Array Domain and the Nearshore Domain. Significant wave heights extracted from the Array domain in both SNL-SWAN and LWIT are set as the input BC for SWAN in the Nearshore Domain.
In the Nearshore Domain, BC (3) was treated to represent the impact of nearshore processes of shoaling and wave breaking as the offshore conditions moved shoreward. This was done by carrying out a simulation on the Nearshore Domain where BC (2) was simply the offshore incident wave conditions (i.e., no WEC array present) and then extracting the wave heights along the centre of the domain and setting these to BC (3).
BC (4) is the zero depth shoreline which has no incident waves.
2.5. Means of Comparison
Wave fields produced by SNL-SWAN are compared to those produced by LWIT using the significant wave height, , because is the driver of nearshore physical processes. Several quantitative metrics are used. Measures referring to SNL-SWAN wave fields are given the subscript ; those referring to LWIT wave fields are given the subscript ; incident significant wave height is specified as .
2.5.1. Normalized
The normalized is the ratio of at a field point and the incident :
Values of mean that the field is equal to the incident ; values greater than 1 indicate wave heights are higher than the incident, and values less that 1 indicate lower wave heights.
2.5.2. Normalized Error
The normalized Error is the measure of the difference between the SNL-SWAN wave field and the LWIT wave field normalized by the incident :
Values of equal to 0 indicate an exact match between SNL-SWAN and LWIT; values greater than 0 indicate that SNL-SWAN over-predicts the wave height compared to LWIT, and vice versa for values less than 0.
Mean-Squared Error
The Mean-Squared Error (MSE) is a measure of the error over a region of N points:
Values of MSE have the same mean as that of but over a region.
2.5.3. Mean-Squared Skill Score
A measure of the “skill” of a model is described in Sutherland et al. [32] as “non-dimensional measure of the accuracy of a prediction relative to the accuracy of a baseline prediction, which could, for example, be an initial condition, an average value, a random choice (from the possible range of outcomes) or a simple empirical predictor”.
Herein, a Mean-Squared Skill Score (MSSS) was defined as a comparison of SNL-SWAN against the LWIT relative to the baseline case, in which SNL-SWAN results were compared to an undisturbed wave field (i.e., no WEC array):
where is the significant wave height of the undisturbed wave field, that is, the wave field in the absence of WECs. This was found by running SWAN for the Nearshore Domain where BC (2) was the offshore BC. gives the measure of the impact of (or error caused by) the WEC array as assessed by SNL-SWAN.
Our definition of MSSS is sometimes referred to as the Brier Skill Score (BSS) in coastal engineering and meteorology [32].
The value of MSSS gives us a quantitative measure of the performance of SNL-SWAN at predicting the wave field as compared to the LWIT baseline:
- would be produced by not modeling the WEC array at all.
- : SNL-SWAN produces worse results compared to not modeling the WEC array at all.
- : SNL-SWAN exactly matches LWIT results (no error).
- : SNL-SWAN makes some improvement to the wave field (compared to not modeling the array at all).
As pointed out by Sutherland et al. [32]: “However, as skill scores are used more and more, it will become apparent what value of skill score is needed before a model result can be considered “good””. To that end, we related the quantitative MSSS to a qualitative interpretation from Sutherland et al. [32], as shown in Table 1. Throughout the text, the terms “Good” or “Excellent” will be used, as capitalized, to refer to the defined ranges given in Table 1.

Table 1.
Mean Squared Skill Score (MSSS) model performance as given by Sutherland et al. [32].
3. Results
This section presents the results of the study. First, an example is given to illustrate how results are presented and to address general considerations. Following that, the performance of SNL-SWAN is considered in terms of the MSSS, and, finally, the performance of SNL-SWAN is considered in terms of the dimensional errors in wave height.
3.1. Example Results
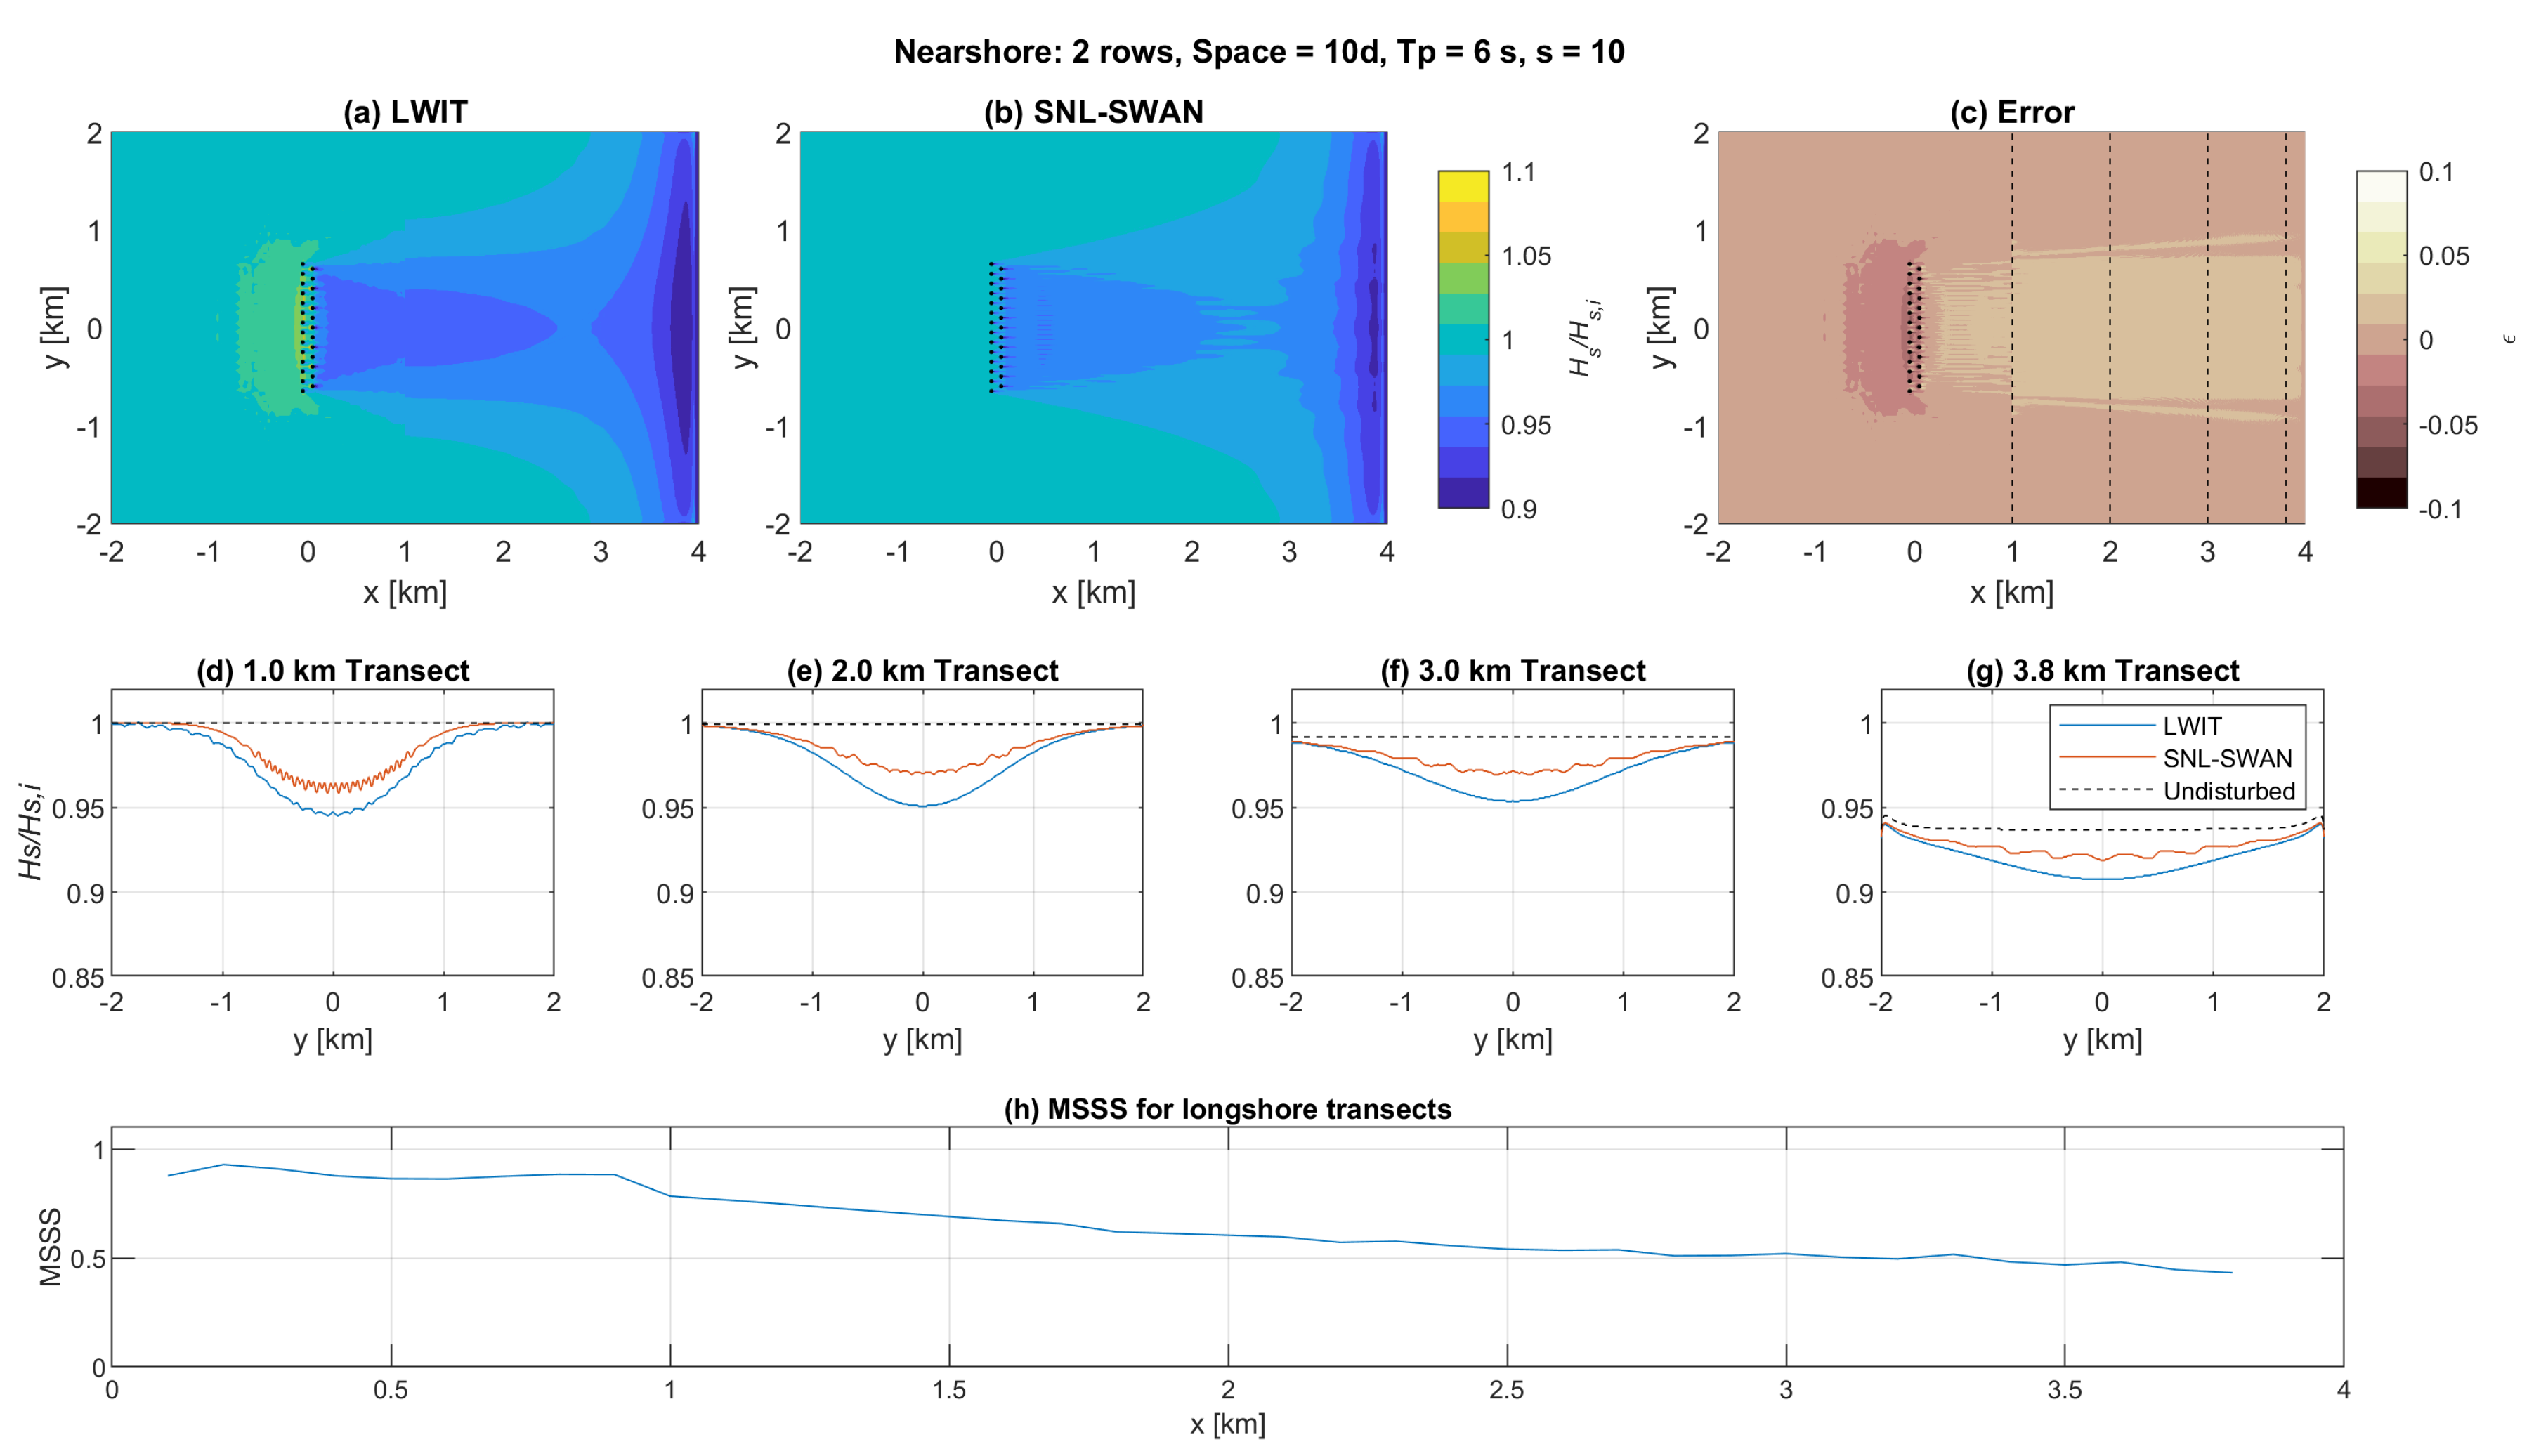
Figure 7 shows a set of example results for the case: 2-row array, WEC spacing = 5d, , spreading parameter (Moderate spreading).

Figure 7.
Example result of the comparison between SNL-SWAN and LWIT.
Subplots (a) and (b), respectively, show the LWIT and SNL-SWAN wave fields as the normalized significant wave height (). The predominant incident wave direction is left to right, i.e., from to . Here, one can see the WEC array, given as small black dots centered at . In the LWIT wave field, there are also small white circles near the WECs where the wave field could not be resolved. The flat-bottom domain extends from km to km. Thereafter, the sloped beach extends from a depth of 60 m ( m) to a depth of 0 at km.
In the LWIT wave field, subplot (a), there is some reflection, in the region directly in front of the array. This is not present in the SNL-SWAN wave field, subplot (b). Both wave fields show a wave shadow, , in the lee of the array; it is narrow near the array but appears to broaden as it approaches the shoreline.
Subplot (c) shows the normalized error () between the two wave fields, highlighting regions where SNL-SWAN under-predicts the wave heights () and over-predicts wave heights, . In addition, indicated are the locations of the transects shown in the next row.
The middle row, subplots (d)–(g), shows longshore transects at different locations in the cross-shore of for the undisturbed (no WEC array) wave field (black dashed), the LWIT wave field (blue), and the SNL-SWAN wave field (red). They are selected at cross-shore intervals of 1 km, except for the transect closest to shore; at the shoreline, due to wave breaking, there is no wave field, and the cross-shore location of km was selected as the nearest 100 m interval where waves were present for all results.
Finally, the bottom row, subplot (h), shows the MSSS for longshore transects extending across the domain as a function of the cross-shore location, x. The MSSS calculation begins just behind the location of the array and extends to a distance of km.
3.2. General Considerations
3.2.1. Wave Breaking
As the propagation of waves is modeled over the nearshore bathymetry in SWAN, three main processes impact it: shoaling, refraction, and wave breaking. Wave breaking, in particular, has a dominant impact on the nearshore wave field. One can see, in Figure 7, that wave heights along the longshore direction reduce as the the waves approach the shoreline. In the wave field plots, this looks like a sort of widening of the shadow as the waves approach the shore.
3.2.2. Boundary Condition Effects
As discussed in Section 2.4, only (not the entire spectrum) was used as an input to the Nearshore Domain BCs. One can see that this creates a small kink as a boundary condition effect at the boundary between the Array Domain and the Nearshore Domain, which is located at km; this is particularly noticeable in the LWIT results.
Furthermore, there is a similar effect on the cross-shore boundaries in Nearshore Domain (BC (3) in Figure 6). In the plot of the 3.8 km transect in Figure 7, the undisturbed wave field line (black dashed) should be flat all the way across, but it shows a slight up-turn near the boundaries. While worth noting, neither of these boundary condition effects made a significant difference to the conclusions drawn from the results.
3.2.3. Garden Sprinkler Effect
Another result is that the SNL-SWAN wave fields show a ripple in the lee of the array, which can be seen most clearly in the transects. The ripple worsens as the waves approach shore. This is due to the so-called Garden Sprinkler Effect, which is often found in spectral models and is caused by discretization of the incident wave directions and interaction with obstacles.
The ripple could likely be reduced by increasing the discretization in wave direction in SWAN. However, this was not practical due to memory allocation limits for these simulations. And, like the BC issue discussed above, it did not have an impact on the conclusions, which is notable as it frequently arises in practical coastal engineering work.
3.3. Mean-Squared Skill Score Results
Thirty-six cases were considered: two array configurations, two array spacings, three wave periods, and three directional spreadings.
For each case, the MSSS for the longshore transect across the entire domain at km was used as the basis of comparison. Various other regions of assessment for the MSSS were examined, including transects not extending the width of the domain and two-dimensional areas. However, it was found that, while the region did have an impact on the value of the MSSS, this did not change the value categories as given in Table 1 nor the trends in the results.
Of the 36 cases, the range of MSSS scores was from MSSS = 0.30–0.97, equating to performance of SNL-SWAN as “Good” to “Excellent”. None of the results were worse than “Good”. A simple visual scan revealed that only the cases for s resulted in “Good” rather than “Excellent” fits, as shown in Table 2.

Table 2.
Number of cases scored as “Excellent” and “Good” in terms of the MSSS from Sutherland et al. [32] for each wave period.
3.4. Visualization of Results
The performance of SNL-SWAN for all cases was at least “Good”, and, in most cases, “Excellent”. This can be further understood by considering plots of the results.
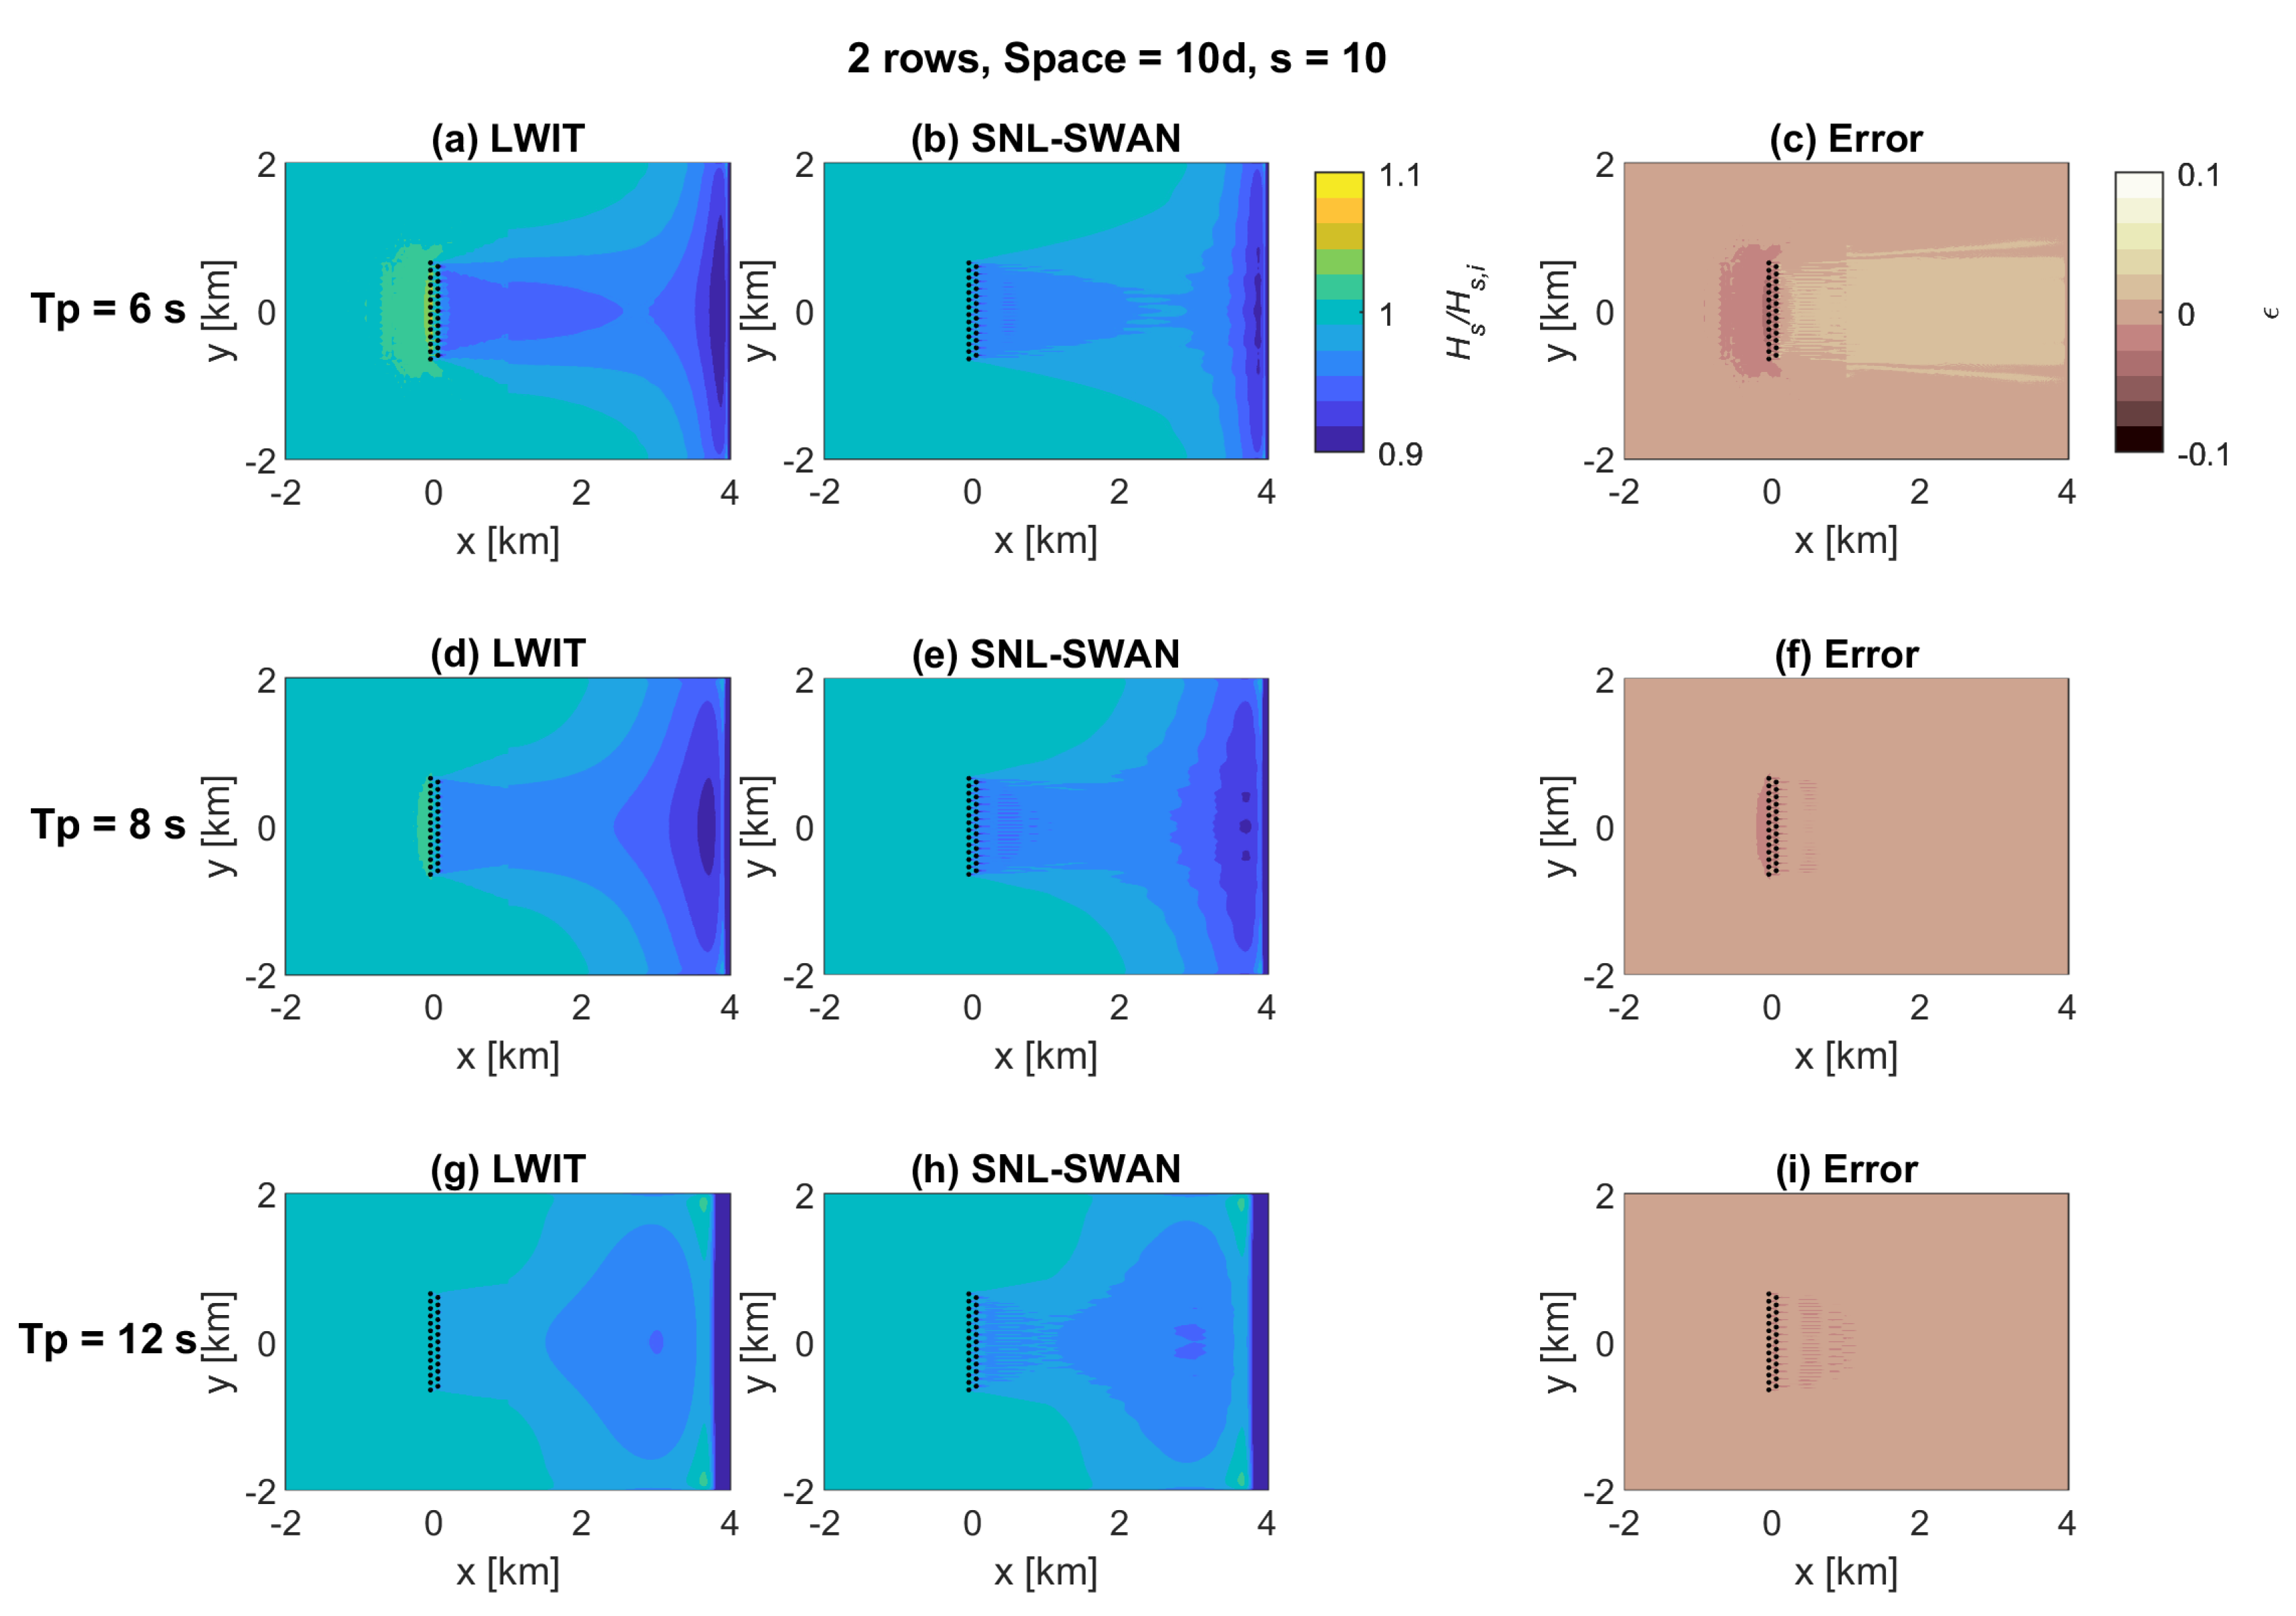
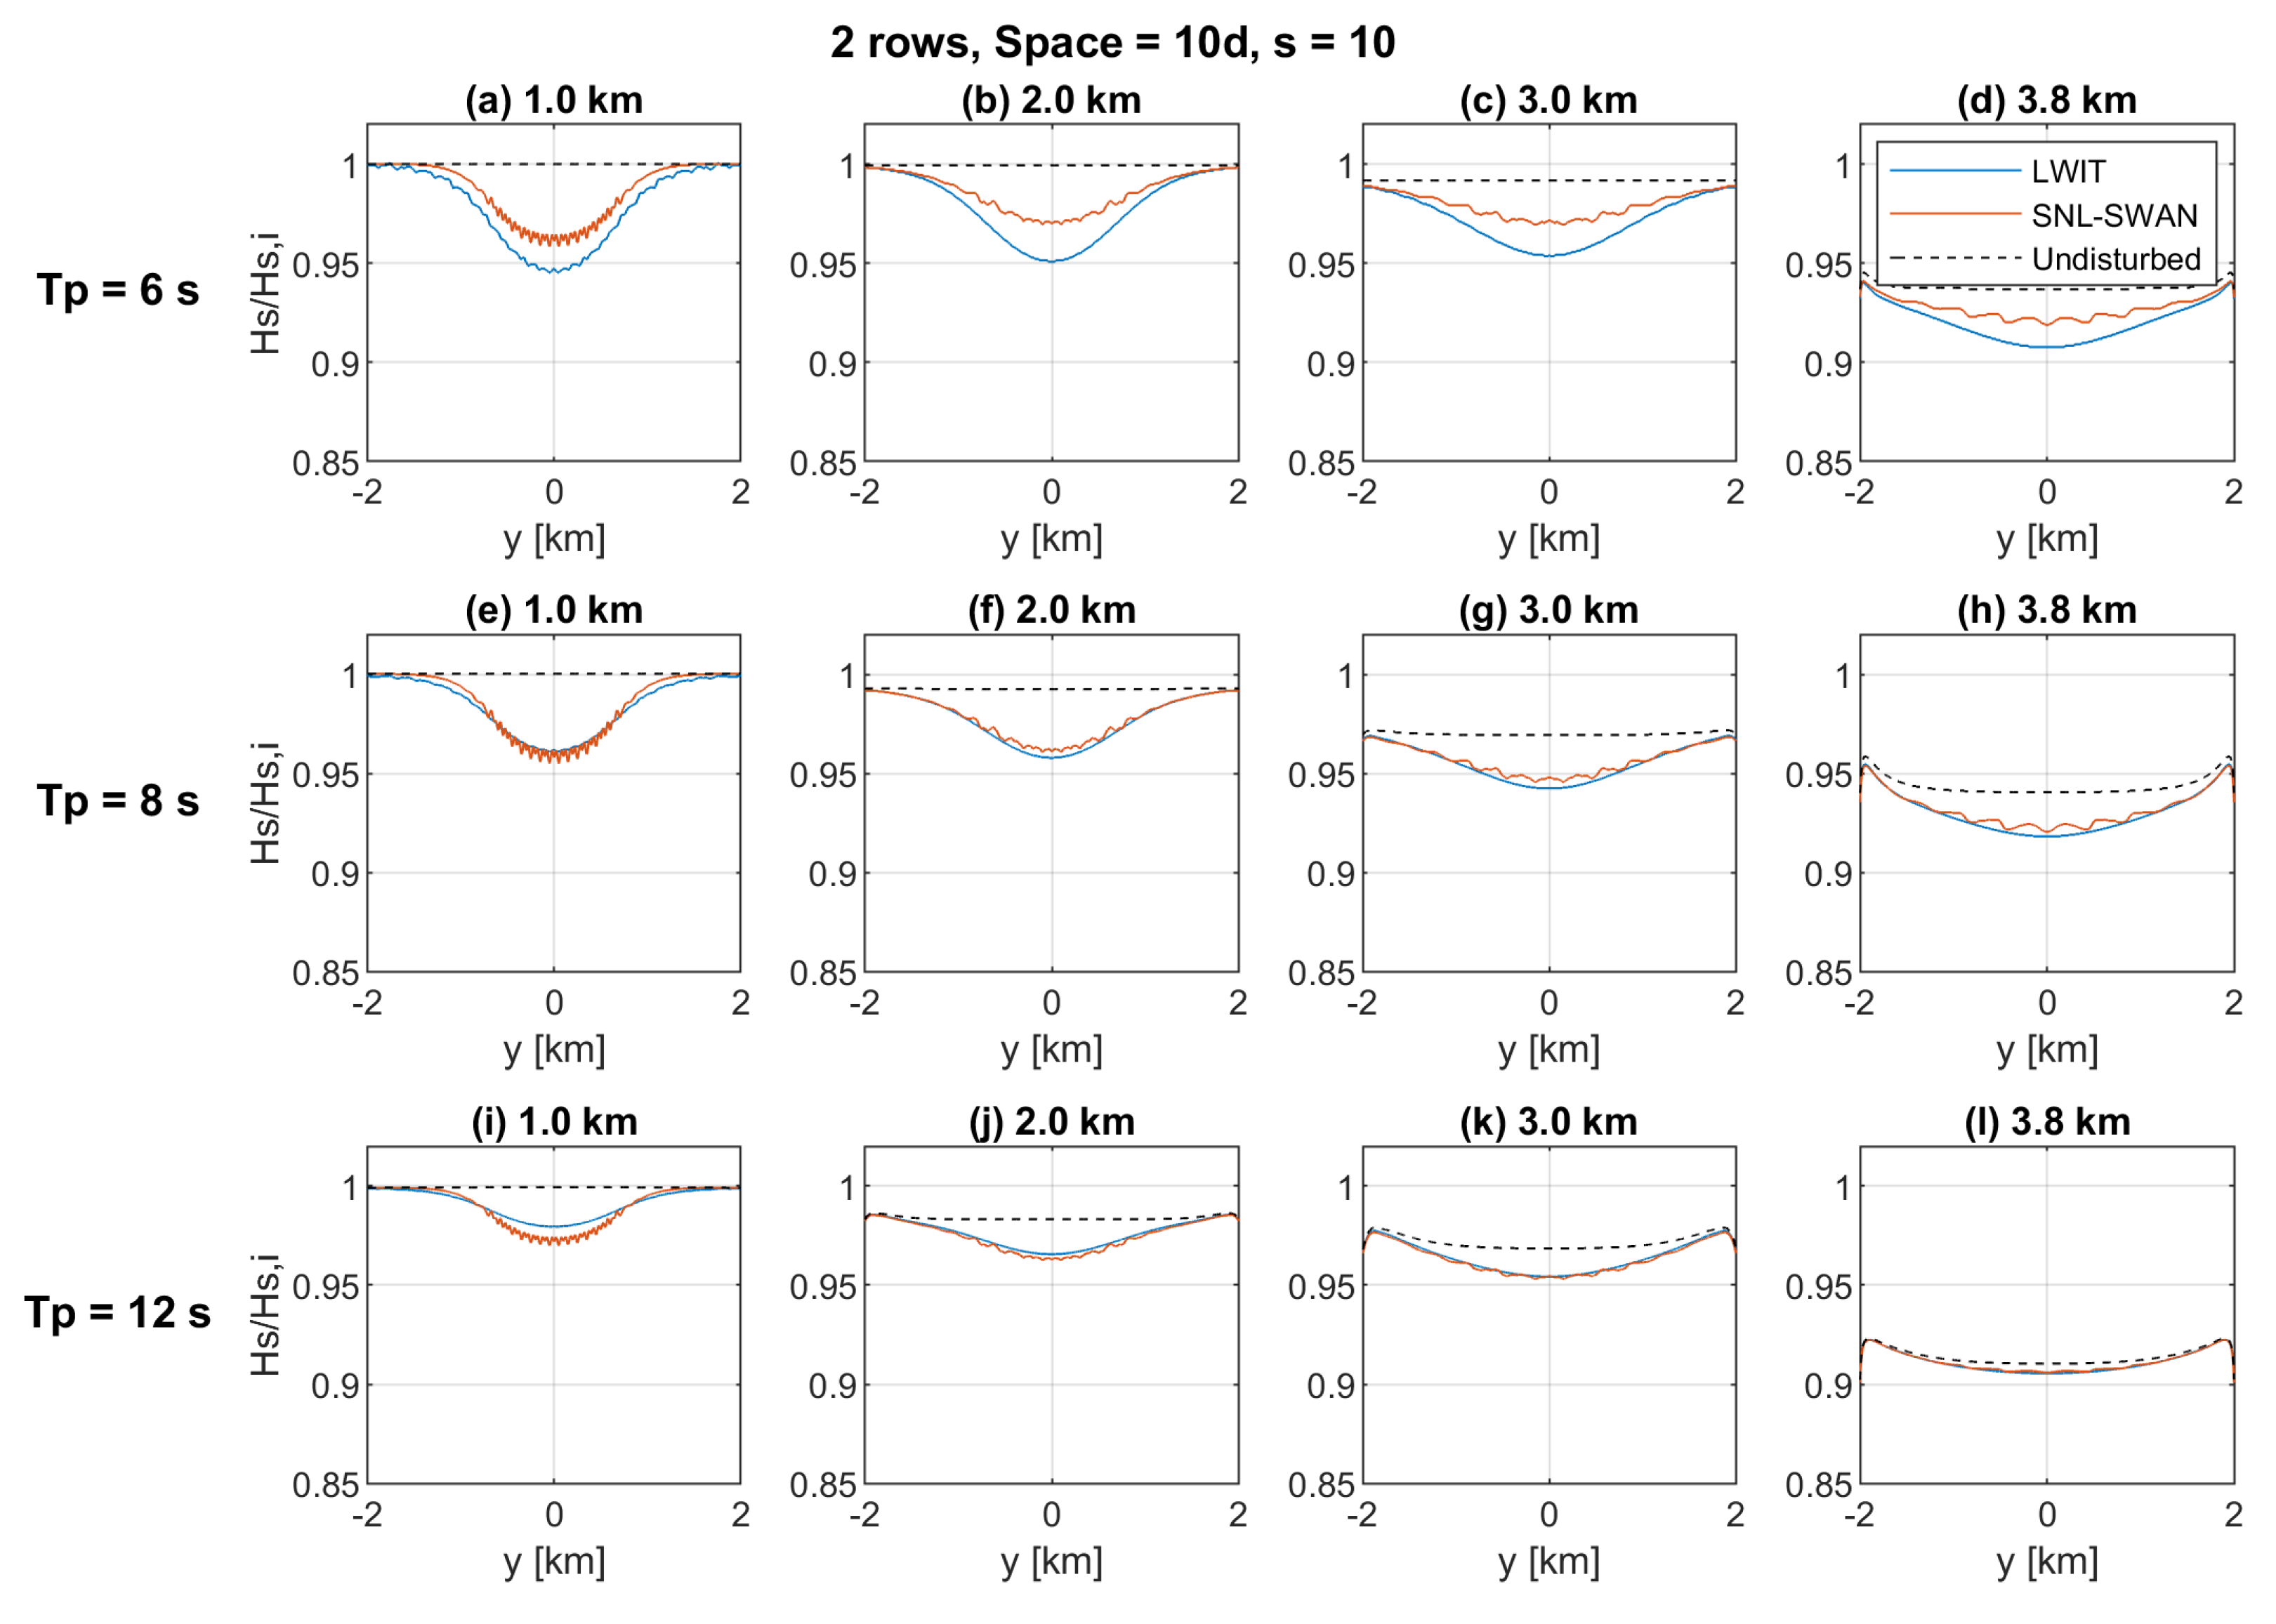
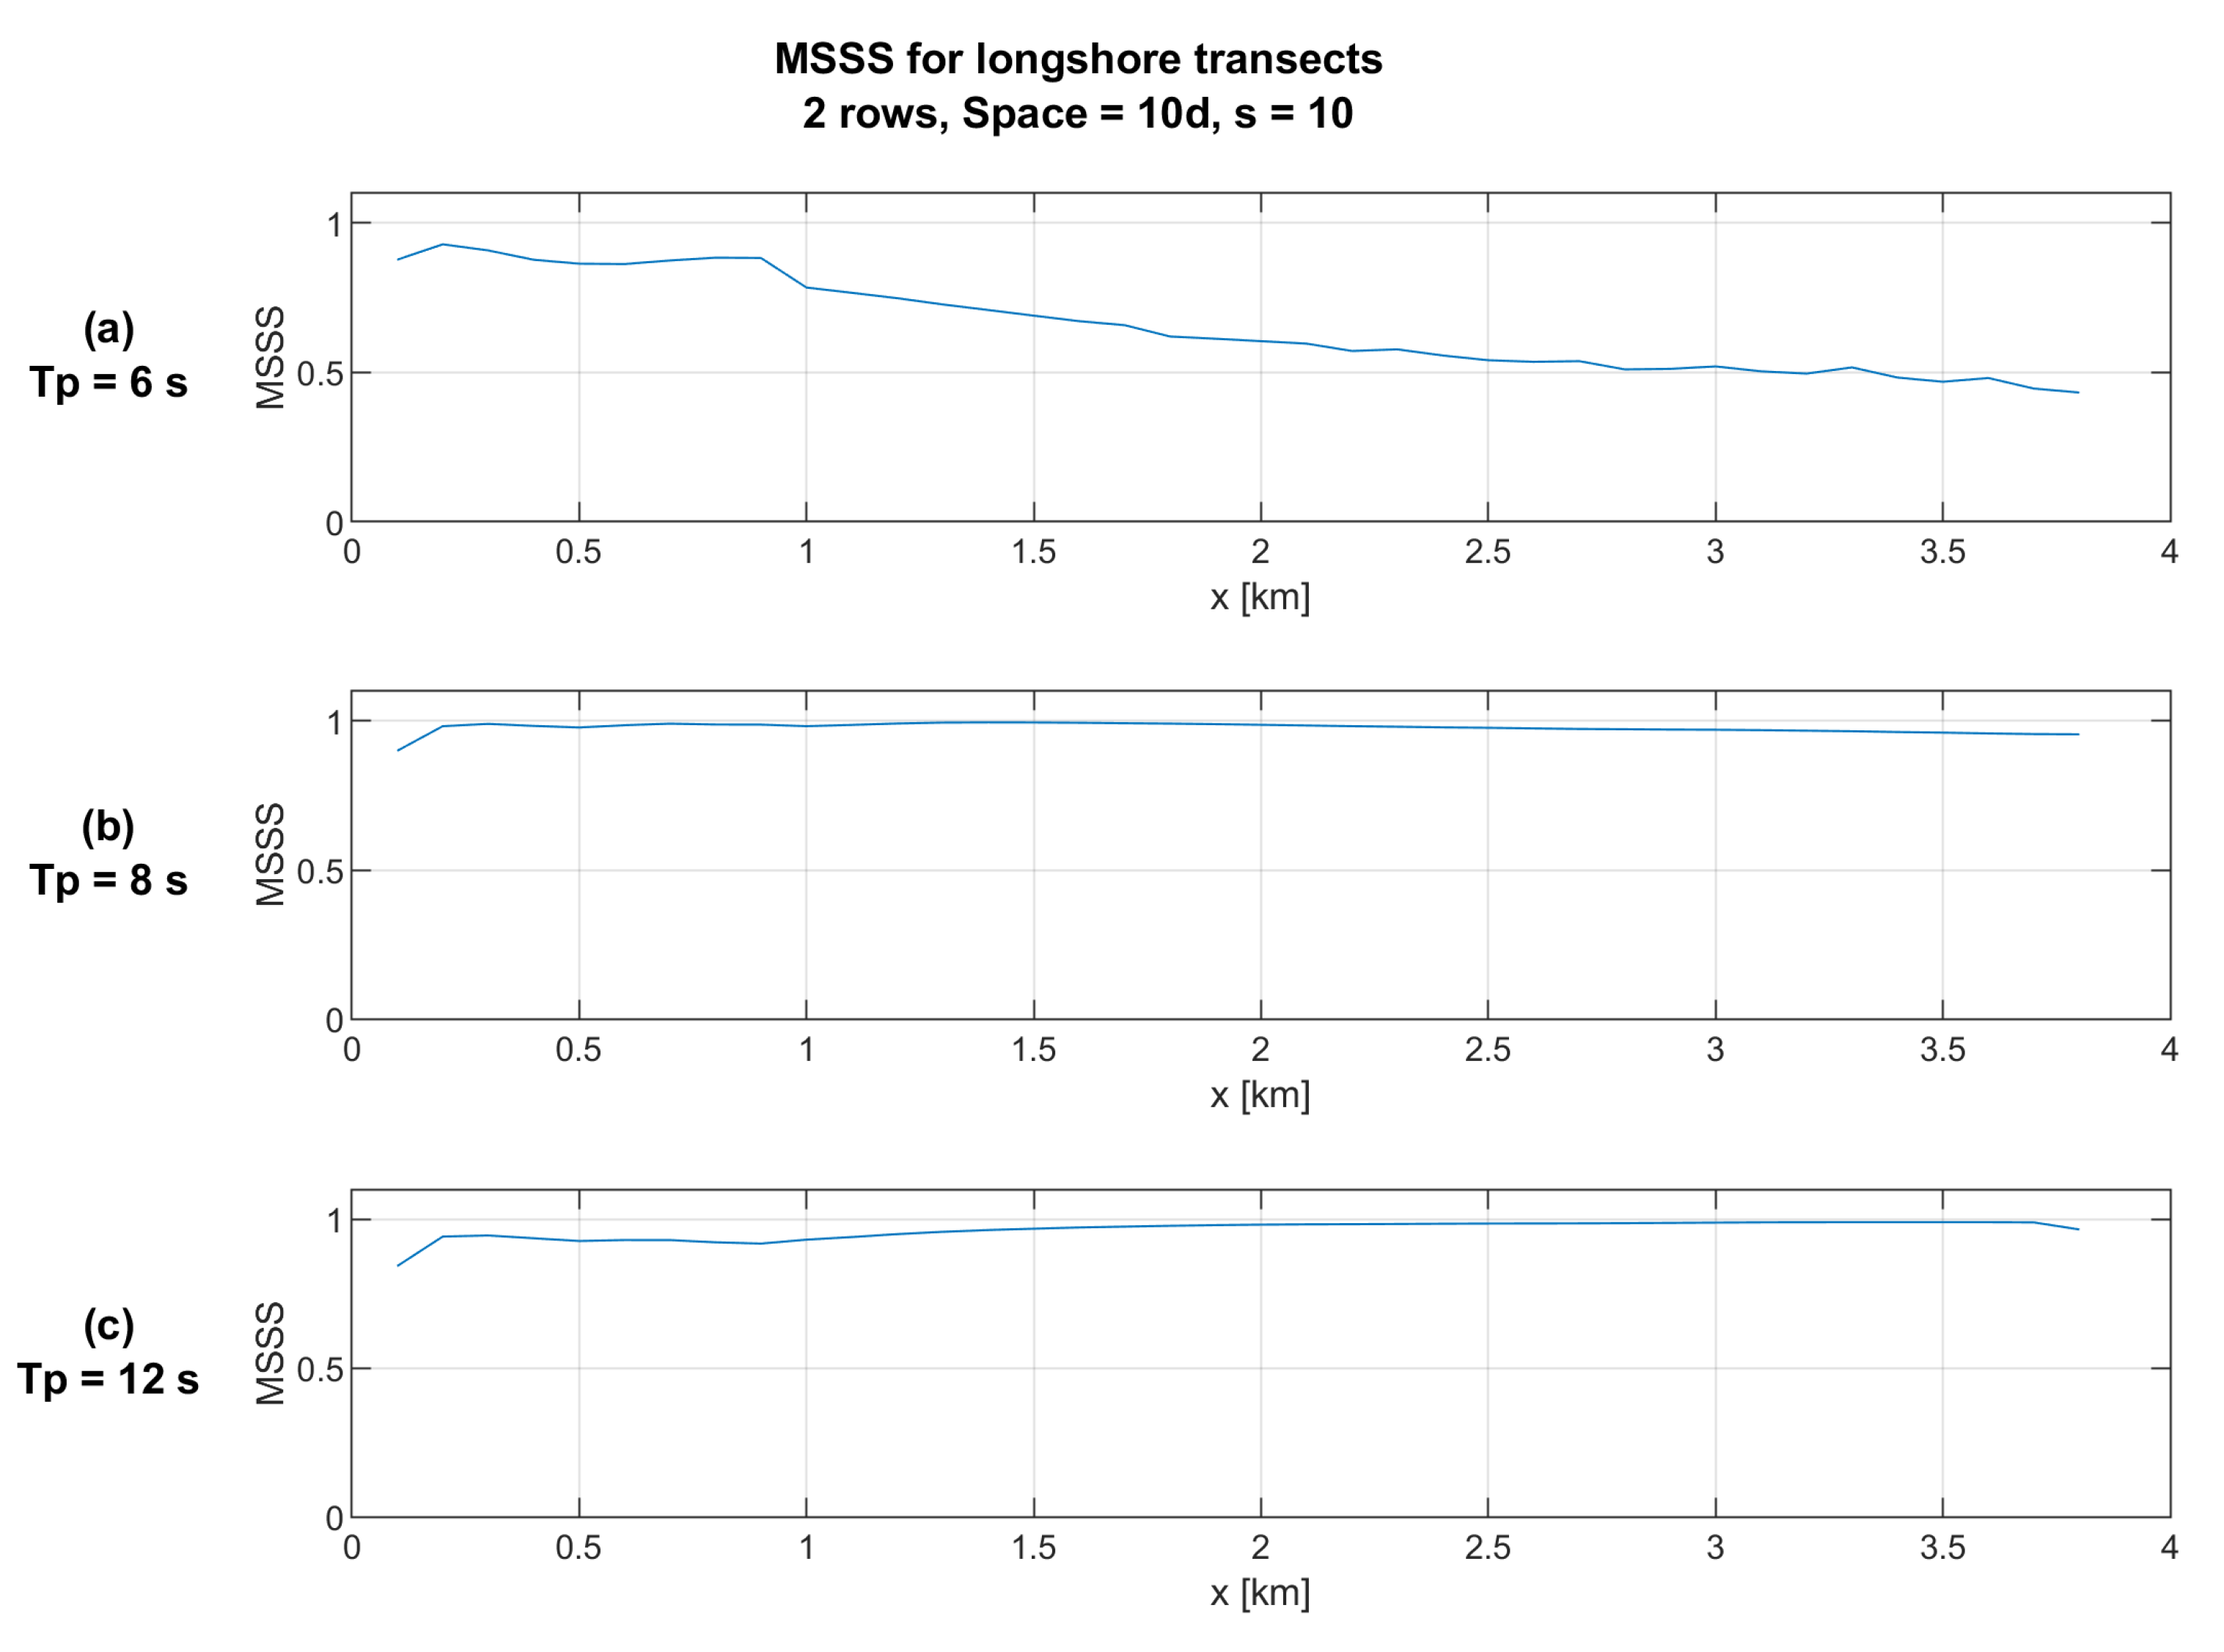
Figure 8 shows wave fields for a 2-row array, of spacing = 10d with moderate spreading for the three periods: = 6,8,12s; the MSSS at the 3.8 km transect are: 0.43, 0.95, and 0.97, respectively. One can see that LWIT and SNL-SWAN wave fields have visually good matches for each of these runs, particularly for = 8,12s, where the patterns in each pair of wave fields are of comparable shape and magnitude; this is corroborated by the Error plot, in which the relative error is less than 1% ().

Figure 8.
Wave fields, , and error for a particular array configuration at a particular directional spreading for the three wave periods under consideration.
At 6s, one can see that the LWIT wave field shows some wave reflection in front of the array (higher wave heights), which is not captured in SNL-SWAN. Correspondingly, LWIT shows a deeper wave shadow than SNL-SWAN; that is, some of the LWIT wave shadow is the results of wave reflection, not just power absorption, and SNL-SWAN only captures a wave shadow due to power absorption. This is again corroborated by the Error plot, which shows errors of around +/− 1–2%.
Figure 9 shows the corresponding longshore transect for the above set of conditions. Again, one can see that SNL-SWAN over-predicts the wave height (i.e., under-predicts the depth of the shadow) as compared to LWIT for 6s for all transects, while the match between LWIT and SNL-SWAN is very good for 8, 12 s. However, as before, the error between LWIT and SNL-SWAN is only around = 0.01–0.02, or 1–2% of the incident significant wave height.

Figure 9.
Longshore transects of at various cross-shore locations for the conditions given in Figure 8.
In Figure 9, particularly for = 12s at the 3.0 km and 3.8 km transects, one can also see the impact of the lateral BCs—the undisturbed wave field line becomes curved up at the boundaries; this impact is also manifested in the LWIT and SNL-SWAN wave fields.
Figure 10 shows the MSSS for longshore transects as a function of the cross-shore location for the above set of conditions. For 6,8s, the MSSS starts very high, nearly 1, and remains high throughout the domain; SNL-SWAN performs very well compared to LWIT throughout the domain.

Figure 10.
Mean-Squared Skill Score for longshore transects as a function of cross-shore location for the conditions given in Figure 8.
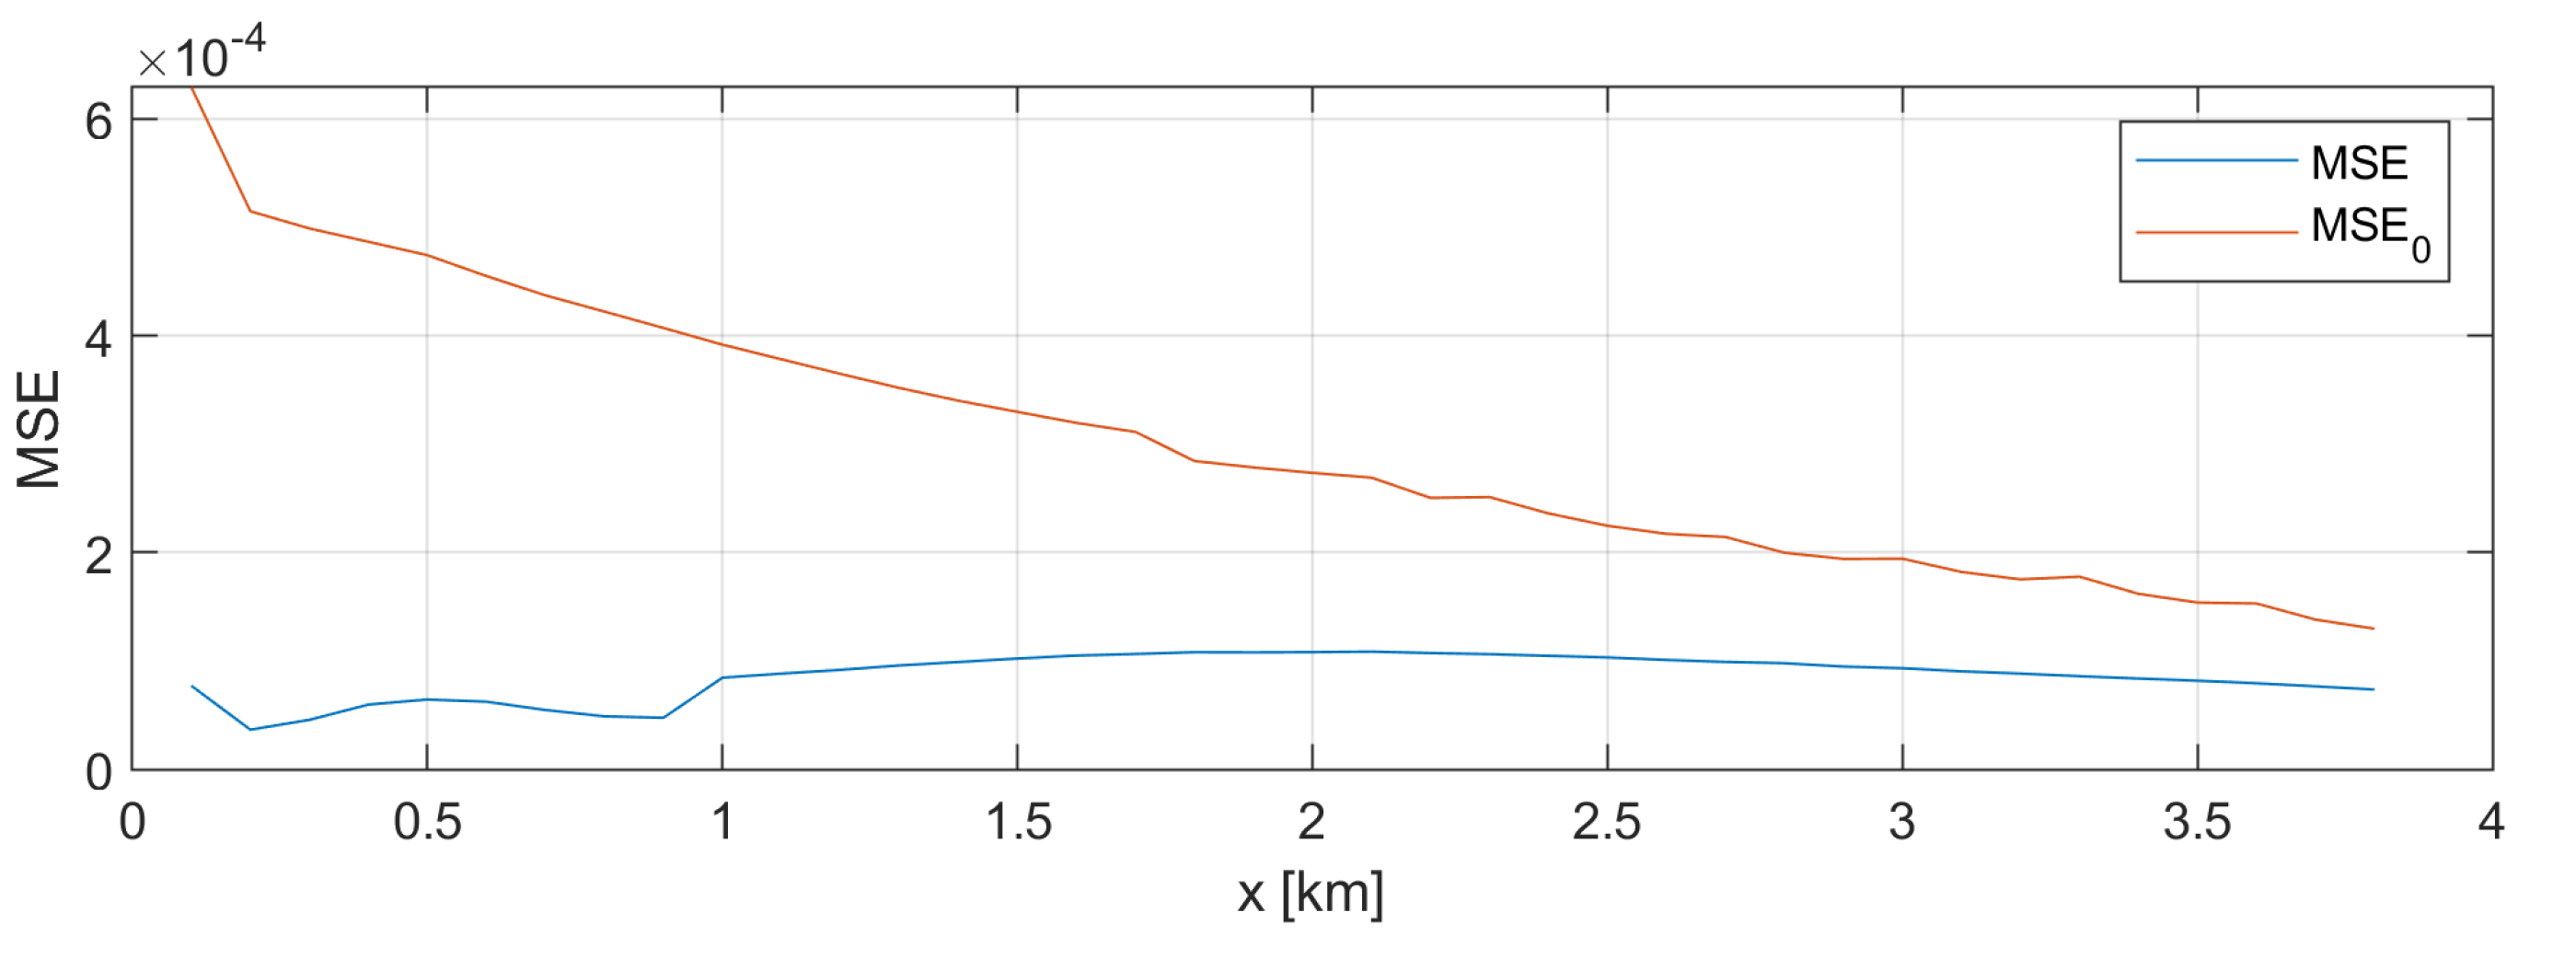
Interestingly, the MSSS for 6s starts near 1 but decays to less than 0.5 in the nearshore, resulting in a “Good” rather than “Excellent” score. The reason for this is illustrated in Figure 11: the (i.e., a measure of the error between SNL-SWAN and LWIT) remains constant throughout the cross-shore, but, for , the impact of the array on the wave field decreases towards the shore. Therefore, the relative error increases, i.e., the MSSS worsens.

Figure 11.
Mean-Squared Error () and the mean-squared error of Sandia National Laboratories-Simulating WAves Nearshore (SNL-SWAN) against the no-WEC condition () for 6s and the conditions given in Figure 8.
Considering that, for 6s, the MSSS got worse towards the shore simply because the impact of the wave farm decreased suggests that one should ask:
- How significant are the impacts of the array?
- Are the errors between SNL-SWAN and LWIT meaningful in the context of nearshore physical processes?
To answer this, consider simply the difference in meters between the SNL-SWAN and LWIT wave fields: . is considered for the entire Nearshore Domain for each period. Table 3 gives the maximum and mean values of for each period. For 6s, where the MSSS values were lowest, the maximum m, or 9 cm. As a dimensional value, this is very low and well within the range of error of met-ocean models typically used to predict nearshore wave conditions (e.g., Reference [33] or Reference [34]).

Table 3.
Difference in wave height, , over the nearshore domain.
4. Conclusions
The performance of SNL-SWAN for modeling WEC array impacts on the nearshore was assessed by comparing it to analogous results from LWIT, LWIT being more accurate at modeling wave-body interactions. The analysis considered medium-sized arrays in four configurations for a range of wave conditions representative of real ocean conditions in terms of , , and directional spreading.
Quantitative results showed that the agreement between SNL-SWAN and LWIT was “Good” to “Excellent”; MSSS > 0.3 for all conditions, and MSSS > 0.5 for most conditions.
Shorter waves, 6s, performed worse, because wave reflection is not captured in SNL-SWAN, where wave reflection accounts for a significant proportion of the wave shadow for shorter waves. However, this could be addressed by including the impact of reflection in the transmission coefficient curve rather than just wave energy absorption as was done in this study.
Nevertheless, errors between SNL-SWAN and LWIT were small, resulting in only maximum differences in between the models of 9 cm for short and medium waves and 20 cm for long waves, which is well within the error of typical met-ocean models used to predict nearshore wave conditions.
Further work to investigate other types of WECs, particularly non-axis-symmetric ones, even larger arrays, and the inclusion reflection in SNL-SWAN could be carried out.
Users of SNL-SWAN should be aware that, if large amounts of wave reflection are present, SNL-SWAN, using only the power capture, will over-predict down-wave wave heights, that is, under-predict the shadow. However, this difference may still be relatively small in absolute terms. Where the wave shadow is predominantly due to power absorption, users should have high confidence in the outputs of SNL-SWAN for realistic sea conditions.
Author Contributions
Conceptualization, J.C.M., A.P., C.C., J.R.; methodology, J.C.M. and A.P.; software, J.C.M. and A.P.; validation, J.C.M.; formal analysis, J.C.M.; investigation, J.C.M. and A.P.; resources, J.C.M. and A.P.; data curation, J.C.M.; writing—original draft preparation, J.C.M.; writing—review and editing, J.C.M., A.P., C.C., J.R.; visualization, J.C.M.; supervision, C.C. and J.R.; project administration, C.C. and J.R.; funding acquisition, J.R. All authors have read and agreed to the published version of the manuscript.
Funding
Funding for this work was provided by the U.S. Department of Energy, Office of Energy Efficiency and Renewable Energy, Water Power Technologies Office. Sandia National Laboratories is a multi-mission laboratory managed and operated by National Technology & Engineering Solutions of Sandia, LLC, a wholly owned subsidiary of Honeywell International Inc., for the U.S. Department of Energy’s National Nuclear Security Administration under contract DE-NA0003525. This paper describes objective technical results and analysis. Any subjective views or opinions that might be expressed in the paper do not necessarily represent the views of the U.S. Department of Energy or the United States Government.
Acknowledgments
The authors would like to thank Kelley Ruehl of Sandia National Laboratories for her support in setting this project and in her contributions in its early days, and we would like to thank Frank Salcedo of Mott McDonald for carrying out some of the SNL-SWAN and SWAN modeling.
Conflicts of Interest
The authors declare no conflict of interest.
Abbreviations
The following abbreviations are used in this manuscript:
| BC | Boundary condition |
| BEM | Boundary-element method |
| Significant wave height | |
| LWIT | Linear wave interaction theory |
| MSE | Mean-squared error |
| MSSS | Mean-squared skill score |
| RCW | Relative capture width |
| SNL | Sandia National Laboratories |
| SWAN | Simulating WAves Nearshore |
| Peak wave period | |
| WEC | Wave energy converter |
References
- Gunn, K.; Stock-Williams, C. Quantifying the global wave power resource. Renew. Energy 2012, 44, 296–304. [Google Scholar] [CrossRef]
- The SWAN Team. SWAN Scientific and Technical Documentation; Delft University of Technology: Delft, The Netherlands, 2020. [Google Scholar]
- Millar, D.; Smith, H.; Reeve, D. Modelling analysis of the sensitivity of shoreline change to a wave farm. Ocean Eng. 2007, 34, 884–901. [Google Scholar] [CrossRef]
- de Leon, S.P.; Bettencourt, J.H.; Kjerstad, N. Simulation of irregular waves in an offshore wind farm with a spectral wave model. Cont. Shelf Res. 2011, 31, 1541–1557. [Google Scholar] [CrossRef]
- Smith, H.; Pearce, C.; Millar, D. Further analysis of change in nearshore wave climate due to an offshore wave farm: An enhanced case study for the Wave Hub site. Renew. Energy 2011, 40, 51–64. [Google Scholar] [CrossRef]
- Iglesias, G.; Veigas, M. Wave farm impact and wave-WEC interaction: A sensitivity analysis. In Proceedings of the 10th European Wave and Tidal Energy Conference, Aalborg, Denmark, 2–5 September 2013. [Google Scholar]
- Carballo, R.; Iglesias, G. Wave farm impact based on realistic wave-WEC interaction. Energy 2013, 51, 216–229. [Google Scholar] [CrossRef]
- Abanades, J.; Greaves, D.; Iglesias, G. Wave farm impact on the beach profile: A case study. Coast. Eng. 2014, 86, 36–44. [Google Scholar] [CrossRef]
- Rusu, E.; Onea, F. Study on the influence of the distance to shore for a wave energy farm operating in the central part of the Portuguese nearshore. Energy Convers. Manag. 2016, 114, 209–223. [Google Scholar] [CrossRef]
- Astariz, S.; Iglesias, G. Co-located wind and wave energy farms: Uniformly distributed arrays. Energy 2016, 113, 497–508. [Google Scholar] [CrossRef]
- Ruehl, K.; Chartrand, C.; Porter, A. SNL-SWAN User’s Manual; Sandia National Laboratories: Albuquerque, NM, Bernalillo, 2014. [Google Scholar]
- Chang, G.; Ruehl, K.; Jones, C.; Roberts, J.; Chartrand, C. Numerical modeling of the effects of wave energy converter characteristics on nearshore wave conditions. Renew. Energy 2016, 89, 636–648. [Google Scholar] [CrossRef]
- Luczko, A.; Robertson, B.; Bailey, H.; Hiles, C.; Buckham, B. Representing non-linear wave energy converters in coastal wave models. Renew. Energy 2018, 118, 376–385. [Google Scholar] [CrossRef]
- Stratigaki, V.; Troch, P.; Forehand, D. A fundamental coupling methodology for modeling near-field and far-field wave effects of floating structures and wave energy devices. Renew. Energy 2019, 143, 1608–1627. [Google Scholar] [CrossRef]
- Özkan-Haller, H.T.; Haller, M.C.; McNatt, J.C.; Porter, A.; Lenee-Bluhm, P. Analyses of Wave Scattering and Absorption Produced by WEC Arrays: Physical/Numerical Experiments and Model Assessment. In Marine Renewable Energy: Resource Characterization and Physical Effects; Springer: Berlin/Heidelbreg, Germany, 2017; pp. 279–304. [Google Scholar]
- WAMIT, Inc. WAMIT User Manual—Ver 7.3; WAMIT Inc.: Chestnut Hill, MA, USA, 2019. [Google Scholar]
- Greenwood, C.; Christie, D.; Venugopal, V.; Morrison, J.; Vogler, A. Modelling performance of a small array of Wave Energy Converters: Comparison of Spectral and Boussinesq models. Energy 2016, 113, 258–266. [Google Scholar] [CrossRef]
- Venugopal, V.; Nemalidinne, R.; Vögler, A. Numerical modelling of wave energy resources and assessment of wave energy extraction by large scale wave farms. Ocean Coast. Manag. 2017, 147, 37–48. [Google Scholar] [CrossRef]
- McNatt, J.; Porter, A.; Ruehl, K.; Roberts, J. Verification of the SNL-SWAN Spectral WEC-wave Model with Phase-resolved Linear Wave Fields. In Proceedings of the 12th European Wave and Tidal Energy Conference, Cork, Ireland, 27 August–1 September 2017. [Google Scholar]
- McNatt, J.; Porter, A.; Ruehl, K. Comparison of Numerical Methods for Modeling the Wave Field Effects Generated by Individual Wave Energy Converters and Multiple Converter Wave Farms. J. Mar. Sci. Eng. 2020, 8, 168. [Google Scholar] [CrossRef]
- Forristall, G.Z.; Ewans, K.C. Worldwide measurements of directional wave spreading. J. Atmos. Ocean. Technol. 1998, 15, 440–469. [Google Scholar] [CrossRef]
- Folley, M. Numerical Modelling of Wave Energy Converters: State-of-the-Art Techniques for Single Devices and Arrays; Elsevier: Amsterdam, The Netherlands, 2016. [Google Scholar]
- McNatt, J.; Venugopal, V.; Forehand, D.; Payne, G. Experimental Analysis of Cylindrical Wave Fields. In Proceedings of the 11th European Wave and Tidal Energy Conference, Nantes, France, 6–11 September 2015. [Google Scholar]
- McNatt, J.; Venugopal, V.; Forehand, D. A novel method for deriving the diffraction transfer matrix and its application to multi-body interactions in water waves. Ocean Eng. 2015, 94, 173–185. [Google Scholar] [CrossRef]
- Kagemoto, H.; Yue, D.K.P. Interactions among multiple three-dimensional bodies in water waves: An exact algebraic method. J. Fluid Mech. 1986, 166, 189–209. [Google Scholar] [CrossRef]
- Child, B.; Venugopal, V. Optimal configurations of wave energy device arrays. Ocean Eng. 2010, 37, 1402–1417. [Google Scholar] [CrossRef]
- Goo, J.S.; Yoshida, K. A numerical method for huge semisubmersible response in waves. Trans. Soc. Nav. Archit. Mar. Eng. 1990, 98, 365–387. [Google Scholar]
- McNatt, J.C. Cylindrical Linear Water Waves and Their Application to the Wave Body Problem. Ph.D. Thesis, The University of Edinburgh, Edinburgh, UK, 2016. [Google Scholar]
- Bruun, P. Coastal Erosion and the Development of Beach Profiles; Technical Report Technical Memorandum 44; Army Corps of Engineers: Washington, DC, USA, 1954. [Google Scholar]
- Dallman, A.; Neary, V. Characterization of U.S. Wave Energy Converter (wec) Test Sites: A Catalogue of Met-Ocean Data; Technical Report SAND2014-18206; Sandia National Laboratories: Albuquerque, NM, USA, 2014. [Google Scholar]
- Mitsuyasu, H.F.; Tasai, F.; Suhara, T.; Mizuno, S.; Ohkuso, M.; Honda, T.; Rikiishi, K. Observations of the directional spectrum of ocean waves using a cloverleaf buoy. J. Phys. Oceanogr. 1975, 5, 750–760. [Google Scholar] [CrossRef]
- Sutherland, J.; Peet, A.H.; Soulsby, R.L. Evaluating the performance of morphological models. Coast. Eng. 2004, 51, 917–939. [Google Scholar] [CrossRef]
- Inghilesi, R.; Catini, F. and Bellotti, G.; Franco, L.; Orasi, A.; Corsini, S. Implementation and validation of a coastal forecasting system for wind waves in the Mediterranean Sea. Nat. Hazards Earth Syst. Sci. 2012, 12, 485–495. [Google Scholar] [CrossRef]
- Allard, R.; Rogers, W.E.; Carroll, S.N.; Rushing, K.V. Validation Test Report for the Simulation Waves Nearshore Model (SWAN) Cycle III, Version 40.11; Technical Report NRL/FR/7322–04-10,070; Naval Research Labboratory: Washington, DC, USA, 2004. [Google Scholar]
Publisher’s Note: MDPI stays neutral with regard to jurisdictional claims in published maps and institutional affiliations. |
© 2020 by the authors. Licensee MDPI, Basel, Switzerland. This article is an open access article distributed under the terms and conditions of the Creative Commons Attribution (CC BY) license (http://creativecommons.org/licenses/by/4.0/).

