Article

Global Harmonic Parameters for Estimation of Power Quality Indices: An Approach for PMUs

by
David Granados-Lieberman
Departamento de Ingeniería Electromecánica, Tecnológico Nacional de México, Instituto Tecnológico Superior de Irapuato (ITESI), Carr. Irapuato-Silao km 12.5, Colonia El Copal, Irapuato 36821, Guanajuato, Mexico
Energies 2020, 13(9), 2337; https://doi.org/10.3390/en13092337
Submission received: 29 March 2020 / Revised: 10 April 2020 / Accepted: 11 April 2020 / Published: 8 May 2020

Abstract

:
For wide-area measurement systems and smart grids, phasor measurement units (PMUs) have become key elements since they provide synchronized information related to the fundamental frequency components of voltages and currents. In recent years, some works have extended the concept of PMU to harmonic analysis due to the proliferation of nonlinear loads. In this work, as a first contribution, the reference model for P-class and M-class PMUs provided by the IEEE Standard C37.118.1 is expanded with the aim of obtaining the harmonic information and electric power quantities. Additionally, as a second contribution, the approach of global harmonic parameters (GHPs) for PMUs is proposed. Specifically, GHPs are introduced in this work as unified quantities regarding the overall harmonic content of voltages and currents signals. With the help of these parameters, the estimation of power quality indices (PQIs) according to the IEEE Standard 1459 can be carried out but with an important advantage, i.e., a reduced amount of data, which reduces the requirements of management, storage, and analysis. Finally, the mathematical formulations for PQIs using the proposal are also presented. It is important to mention that they are equivalent to classical formulations that use individual harmonic information; however, they exploit the advantage of PMUs that require a reduced amount of data. Several tests with synthetic and real signals are carried out to validate the proposal. Results demonstrate the effectiveness and usefulness of the proposed approach.

Graphical Abstract

1. Introduction

In power systems, the use of phasor measurement units (PMUs) in wide-area measurement systems to perform measurement, monitoring, protection, and control tasks has increased considerably [1]. They are also considered as the basis for measurement infrastructure in smart transmission grids [2]. PMUs provide simultaneously synchronized measurements of voltages and currents at different points of the power system [3]. These measurements are magnitude, phase angle, and frequency of the fundamental frequency components [4], i.e., 50 or 60 Hz; however, information about the harmonic content is not reported by conventional PMUs [5].
Over the past few years, special attention has been given to problems related to harmonic pollution in power networks [6,7], which have increased due to the proliferation of power electronic device-based nonlinear loads and deregulation of power networks, especially the wide installation of converter-based distributed generation units [8]. On the other hand, harmonic information has also proven to be very useful in several power systems applications, from monitoring the set of geomagnetic storms in electrical equipment [9] to intelligent-system-based detection of microgrid islanding [10]. From this point of view, the measurement of harmonic content has become one of the main necessities of power networks and smart grids [8]. In order to provide solutions, novel harmonic measurement methods and advanced technologies are required [11], where the potential of harmonic phasor measurement units (HPMUs) can be exploited.
In the last few years, several works have been carried out on the measurement of harmonic phasors in a PMU context [12,13,14]. In [11], a synchronized measurement system of harmonics using the recursive discrete Fourier transform for wide-area distribution systems is presented. A global positioning system (GPS)-based system for the measurement of synchronized harmonic phasors using both virtual instrumentation and the discrete Fourier transform method appears in [5]. A three-phase version of a PMU for harmonic phasor monitoring in distribution networks is shown in [12]. It uses the fast Fourier transform algorithm and a hardware platform from National Instrument for the implementation. A phasor estimation based on the combination of harmonic components using adaptive filtering is presented in [13]. Algorithms based on Kalman and finite-impulse-response filters for joint tracking of fundamental and harmonic phasors are proposed in [14]. Despite obtaining promising results, the abovementioned works provide phasor information for each harmonic component over time, which may result in a huge amount of data and high requirements of management, storage, and analysis [15,16]. In addition, the computational burden associated with computing a high number of parameters increases, especially considering high-order harmonics, which may compromise the real-time measurements if low-end digital processors are used. Other works using techniques such as the fast Fourier transform, parametric methods, Prony’s method, adaptive linear networks, Kalman filtering, phase-locked-loop method, and artificial neural networks have been proposed for harmonic analysis in power systems [17,18]; nonetheless, although they could be used in a PMU context, some aspects, such as the complexity of the technique for real-time monitoring, the convergence time in adaptive algorithms, the possible measurement errors associated to the nonstationary features of the analyzed signals in the batch processing techniques, the amount of generated data, and the computational burden, among others, have to be taken into account. Similar aspects have to be considered in the estimation of power quality indices (PQIs) [18]. It is worth noting that PQIs and electric power quantities are very useful parameters in power grids [19].
No norms, standards or guidelines for harmonic phasor measurement [14] exist so far; the performance tests and acceptable limits for fundamental phasor quantities are found in the IEEE Standard C37.118.1 [4], where two classes of performance, P-class and M-class, are defined. P-class serves protection purposes, and therefore, a fast response is desired; by contrast, the M-class PMU is used in applications that require a high rejection of aliased signals. From this point of view and by considering all the abovementioned aspects, it is desirable to have a PMU scheme that provides fundamental and harmonic phasor information for the estimation of power quality indices (PQIs), but with a noticeable reduction of both data and computational burden without affecting the performance requirements stated in the standards.
In this work, the fundamental phasor estimation model provided by the standard is extended to obtain harmonic component information, where the P-class and M-class filters are considered in the tests. Additionally, global harmonic parameters (GHPs) are introduced as unified quantities to provide information about the overall harmonic content of voltage and current signals. The unified values allow the estimation of PQIs, keeping both the amount of data and the computational burden low, as few parameters are computed, unlike in classical methods that compute phasor quantities for each harmonic component. In order to meet the requirements established for PMUs in the IEEE standard C37.118.1 [4] and the current definitions used for measurement of electric power quantities in the IEEE std. 1459 [19], the mathematical equations for the estimation of PQIs using the classical method and the proposed GHPs are presented. It is worth noting that the proposed HPMU allows both individual harmonic estimation for voltage and current signals and global harmonic estimation through the proposed GHPs. The former contributes to applications where the information of a particular harmonic component (or harmonic components) is of interest, while the latter reduces the requirements of management, storage, and analysis of data. Both options allow obtaining PQIs. The user will decide which option is better for their application. In order to validate the proposal, a numerical study case shows the estimation of PQIs such as real, reactive, and apparent powers, true root mean square (true RMS) values, and total harmonic distortion (THD) values, among others. Then, synthetic signals with variations in magnitude, phase, frequency, and harmonic content are used. Finally, the proposal is also tested under real operating conditions using an electrical system composed of a distribution line (equivalent electrical circuit) and different electrical loads.

2. Theoretical Background

In this section, the bases for PMUs and PQIs following the respective standards are presented.

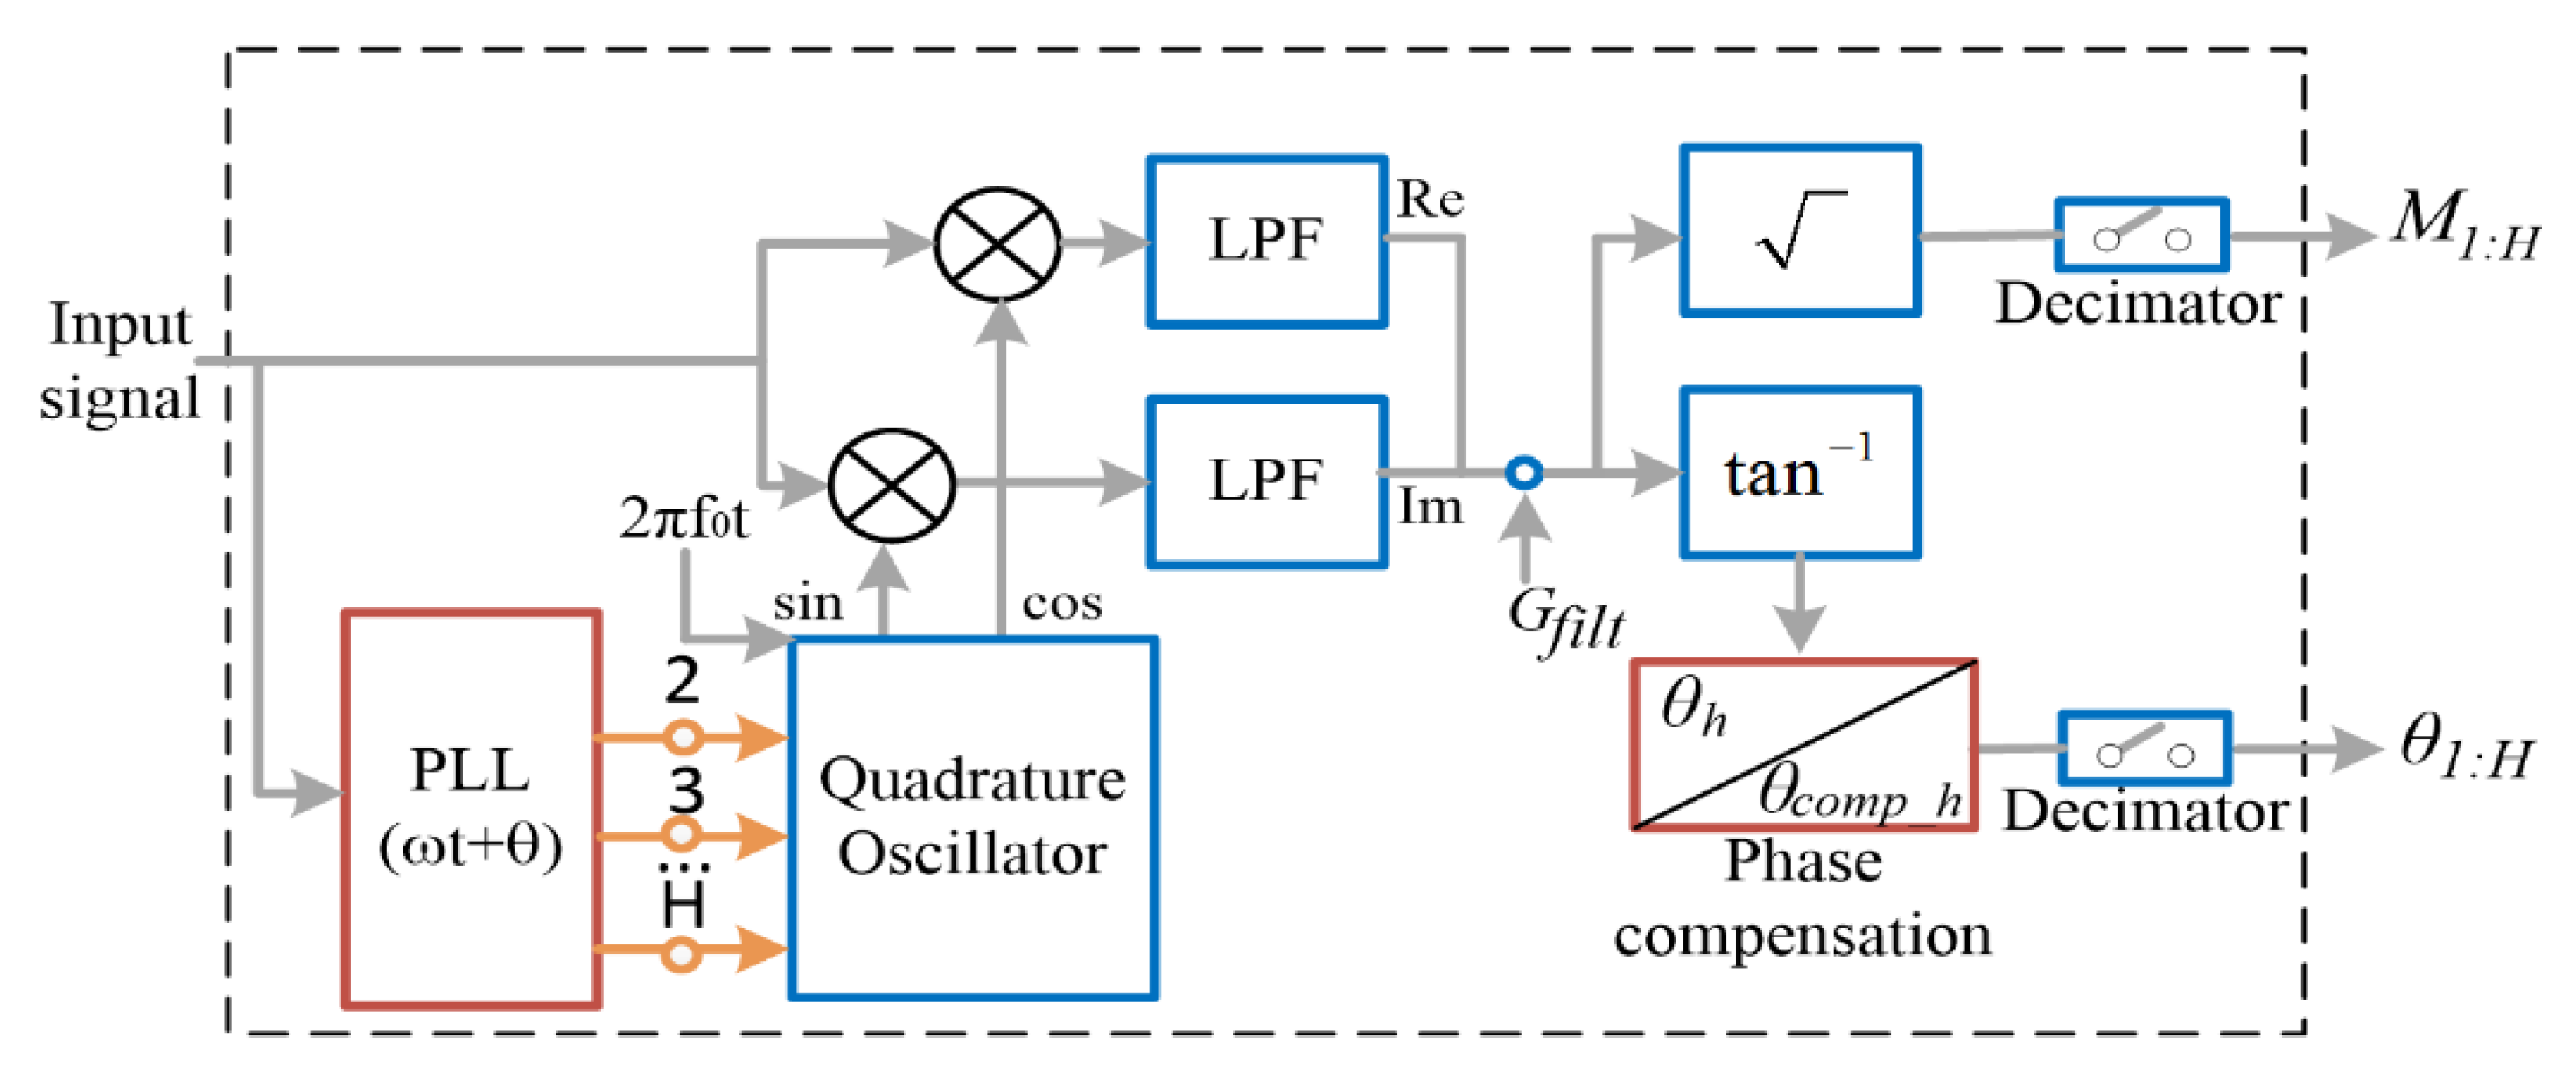
2.1. Fundamental Phasor Estimation Model

In the IEEE standard C37.118.1 [4], a reference signal processing model for phasor estimation of the fundamental frequency component is presented. It satisfies the requirements for compliance with the standard under both steady-state and dynamic conditions. The model is shown in Figure 1 [4]. Firstly, the input signal, voltage or current is multiplied by the nominal carrier frequency, which is given by a quadrature oscillator. Then, a low-pass filter (LPF) for each resulting signal is used. In a P-class filter, the filter order M is defined as a function of the number of samples per cycle (NSPC) as follows: M = 2·(NSPC-1). The NSPC is obtained by dividing the sampling frequency, Fsampling, by the fundamental frequency, f0. Regarding the M-class PMU, the coefficients are determined through the multiplication of a Hamming function and a filter based on a “sinc” function with a reference frequency, Ffr. Ffr and M are given by the standard according to the reporting rate. More detailed information can be found in [4].
Additionally, the PMU model requires a compensation gain, Gfilt, to obtain a unity gain at the DC component. Next, the RMS value for the fundamental magnitude, RMSF, and the phase, θF, are obtained from the complex signal as follows:
R M S F = 2 · Re 2 + Im 2 ,   θ F = tan 1 ( Im / Re )
where Re and Im are the real and imaginary parts, respectively. In the case of a frequency deviation, ΔFF, RMSF is compensated by dividing the phasor magnitude between the response of the LPF at the estimated frequency [4].

2.2. Power Quality Index
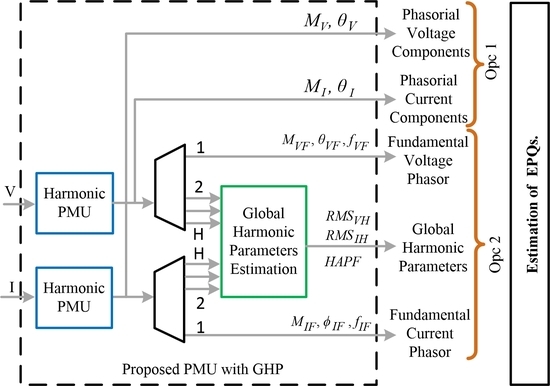
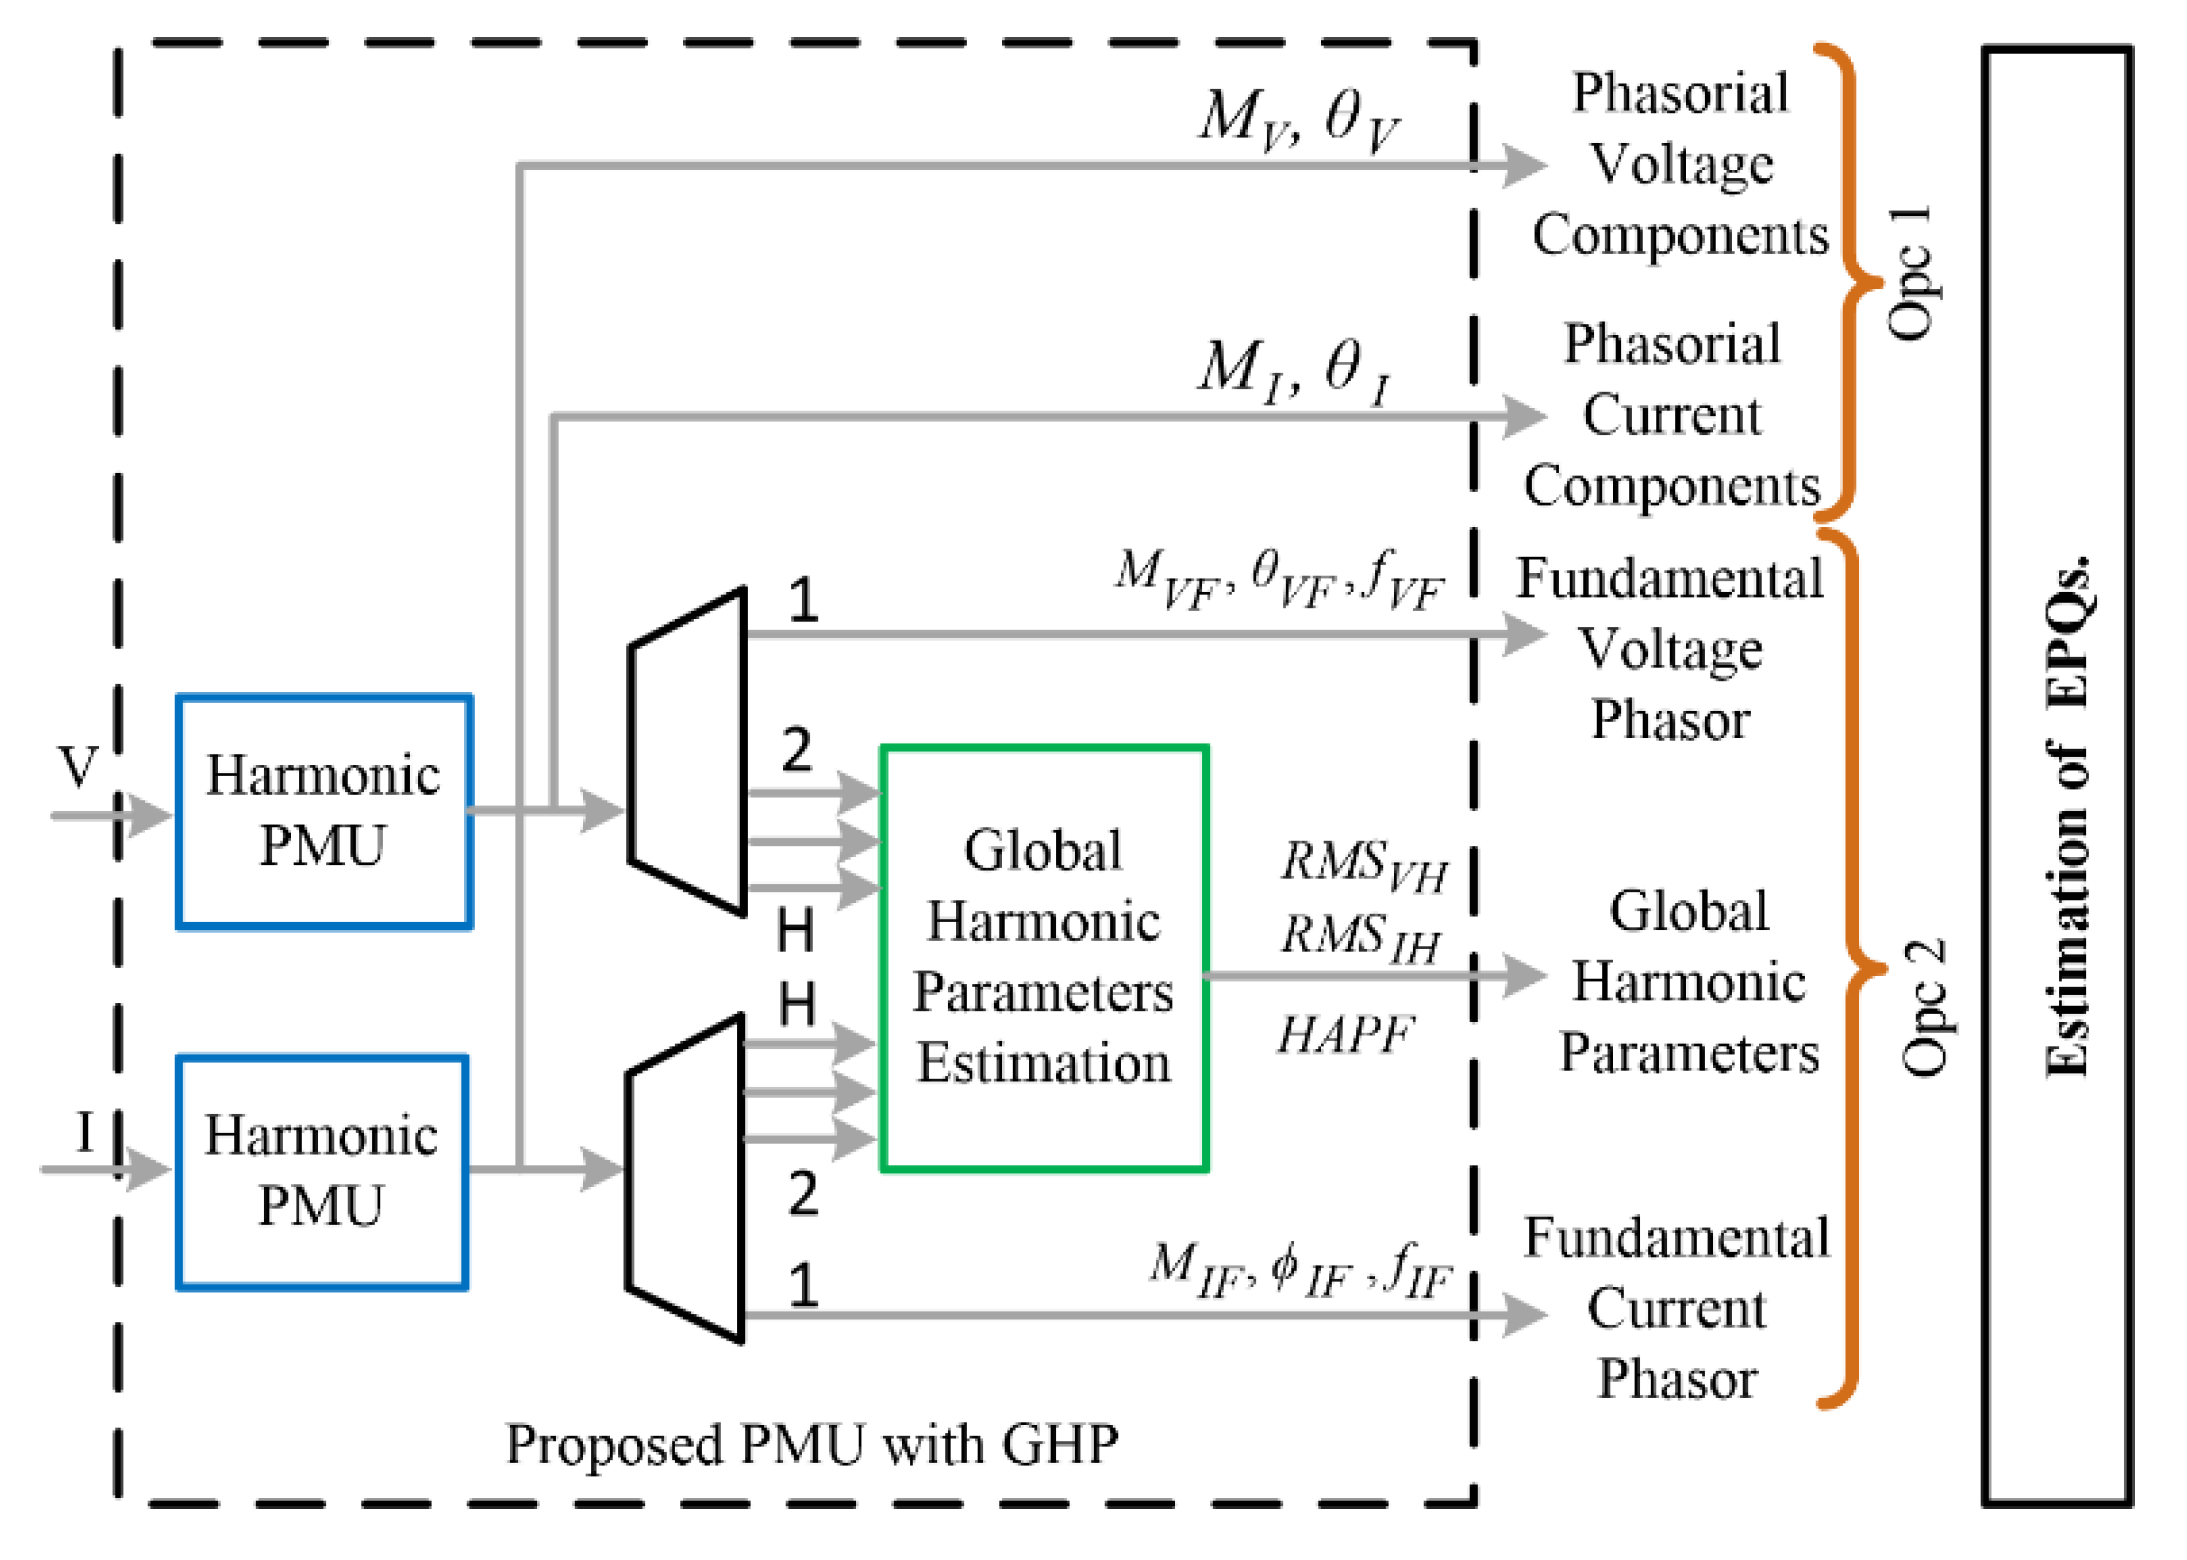
The mathematical models for voltage, v(t), and current, i(t), signals with harmonic content are given by the IEEE standard 1459 [19]:
v ( t ) = 2 V F sin ( 2 π f F t + θ F ) + 2 h = 2 H V h sin ( 2 π h f F t + θ h )
i ( t ) = 2 I F sin ( 2 π f F t + ϕ F ) + 2 h = 2 H I h sin ( 2 π h f F t + ϕ h )
where the fundamental and harmonic components are independently analyzed. VF and IF are the magnitudes of the fundamental components of voltage and current, respectively. Vh and Ih are the magnitudes of the harmonic components, h is the harmonic order, and H is the maximum number of harmonics. fF is the fundamental frequency. Regarding the phase angles, θF and φF are the phase angles of the fundamental components of voltage and current, respectively; in the same manner, θh and φh are the phases of each harmonic of voltage and current, respectively.
On the other hand, the instantaneous power theory provides an important basis for the comprehension and application of electric power. The mathematical formulation for instantaneous power, Pinst, is obtained by multiplying v(t) and i(t). For a vector representation, this is
P i n s t = v ( t ) i ( t )
P i n s t = ( V 1 I 1 + V 2 I 2 + V 3 I 3 + V H I H ) + V 1 ( I 2 + I 3 + I 4 + I H ) + V 2 ( I 3 + I 4 + I 5 + I H ) + V H - 1 ( I H )
where the subindex indicates the harmonic order and H is maximum harmonic order. The first set of terms are direct products that contain two types of power components: constant power values or active power, P (composed by fundamental active power P1 = V1I1 = V1I1cos(θ1φ1) and harmonic active power PHs = V2I2 + V3I3 + … + VHIH = h H V h I h cos ( θ h φ h ) ) and intrinsic power (i.e., for fundamental components, V1I1cos(4πf0t + θ1 + φ1)), which does not have energy contribution. Similarly, the rest of the terms in Equation (5), cross-products, do not represent a net transfer of energy. Likewise, if a phase delay between voltage and current occurs, the IEEE 1159 [19] defines the fundamental reactive power Q1 as Q1 = V1I1sin(θ1φ1).
Similar to the instantaneous power, total apparent power can be described by direct and cross-products
S 2 = v ( t ) 2 i ( t ) 2
S 2 = ( V 1 2 I 1 2 ) + ( V 2 2 I 2 2 + V 3 2 I 3 2 + V H 2 I H 2 ) + ( V 2 2 I 3 2 + V 2 2 I 4 2 + V 3 2 I 4 2 + V 3 2 I 5 2 + V H 1 2 I H 2 ) + V 1 2 ( I 2 2 + I 3 2 + I 4 2 + I h 2 ) + I 1 2 ( V 2 2 + V 3 2 + V 4 2 + V h 2 )
In this case, the first term (V12I12) is the fundamental apparent power, S1. Then, the direct harmonic products (second group of terms: V22I22 + V32I32 +…Vh2Ih2) along with the harmonic cross-products (third group of terms: V22I32 + V22I42 + V32I42 + V32I52 +…VH-12IH2) correspond to the harmonic apparent power, SH. The last two groups of terms (V12(I22 + I32 + I42 +…Ih2) and I12(V22 + V32 + V42 +…Vh2)) are called current distortion power, DI, and voltage distortion power, DV, respectively. Lastly, the nonfundamental apparent power, SN, is calculated as follows
S N 2 = D I 2 + D V 2 + S H 2
Other related quantities are nonactive powers obtained from apparent power and active powers, such as harmonic distortion power, DH, and nonactive power, N. The first one relates the harmonic powers SH and PH, and the second one concerns the total powers S and P. These are:
D H 2 = S H 2 P H 2
N 2 = S 2 P 2
Furthermore, the fundamental power factor, PF1, and the total power factor, PF, are calculated according to Equations (11) and (12), respectively [19].
P F 1 = P 1 / S 1
P F = P / S

3. HPMU and GHPs

The proposed HPMU algorithm is an extension of conventional PMUs (fundamental phasors) as shown in Figure 2. Firstly, it uses the phasor estimation algorithm presented in the IEEE standard C37.118.1 [4] for the estimation of the fundamental phasors, which corresponds to the reference model shown in Figure 1. In this regard, it provides the fundamental magnitude and phase of the input signal. Moreover, for the estimation of harmonic phasors, the argument of the sine/cosine wave oscillator uses the instantaneous phase (i.e., ωt + θ), which is computed from the input signal using a phase-locked loop (PLL), and it is multiplied for the harmonic order.
This process generates different intermediate frequency components due to the multiplication of the oscillator signals with the multiple harmonic components of the input signal; however, just the desired component is modulated to 0 Hz and extracted by the LPFs for each harmonic phasor estimation. Later, the magnitude and phase for each harmonic are computed using Equation (1). Moreover, the estimation of phase for harmonic components requires an additional compensation stage. This is due to the instantaneous phase that has a delay proportional to the fundamental phase θ1. The harmonic phase is compensated by:
θ c o m p _ h = θ h + ( ϖ 2 π f 0 ) h k / F s
where θcomp_h is the estimated phase compensated for each harmonic, θh is the harmonic phase, h is the harmonic order, k is the sample, and Fs is sampling frequency. Finally, each output is resampled using a decimator (i.e., taking a value at each L sample). As a result, all the parameters of the PMU are simultaneously reported using a specific value of FS_report.
On the other hand, new harmonic parameters can be obtained with the aim of quantifying the harmonic content in a global way. In this regard, the concept of GHPs is proposed containing just three parameters required for obtaining the PQIs. First, the harmonic magnitudes of voltage, RMSVH, and current, RMSIH, are determined by the RMS values of the harmonic content of voltage, VH, and current, IH. In frequency domain, they are given by:
R M S V H = 1 2 h = 2 H V h 2 ,   R M S I H = 1 2 h = 2 H I h 2
Additionally, the harmonic active power factor (HAPF) is proposed, which corresponds to the ratio of harmonic active power PH consumed by a load to the apparent harmonic power SH flowing in the circuit. Mathematically, it can be written as follows:
H A P F = P H / S H
HAPF is formulated to relate harmonic information along with the aforementioned index to obtain PQIs. In this sense, an application of the proposed approach is presented, in which the fundamental phasor information and the GHPs are used for the estimation of several PQIs. It is worth noting that these indices could be computed in a receiver, e.g., a wide-area monitoring system, in order to provide information for assessment, protection, and control tasks of power grids. Figure 3 shows two options for the estimation of electric power quantities or PQIs based on the proposed HPMU. The first option corresponds to the use of each harmonic phasor components of voltage and current MV_h∠θV_h and MI_h∠φV_h, respectively, for h = 1, 2, …, H; and the second one is the estimation of the fundamental phasors of voltage and current MV_1∠θV_1 and MI_1∠φV_1, respectively, along with the proposed GHP (RMSVH, RMSIH, and HAPF), which are calculated using Equations (14) and (15).
Moreover, Table 1 presents the classical formulation of such indices in the frequency domain [18,19,20,21], i.e., formulation based on the frequency components of voltage and current signals, and the equivalent formulation based on the GHP.

4. Validation and Results

In this section, three study cases are presented. Study case 1 corresponds to direct evaluation of the PQIs using phasor information of voltage and current; study case 2 uses synthetic signals that are processed using the algorithm proposed, and study case 3 considers experimental measurements from an electrical system.

4.1. Study Case 1: Evaluation of PQIs

In order to demonstrate the equivalence between formulations shown in Table 1, this study case presents a numerical example, which is similar to the one shown in the annex B of the IEEE std. 1459 [19]. Firstly, the values shown in Table 2 for the fundamental component and three harmonic components according to Equations (2) and (3) are considered.
In this regard, the fundamental phasors estimated of voltage and current are 100 V∠0° and 100 A∠−30°, respectively. Using the harmonic components, h = 3, 5, and 7, the classical formulation, PH, and SH are −27.4655 W, and 477.1268 VA, respectively. For clarity purposes, PH is computed through 1/2·(√2·8·√2·20·cos (−70 − (−165)) + √2·15·√2·15·cos (140 − 233) + √2·5·√2·10·cos (20 − (−72))) = −27.47 W. From the aforementioned results, GHPs are RMSVH = 17.72 V, RMSIH = 26.9258 A, and HAPF = −0.0576. Table 3 shows all the results for PQIs described in Table 1. It can be noted that the obtained results are the same for both the options that are classical formulation and the proposed GHPs-based formulation; therefore, their equivalence is validated.

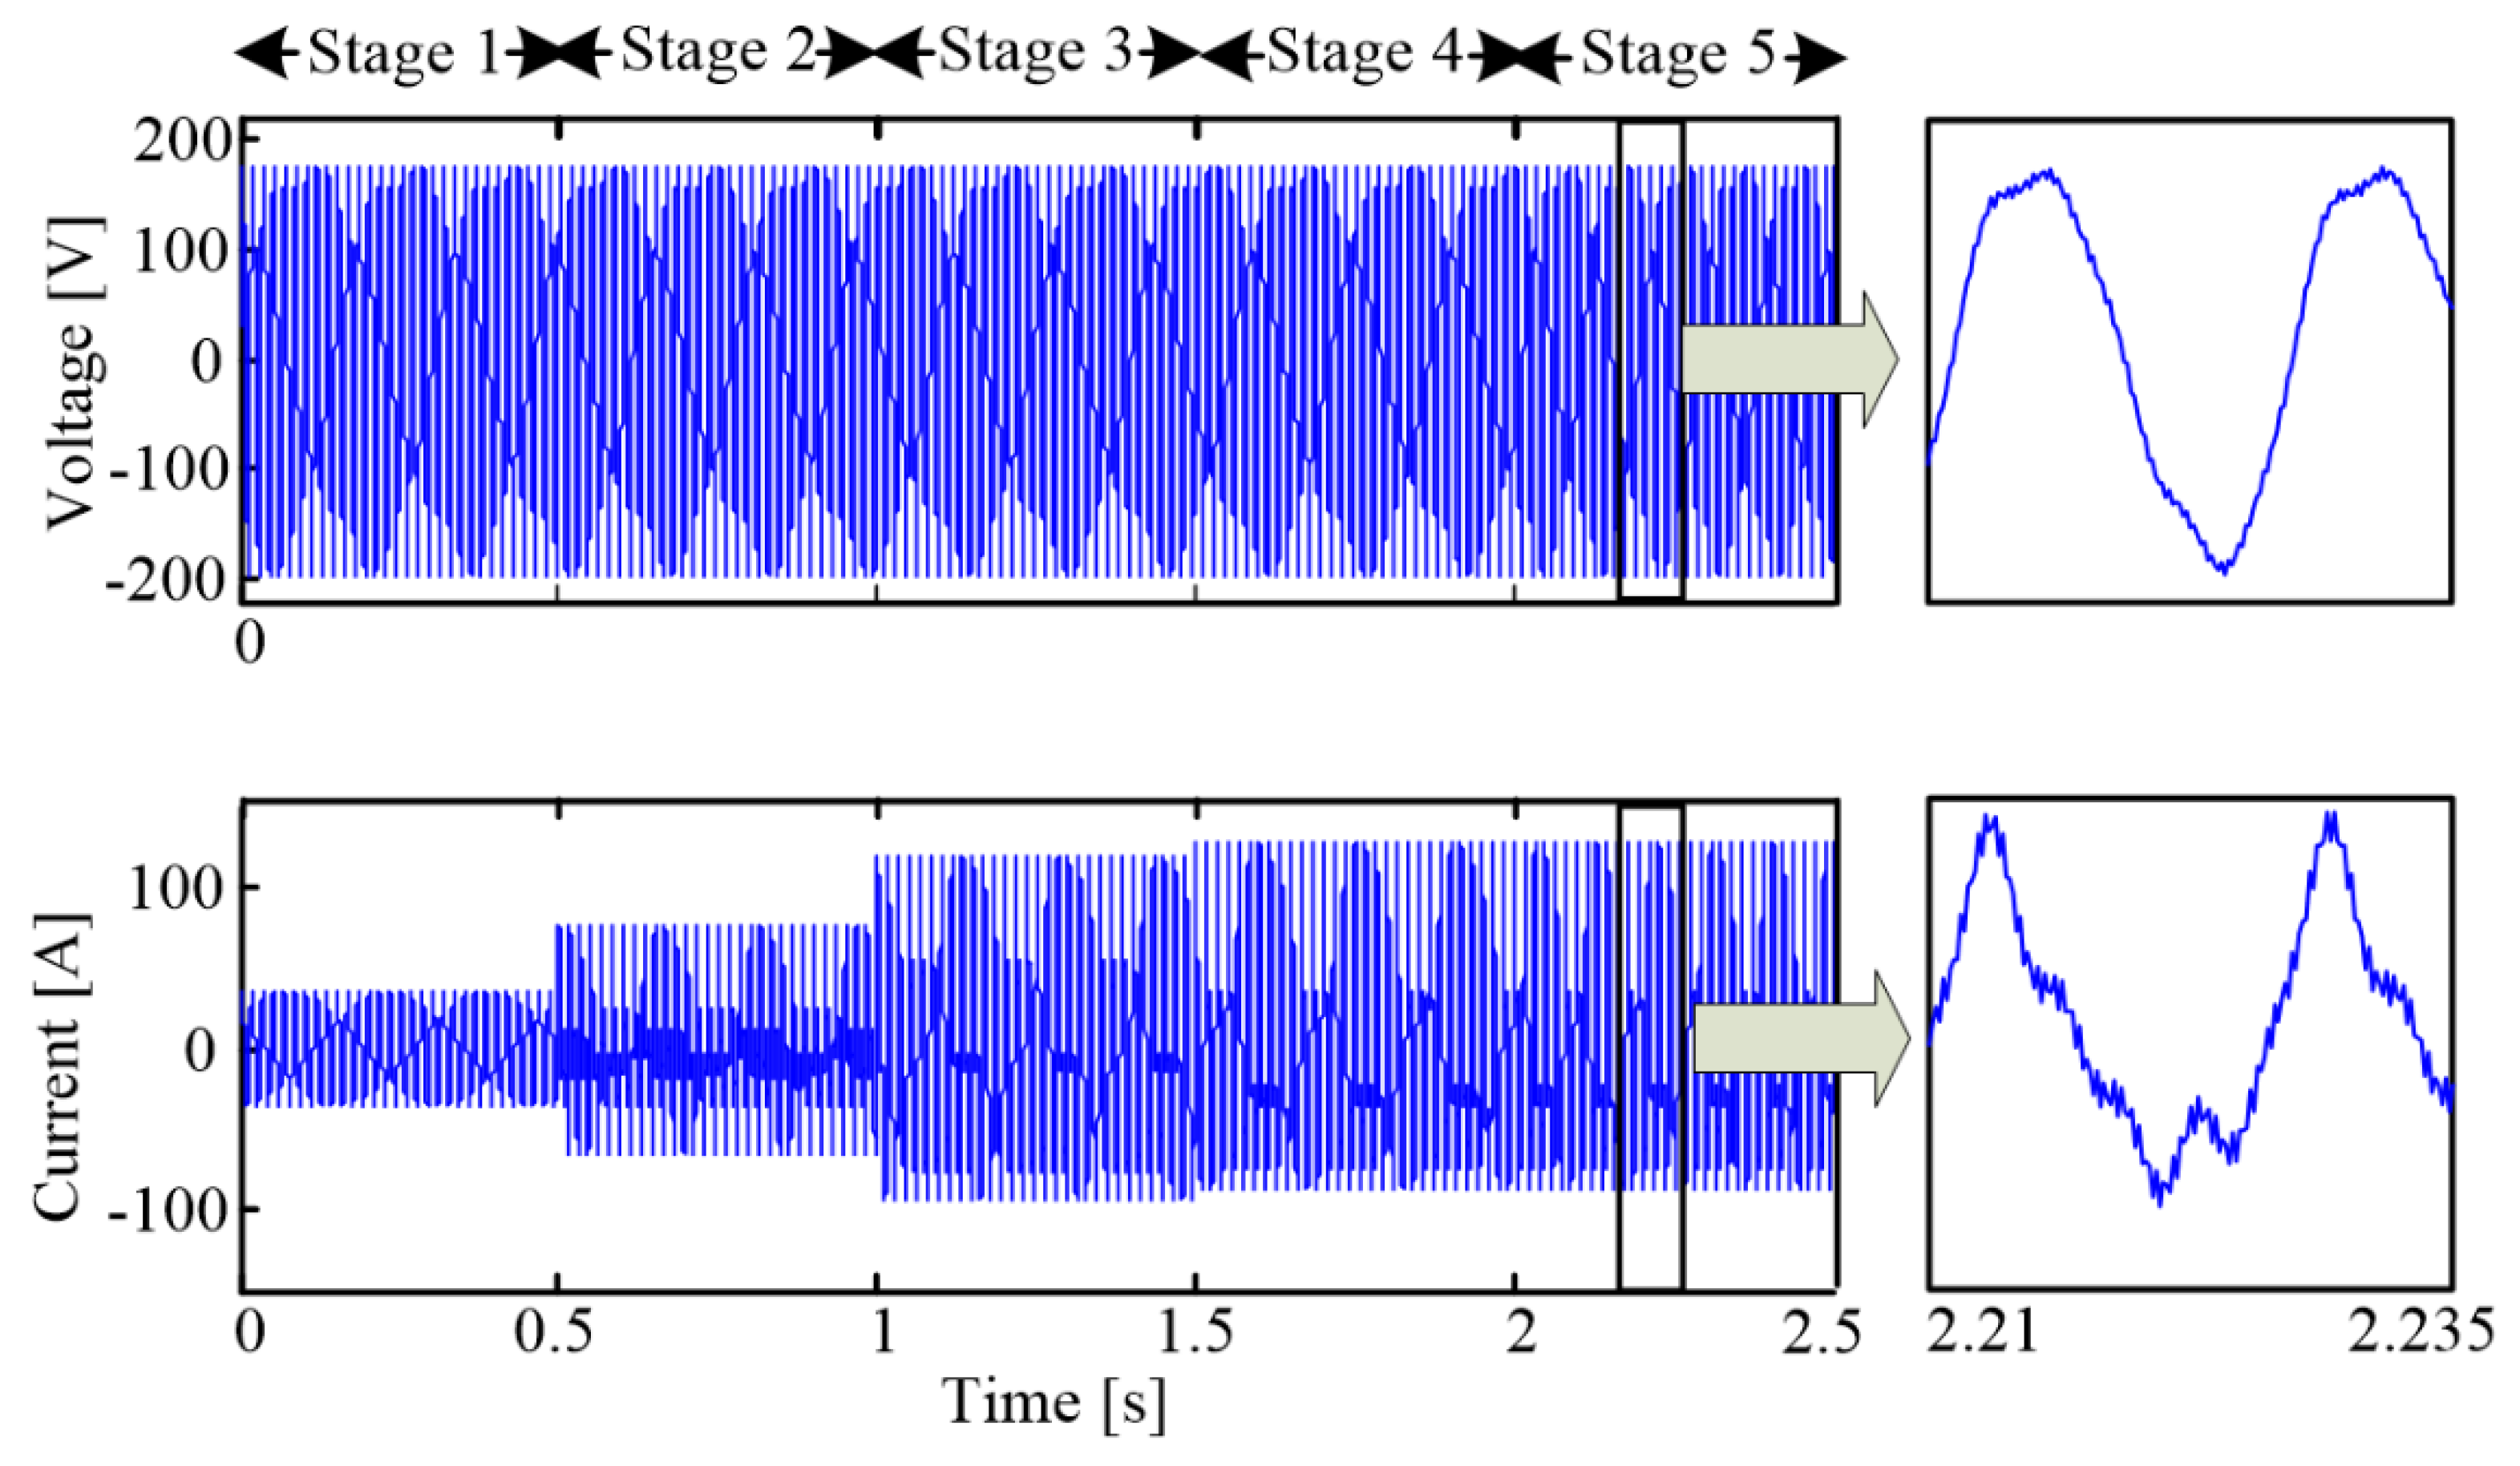
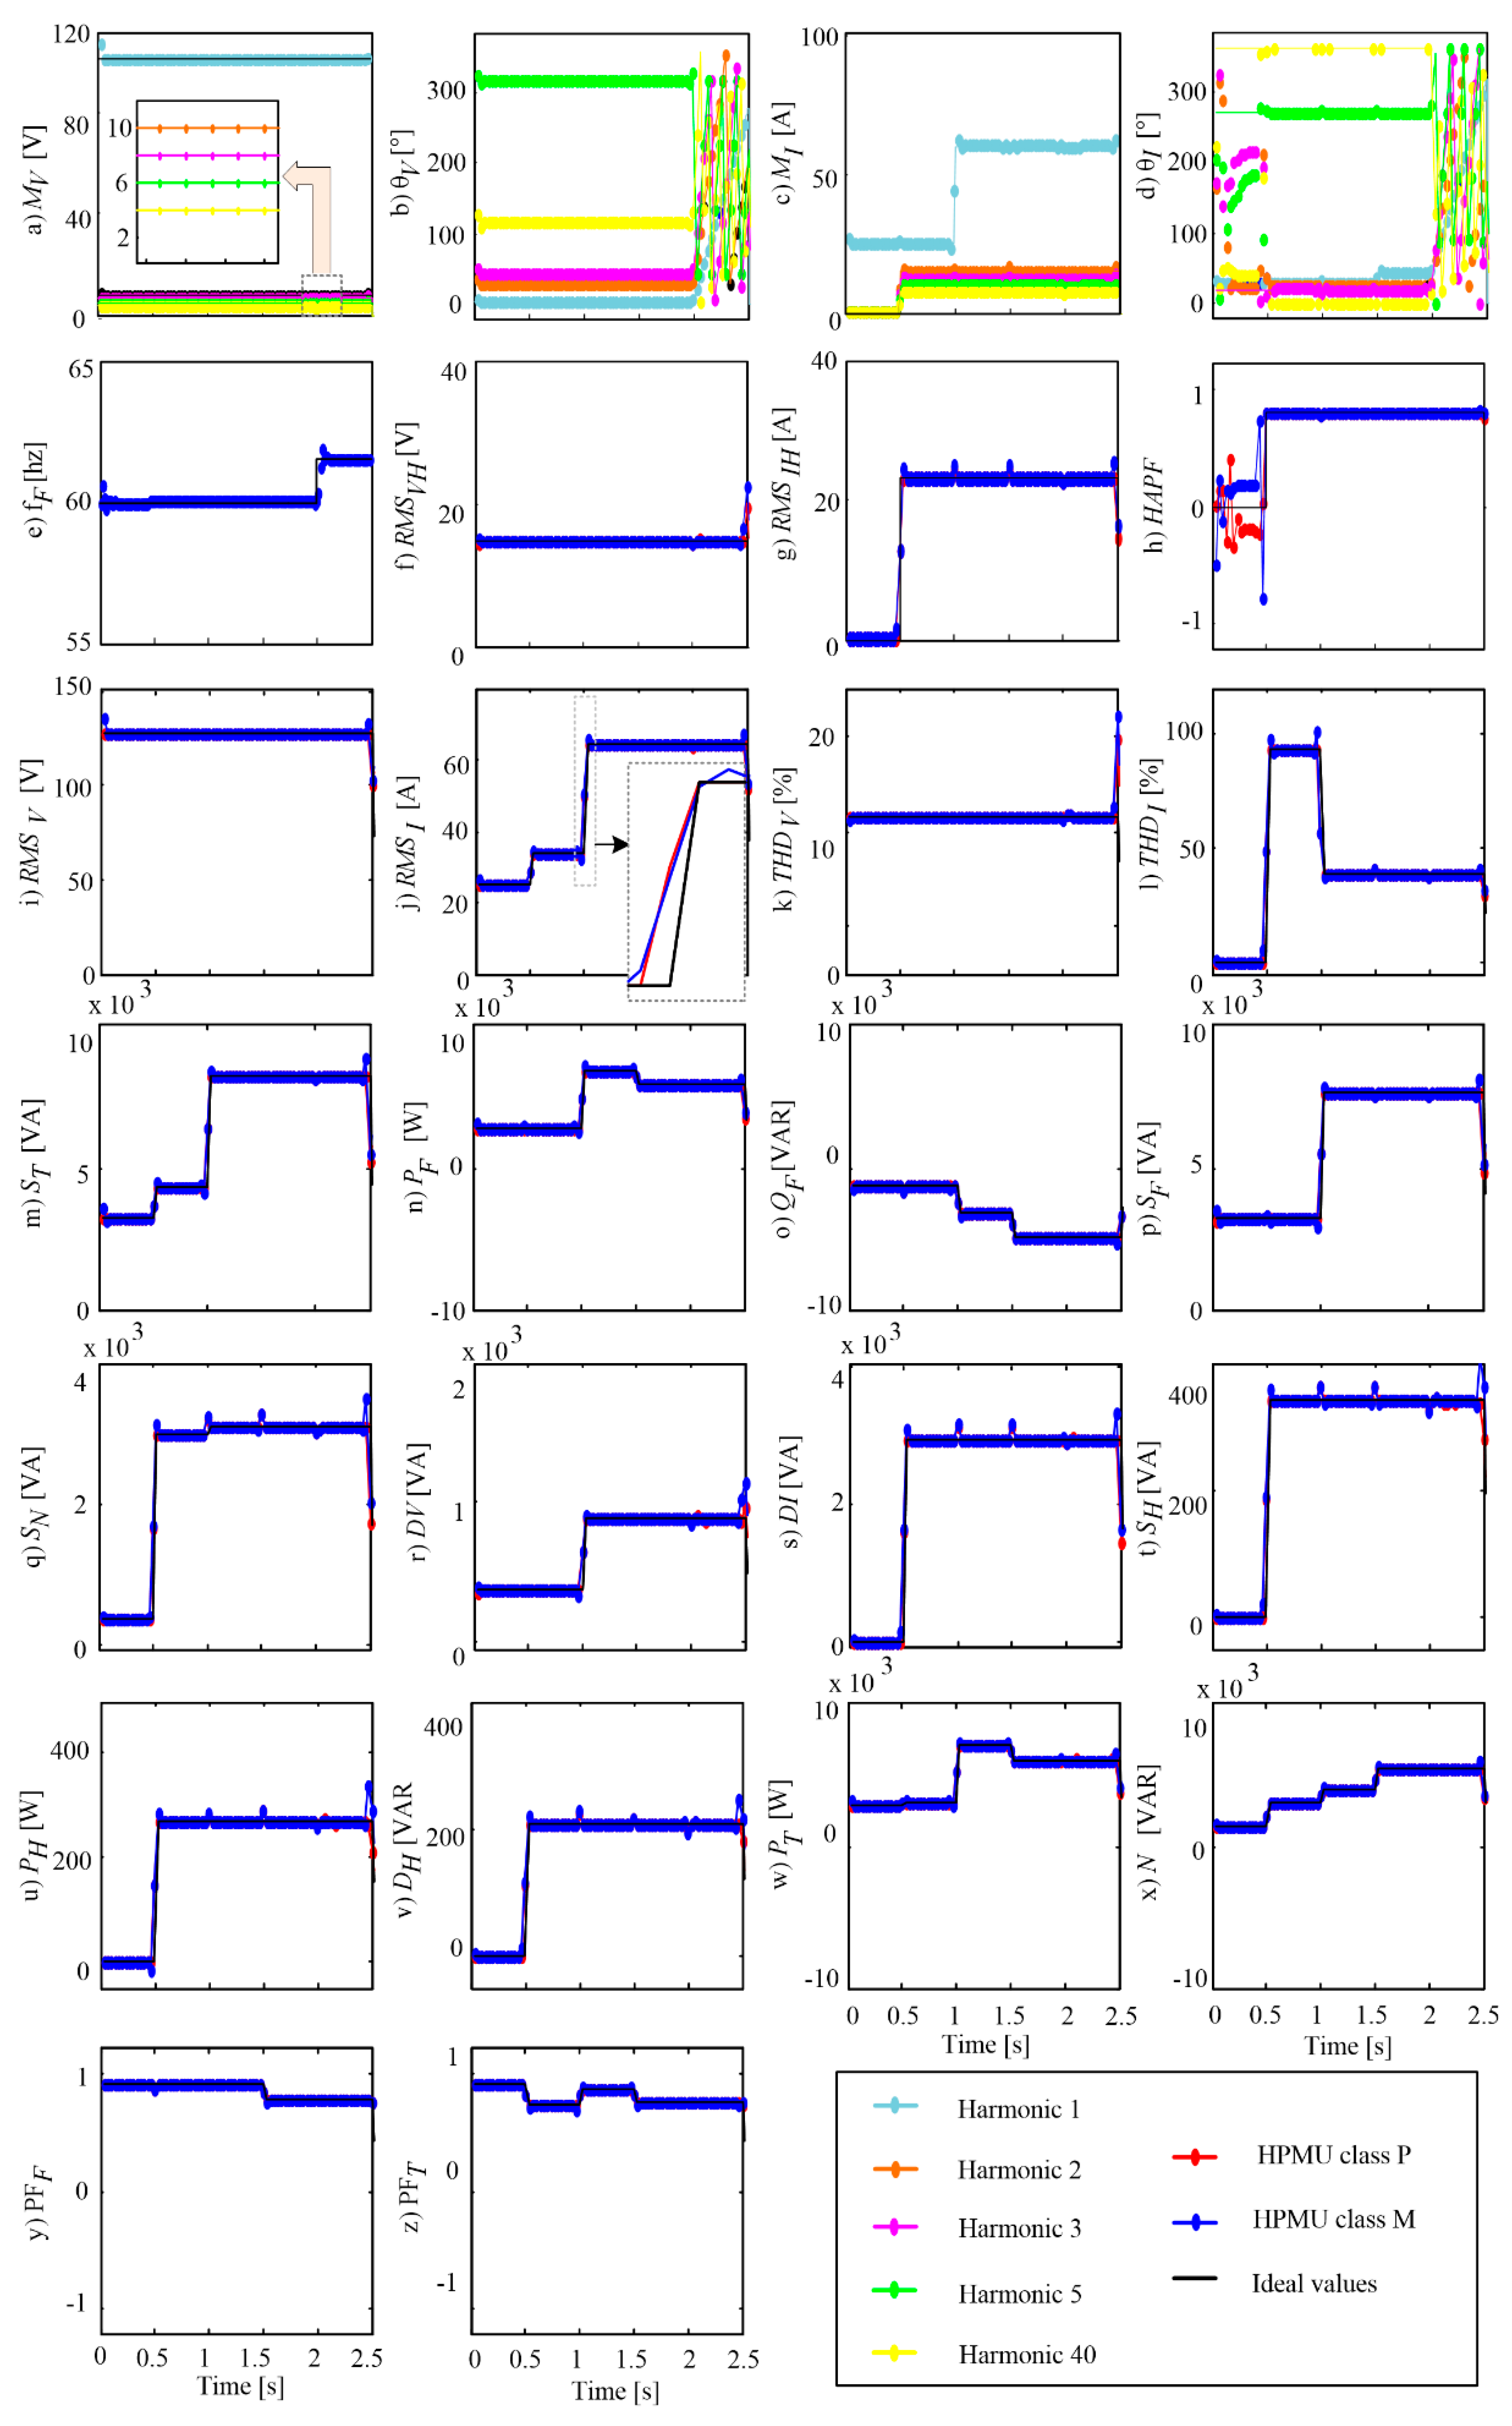
4.2. Study Case 2: Synthetic Signals

In order to observe the performance of the proposal for time-variant signals, this study case is carried out. The experiment consists of five staged signals. Each staged signal is specified by distinct values of magnitude, frequency, and phase for the fundamental and harmonics components. These staged signals are given by:
v ( t ) = i = 1 5 v S i ( t ) [ u ( t t i 1 ) u ( t t i ) ]
i ( t ) = i = 1 5 i S i ( t ) [ u ( t t i 1 ) u ( t t i ) ]
where u(t) is the unit step, and ti−1 and ti for i = 1, 2,…, 5 are the times where each stage begins and ends, respectively; for t0, the time is 0 s. v S i and i S i are the voltage and current signals for each stage Si, which are given by Equations (2) and (3) with H = 40 (i.e., the signal contains the fundamental component and up to the fortieth harmonic). The numerical values for each frequency component at each stage i are presented in Table 4.
From these values, the signals shown in Figure 4 are generated.
The performance of the proposed approach is tested using both P-class and M-class PMU types, where FS_report = 60 fps and Fsampling = 6000 Hz are used. For the P-class filter, it corresponds to NSPC = 100 and M = 198; for the M-class filter, it corresponds to Ffr = 8.19 Hz and M = 1024. For both PQI formulations, 50 harmonic components are considered [21]. The overall methodology is implemented in MATLAB software. The results of the proposal are shown in Figure 5.
In the figure, the ideal values (black lines) and the obtained results using the filters for P-class (red lines) and M-class (blue lines) PMUs are presented. The dots indicate the data per frame. PMU results for magnitude and phase of harmonic component of voltage and current are depicted in Figure 5a–d, the fundamental frequency is shown in Figure 5e, and GHPs are depicted in Figure 5f–h. Additionally, Figure 5i–z shows the results for the estimation of PQIs using the PMU information and the formulation based on the proposal. From the results depicted in Figure 5, the following results can be mentioned. Firstly, the P-class algorithm has a faster response than the one for M-class in all scenarios. For example, for tracking of the magnitude of current, the red line (P-class) has a faster convergence than the blue line (M-class) shown in Figure 5j (zoomed area), which is expected since the P-class structure is intended for applications that require a fast response, such as protection and control tasks. For both classes, after the convergence time, the obtained results are very similar to the ideal values in all stages. It is worth noting that the existence of convergence time for step tests in PMUs is acceptable in the IEEE standard C37.118.1 [4]. Regarding the values based on the harmonic content, it is evident how the GHPs respond to the presence of harmonic content (i.e., zoomed area of Figure 5a). The same responses are observed for the PQIs that are in function of the harmonic content, e.g., THD, true RMS values, ST, PT.
The numerical results of this study case are presented in Table A1 and Table A2 in Appendix A. It should be noted that the presented results correspond to values in steady state. Five values are presented by stage and parameter in Table A1 and Table A2. These values are: (1) the ideal value, (2) the result obtained using P-class, (3) the result obtained using M-class, (4) the error between the ideal value and the value of P-class PMU, and (5) the error between the ideal value and the value of M-class PMU. For the error values, the relative error, %EPMU-class, is used. This is:
% E P M U c l a s s = | ( V E s t i m a t e d V I d e a l ) / V I d e a l | · 100 %
where VEstimated and VIdeal are the estimated and ideal values for each parameter, respectively. When the ideal value is zero, the absolute error, EPMU-class, is computed as:
E P M U c l a s s = | V E s t i m a t e d V I d e a l |
Several aspects can be commented on regarding the results presented in Table A1. Firstly, errors less than 6.0 × 10⁻²% are obtained for the fundamental phasor results (Mv1, Fv1, Mi1, and Fi1), which corresponds to stage 5 for fundamental magnitude estimation of the current (Mi1) using P-class PMU, where the frequency suffers a change from 60 to 61.5 Hz. Likewise, the estimations of harmonic parameters have errors lesser than 1.5% (i.e., Mv5) except for phase estimation for the harmonic component magnitude equal to 0 that has absolute errors greater than 135.18° (i.e., Fi2 to Fi40 at stage 1); this is due to the result of arctan of the quotient formed by dividing small imaginary and real values with floating-point errors and quantization noise. Further, errors lesser than 0.46% are obtained for the GHPs (RMSHV, RMSHI, and HAPF).
Finally, regarding Table A2, PQIs present proportional errors to the ones obtained previously because they depend on the results of the used PMU. It is worth noting that the largest errors of voltage RMSV, current RMSI, and real power PT, i.e., 1.5 × 10⁻⁴%, 5.7 × 10⁻⁴%, and 1.4 × 10⁻³% for M-class algorithm, respectively, and 1.1 × 10⁻⁵%, 2.1 × 10⁻⁵%, 5.7 × 10⁻⁵% for P-class algorithm, respectively, satisfy the limit errors established by IEC 61000-4-7 [22] for an instrument of Class I. These limits correspond to ±5%, ±5%, and ±1% for V, I, and real power, respectively.
In general, the obtained results demonstrate that the proposal allows estimating the phasor parameters of the fundamental components with high accuracy. In addition to that, the proposed GHPs are proven to be capable of providing information about the harmonic content. Moreover, the capacity of estimating different PQIs with only the information provided by the proposed PMU makes the proposal a suitable and reliable tool for applications that require information on these parameters.

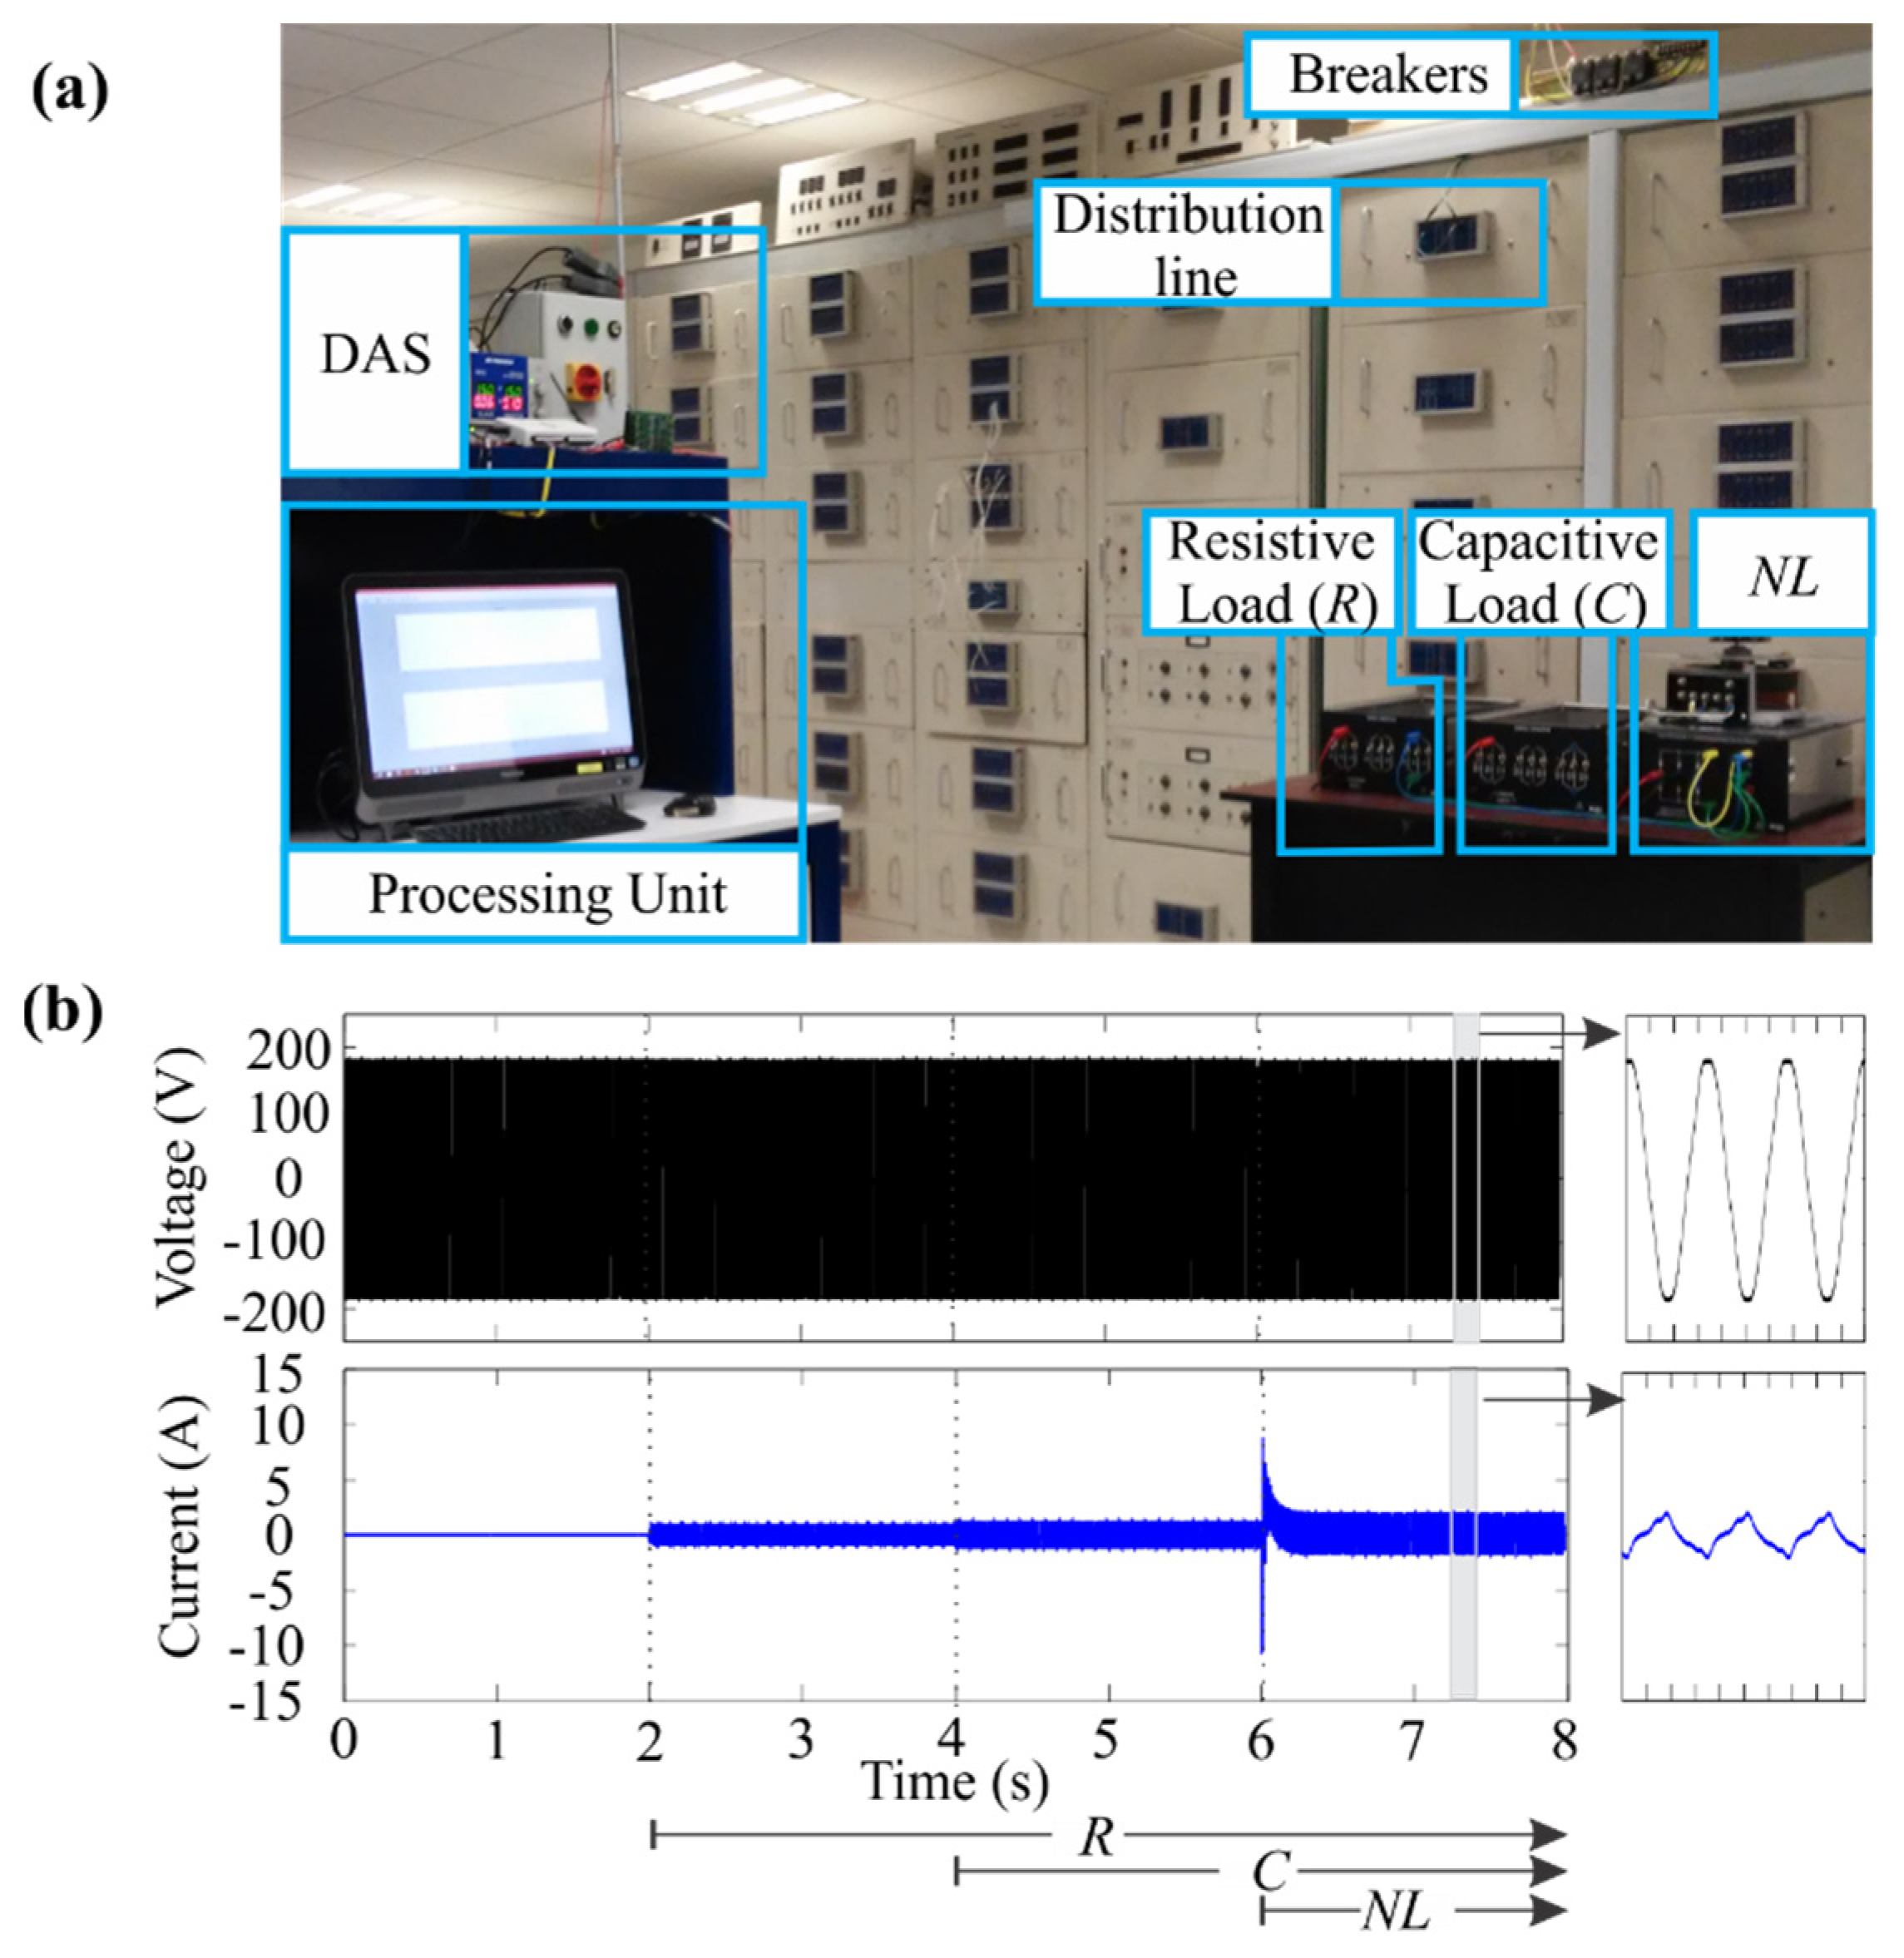
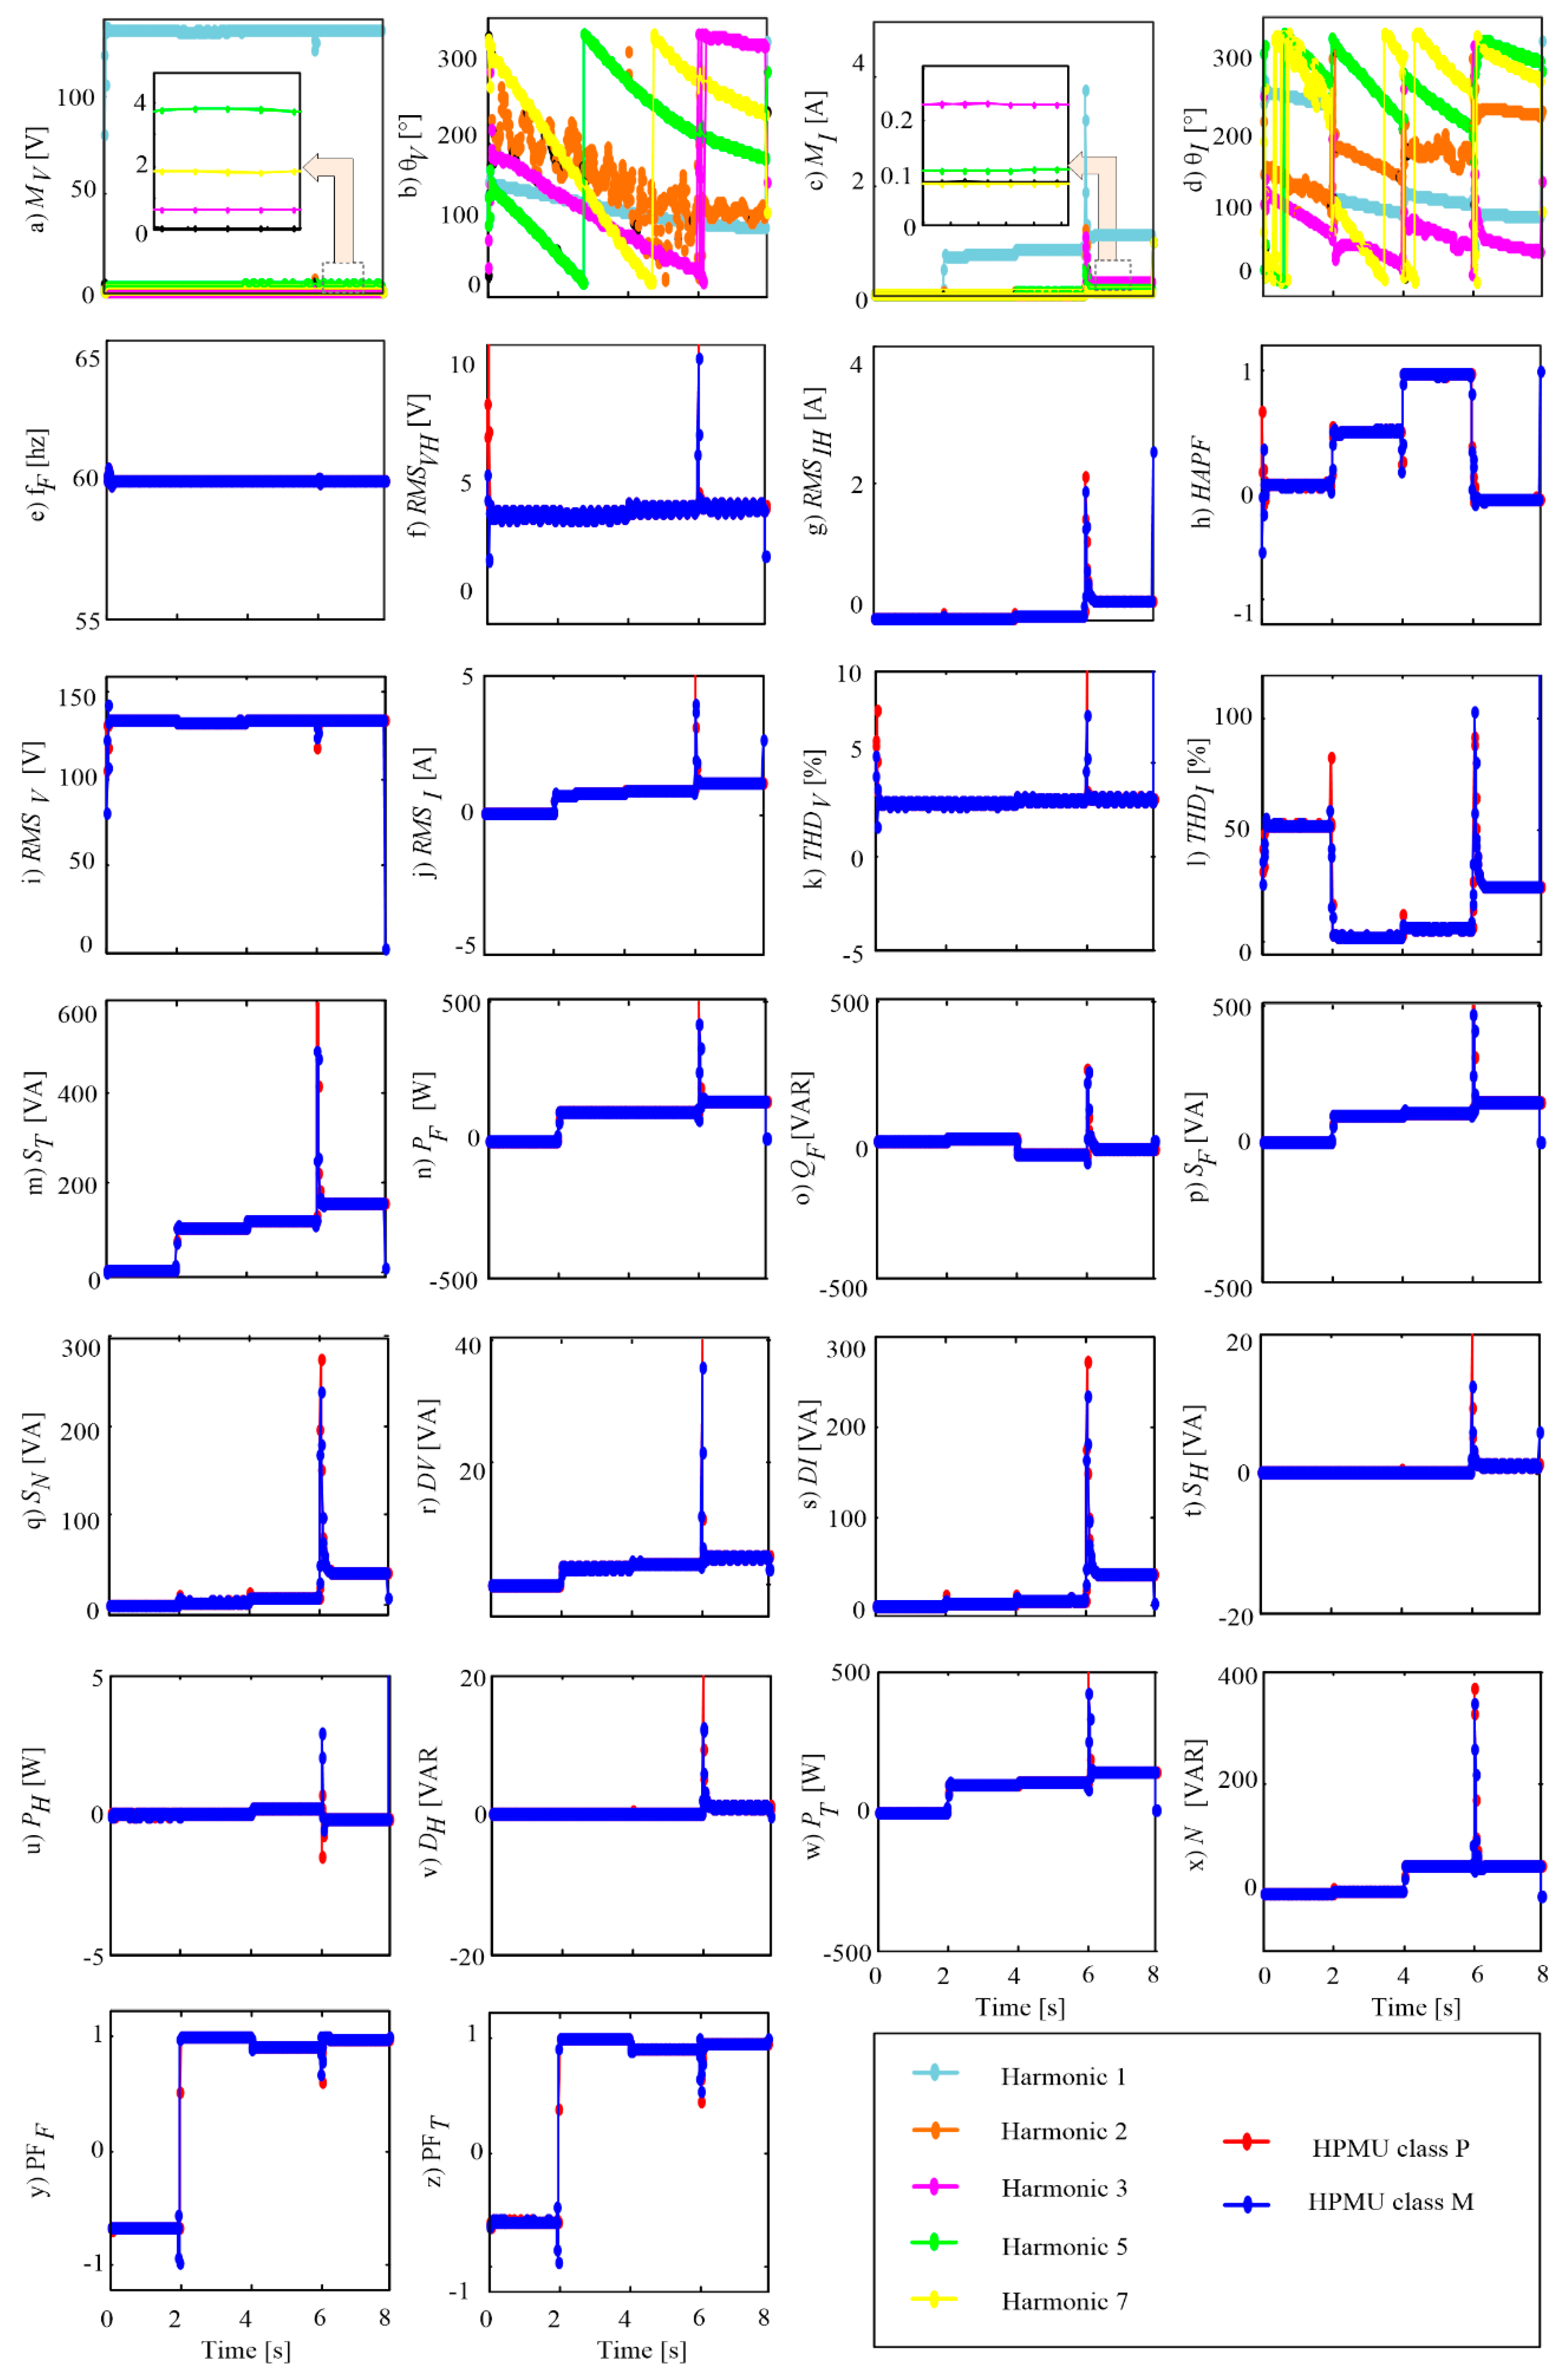
4.3. Study Case 3: Real Signals

For the case of real signals, the experimental setup used is shown in Figure 6a. In order to have several scenarios, different electric loads are considered. First, a voltage source of 127 V at 60 Hz is used, which feeds a simulated distribution line (DL) of 100 m. It is composed of a resistance of RDL = 2.752 Ω and an inductance of LDL = 1.485 H, which are obtained from a transient network analyzer (TNA) equipment. In the DL, there are three electric loads: a resistive load, R = 300 Ω, a capacitive load, C = 8.88 μF, and a nonlinear load (NL) composed of an autotransformer connected to both a rectifier bridge with a capacitor of 210 μF for filtering and a resistor of 300 Ω as load. These loads are consecutively connected by means of three breakers of solid state (model SAP4050D), at 1.5, 3, and 4.5 s in a test that lasts 6 s. Figure 6b shows both the behavior of the voltage and current signals for the aforementioned electric circuit and the activation times of the loads (R, C, NL). The current signal is sensed using a Fluke i200 s clamp. A voltage divider array using metal–film resistors is used for voltage sensing. In addition to that, an anti-aliasing low-pass Butterworth filter of second order with a cutoff frequency of 3 kHz is used. For data acquisition system, a NI USB-6211 of National Instruments with analogic to digital converters of 16 bits is used.
The obtained results using the proposal for the signals depicted in Figure 6b are shown in Figure 7. In particular, the PMU results for fundamental voltage, fundamental current, and GHPs are depicted in Figure 7a–h. Figure 7i–z shows the results for the PQIs, which are estimated using both options. This study case demonstrates the applicability of the proposal to detect changes in fundamental phasors and harmonic content in the voltage and current signals associated with the usage of common electric loads, which are more numerous in modern power systems. From these results, a more realistic scenario of the state of the power system can also be obtained; for instance, at the time of 7 s in Figure 7d (green areas), SF is equal to 147.3 VA and ST is equal to 152 VA. SF is obtained with the traditional information of a PMU (fundamental phasors), whereas ST also considers the harmonic contents. Another example is QF, which is equal to 35.01 VAR, whereas QT is equal to 35.51 VAR. In addition to that, harmonic behavior can be observed thanks to both the proposed GHPs and the PQIs that depend on harmonic content such as the THDI (Figure 7l), which reaches a value of 25.51% at 7 s.
It is worth noting that the aforementioned information is not possible with conventional PMU information. An advantage of the proposal using the second option (GHPs and fundamental phasor information) is the reduced amount of data and the computational burden required for knowing the harmonic content of a signal, which has a positive impact in applications related to the estimation of PQIs. As an example, in the assessment of some PQIs, the information (magnitudes and phase angles) of 50 harmonic components for both voltage and current signals, i.e., 200 parameters, is required per frame (i.e., each 60 fps) in single-phase systems. By contrast, the obtained results show that the same PQIs can be obtained with only seven parameters (RMSVF, θVF, RMSIF, θIF, RMSHV, RMSHI, and HAPF) per frame. In this regard, the amount of data and requirements of management, storage, and analysis are noticeably reduced by 96.5%. On the other hand, the knowledge of PQIs and electric power quantities in a PMU context may lead to improvements in the analysis and performance of power systems.

5. Conclusions

In this work, an algorithm for the estimation of harmonic components using HPMUs is proposed. In order to satisfy the requirements established for PMUs in the IEEE standard C37.118.1, the phasor estimation algorithms provided by the standard, P-class, and M-class models are used as a basis for the proposal. Moreover, the mathematical formulation for PQIs and electric power quantities using the proposal is also presented. PQIs are computed with the information provided by the proposal using two options; the former could be useful for applications that require the amplitude and phase of each harmonic, while the latter uses GHPs to reduce the communication and computation burden. The concept of GHPs (RMSHV, RMSHI, and HAPF) is introduced in this work as unified quantities that provide information about the overall harmonic content in the voltage and current signals. Therefore, conventional PMUs could provide information similar to power quality analyzers, increasing their capabilities and the number of applications such as harmonic mitigation and control. Additionally, other algorithms designed for HPMUs or harmonic estimation can be used with the proposed GHPs for obtaining PQIs.
For validation purposes, synthetic signals of voltage and current signals with variations in magnitude, phase, frequency, and harmonic content are used, where errors less than 6.0 × 10⁻⁴% and 0.2% for fundamental phasors and GHPs are obtained, respectively. In this regard, the error values of voltage, current, and real power presented in Table A2 are within the limits defined for Class I instruments established by IEC 61000-4-7. On the other hand, the proposal is also tested under real operating conditions using a DL and different electrical loads and linear and nonlinear loads. This study case demonstrates that the proposal gives a more real scenario about the state of the power system since information related to fundamental components and harmonic content is given.

Funding

This research received no external funding.

Acknowledgments

I would like to thank my colleagues Martin Valtierra-Rodriguez and Sohail Khan from Autonomous University of Queretaro and National Autonomous University of Mexico, respectively, for writing assistance and doing grammatical corrections in the manuscript that greatly improved the manuscript. The author thanks the National Technological Institute of Mexico (TNM)/Higher Technological Institute of Irapuato (ITESI) and National Council of Science and Technology (CONACYT) for supporting my research and projects leading to the writing of the present paper.

Conflicts of Interest

The author declares no conflict of interest.

Appendix A

Table A1. Numerical results of harmonic phasor measurement unit (HPMU) for synthetic signals.
Phasor Harmonic Components (Option 1: Magnitude and Phase of Each Harmonic for h = 1 to 50)
Stage 1Stage 2Stage 3Stage 4Stage 5
Ideal, P-Class, M-Class
EP-class, EM-class
Ideal, P-Class, M-Class
EP-class, EM-class
Ideal, P-Class, M-Class
EP-class, EM-class
Ideal, P-Class, M-Class
EP-class, EM-class
Ideal, P-Class, M-Class
EP-class, EM-class
Mv1127.0, 127.000, 127.001,
4.3 × 10⁻⁶, 8.0 × 10⁻⁴
127.0, 127.000, 127.001,
1.8 × 10⁻⁹, 8.0 × 10⁻⁴
127.0, 127.000, 127.001,
8.7 × 10⁻¹¹, 8.0 × 10⁻⁴
127.0, 127.000, 127.001,
6.3 × 10⁻¹², 8.0 × 10⁻⁴
127.0, 126.989, 127.001,
8.9 × 10⁻³, 5.2 × 10⁻⁴
Mv210.0, 10.000, 10.001,
2.9 × 10⁻⁴, 1.3 × 10⁻²
10.0, 10.000, 10.001,
1.7 × 10⁻⁷, 1.3 × 10⁻²
10.0, 10.000, 10.001,
8.4 × 10⁻⁹, 1.3 × 10⁻²
10.0, 10.000, 10.001,
6.5 × 10⁻¹⁰, 1.3 × 10⁻²
10.0, 9.908, 10.009,
9.2 × 10⁻¹, 8.7 × 10⁻²
Mv38.0, 8.000, 7.999,
9.6 × 10⁻⁴, 8.1 × 10⁻³
8.0, 8.000, 7.999,
7.3 × 10⁻⁷, 9.0 × 10⁻³
8.0, 8.000, 7.999,
3.6 × 10⁻⁸, 9.0 × 10⁻³
8.0, 8.000, 7.999,
1.8 × 10⁻⁹, 9.0 × 10⁻³
8.0, 8.085, 8.000,
1.1, 2.4 × 10⁻³
Mv56.0, 6.000, 6.000,
7.8 × 10⁻⁴, 2.5 × 10⁻⁶
6.0, 6.000, 6.000,
5.2 × 10⁻⁷, 1.4 × 10⁻⁶
6.0, 6.000, 6.000,
2.5 × 10⁻⁸, 1.4 × 10⁻⁶
6.0, 6.000, 6.000,
1.3 × 10⁻⁹, 1.4 × 10⁻⁶
6.0, 5.912, 6.000,
1.5, 2.1 × 10⁻³
Mv404.0, 4.000, 4.000,
2.4 × 10⁻⁵, 1.5 × 10⁻⁴
4.0, 4.000, 4.000,
1.1 × 10⁻⁹, 6.1 × 10⁻⁷
4.0, 4.000, 4.000,
1.0 × 10⁻¹⁰, 6.1 × 10⁻⁷
4.0, 4.000, 4.000,
1.7 × 10⁻¹⁰, 6.1 × 10⁻⁷
4.0, 4.000, 4.000,
3.9 × 10⁻³, 5.8 × 10⁻³
Fv15.0, 5.000, 5.000,
4.3 × 10⁻³, 2.5 × 10⁻³
5.0, 5.000, 5.000,
2.1 × 10⁻⁶, 5.3 × 10⁻⁴
5.0, 5.000, 5.000,
1.0 × 10⁻⁷, 5.3 × 10⁻⁴
5.0, 5.000, 5.000,
4.9 × 10⁻⁹, 5.3 × 10⁻⁴
139.91, 139.880, 139.91,
2.1 × 10⁻², 3.1 × 10⁻⁴
Fv230.0, 30.001, 29.997,
3.0 × 10⁻³, 8.6 × 10⁻³
30.0, 30.000, 29.997,
7.6 × 10⁻⁷, 9.0 × 10⁻³
30.0, 30.000, 29.997,
3.9 × 10⁻⁸, 9.0 × 10⁻³
30.0, 30.000, 29.997,
1.8 × 10⁻⁹, 9.0 × 10⁻³
299.82, 300.024, 299.84,
6.8 × 10⁻², 6.2 × 10⁻³
Fv345.0, 45.001, 45.004,
1.2 × 10⁻³, 9.8 × 10⁻³
45.0, 45.000, 45.004,
1.2 × 10⁻⁶, 8.8 × 10⁻³
45.0, 45.000, 45.004,
5.8 × 10⁻⁸, 8.8 × 10⁻³
45.0, 45.000, 45.004,
2.8 × 10⁻⁹, 8.8 × 10⁻³
89.73, 89.859, 89.726,
1.4 × 10⁻¹, 4.6 × 10⁻³
Fv5315.0, 314.999, 314.998,
2.8 × 10⁻⁴, 5.3 × 10⁻⁴
315.0, 315.000, 314.999,
1.2 × 10⁻⁷, 4.3 × 10⁻⁴
315.0, 315.000, 314.999,
5.9 × 10⁻⁹, 4.3 × 10⁻⁴
315.0, 315.000, 314.999,
2.8 × 10⁻¹⁰, 4.3 × 10⁻⁴
269.55, 269.265, 269.547,
1.1 × 10⁻¹, 1.2 × 10⁻³
Fv40115.0, 114.992, 114.999,
7.2 × 10⁻³, 2.0 × 10⁻³
115.0, 115.000, 115.000,
4.5 × 10⁻⁶, 1.3 × 10⁻⁶
115.0, 115.000, 115.000,
4.0 × 10⁻⁸, 7.9 × 10⁻⁸
115.0, 115.000, 115.000,
1.4 × 10⁻⁹, 6.5 × 10⁻⁸
111.4, 111.413, 111.376,
1.2 × 10⁻², 2.2 × 10⁻²
Mi125.0, 25.000, 25.000,
3.6 × 10⁻⁵, 4.4 × 10⁻⁴
25.0, 25.000, 25.000,
1.6 × 10⁻⁸, 7.0 × 10⁻⁴
60.0, 60.000, 60.000,
1.1 × 10⁻⁹, 5.6 × 10⁻⁴
60.0, 60.000, 60.000,
6.3 × 10⁻¹¹, 1.8 × 10⁻⁴
60.0, 59.964, 60.001,
6.0 × 10⁻², 1.1 × 10⁻³
Mi20.0, 0.000, 0.000,
4.5 × 10⁻⁵, 2.5 × 10⁻⁴
15.0, 15.000, 15.000,
2.3 × 10⁻⁸, 2.4 × 10⁻³
15.0, 15.000, 15.001,
3.5 × 10⁻⁹, 4.7 × 10⁻³
15.0, 15.000, 15.001,
2.7 × 10⁻¹⁰, 4.3 × 10⁻³
15.0, 14.998, 15.002,
1.0 × 10⁻², 1.4 × 10⁻²
Mi30.0, 0.000, 0.000,
3.3 × 10⁻⁵, 1.9 × 10⁻⁴
12.5, 12.500, 12.500,
4.7 × 10⁻⁸, 2.2 × 10⁻⁴
12.5, 12.500, 12.500,
8.4 × 10⁻⁹, 2.2 × 10⁻³
12.5, 12.500, 12.500,
6.3 × 10⁻¹⁰, 1.9 × 10⁻³
12.5, 12.485, 12.501,
1.2 × 10⁻¹, 7.1 × 10⁻³
Mi50.0, 0.000, 0.000,
6.6 × 10⁻⁶, 1.0 × 10⁻⁵
10.0, 10.000, 10.000,
3.5 × 10⁻⁷, 5.6 × 10⁻⁴
10.0, 10.000, 10.000,
2.0 × 10⁻⁸, 5.8 × 10⁻⁴
10.0, 10.000, 10.000,
8.8 × 10⁻¹⁰, 5.6 × 10⁻⁴
10.0, 10.000, 10.000,
2.0 × 10⁻³, 1.6 × 10⁻³
Mi400.0, 0.000, 0.000,
2.6 × 10⁻⁶, 7.0 × 10⁻⁶
7.5, 7.500, 7.500,
1.5 × 10⁻⁸, 2.2 × 10⁻⁷
7.5, 7.500, 7.500,
3.3 × 10⁻¹⁰, 2.2 × 10⁻⁷
7.5, 7.500, 7.500,
2.9 × 10⁻¹¹, 1.2 × 10⁻⁷
7.5, 7.500, 7.501,
4.2 × 10⁻³, 6.1 × 10⁻³
Fi130.0, 30.000, 30.000,
7.0 × 10⁻⁴, 1.5 × 10⁻³
30.0, 30.000, 30.000,
2.7 × 10⁻⁷, 1.3 × 10⁻³
30.0, 30.000, 30.000,
1.5 × 10⁻⁸, 1.2 × 10⁻³
45.0, 45.000, 45.000,
4.4 × 10⁻¹⁰, 1.0 × 10⁻³
179.91, 179.918, 179.909,
4.6 × 10⁻³, 8.1 × 10⁻⁴
Fi20.0, 141.850, 26.827,
141.850, 26.827
25.0, 25.000, 25.000,
3.9 × 10⁻⁷, 7.9 × 10⁻⁵
25.0, 25.000, 25.000,
5.5 × 10⁻⁹, 1.5 × 10⁻⁴
25.0, 25.000, 25.000,
3.3 × 10⁻¹⁰, 1.5 × 10⁻³
294.82, 294.807, 294.832,
4.4 × 10⁻³, 3.9 × 10⁻³
Fi30.0, 136.730, 210.995,
136.730, 210.995
20.0, 20.000, 20.000,
5.8 × 10⁻⁷, 7.4 × 10⁻⁴
20.0, 20.000, 20.000,
5.7 × 10⁻⁹, 1.2 × 10⁻³
20.0, 20.000, 19.999,
8.7 × 10⁻¹¹, 3.7 × 10⁻³
64.73, 64.714, 64.731,
2.5 × 10⁻², 8.7 × 10⁻⁴
Fi50.0, 135.180, 168.677,
135.180, 168.677
270.0, 270.000, 269.999,
1.8 × 10⁻⁷, 3.8 × 10⁻⁴
270.0, 270.000, 269.999,
9.5 × 10⁻⁹, 4.1 × 10⁻⁴
270.0, 270.000, 269.999,
4.8 × 10⁻¹⁰, 4.0 × 10⁻⁴
224.55, 224.586, 224.548,
1.6 × 10⁻², 1.0 × 10⁻³
Fi400.0, 174.440, 49.656,
174.440, 49.656
0.0, 0.000, 0.001,
5.4 × 10⁻⁷, 6.4 × 10⁻⁴
0.0, 0.000, 0.001,
2.7 × 10⁻⁸, 6.9 × 10⁻⁴
0.0, 0.000, 0.001,
1.4 × 10⁻⁹, 7.1 × 10⁻⁴
356.4, 356.418, 356.3797,
5.0 × 10⁻³, 5.7 × 10⁻³
frec60.0, 59.999, 59.999,
1.0 × 10⁻³, 1.0 × 10⁻³
60.0, 60.000, 60.000,
9.6 × 10⁻⁷, 9.6 × 10⁻⁷
60.0, 60.000, 60.000,
4.7 × 10⁻⁸, 4.7 × 10⁻⁸
60.0, 60.000, 60.000,
2.2 × 10⁻⁹, 2.2 × 10⁻⁹
61.50, 61.502, 61.502,
3.4 × 10⁻³, 3.4 × 10⁻³
Global harmonic parameters (Option 2: GHP with fundamental parameters Mv1, Mi1, Fv1 and Fi1)
RMSHV14.697, 14.697, 14.697,
3.3 × 10⁻⁴, 3.8 × 10⁻³
14.697, 14.697, 14.697,
2.3 × 10⁻⁷, 3.4 × 10⁻³
14.697, 14.697, 14.697,
1.1 × 10⁻⁸, 3.4 × 10⁻³
14.697, 14.697, 14.697,
6.8 × 10⁻¹⁰, 3.4 × 10⁻³
14.697, 14.629, 14.703,
4.6 × 10⁻¹, 4.1 × 10⁻²
RMSHI0.0, 0.000, 0.000,
5.7 × 10⁻⁵, 3.2 × 10⁻⁴
23.184, 23.184, 23.184,
5.9 × 10⁻⁸, 1.0 × 10⁻³
23.184, 23.184, 23.184,
6.1 × 10⁻⁹, 1.4 × 10⁻³
23.184, 23.184, 23.184,
4.0 × 10⁻¹⁰, 1.4 × 10⁻³
23.184, 23.175, 23.186,
3.8 × 10⁻², 8.3 × 10⁻³
HAPF0.0, −0.250, 0.198,
2.5 × 10⁻¹, 2.0 × 10⁻¹
0.792, 0.792, 0.792,
2.2 × 10⁻⁷, 4.3 × 10⁻⁴
0.792, 0.792, 0.792,
9.5 × 10⁻⁹, 5.2 × 10⁻⁴
0.792, 0.792, 0.792,
5.3 × 10⁻¹⁰, 4.0 × 10⁻⁴
0.792, 0.792, 0.792,
3.9 × 10⁻², 1.1 × 10⁻²
Table A2. Numerical results of PQIs for synthetic signals.
PQIs for Both Option
Stage 1Stage 2Stage 3Stage 4Stage 5
Ideal, P-Class, M-Class
EP-class, EM-class
Ideal, P-Class, M-Class
EP-class, EM-class
Ideal, P-Class, M-Class
EP-class, EM-class
Ideal, P-Class, M-Class
EP-class, EM-class
Ideal, P-Class, M-Class
EP-class, EM-class
RMSV127.848, 127.848, 127.849,
6.5 × 10⁻⁸, 8.4 × 10⁻⁴
127.848, 127.848, 127.849,
1.3 × 10⁻⁹, 8.4 × 10⁻⁴
127.848, 127.848, 127.849,
6.5 × 10⁻¹¹, 8.4 × 10⁻⁴
127.848, 127.848, 127.849,
3.1 × 10⁻¹², 8.4 × 10⁻⁴
127.848, 127.828, 127.849,
1.5 × 10⁻², 1.1 × 10⁻³
RMSI25.0, 25.000, 25.000,
3.6 × 10⁻⁵, 4.4 × 10⁻⁴
34.095, 34.095, 34.096,
3.6 × 10⁻⁸, 8.6 × 10⁻⁴
64.323, 64.323, 64.324,
1.7 × 10⁻⁹, 6.8 × 10⁻⁴
64.323, 64.323, 64.324,
1.1 × 10⁻¹⁰, 3.4 × 10⁻⁴
64.323, 64.287, 64.325,
5.7 × 10⁻², 2.1 × 10⁻³
THDV11.572, 11.572, 11.573,
3.3 × 10⁻⁴, 3.0 × 10⁻³
11.572, 11.572, 11.573,
2.3 × 10⁻⁷, 2.6 × 10⁻³
11.572, 11.572, 11.573,
1.2 × 10⁻⁸, 2.6 × 10⁻³
11.572, 11.572, 11.573,
6.8 × 10⁻¹⁰, 2.6 × 10⁻³
11.572, 11.520, 11.577,
4.6 × 10⁻¹, 4.1 × 10⁻²
THDI0.0, 0.000, 0.001,
2.3 × 10⁻⁴, 1.3 × 10⁻³
92.736, 92.736, 92.737,
4.3 × 10⁻⁸, 3.5 × 10⁻⁴
38.640, 38.640, 38.640,
5.1 × 10⁻⁹, 8.7 × 10⁻⁴
38.640, 38.640, 38.641,
3.3 × 10⁻¹⁰, 1.2 × 10⁻³
38.640, 38.649, 38.643,
2.2 × 10⁻², 7.1 × 10⁻³
ST3196.189, 3196.188, 3196.230,
3.6 × 10⁻⁵, 1.3 × 10⁻³
4359.021, 4359.021, 4359.095,
3.4 × 10⁻⁸, 1.7 × 10⁻³
8223.590, 8223.590, 8223.715,
1.6 × 10⁻⁹, 1.5 × 10⁻³
8223.590, 8223.590, 8223.687,
1.0 × 10⁻¹⁰, 1.2 × 10⁻³
8223.590, 8217.705, 8223.846,
7.2 × 10⁻², 3.1 × 10⁻³
PF2877.527, 2877.526, 2877.570,
4.4 × 10⁻⁵, 1.5 × 10⁻³
2877.527, 2877.527, 2877.579,
3.5 × 10⁻⁸, 1.8 × 10⁻³
6906.065, 6906.065, 6906.179,
1.6 × 10⁻⁹, 1.6 × 10⁻³
5837.259, 5837.259, 5837.354,
1.4 × 10⁻¹⁰, 1.6 × 10⁻³
5837.259, 5830.016, 5837.442,
1.2 × 10⁻¹, 3.1 × 10⁻³
QF−1341.813, −1341.813,
−1341.814,
−2.2 × 10⁻⁵, −4.5 × 10⁻⁵
−1341.813, −1341.813,
−1341.815,
−6.4 × 10⁻⁸, −1.5 × 10⁻⁴
−3220.351, −3220.351,
−3220.354,
−1.0 × 10⁻⁹, −9.6 × 10⁻⁵
−4898.042, −4898.042,
−4898.045,
−2.8 × 10⁻¹¹, −7.3 × 10⁻⁵
−4898.042, −4898.561,
−4898.019,
−1.1 × 10⁻², −4.6 × 10⁻⁴
SF3175, 3174.999, 3175.039,
4.0 × 10⁻⁵, 1.2 × 10⁻³
3175.0, 3175.000, 3175.048,
1.8 × 10⁻⁸, 1.5 × 10⁻³
7620.0, 7620.000, 7620.104,
1.1 × 10⁻⁹, 1.4 × 10⁻³
7620.0, 7620.000, 7620.075,
6.9 × 10⁻¹¹, 9.9 × 10⁻⁴
7620.0, 7614.787, 7620.126,
6.8 × 10⁻², 1.6 × 10⁻³
SN367.423, 367.425, 367.439,
2.9 × 10⁻⁴, 4.2 × 10⁻³
2986.710, 2986.710, 2986.767,
5.3 × 10⁻⁸, 1.9 × 10⁻³
3092.416, 3092.416, 3092.491,
4.7 × 10⁻⁹, 2.4 × 10⁻³
3092.416, 3092.416, 3092.488,
3.1 × 10⁻¹⁰, 2.3 × 10⁻³
3092.416, 3089.610, 3092.787,
9.1 × 10⁻², 1.2 × 10⁻²
DI0.0, 0.007, 0.040,
7.2 × 10⁻³, 4.0 × 10⁻²
2944.374, 2944.374, 2944.428,
6.1 × 10⁻⁸, 1.8 × 10⁻³
2944.374, 2944.374, 2944.440,
6.2 × 10⁻⁹, 2.2 × 10⁻³
2944.374, 2944.374, 2944.438,
4.0 × 10⁻⁹, 2.2 × 10⁻³
2944.374, 2943.005, 2944.633,
4.6 × 10⁻², 8.8 × 10⁻³
DV367.423, 367.425, 367.439,
2.9 × 10⁻⁴, 4.2 × 10⁻³
367.423, 367.423, 367.439,
2.2 × 10⁻⁷, 4.1 × 10⁻³
881.816, 881.816, 881.852,
1.0 × 10⁻⁸, 4.0 × 10⁻³
881.816, 881.816, 881.848,
6.2 × 10⁻¹⁰, 3.6 × 10⁻³
881.816, 877.196, 882.189,
5.2 × 10⁻¹, 4.2 × 10⁻²
SH0.0, 0.001, 0.005,
8.3 × 10⁻⁴, 4.7 × 10⁻³
340.735, 340.735, 340.750,
1.7 × 10⁻⁷, 4.5 × 10⁻³
340.735, 340.735, 340.751,
5.3 × 10⁻⁹, 4.9 × 10⁻³
340.735, 340.735, 340.751,
2.9 × 10⁻¹⁰, 4.8 × 10⁻³
340.735, 339.024, 340.903,
5.0 × 10⁻¹, 4.9 × 10⁻²
PH0.0, 0.000, 0.001,
2.1 × 10⁻⁴, 9.2 × 10⁻⁴
269.808, 269.808, 269.821,
4.9 × 10⁻⁸, 4.9 × 10⁻³
269.808, 269.808, 269.822,
4.1 × 10⁻⁹, 5.4 × 10⁻³
269.808, 269.808, 269.822,
2.4 × 10⁻¹⁰, 5.2 × 10⁻³
269.808, 268.558, 269.971,
4.6 × 10⁻¹, 6.1 × 10⁻²
DH0.0, 0.001, 0.005,
8.1 × 10⁻⁴, 4.6 × 10⁻³
208.095, 208.095, 208.103,
5.5 × 10⁻⁷, 3.8 × 10⁻³
208.095, 208.095, 208.104,
2.1 × 10⁻⁸, 4.0 × 10⁻³
208.095, 208.095, 208.104,
1.2 × 10⁻⁹, 4.1 × 10⁻³
208.095, 206.914, 208.159,
5.7 × 10⁻¹, 3.0 × 10⁻²
P2877.527, 2877.526, 2877.571,
5.1 × 10⁻⁵, 1.5 × 10⁻³
3147.335, 3147.335, 3147.400,
3.6 × 10⁻⁸, 2.1 × 10⁻³
7175.873, 7175.873, 7176.001,
1.7 × 10⁻⁹, 1.8 × 10⁻³
6107.066, 6107.066, 6107.176,
1.4 × 10⁻¹⁰, 1.8 × 10⁻³
6107.066, 6098.574, 6107.413,
1.4 × 10⁻¹, 5.7 × 10⁻³
N1391.209, 1391.209, 1391.212,
3.1 × 10⁻⁵, 2.0 × 10⁻⁴
3015.849, 3015.849, 3015.888,
3.2 × 10⁻⁸, 1.3 × 10⁻³
4016.750, 4016.750, 4016.776,
1.5 × 10⁻⁹, 6.5 × 10⁻⁴
5507.375, 5507.375, 5507.398,
5.5 × 10⁻¹¹, 4.2 × 10⁻⁴
5507.375, 5508.001, 5507.373,
1.1 × 10⁻², 3.2 × 10⁻⁵
PF10.906, 0.906, 0.906,
3.9 × 10⁻⁶, 2.6 × 10⁻⁴
0.906, 0.906, 0.906,
1.8 × 10⁻⁸, 2.9 × 10⁻⁴
0.906, 0.906, 0.906,
4.7 × 10⁻¹⁰, 2.8 × 10⁻⁴
0.766, 0.766, 0.766,
6.8 × 10⁻¹¹, 6.4 × 10⁻⁴
0.766, 0.766, 0.766,
5.6 × 10⁻², 1.5 × 10⁻³
PF0.900, 0.900, 0.900,
1.6 × 10⁻⁵, 2.5 × 10⁻⁴
0.722, 0.722, 0.722,
1.9 × 10⁻⁹, 3.7 × 10⁻⁴
0.873, 0.873, 0.873,
5.8 × 10⁻¹¹, 2.7 × 10⁻⁴
0.743, 0.743, 0.743,
3.9 × 10⁻¹¹, 6.1 × 10⁻⁴
0.743, 0.742, 0.743,
6.8 × 10⁻², 2.6 × 10⁻³

References

  1. de La Ree, J.; Centeno, V.; Thorp, J.S.; Phadke, A.G. Synchronized phasor measurement applications in power systems. IEEE Trans. Smart Grid 2010, 1, 20–27. [Google Scholar] [CrossRef]
  2. Hojabri, M.; Dersch, U.; Papaemmanouil, A.; Bosshart, P. A Comprehensive Survey on Phasor Measurement Unit Applications in Distribution Systems. Energies 2019, 12, 4552. [Google Scholar] [CrossRef] [Green Version]
  3. Phadke, A.G.; Thorp, J.S. Synchronized Phasor Measurements and their Applications; Springer: New York, NY, USA, 2008; ISBN 978-0-387-76535-8. [Google Scholar]
  4. Power, I.; Society, E. C37.118.1-2011—IEEE Standard for Synchrophasor Measurements for Power Systems; IEEE: Piscataway, NJ, USA, 2011. [Google Scholar]
  5. Carta, A.; Locci, N.; Muscas, C. GPS-based system for the measurement of synchronized harmonic phasors. IEEE Trans. Instrum. Meas. 2009, 58, 586–593. [Google Scholar] [CrossRef]
  6. Al-Shetwi, A.Q.; Hannan, M.A.; Jern, K.P.; Alkahtani, A.A.; PG Abas, A.E. Power Quality Assessment of Grid-Connected PV System in Compliance with the Recent Integration Requirements. Electronics 2020, 9, 366. [Google Scholar] [CrossRef] [Green Version]
  7. Tian, M.; Wang, Y.; Li, J. Comprehensive Harmonic Responsibility Calculation Based on Different Weighting Methods. Energies 2019, 12, 4449. [Google Scholar] [CrossRef] [Green Version]
  8. Oureilidis, K.; Malamaki, K.-N.; Gallos, K.; Tsitsimelis, A.; Dikaiakos, C.; Gkavanoudis, S.; Cvetkovic, M.; Mauricio, J.M.; Maza Ortega, J.M.; Ramos, J.L.M.; et al. Ancillary Services Market Design in Distribution Networks: Review and Identification of Barriers. Energies 2020, 13, 917. [Google Scholar] [CrossRef] [Green Version]
  9. Bernabeu, E.E. Single-phase transformer harmonics produced during geomagnetic disturbances: Theory, modeling, and monitoring. IEEE Trans. Power Deliv. 2015, 30, 1323–1330. [Google Scholar] [CrossRef]
  10. Dash, P.K.; Padhee, M.; Barik, S.K. Estimation of power quality indices in distributed generation systems during power islanding conditions. Int. J. Electr. Power Energy Syst. 2012, 36, 18–30. [Google Scholar] [CrossRef]
  11. Ukai, H.; Nakamura, K.; Matsui, N. DSP- and GPS-Based Synchronized Measurement System of Harmonics in Wide-Area Distribution System. IEEE Trans. Ind. Electron. 2003, 50, 1159–1164. [Google Scholar] [CrossRef]
  12. Carta, A.; Locci, N.; Muscas, C. A PMU for the measurement of synchronized harmonic phasors in three-phase distribution networks. IEEE Trans. Instrum. Meas. 2009, 58, 3723–3730. [Google Scholar] [CrossRef]
  13. Chen, C.I. A phasor estimator for synchronization between power grid and distributed generation system. IEEE Trans. Ind. Electron. 2013, 60, 3248–3255. [Google Scholar] [CrossRef]
  14. Chakir, M.; Kamwa, I.; Le Huy, H. Extended C37.118.1 PMU algorithms for joint tracking of fundamental and harmonic phasors in stressed power systems and microgrids. IEEE Trans. Power Deliv. 2014, 29, 1465–1480. [Google Scholar] [CrossRef]
  15. Gungor, V.C.; Sahin, D.; Kocak, T.; Ergut, S.; Buccella, C.; Cecati, C.; Hancke, G.P. A Survey on smart grid potential applications and communication requirements. IEEE Trans. Ind. Inform. 2013, 9, 28–42. [Google Scholar] [CrossRef] [Green Version]
  16. Gadde, P.H.; Biswal, M.; Brahma, S.; Cao, H. Efficient Compression of PMU Data in WAMS. IEEE Trans. Smart Grid 2016, 7, 2406–2413. [Google Scholar] [CrossRef]
  17. Fu, L.; Zhu, T.; Pan, G.; Chen, S.; Zhong, Q.; Wei, Y. Power Quality Disturbance Recognition Using VMD-Based Feature Extraction and Heuristic Feature Selection. Appl. Sci. 2019, 9, 4901. [Google Scholar] [CrossRef] [Green Version]
  18. Valtierra-Rodriguez, M.; Romero-Troncoso, R.D.J.; Garcia-Perez, A.; Granados-Lieberman, D.; Osornio-Rios, R.A. Reconfigurable instrument for neural-networkbased power-quality monitoring in 3-phase power systems. IET Gener. Transm. Distrib. 2013, 7, 1498–1507. [Google Scholar] [CrossRef]
  19. 1459-2010 IEEE Standard Definitions for the Measurement of Electric Power Quantities Under Sinusoidal, Nonsinusoidal, Balanced, or Unbalanced Conditions; IEEE: Piscataway, NJ, USA, 2010.
  20. Caramia, P.; Carpinelli, G.; Verde, P. Power Quality Indices in Liberalized Markets; Wiley: Chichester, UK, 2009; ISBN 9780470033951. [Google Scholar]
  21. 519-2014 IEEE Recommended Practice and Requirements for Harmonic Control in Electric Power Systems; IEEE: Piscataway, NJ, USA, 2014.
  22. IEC 61000-4-7:2002|IEC Webstore|Electromagnetic Compatibility, EMC, Smart City. Available online: https://webstore.iec.ch/publication/4226 (accessed on 20 January 2020).
Figure 1. Reference signal processing model.
Energies 13 02337 g001
Figure 2. Extended phasor measurement unit (PMU) for fundamental and harmonic phasors.
Energies 13 02337 g002
Figure 3. Voltage and current phasor components and global harmonic parameters.
Energies 13 02337 g003
Figure 4. Synthetic signals for voltage and current.
Energies 13 02337 g004
Figure 5. Results for harmonic phasors of voltage and current, global harmonic parameters, and estimation of PQIs: (a) MV, (b) θV, (c) MI, (d) θI, (e) fF, (f) RMSVH, (g) RMSIH, (h) HAPF, (i) RMSV, (j) RMSI, (k) THDV, (l) THDI, (m) ST, (n) PF, (o) QF, (p) SF, (q) SN, (r) DV, (s) DI, (t) SH, (u) PH, (v) DH, (w) PT, (x) N, (y) PFF, (z) PFT.
Energies 13 02337 g005
Figure 6. Real measurements: (a) experimental setup and (b) V(t) and I(t).
Energies 13 02337 g006
Figure 7. Results for harmonic phasors of voltage and current, global harmonic parameters, and estimation of PQIs: (a) MV, (b) θV, (c) MI, (d) θI, (e) fF, (f) RMSVH, (g) RMSIH, (h) HAPF, (i) RMSV, (j) RMSI, (k) THDV, (l) THDI, (m) ST, (n) PF, (o) QF, (p) SF, (q) SN, (r) DV, (s) DI, (t) SH, (u) PH, (v) DH, (w) PT, (x) N, (y) PFF, (z) PFT.
Energies 13 02337 g007
Table 1. Equations for power quality indices (PQIs).
Classical FormulationGHPs-Based Formulation
True RMS value of Voltage (RMSV) and Current (RMSI)
R M S V = 1 2 h = 1 H V n 2 ,   R M S I = 1 2 h = 1 H I n 2 R M S V = R M S V F 2 + R M S V H 2 ,   R M S I = R M S I F 2 + R M S I H 2
Total Harmonic Distortion of Voltage (THDV) and Current (THDI)
T H D V = h = 2 H V h 2 V 1 100 % ,   T H D I = h = 2 H I h 2 I 1 100 % T H D V = R M S V H R M S V F 100 % ,   T H D I = R M S I H R M S I F 100 %
Total Apparent Power (ST)
S T = R M S V R M S I S T = R M S V R M S I
Fundamental Real Power (PF)
P F = 1 2 V 1 I 1 cos ( θ 1 ϕ 1 ) P F = R M S V F R M S I F cos ( θ V F ϕ I F )
Fundamental Active Power (QF)
Q F = 1 2 V 1 I 1 s i n ( θ 1 ϕ 1 ) Q F = R M S V F R M S I F s i n ( θ V F ϕ I F )
Fundamental Apparent Power (SF)
S F = V 1 I 1 S F = R M S V F R M S I F
Non-60 Hz or Nonfundamental Apparent Power (SN)
S N = S T 2 S F 2 S N = S T 2 S F 2
Current Distortion Power (DI)
D I = 1 2 V 1 2 h = 2 H I h 2 D I = R M S V F R M S I H
Voltage Distortion Power (DV)
D V = 1 2 I 1 2 h = 2 H V h 2 D V = R M S I F R M S V H
Harmonic Apparent Power (SH)
S H = S N 2 D I 2 D V 2 S H =   R M S V H R M S I H
Harmonic Real Power (PH)
P H = 1 2 h = 2 H V h I h cos ( θ h ϕ h ) P H =   S H H A P F
Harmonic Distortion Power (DH)
D H = S H 2 P H 2 D H = S H 2 P H 2
Active Power Total (PT)
P T = 1 2 h = 1 H V h I h cos ( θ h ϕ h ) P T = P F + P H
Non Active Power (N)
N = S T 2 P T 2 N = S T 2 P T 2
Power Factor (PFF)
P F F = cos ( θ 1 ϕ 1 ) P F F = cos ( θ V F ϕ I F )
Total Power Factor (PFT)
P F T = P T / S T P F T = P T / S T
Table 2. Numerical values of magnitude and phase angle.
Voltage ComponentsCurrent Components
V1 /θ1√2·100 V/0°I1 /φ1√2·100 A/30°
V3 /θ3√2·8 V/−70°I3 /φ3√2·20 A/165°
V5 /θ5√2·15 V/140°I5 /φ5√2·15 A/233°
V7 /θ7√2·5 V/20°I7 /φ7√2·10 A/−72°
Table 3. Results for the numerical example using either classical formulation or global harmonic parameter (GHP)-based formulation.
PQIOption 1Option 2PQIOption 1Option 2
RMSV101.56 V101.56 VDI2692.6 VAR2692.6 VAR
RMSI103.56 A103.56 ADV1772.0 VAR1772.0 VAR
THDV17.72 %17.72 %SH477.13 VA477.13 VA
THDI26.93 %26.93 %PH−27.47 W−27.47 W
ST10517.5 VA10517.5 VADH476.34 VAR476.34 VAR
PF8660.3 W8660.3 WPT8632.8 W8632.8 W
QF5000 VAR5000 VARN6007.7 VAR6007.7 VAR
SF10000 VA10000 VAPFF0.870.87
SN3258.5 VA3258.5 VAPFT0.820.82
Table 4. Values for synthetic signals.
Stages for v(t)fV1/θ1V2/θ2V3/θ3V5/θ5V40/θ7
1,2,3,460 Hz127 V/5°10 V/30°8 V/45°6 V/−45°4 V/115°
561.5 Hz
Stages for i(t)FI1 /ϕ1I2 /ϕ2I3 /ϕ3I5 /ϕ5I40 /ϕ7
160 Hz25A/35°0
225A/35°15 A/25°12.5 A/20°10 A/−90°7.5 A/0°
360A/35°
460A/115°
561.5 Hz60A/115°

