Abstract
In passive solar buildings, energy can be stored using either sensible heat materials or latent heat materials. Phase change materials (PCM) can contribute to temperature control in passive solar buildings when melting occurs near to comfort temperature required for building’s interior spaces. The use of finite element method (FEM) as a numerical methodology for solving the thermal problem associated with heat transfer in current building materials and PCMs make sense, as it is a well-known technique, generalized and dominated, however, still little applied to the domain of building physics. In this work, a solar model was developed and applied in order to simulate numerically the effect of solar radiation incidence on each face of the test cells (with different solar exposures) without neglecting the main objective of the recommended numerical simulation: the study of the action of PCM. During the experimental campaign, two test cells with distinct inner layers were used to evaluate the effect of solar radiation: (i) REFM test cell (without PCM) with a reference mortar; (ii) PCMM test cell (with PCM) with a PCM mortar. The temperatures monitored inside the REFM and PCMM test cells were compared with the values resulting from the numerical simulation, using FEM with 3D discretization and the explicit modeling of the solar radiation, and the obtained results revealed a significant coherence of values.
1. Introduction
Phase change materials (PCM) are recognized as an efficient energy storage system. In these materials used, the heat is stored (energy storage) in the form of latent heat [1]. These materials are characterized by a high storage capacity, at a constant temperature, which is a big advantage related to the traditional building materials.
When the environment temperature increases the chemical bonds of the PCM break and it goes from solid to liquid state. The observed chemical reaction is endothermic which means that these materials absorb heat. Finally, the PCM returns to the solid state when the temperature drops again, releasing the stored heat. These cycles contribute for the stabilization of the interior temperature within buildings, achieved by the action of the PCM of heat conservation at constant temperature and not by increasing the thermal resistance of the buildings’ elements.
Recent studies reveal the growing interest in the study of PCMs. The increase in thermal comfort inside buildings with reduced energy consumption and less gas emissions remain the core drives. PCMs have the property to reduce the temperature amplitudes in order to closer them to comfort temperatures [2]. Previous studies have shown that latent thermal storage is an effective way to increase the energy efficiency [3,4,5].
Due to the large thermal storage capacity, in the form of latent heat, PCM has been used in buildings to reduce internal temperature fluctuation [6,7] and decrease the energy consumption of the building [8]. Athienitis et al. [9] found that the PCM plasterboard could reduce the maximum interior temperature by 4 °C. In the study presented by Kuznik and Virgone [10], a similar result with a decrease in the maximum ambient temperature by 4.2 °C, in the cooling season, was reported for a wall composed of PCM. Stritih et al. [11] showed that the application of PCMs in building walls could be an important factor to achieve the goals of Net Zero Energy Buildings, as the results presented a considerable reduction on daily building energy.
The application of a cementitious mortar with PCM in small test cells revealed a reduction in the maximum temperature peak of 2.6 °C [2]. The employment of PCM into cement-based building elements (floors and walls) was described by several researchers [12,13,14] as an effective method for increasing the buildings energy efficiency. In addition, the PCM used in buildings can produce a heat transfer delay [15]. Kong et al. [16] showed a notable decrease in the energy consumption for space cooling by the employment of PCM panels into building wall surfaces. These PCM panels could delay the maximum temperature by 2–3 h. Biswas et al. [17] showed in a numerical study, using PCM wallboards fabricated by nano-PCMs, that it is possible to obtain an annual building energy consumption less than 20%. Another example is the research developed by Lu et al. [18] who showed an average energy reduction of 54.27% with a system, developed by the authors, that combines PCM radiant floor with PCM wall.
In short, Passive PCM systems are widely used in different building components in order to increase the thermal comfort and reduce the building energy consumption, namely, in locals with extreme weather conditions. The development of strategies that handle the energy efficiency (and inherency reduce carbon dioxide emissions) at the local scale of the building, hence increasing its sustainability are important steps to the wider goals of sustainability at a worldwide scale, for which the sum of all contributions is of major importance [19,20,21]. However, their application in buildings presents several disadvantages that need to be improved in future research works, as, the cost, low thermal conductivity, phase segregation, super cooling, fire safety, etc. [22].
Solar radiation presents an important role on the thermal comfort of interior spaces, particularly on passive solar buildings [23,24]. However, sometimes this major effect is neglected. The experimental campaign carried out consisted of placing test cells (with and without PCM) outdoors in order to register the effect of solar radiation. A solar model was developed and attached to the numerical simulation software used (DIANA [25]). The temperatures monitored inside the REFM (reference material) and PCMM (PCM material) test cells during the experimental campaign were compared with the values resulting from the numerical simulation using the finite element method with 3D discretization, and the obtained results revealed a significant coherence of values. The choice for the finite element model with 3D volumetric elements as the elected numerical simulation methodology relies on the capacity for detailed consideration of the layered features of the involved walls of the test cells, and hence fully understand the intricacies of heat transfer/storage through the several walls/directions. The feasibility of this approach of simulation has been demonstrated in a previous publication that dealt with similar test subjects under indoor laboratory conditions [2].
2. Heat Transfer Problem
The heat transfer problems associated with the solidification and/or melting of the materials are important for the most diverse engineering areas, namely in energy storage, having been the subject of several studies [26,27,28,29,30,31,32].
The solution to these problems is not easy since the boundary condition between the solid and the liquid state is initially unknown and should be part of the solution [26]. In this work, the enthalpy method, described by Shamsundar [33] and Ozisik [26], is used as a numerical solution to the problem of heat transfer in PCMs. The enthalpy is temperature dependent during the change of state, reaching the maximum value at the temperature corresponding to the melting peak and equaling zero at the beginning of the melting (corresponding to the melting temperature).
The general form of the heat equation, taking into account the variation of the enthalpy (H) with the temperature (T), is represented by [26,33]:
where ρ is the density, λ is the thermal conductivity, t is the time and x, y, z are the coordinates of the Cartesian system.
If it is considered linear the release of the latent heat during the phase change (between T1 and T2), the enthalpy variation with temperature is described by [26]:
where Cp is the specific heat, L is the latent heat and, T1 and T2 represent the melting temperatures and peak melting temperatures (temperature at which all particles of the material are in the liquid state)—corresponding to the maximum energy storage capacity. The corresponding heat flows are given by Equation (5),
where heq is the convection/radiation coefficient, air speed dependent [34], T is the external temperature and Ts is the surface temperature.
The solar radiation effect on the various faces of the cells was estimated considering the real exposure conditions: air temperature and solar radiation incident on each face, using the solar radiation model described below, bringing the numerical simulation closer to the one monitored in the tests in situ.
Solar Radiation Model
It is usual to subdivide solar radiation into two types, direct and diffuse. The solar radiation that passes through the atmosphere without being diverted or absorbed in its path corresponds to direct radiation; diffuse radiation corresponds to the part of solar radiation that is dispersed during its course due to disturbances of atmospheric components. Diffuse radiation is of relatively small importance on clear days, however it can represent an important part of solar radiation on cloudy days [35,36].
Direct solar radiation reaching the upper layers of the atmosphere has an average value of 1376 W/m2 (known as the solar constant) [36]. There is a fluctuation in relation to this constant of around 6.9% throughout the year (1412 W/m2 in January to 1321 W/m2 in July) [37]. This fluctuation is due to the elliptical shape of the Earth’s orbit around the Sun, and can be neglected in the estimation of surface temperatures caused by incident solar radiation. However, to reach a surface at sea level, direct solar radiation passed through the atmosphere, experiencing disturbances even on clear days. The radiation that actually reaches sea level, qm, can be estimated using the following equation [38]:
where q0 is the solar constant (W/m2), h is the solar elevation (°) and Tl is the turbidity factor. The current values for Tl are between 3 and 7, and in turbulent atmospheres, such as in polluted cities, Tl will be close to 6 or 7, with a maximum limit of 10 [39].
The solar elevation, (h), corresponds to the angle between the direction of the sun’s rays and the horizon. This parameter represents the distance that the sun has to travel in the atmosphere until it reaches the Earth’s surface. At solar noon, this distance is shorter than at sunrise and sunset, the radiation attenuation being smaller the shorter the distance to travel (that is, the radiation amortization is less at midday).
The solar radiation absorbed by a surface, qs, can be calculated according to the following expression [40]:
where qm represents the solar radiation reaching the surface, αs is the absorption of the surface (which is a function of color and can vary between 0 and 1) and i is the incidence angle with the perpendicular to the surface which can be estimated as follows:
The direct solar radiation analysis on a surface with a certain inclination implies the consideration of several geometric parameters described in Figure 1 (α—angle that the surface makes with the horizontal plane (°); h—solar elevation (°), corresponds to the angle between the direction of the sun’s rays and the horizon; ψ—azimuth of the projection of in the horizontal plane (°): 0° to the South, 90° to the East, 180° to the North and 270° to the West; —vector perpendicular to the surface; and i—angle of incidence of solar rays in relation to ). However, it must be emphasized that the solar model presented does not take into account the shading caused by neighboring obstacles.
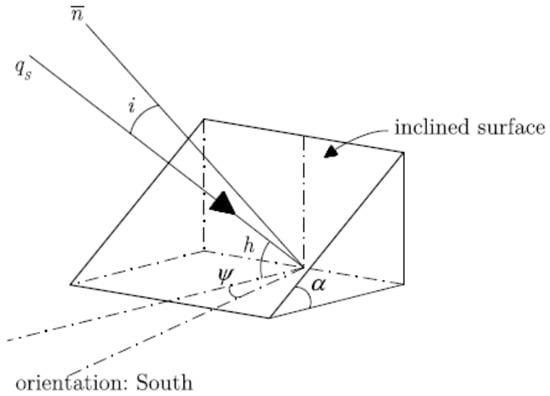
Figure 1.
Arbitrarily inclined surface and incident sun beam (adapted from [34]).
3. Experimental Campaign
3.1. Pilot Test Cells
An experimental campaign was developed in order to study the influence of an internal coating exposed to solar radiation, which use PCM into plastering mortars.
In this work, two closed small-sized test cells, with the format of hollow cubes and an exterior edge dimension of 40 cm, were built with different interior coatings: (i) test cell REFM with common plastering mortars, and (ii) test cell PCMM with a developed PCM mortar with formulation L. The PCM used presents a melting temperature range of 23–25 °C and an enthalpy of 100 kJ/kg. Both test cells were placed outdoors, exposed to local weather condition: solar radiation, temperature variation, relative humidity and wind speed. Test cells and all the materials used in their construction are described in a previously published work [2]. Table 1 presents the material thermophysical properties used in both test cells.

Table 1.
Description of the material thermophysical properties used (adapted from [2].)
The test cells are hollow cubes, with dimension 26 × 26 × 26 cm3, and whose walls present the following composition: an inner plastering mortar with 2 cm of thickness (REFM or PCMM); a middle layer of steel-reinforced mortar with 3 cm thick, in order to have structural integrity; and a layer of extruded polystyrene (XPS) with 2 cm of thickness (λ = 0.04 W/mK [41]), to guarantee the desired transmittance.
It should be noted that the cross-sectional composition of the test cell walls is not the most typically used in buildings, but presented a thermal behavior similar to actual building envelopes. The test cells have a small-sized dimension and thin walls, in order to have a thermal transmittance value (U ≈ 1.40 W/m2·K) lower than the maximum value admitted for vertical elements (U ≈ 1.45 W/m2·K), according to Portuguese regulations [42].
3.2. Experimental Procedure and Climatic Conditions
Both test cells were placed on the 1st floor roof of Faculty of Engineering–University of Porto (FEUP) building G (Coordinates: 41.1780, −8.5980), close to the Laboratory of Building Physics (LFC) [43] weather station and close to the body of the building, as shown in the Figure 2 and Figure 3, thus allowing the monitoring equipment to be stored inside the building and data usage of the weather station. The location where the cells were placed guarantees them a continuous daily sun exposure, during the entire period in which the tests took place: between May and June 2011.
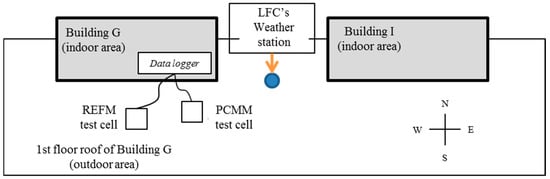
Figure 2.
Plan of FEUP’s main buildings G and I: Pilot test cells outdoor arrangement set.
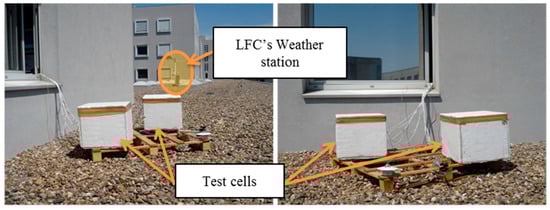
Figure 3.
In situ monitoring of test cells—roof of the 1st floor of the building G, FEUP, Porto.
Regarding the monitoring of temperatures, temperature sensors of the type “PT100”, with a sensitivity of +/− 0.01 °C, were distributed inside the test cell, in a total of 10 sensors: 8 PT100s inside (4 in each cell) and 2 PT100s on the outside (near the bottom of each test cell). The distribution of temperature sensors inside the cells was done as follows: 1 PT100 in the center of the cover; 1 PT100 in the geometric center; 1 PT100 in the center of the base (bottom surface cell) and 1 PT100 in the center of the SE face (Figure 4). The sensors of temperature were connected to a data acquisition and storage system, with the recording of a measurement for every 10 min during the entire test cycle.
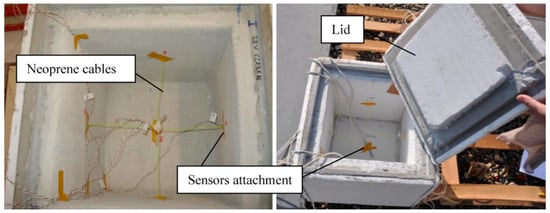
Figure 4.
Distribution of the sensors inside the test cells.
In situ experimental tests were conducted with the objective of evaluating the influence of PCM on the daily thermal performance of indoor spaces, the test cells were exposed to the climatic conditions of 4 consecutive days, between the 15th to the 19th of May 2011.
The values of the exterior air temperature (Tair) and the total incident solar radiation (Ig), represented in Figure 3, result from the acquisition of data recorded by the LFC/FEUP weather station. The ambient temperature was also recorded by two temperature sensors, type PT100, placed on the bottom base of each of the test cells (in contact with the air and protected from solar radiation).
The first tests carried out in situ consisted of monitoring the interior temperatures of the test cells exposed to the climatic conditions represented by Figure 5 and Figure 6. In addition to high temperatures, maximum outdoor temperature close to 30 °C and intense solar radiation (Ig, max = 800 W/m2), the first two days during which the tests took place (15 and 16 May 2011), were characterized by clear skies with low relative humidity (RH between 19% and 45.5%), and reduced wind speed (average speed of 1.5 m/s). The next two days (17th and 18th of May) can easily be distinguished from the first by the cloudiness and the higher relative humidity (average RH of 70%).
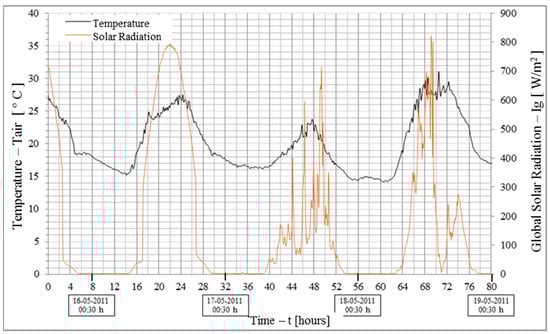
Figure 5.
Monitoring of exterior temperature (Tair) and solar radiation (Ig) between 15 and 19 May 2011.
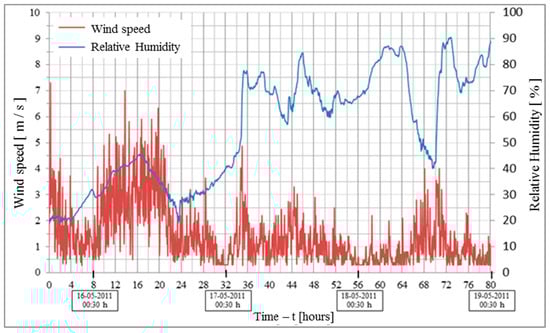
Figure 6.
Monitoring of outdoor wind speed and relative humidity between 15 and 19 May 2011.
3.3. Experimental Results and Discussion
During the first tests carried out in situ, the monitoring of the internal temperatures of the test cells shows that there is a difference between the records obtained from the sensors placed in the center of the cover and the Southeast face (SE), and the records of the sensors placed at the geometric center and at the base of the cells. This difference is observable, both in the REFM cell and in the PCMM cell, as shown in Figure 7. The non-homogeneity in the recording of indoor temperatures, demonstrated by the recording of temperatures in different points of the interior of each of the cells, shows the influence that solar radiation has on the exterior surface temperature and consequently on the interior temperatures (surface and ambient). Thus, the interior surfaces of the faces with greater sun exposure, such as the cell cover (horizontal top face) and the SE face, have higher temperatures than the center and base of the cell.
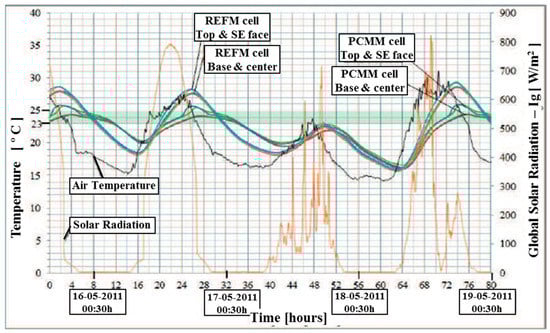
Figure 7.
Experimental results of exterior temperature, global solar radiation and internal temperature of the test cell REFM (reference material) and test cell PCMM (PCM material).
Taking into account the results of the monitoring of both test cells for the sensors placed on the cover and on the SE face, represented in the graph of Figure 8, the maximum temperature recorded inside the REFM test cell was 29.2 °C, while in the PCMM test cell it was 26.0 °C. On test days with higher temperatures and more intense solar radiation, there is a difference between the maximum temperature peaks recorded inside the REFM cell and the peaks recorded inside the PCMM cell, with values of: ΔT = 2.9 °C; ΔT = 2.6 °C; and ΔT = 3.2 °C, corresponding to the 15th, 16th and 18th of May, respectively. During these days, the action of the PCM, underlined by a shaded area in Figure 8, is noticeable over several hours a day. On 16 May this action (corresponding to temperatures inside the cell in the PCM fusion range (from ≈ 23 °C to ≈ 25 °C) is visible for about 12 h, between 12 h:30 min and 18 h:30 min and between 20 h:30 min and 2 h:30 min.
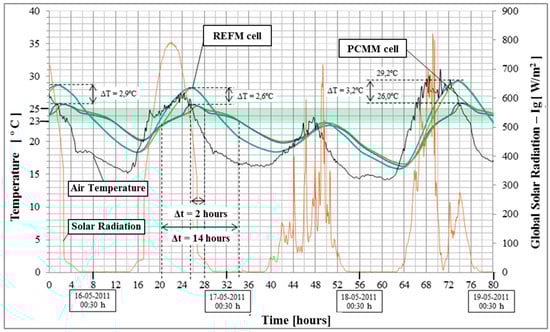
Figure 8.
Experimental results of exterior temperature, global solar radiation and temperature inside the cells (SE corner and cover).
On the mildest day, corresponding to the 17th of May, the effect of the PCM is not noticeable, because the interior temperatures do not reach the PCM melting temperature. Throughout this day, monitoring the interior of both test cells allows us to observe that the interior temperatures (in the REFM and PCMM cells) are equivalent.
The monitoring carried out by the sensors placed on the base and in the geometric center of the interior of both test cells is presented in Figure 9.
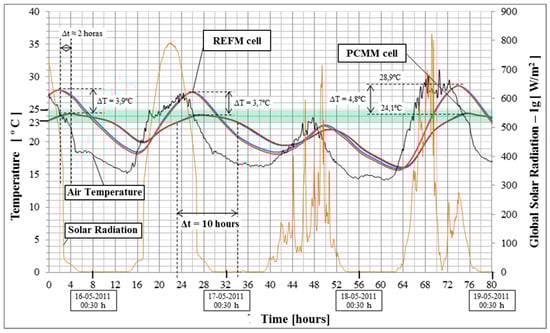
Figure 9.
Experimental results of exterior temperature, global solar radiation and internal temperature of the cells (base and geometric center).
The maximum temperature recorded by these sensors inside the REFM cell was 28.8 °C, while inside the PCMM cell the maximum temperature was 24.1 °C. The differences between the maximum temperature peaks recorded inside the REFM and PCMM test cells were: ΔT = 3.9 °C; ΔT = 3.7 °C; and ΔT = 4.8 °C, respectively for the 15th, 16th and 18th of May. Similar to what was observed in laboratory tests [2], here too there is a gap between the maximum temperature peaks recorded inside the cells. During the time that the tests were carried out, the maximum delay was approximately 2 hours. The average temperature recorded inside the test cell without PCM was 23.5 °C and the average temperature recorded inside the test cell with PCM was 22.0 °C. Knowing that the biggest difference was registered in the maximum peak temperatures and discomfort temperatures.
The experimental results presented by Entrop [44] in the in situ study of small test cells consisting of a concrete floor with PCM, allowed to observe the effect of the PCM, guaranteeing, for the conditions studied, a leveling of the temperatures, i.e., the maximum interior temperatures decreased and the minimum temperatures increased. In the experimental study developed, according to what was observed by Entrop [44], the action of the PCMs is felt essentially by the influence they have in the reduction of the daily peaks of temperature (maximum and minimum). The regulatory action of the temperature peaks contributes to the reduction of the temperature range registered inside and to the increase of the gap between the outside and inside temperature peaks.
The collected results showed that PCM has an important role in the reduction of the interior temperature amplitudes, during the day, by leveling the interior temperatures. The main objective of the experimental investigation presented is to observe the behavior of the PCM incorporated in the developed mortar, when subjected to temperature cycles characteristic of the cooling season.
The two test cells (one coated with a standard mortar and the other coated with the mortar with PCM) were subjected to in situ tests, representing scenarios corresponding to hot days in the cooling season in mainland Portugal. The monitoring of temperatures inside the two cells (REFM and PCMM) allowed the observation of the distinct behavior between them, showing the action of the PCM. PCMs contribute to the conservation of indoor temperatures between values corresponding to their melting range. Thus guaranteeing: the reduction of daily temperature peaks (maximum and minimum), the attenuation of fluctuations (or stabilization) of the indoor temperature and the increase of the gap between the outdoor temperature peaks and the indoor temperature peaks.
The results obtained also demonstrated that the action of the PCM is not constant, being very conditioned by the conditions of exposure (of the external environment). On two consecutive days the presence of PCM can go from imperceptible to essential in conservation indoor temperature within the desired comfort limits. This fact can somehow condition the search for an optimal solution with PCM. The numerical simulation, presented in the following section, is intended to be a useful tool in the search for a solution with PCM whose performance is extended to the longest possible period of the cooling season.
4. Numerical Resolution of the Mathematical Problem
The numerical resolution of the mathematical problem of heat transfer described above is presented, performing thermal analyses on the pilot test cells used during the experimental test campaign. The thermal analyses developed are compared with the results obtained in the experimental monitoring in order to validate the numerical model used to solve the mathematical problem of heat transfer.
In the above-mentioned analyses, the finite element method (FEM) was used to support thermal modeling, considering a three-dimensional (3D) analysis of the heat transfer problem.
The mathematical formulations described are implemented in DIANA software [25], in order to simulate the 3D thermal fields. It was used for mortar/XPS/air, 8-node brick elements (2 × 2 × 2 Gauss integration) and for the convection/radiation boundaries, 4-node planar elements (2 × 2 Gauss integration), as sketched in Figure 10.
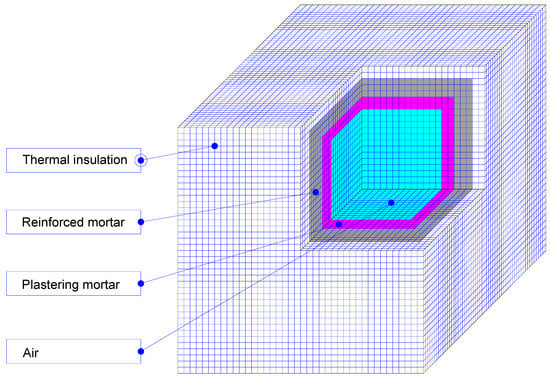
Figure 10.
Numerical thermal model pilot test cell.
4.1. Model Geometry and Parameters
In modeling the complete test cell, in its true size, the following external dimensions were considered: 0.40 × 0.40 × 0.40 m3. On the adopted 3D discretization, each finite element (FE) has an average volume of 2.35 cm3 (total of 48,400 nodes and 48,678 elements), which renders a quite refined mesh in the vicinity of the PCM layer where comparisons between numerical and monitored results will be presented). Nonlinearities were solved by the Newton–Raphson Method with relative tolerance of 0.0001. A value of heq = 15 W/(m °C) was considered for the convection coefficient [2,34], taking into account the exposure conditions: area limited by the presence of several buildings and reduced wind speed felt during the period in which the experimental campaign was carried out. The initial temperature inside the cells was fixed at 25 °C, similar to the temperature recorded inside the cells when the in situ monitoring started. Thermal analyses were carried out covering a period corresponding to the days monitored during the experimental campaign, approximately 4 days, divided into 10-minute increments.
The evolution of temperatures over the simulated time corresponds to the monitored temperatures during the experimental campaign by the LFC weather station. The solar radiation used in the numerical simulation took into account the values obtained through the model described above. Through this model, the values of solar radiation incident on a horizontal surface (from α = 1), between 15th and 19th May, were estimated. The approximation of the simulated values to the monitored values was achieved by adjusting the turbulence value, through an iterative trial and error process. The turbulence obtained, which best approximated the simulated radiation values to those monitored by the weather station’s pyrometer, on clear skies (15th and 16th May), was T1 = 4.5. The remaining parameters considered were α = 0° (horizontal surface) and latitude equal to 41.178°, the value of ψ is irrelevant for horizontal surfaces (ψ = 0°). The record of the simulated values and the values measured by the weather station’s pyrometer for solar radiation on a horizontal surface (with absorption coefficient α = 1) are shown in Figure 8. The solar time does not really match the conventional government time for all locations at a given country because of the latitude shifts and frequently because of daylight saving time. For such type of reasons, the results of peak radiation are not happening at 12 h. Note that there is a delay in relation to the solar noon which, for the place and the days of the year under analysis, corresponds to 1 h and 34 min [45], an interval already corrected in Figure 11.
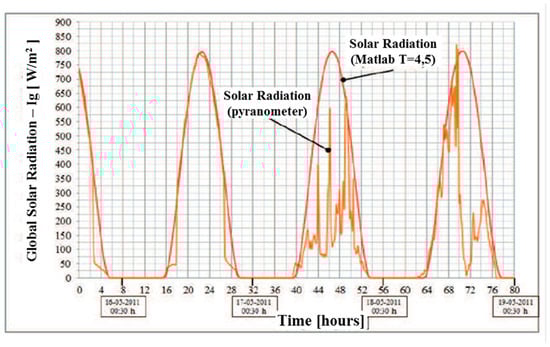
Figure 11.
Solar radiation monitored by the pyranometer and estimated by the solar model, for T1 = 4.5, between 15 and 19 May.
On 15th and 16th May, clear days, the simulated values are practically coincident with the values monitored by the pyranometer, following the radiation curve resulting from the monitored data, both in terms of radiation intensities and in terms of amplitude (or hours of sunshine). In the remaining days, 17th and 18th of May, the deviations between the simulated values and the measured values are justified by intermittent shading, caused by the passage of clouds.
Taking into account the proximity between the simulated and monitored values for solar radiation incident on a horizontal surface, the radiation absorbed by each of the 5 exposed surfaces of the test cells was estimated. A value of αs = 0.25 was considered as the solar absorption coefficient of the cell’s outer covering (XPS, white) [46]. In the simulation of the 4 vertical surfaces, a value of α = 90° was considered with values of ψ different according to their solar orientation of each face: ΨNorth = 180°; ΨSouth = 0° ΨEast = 90° and ΨWest = 270°. The considered model parameters and operation conditions are synthesized on Table 2 and this simulation led to the results shown in Figure 12.
Table 2.
Model parameters and operation conditions.
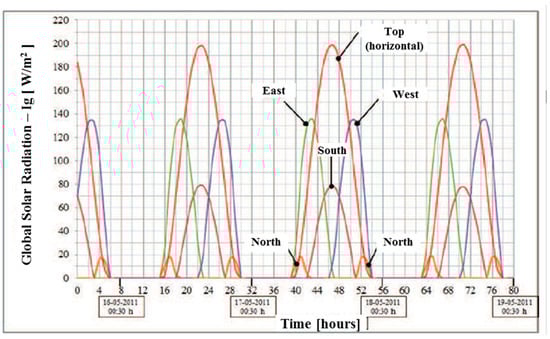
Figure 12.
Absorbed radiation, by a white surface (αs = 0.25), estimated by the solar model for Tl = 4.5, between 15 and 19 May.
Bearing in mind the influence of incident solar radiation on the temperatures recorded in the various points inside the test cells, it was felt necessary to bring the radiation values monitored on the 17th and 18th (with clouds) closer to the simulated values. The relationship between the monitored values and the values calculated by the model for a horizontal surface (with α = 1) was found, that is, the relationship between the values represented in Figure 7. Thus, the solar radiation calculated by the model and subsequently corrected (affected by the parameter that relates the monitored radiation to the radiation calculated for clear days), was estimated, having represented the values obtained in Figure 13 and Figure 14.
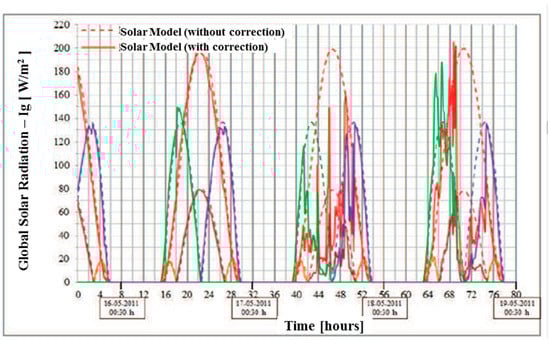
Figure 13.
Absorbed radiation, by a white surface (αs = 0.25), estimated by the solar model for Tl = 4.5 and corrected for the observed cloudiness, between 15th and 16th of May.
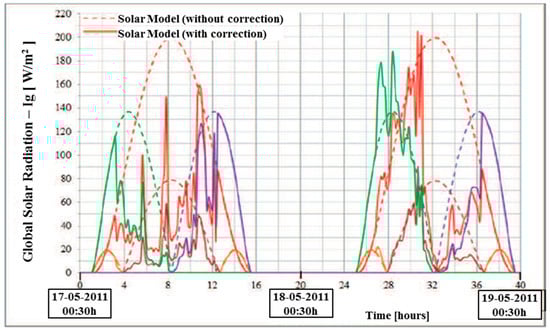
Figure 14.
Absorbed radiation, by a white surface (αs = 0.25), estimated by the solar model for Tl = 4.5 and corrected for the observed cloudiness, between 17th and 18th May.
During the numerical simulation, the two described situations were studied. Considering for the four days under analysis, both the results given by the solar radiation model and the affected results of the correction.
4.2. Simulation Results and Comparison with Experimental Data
The values obtained by the numerical simulation using the solar model are, for clear days, coincident with the values monitored experimentally. Thus, for the 15th and 16th of May, clear days, the numerical simulation translates, for each point inside the cells, the observed during the experimental campaign. However, on cloudy days, 17th and 18th May, the simulated values show slightly higher temperatures, with a variation from the monitored values that reaches ΔT ≈ 2 °C in REFM test cell and ΔT ≈ 1 °C in PCMM test cell. This difference was to be expected since the solar radiation values considered in the numerical simulation are higher than those actually observed on cloudy days (17th and 18th of May).
In an attempt to approximate the conditions admitted in the simulation to the real conditions of in situ exposure, the radiation estimated by the solar model was adjusted by a parameter that was able to translate the cloudiness recorded over the monitored days. Thus, as shown in Figure 9, the solar radiation of the first days (15th and 16th May) is practically unaffected, since they are clear days, since the remaining monitored days are affected by the correction parameter which is an average of 0.3 for the 17th of May and 0.6 for the 18th of May.
The results obtained and presented in Figure 15 and Figure 16 reflect the approximation made to the actual exposure conditions. Thus, both in the REFM and PCMM test cells, the simulated values for each point inside the cells approximate the values monitored during the 4 days of the experimental campaign, both for clear days and for the cloudy sky days.
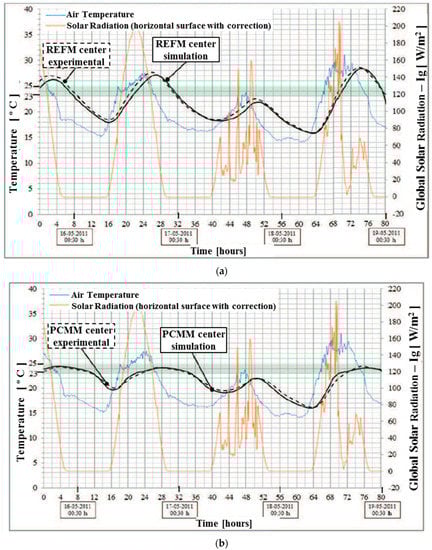
Figure 15.
In situ monitoring and numerical simulation of the temperatures in the center of (a) PCMM test cell and (b) REFM test cell, between 15th and 19th May.
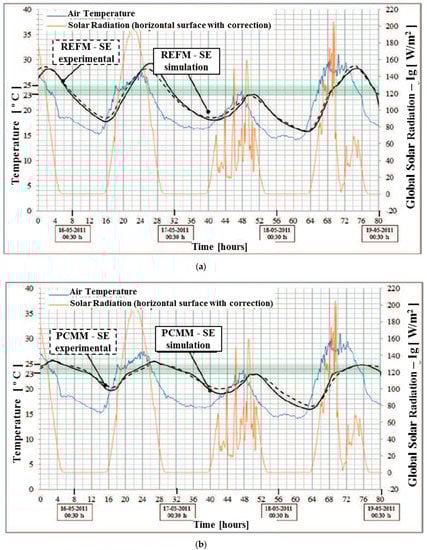
Figure 16.
In situ monitoring and numerical simulation of the temperatures in the cover of (a) PCMM test cell and (b) REFM test cell, between 15th and 19th May.
In summary, the coupling of the solar radiation model served to bring the simulation closer to the real exposure conditions of the cells monitored in situ. It was possible to observe, in the numerical simulation, the effect of solar radiation on indoor temperatures without discouraging the main objective of the simulation performed: to observe the different behavior between REFM and PCMM cells, that is, to observe the behavior of the materials of phase change.
5. Conclusions
The numerical resolution of the mathematical problem of heat transfer in PCM was validated by the similarity between the numerical simulation and experimental monitoring results.
The use of the solar radiation model allowed to simulate the effect of incident solar radiation on each face of the test cell (with different solar exposures) without neglecting the main objective of the recommended numerical simulation: the study of the action of PCM.
It was evident, in the numerical resolution of the heat transfer problem, similarly to that recorded experimentally, that the PCMs contribute to the conservation of indoor temperatures, ensuring a smaller fluctuation of indoor temperature, reducing peak indoor temperatures (maximum and minimum); and increasing the mismatch between indoor and outdoor temperatures.
The temperatures monitored inside the REFM and PCMM test cells during the experimental campaign were compared with the values resulting from the numerical simulation, using the finite element method using 3D discretization, together with the presented solar radiation model, and the results obtained revealed a significant coherence of values.
Even though the study presented herein cannot really be considered as truly representative of the global envelope of a building, its surface-to-volume ratio or its typical occupation in terms of people and furniture (which have inherent thermal mass), it provides good grounds for further simulations at building scale with high realism, and with particular concern to the effect of solar radiation on PCM effectiveness. In fact, the incidence of solar radiation, and the inherent heat intake are likely to support the demonstration that the activation of PCM is easier and more probable in sun-exposed parts of the building envelope and even help support the definition of potentially uneven distribution of PCM in the envelope as a whole. These would be important contributions towards optimized use of PCMs, especially tailored for specific parts of each building, duly assisted by the opportunities of detailed simulation that the increasing tendency of BIM use is bringing about in the construction industry (hence making the detailed 3D data available for interoperability matters).
Author Contributions
Conceptualization, A.V.S., M.A., A.S.G. and J.M.P.Q.D.; Methodology, A.V.S., M.A., A.S.G. and J.M.P.Q.D.; Software, A.V.S. and M.A.; Validation, A.V.S. and M.A.; Formal Analysis, A.V.S., A.S.G. and J.M.P.Q.D.; Investigation, A.V.S., M.A., A.S.G. and J.M.P.Q.D.; Resources, A.V.S., M.A., A.S.G. and J.M.P.Q.D.; Data Curation, A.V.S., M.A., A.S.G. and J.M.P.Q.D.; Writing Original Draft Preparation, A.V.S., M.A., A.S.G. and J.M.P.Q.D.; Writing Review & Editing, A.V.S., M.A., A.S.G. and J.M.P.Q.D.; Visualization, A.V.S., M.A., A.S.G. and J.M.P.Q.D. All authors have read and agreed to the published version of the manuscript.
Funding
This research received no external funding.
Conflicts of Interest
The authors declare no conflict of interest.
References
- Lane, G.A. Solar Heat Storage: Latent Heat Materials; CRC Press: Boca Raton, FL, USA, 1983. [Google Scholar]
- Sá, A.V.; Azenha, M.; de Sousa, H.; Samagaio, A. Thermal enhancement of plastering mortars with Phase Change Materials: Experimental and numerical approach. Energy Build. 2012, 49, 16–27. [Google Scholar] [CrossRef]
- Halawa, E.; Bruno, F.; Saman, W. Numerical analysis of a PCM thermal storage system with varying wall temperature. Energy Convers. Manag. 2005, 46, 2592–2604. [Google Scholar] [CrossRef]
- Hasan, A.; Sarwar, J.; Alnoman, H.; Abdelbaqi, S. Yearly energy performance of a photovoltaic-phase change material (PV-PCM) system in hot climate. Sol. Energy 2017, 146, 417–429. [Google Scholar] [CrossRef]
- Piselli, C.; Castaldo, V.L.; Pisello, A.L. How to enhance thermal energy storage effect of PCM in roofs with varying solar reflectance: Experimental and numerical assessment of a new roof system for passive cooling in different climate conditions. Sol. Energy 2019, 192, 106–119. [Google Scholar] [CrossRef]
- Kenisarin, M.; Mahkamov, K. Solar energy storage using phase change materials. Renew. Sustain. Energy Rev. 2007, 11, 1913–1965. [Google Scholar] [CrossRef]
- Kenisarin, M.; Mahkamov, K. Passive thermal control in residential buildings using phase change materials. Renew. Sustain. Energy Rev. 2016, 55, 371–398. [Google Scholar] [CrossRef]
- Kong, X.; Yao, C.; Jie, P.; Liu, Y.; Qi, C.; Rong, X. Development and thermal performance of an expanded perlite-based phase change material wallboard for passive cooling in building. Energy Build. 2017, 152, 547–5570. [Google Scholar] [CrossRef]
- Athienitis, A.K.; Liu, C.; Hawes, D.; Banu, D.; Feldman, D. Investigation of the thermal performance of a passive solar test-room with wall latent heat storage. Build. Environ. 1997, 32, 405–410. [Google Scholar] [CrossRef]
- Kuznik, F.; Virgone, J. Experimental investigation of wallboard containing phase change material: Data for validation of numerical modeling. Energy Build. 2009, 41, 561–570. [Google Scholar] [CrossRef]
- Stritih, U.; Tyagi, V.V.; Stropnik, R.; Aksoy, H.P.; Haghighat, F.; Joybari, M.M. Integration of passive PCM technologies for netzero energy buildings. Sustain. Cities Soc. 2018, 41, 286–295. [Google Scholar] [CrossRef]
- Cunha, S.; Lima, M.; Aguiar, J.B. Influence of adding phase change materials on the physical and mechanical properties of cement mortars. Constr. Build. Mater. 2016, 127, 1–10. [Google Scholar] [CrossRef]
- Soares, N.; Costa, J.J.; Gaspar, A.R.; Santos, P. Review of passive PCM latent heat thermal energy storage systems towards buildings’ energy efficiency. Energy Build. 2013, 59, 82–103. [Google Scholar] [CrossRef]
- Li, M.; Wu, Z.; Tan, J. Heat storage properties of the cement mortar incorporated with composite phase change material. Appl. Energy 2013, 103, 393–399. [Google Scholar] [CrossRef]
- Lee, K.O.; Medina, M.A.; Raith, E.; Sun, X. Assessing the integration of a thin phase change material (PCM) layer in a residential building wall for heat transfer reduction and management. Appl. Energy 2015, 137, 699–706. [Google Scholar] [CrossRef]
- Kong, X.; Lu, S.; Huang, J.; Cai, Z.; Wei, S. Experimental research on the use of phase change materials in perforated brick rooms for cooling storage. Energy Build. 2013, 62, 597–604. [Google Scholar] [CrossRef]
- Biswas, K.; Lu, J.; Soroushian, P.; Shrestha, S. Combined experimental and numerical evaluation of a prototype nano-PCM enhanced wallboard. Appl. Energy 2014, 131, 517–529. [Google Scholar] [CrossRef]
- Lu, S.; Tong, H.; Pang, B. Study on the coupling heating system of floor radiation and sunspace based on energy storage technology. Energy Build. 2018, 159, 441–453. [Google Scholar] [CrossRef]
- Abdullah, A.; Gassar, A.; Yun, G.Y. Energy Saving Potential of PCMs in Buildings under Future Climate Conditions. Appl. Sci. 2017, 7, 1219. [Google Scholar] [CrossRef]
- Abu-Hamdeh, N.H.; Alnefaie, K.A. Assessment of thermal performance of PCM in latent heat storage system for different applications. Sol. Energy 2019, 177, 317–323. [Google Scholar] [CrossRef]
- Zhu, N.; Wu, M.; Hu, P.; Xu, L.; Lei, F.; Li, S. Performance study on different location of double layers SSPCM wallboard in office building. Energy Build. 2018, 158, 23–31. [Google Scholar] [CrossRef]
- Bland, A.; Khzouz, M.; Statheros, T.; Gkanas, E.I. PCMs for Residential Building Applications: A Short Review Focused on Disadvantages and proposals for Future Development. Buildings 2017, 7, 78. [Google Scholar] [CrossRef]
- Bao, X.; Tian, Y.; Yuan, L.; Cui, H.; Tang, W.; Fung, W.H.; Qi, H. Development of high performance PCM cement composites for passive solar buildings. Energy Build. 2019, 194, 33–45. [Google Scholar] [CrossRef]
- Ahangari, M.; Maerefat, M. An innovative PCM system for thermal comfort improvement and energy demand reduction in building under different climate conditions. Sustain. Cities Soc. 2019, 44, 120–129. [Google Scholar] [CrossRef]
- Manie, J. (Ed.) DIANA TNO User’s Manual—Release 9.4.3. 2010. Available online: https://dianafea.com/manuals/d943/Diana.html (accessed on 15 June 2019).
- Ozisik, M.N. Heat Conduction, 2nd ed.; Wiley: New York, NY, USA, 1993. [Google Scholar]
- Kuznik, F.; Virgone, J.; Johannes, K. Development and validation of a new TRNSYS type for the simulation of external building walls containing PCM. Energy Build. 2010, 42, 1004–1009. [Google Scholar] [CrossRef]
- Rose, J.; Lahme, A.; Christensen, N.; Heiselberg, P.; Hansen, M. Numerical Method for Calculation Latent Heat Storage in Constructions Containing PCM. Available online: https://www.ucviden.dk/portal/files/7151416/Numerical%20Method%20for%20calculation%20Latent%20Heat%20Storage%20in%20Constructions%20Containing%20PCM.pdf (accessed on 15 February 2020).
- Zhang, Y.; Lin, K.; Jiang, Y.; Zhou, G. Thermal storage and nonlinear heat-transfer characteristics of PCM wallboard. Energy Build. 2008, 40, 1771–1779. [Google Scholar] [CrossRef]
- Silva, T.; Vicente, R.; Soares, N.; Ferreira, V. Experimental testing and numerical modelling of masonry wall solution with PCM incorporation: A passive construction solution. Energy Build. 2012, 49, 235–245. [Google Scholar] [CrossRef]
- Kheradmand, M.; Azenha, M.; de Aguiar, J.L.B.; Castro-Gomes, J. Experimental and numerical studies of hybrid PCM embedded in plastering mortar for enhanced thermal behaviour of buildings. Energy 2016, 94, 250–261. [Google Scholar] [CrossRef]
- Shafie-Khah, M.; Kheradmand, M.; Javadi, S.; Azenha, M.; de Aguiar, J.L.B.; Castro-Gomes, J.; Siano, P.; Catalão, J.P.S. Optimal behavior of responsive residential demand considering hybrid phase change materials. Appl. Energy 2016, 163, 81–92. [Google Scholar] [CrossRef]
- Shamsundar, N.; Sparrow, B.M. Analysis of multidimensional conduction phase change via the enthalpy model. J. Heat Transf. 1975, 97, 333–340. [Google Scholar] [CrossRef]
- Azenha, M. Numerical Simulation of the Structural Behavior of Concrete Since Its Early Ages. Ph.D. Thesis, Faculty of Engineering University of Porto, Porto, Portugal, 2009. [Google Scholar]
- Azenha, M. Comportamento do Betão nas Primeiras Idades. Fenomenologia e Análise Termo-Dinâmica. Master’s Thesis, Faculty of Engineering University of Porto, Porto, Portugal, 2004. [Google Scholar]
- Wang, Y.M.; Lean, J.L.; Sheeley, J.N.R. Modeling the Sun’s Magnetic Field and Irradiance since 1713. Astrophys. J. 2005, 625, 522–538. [Google Scholar] [CrossRef]
- Kopp, G.; Lean, J.L. A new, lower value of total solar irradiance: Evidence and climate significance. Geophys. Res. Lett. 2011, 38. [Google Scholar] [CrossRef]
- Abrantes, V. Análise Numérica e Experimental do Comportamento Térmico de Coberturas com Desvão. Master’s Thesis, Faculdade de Engenharia, Universidade do Porto, Porto, Portugal, 1986. [Google Scholar]
- Rapti, A. Atmospheric transparency, atmospheric turbidity and climatic parameters. Sol. Energy 2000, 69, 99–111. [Google Scholar] [CrossRef]
- Koenders, E.A.B.; Breugel, K.V. Direct Solar Radiation on Inclined Surfaces; Report, Delft University of Technology: Delft, The Netherlands, 1995. [Google Scholar]
- ISO. Building Materials and Products—Hygrothermal Properties—Tabulated Design Values and Procedures for Determining Declared and Design Thermal Values; CEN: Brussels, Belgium, 2007. [Google Scholar]
- Ministério das Obras Públicas, Transportes e Comunicações. Regulamento das Características de Comportamento Térmico dos Edifícios (RCCTE); Decreto-Lei no. 80/2006; DDiário da República: Lisbon, Portugal, 2006. [Google Scholar]
- LFC-FEUP. Available online: https://paginas.fe.up.pt/~dec/pt-pt/laboratorios/laboratorio-de-fisica-das-construcoes (accessed on 3 March 2020).
- Entrop, A.G.; Brouwers, H.J.H.; Reinders, A.H.M.E. Experimental research on the use of micro-encapsulated Phase Change Materials to store solar energy in concrete floors and to save energy in Dutch houses. Sol. Energy 2011, 85, 1007–1020. [Google Scholar] [CrossRef]
- Aguiar, R. INETI Synthetic Weather Data for Portugal. Available online: http://apps1.eere.energy.gov/buildings/energyplus/cfm/weather_data3.cfm/region=6_europe_wmo_region_6/country=PRT/cname=Portugal (accessed on 15 February 2020).
- Freitas, V.P.; Sousa, A.; Silva, J. Manual de Aplicação de Revestimentos Cerâmicos; APICER—Associação Portuguesa da Indústria de Cerâmica: Coimbra, Portugal, 2003. [Google Scholar]


© 2020 by the authors. Licensee MDPI, Basel, Switzerland. This article is an open access article distributed under the terms and conditions of the Creative Commons Attribution (CC BY) license (http://creativecommons.org/licenses/by/4.0/).