Abstract
The conformation of a ceramic piece follows the steps of preparing the raw material, molding, lamination, drying, and firing. Drying is a thermodynamic process of heat and mass transfer, with dimensional variations of the product that requires a large amount of energy. Ceramic materials when exposed to non-uniform drying may suffer cracks and deformations, reducing their post-drying quality. Thus, this work aimed to study the drying of industrial ceramic blocks in an oven with forced air circulation. Experiments were carried out to characterize the clay and drying of the ceramic block at temperatures ranging from 50 °C to 100 °C. Results of the chemical, mineralogical, granulometric, differential thermal, and thermogravimetric analysis of the clay, and heating kinetics, mass loss, and dimensional variation of the industrial ceramic block are presented and analyzed in detail. It was found that the clay is basically composed of silica and alumina (≈ 80.96%), with an average particle diameter of 13.36 μm. The study proved that drying at high temperature and low relative humidity of the air generates high rates of mass loss, heating, and volumetric shrinkage in the ceramic product, and high thermo-hydraulic stresses, which cause the appearance and propagation of cracks, gaps, and cleavages, compromising the final quality of the product.
1. Introduction
In the wide world, the ceramic sector is highly dependent on energy and raw materials available, both for production and for product transportation. The future of this sector finds several innovative applications in the areas of medicine (dental, oncology), sport (tennis, golf, skate), army (armor), construction (insulation, panels), electronics (iPod, GPS, mobile telephones), among others.
The ceramic sector generally uses clay as the main raw material for obtaining its products. Red clay ceramics are a class of materials that are often used in civil construction, in the form of structural blocks, tiles, solid bricks, rustic floors, pipes for sanitation, fillers (slab), green wall, hollow elements, and also expanded clay. In addition, it is present in household items, such as filters and pots. The name "red" is related to the presence of ferrous compounds, which develop a reddish color in the raw material.
This natural product almost always develops plasticity in a humid environment and hardens after drying and, even more so, after cooked [1]. This raw material appears in all types of rock formation (that commonly contain feldspar), from the oldest to the most recent formations, igneous and sedimentary of all types, consequently, its chemical, mineralogical, and physical characteristics vary widely, even between the layers of the same deposit clay [2,3].
From a chemical and mineralogical point of view, the clay consists essentially of hydrated aluminum silicates, sometimes also of iron and magnesium, usually crystalline, called clay minerals, it can still contain other minerals, organic matter, and soluble salts [4,5]. The properties of the clay are due to its intrinsic characteristics, such as: granulometry (high particle content with granulometry less than 2 μm); chemical and mineralogical composition (clay minerals and impurities present); and cation exchange capacity, resulting from isomorphic substitutions in the crystalline lattice of the clay minerals [6].
The manufacture of a clay ceramic product follows a series of steps that includes the exploration of deposits, pre-treatment of raw materials, homogenization, molding, drying, burning, and dispatch. From an industrial point of view, the drying operation is a delicate, complex, and important stage in the production chain of the ceramic industry. When the ceramic part is dry, it acquires a certain mechanical resistance that allows its manipulation during the manufacturing process. The mechanical resistance is higher or lower depending on parameters such as: the shape and thickness of the ceramic piece, type and content of clay, as well as the size and shape of the particles. During the cooking (firing) phase, the mineral components that make up the ceramic piece, at certain temperatures, undergo structural changes causing retractions or volumetric expansions of the body. The structures often collapse and, for relatively high temperatures, so-called high-temperature phases and glassy phases can be developed. For this reason, cooking provides a great increase in the mechanical resistance of ceramic pieces.
The drying operation is associated with losses of mass and variations in the dimensions of the ceramic piece. The occurrence of thermal and humidity gradients during the water elimination process, can cause thermal and water stresses that generate defects in the products, such as deformations and cracks, rendering useless or reducing the quality of the product. Moisture is responsible for the plasticity of the raw material in its conformation stage. However, for the rest of the process, moisture is harmful, since the piece, after the forming phase, cannot be heated up to the burning temperature without risking fracture [7].
It was experimentally observed that the higher the humidity with which the piece is made, the greater the shrinkage in drying. Considering this, it is clear that the retraction that the red ceramic pieces undergo during the drying step is a parameter of great technological importance, showing the importance of drying under total control, and in an optimized way.
Drying is a process of heat and mass transfer, through which the moisture of the solid is reduced, by supplying it with energy. The transport of moisture from the interior to the surface of the material can occur in the form of liquid and/or steam, depending on the type of product and the moisture present. Control of the dehumidification process and knowledge of the mechanisms of humidity movement are essential, since, with simulation and/or experimental data, optimum conditions can be obtained in the process, minimizing product losses and energy consumption [8,9,10].
When hot air comes in contact with the part, it transfers part of its thermal energy, which is used to raise the temperature of the wet part and transform the liquid inside the part into water steam, which in turn is received by the air that circulates around the piece. Incorporated into the air, the water steam increases its absolute humidity (water mass per unit mass of dry air). The remaining part of the thermal energy of the drying air is divided into two parts: one is transmitted to the product transport equipment, which has its temperature increased between the entrance and the exit of the dryer, and the other is lost to the outside, due to insufficient insulation and the lack of water tightness of the dryer (hot air leaks or cold air inlet). Thus, the useful energy effectively used to transform the liquid into water steam represents only a portion of the total energy provided by the drying air. The remaining is considered wasted energy. This usually results in a total thermal yield of the drying operation by convection of less than 60% [7].
The drying step is one of the most essential in the production process, both from the economic point of view and the final quality of the produced part. Uncontrolled drying can cause irreversible defects in the part produced, decreasing the productivity of the process and increasing operating costs [11]. In this stage, the average humidity found in ceramic products is reduced to values below 1%. The main objectives of this operation are to increase the mechanical resistance of the product, to guarantee the surface thermal uniformity, to distribute the humidity homogeneously in the parts, and to ensure that the discharge temperature remains constant over time [8].
When the production of ceramic pieces takes place on an industrial scale, a variable that must be taken into account is the consumption of energy spent throughout the production process. The consumption of thermal and electrical energy currently represents a large portion of the total production cost of these industries, being drying among the stages that consume the most energy [11]. To give an idea, in the production of bricks, the costs related to the use of energy represent 30% of the product final cost. Thus, understanding the mechanisms involved in drying allows, for example, better control over defects and how to avoid them [9], as well as guaranteeing a more energy-efficient process.
Several researchers have developed experimental and theoretical works related to the drying of clayey ceramic materials [12,13,14,15]. Unfortunately, the vast majority of works devoted to drying ceramic clay bricks are focused on the product on a small scale, and few are dedicated to products with industrial dimensions [16,17,18,19].
Clay ceramic products have been used for a long time at different applications, mainly as construction material in the shape of bricks, roof tiles, and blocks, among others. There are some reasons for use of these materials in building, including, for example, design variety, energy efficiency that promotes environmental thermal comfort, durability and reduced maintenance, good sound insulation, and can be adequately used for bushveld fire prone areas [20,21,22,23]. Unfortunately, none of these building materials are self-insulating, and certain thermal insulation measures are necessary in order to improve its thermal performance. Furthermore, according to the study in 2016, 39.5% of the worldwide energy was used to control the temperature in buildings, literature [24], and heat loss in buildings reached 60–80% of the total loss [25,26].
The thermal resistance is a parameter well known to quantify the resistance to heat flux through a brick, i.e., it is one stronger indicator of gain or loss of heat. This parameter is dependent on different effects such as shape, composition, porosity, and dimensions of the brick, which are internal effects, and external effects such as heat source supplied, which can see, for example, conduction, convection, or radiation, or yet a combination of them [27,28,29]. Other factors must be taken into consideration such as the fluid or solid on the inside and outside surfaces of all building elements, which provide modifications on the thermal conductivity of these building elements, and contribute or not as an insulating effect. The inverse thermal parameter is also called thermal transmittance and it is a measure of how easily heat will move through a wall. In this sense, several studies, namely done in the Faculty of Engineering, University of Porto—FEUP, Portugal [30], improved the geometry of blocks for masonry in a thermal perspective.
Despite the importance and diversity of clay ceramic products as building materials, no work has been mentioned in the literature related to the drying of structural clay blocks (in an industrial scale), including the analysis of the raw material used in its molding and drying performance in terms of an appropriated transient energy analysis and its use as thermal isolation.
So, this work fundamentally aims to experimentally study the drying of industrial ceramic bricks (compensator 07 (Cincera Ceramics, Santa Rita, Brazil)) in an oven, showing the impact of the drying conditions on the product quality and energy saving on the drying process. Several results of the moisture loss, heating, and volume variations transient behavior, heat transfer, and drying performance are shown. Aspects related to the characterization of the raw material for shaping these products (clay) are also addressed, which gives the research an innovative character. Those blocks can be optimized in terms of thermal performance, which is also a very important topic nowadays where energy savings are one of the first concerns in industry and also in thermal comfort in buildings. The idea is to help industry, specialists, engineers, and other technicians to make correct decisions in projects and design related to this interesting topic.
2. Materials and Methods
2.1. Clay Characterization
Clay is the raw material used in the manufacture of ceramic bricks produced by a company, located in the city of Santa Rita, Paraíba State, Brazil (see Figure 1).
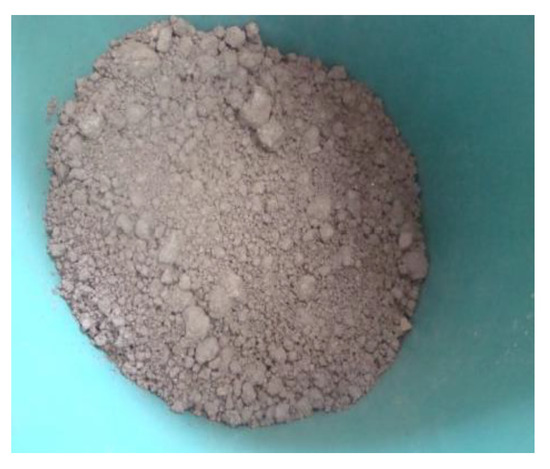
Figure 1.
“In natura” clay.
Before characterizing the clay, the material samples were dried in an oven at 100 °C for 24 h, and then fragmented in a hammer mill and separated using an ABNT No. 200 mesh sieve (0.074 mm). Then, the sieved clay samples were packed in plastic bags and placed in closed plastic containers, to avoid “re-humidification”. Immediately after these steps, the clay was characterized, in terms of chemical, mineralogical, granulometric, thermal, and gravimetric analysis.
2.1.1. Chemical Analysis
This test aims to determine the chemical composition of a raw material, providing the oxide present percentages and the fire loss values.
In this research, the clay sample was subjected to chemical analysis by X-ray fluorescence in EDX 720 equipment (Shimadzu Corporation, Tokyo, Japan). The X-ray fluorescence spectrometer semi-quantitatively determines the elements present in a given sample, by applying X-rays to the sample surface and subsequently analyzing the emitted fluorescent X-rays. The generation of X-rays is done through a tube with Rh target.
2.1.2. Mineralogical Analysis (by X-ray Diffraction)
It corresponds to one of the main characterization techniques. Plus, being possible to determine the unit cell parameters and points of symmetry, it enables the identification of the minerals present and their functions, and allows to evaluate the crystallographic characteristics of these minerals.
The X-ray diffraction equipment is basically an X-ray emitting tube, with a circular chamber, where the sample is located (goniometer), and a detector that receives the diffracted rays. The test consists of placing an X-ray beam (of known wavelength), on a thin layer of dust, which rotates in the center of the goniometer. Consequently, the beam diffracts and reflects at angles that are characteristic of the crystalline reticule, obtaining the corresponding diffractogram.
When characterizing clay minerals, the use of the X-ray diffraction technique is even more indicated, since the chemical analysis indicates the chemical elements present in the material, but not the way these elements are connected. Another advantage is that the diffractogram has a large number of peaks, which facilitates identification, especially in the case of mixtures, where some peaks can be overlapped.
With the characterization of the clay and the determination of its properties, it is easy to evaluate the improvements that must be made to change one or more properties of the ceramic body, which can cause substantial improvements in the properties of the final product. The analysis by X-ray diffraction of the clay sample, in dry form, was carried out with XRD 6000 equipment (Shimadzu Corporation, Tokyo, Japan). For this, Kα of Cu radiation (copper), electrical voltage of 40 kV, and electrical current of 30 mA were used. The goniometer speed was 2°/min and a step of 0.02°.
2.1.3. Particle Size Analysis
The granulometric analysis by laser diffraction uses the method of dispersion of particles in liquid phase associated with an optical measurement process through laser diffraction. In this method, the proportional relationship between laser diffraction and particle concentration and size is combined. It is a characterization technique widely used in several industrial sectors due to its operation simplicity, speed, and breadth of reading.
To perform the granulometric analysis, the clay was subjected to a laser diffraction test in a CILAS 1064 LD (2007) granulometer (Cilas, Orleans, France). The sieved sample was dispersed in 150 ml of distilled water with the deflocating sodium hexametaphosphate in the proportion indicated by the ABNT standard (Brazilian Association of Technical Standards).
The dispersion was prepared using a Hamilton Beach N5000 shaker (Hamilton Beach, Glen Allen, Virginia, USA) operating at a speed of 17,000 rpm for 20 min, followed by a 24-hour rest. After this period, the dispersion was again stirred for 5 min and placed in the CILAS model 1064 equipment, in wet mode, until reaching the ideal concentration of 150 diffraction units/area of incidence.
2.1.4. Differential Thermal (DTA) and Thermogravimetric (TGA) Analysis
It encompasses a series of techniques in which the physical properties of a substance and/or its reaction products are continuously measured as a function of temperature in a controlled thermal cycle. In Brazil, the differential thermal analysis (DTA) is often used in the study of clays, aiming mainly at the identification of the clay minerals present. This technique allows to observe the transformations that generate energy exchanges, due to physical or chemical phenomena. These energy exchanges can be endothermic (when heat absorption occurs) or exothermic (when heat is released). For each energy exchange, a peak appears on the graph and, according to the temperature of these peaks and their direction, the mineral, or the transformation that occurred with the sample, can be identified. Thus, the existence of minerals essential to the clays and which influence the final properties of the piece are identified.
Thermogravimetric analysis (TGA), on the other hand, determines the mass loss or gain that a sample suffers as a function of temperature and/or time. In this technique, the sample is heated in a controlled manner, to a predetermined temperature, with constant speed. This method of analysis complements the differential thermal analysis by distinguishing between reactions where mass loss occurs and reactions where it does not.
The differential thermal (DTA) and thermogravimetric (TGA) analyses of the samples were performed on BP Engenharia Model RB 3000 equipment (BP Engenharia, São Paulo, Brazil), operating at 12.5 °C/min and temperature of 1000 °C. The standard material used in the DTA tests was calcined aluminium oxide (Al2O3).
2.2. Kiln Drying Experiments
In order to verify the influence of temperature and relative humidity, on heating, moisture loss, and product dimensions, oven drying experiments were carried out. The clay ceramic product used in the experiments was compensator 07 (Figure 2). The green materials used in the experiments have average dimensions of 142 mm3 × 301 mm3 × 200 mm3.
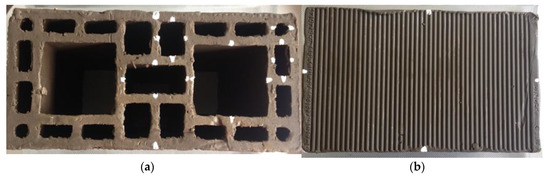
Figure 2.
View of the sealing block used in the test: (a) side; (b) top.
Before the samples (compensator 07) were placed in the oven, several product measurements were made, such as: width, length, height, diameter of the hole, and width and height of the rectangular holes (digital calliper with accuracy of 0.01 mm); mass (digital scale with an accuracy of approximately 1 gram); and temperature (infrared thermometer with scale from −50 °C to 1000 °C). In addition, temperature and relative humidity measurements of the drying air and ambient air outside the oven were made (digital thermohygrometer).
Then, the samples were taken inside the oven with mechanical air circulation and a digital temperature controller. In this process, the internal temperature of the stove was fixed at the desired value (50–100 °C) through the temperature controller. At pre-defined intervals, the sample was removed from the oven, making it possible to measure its temperature, mass, and dimensions.
The measurements were carried out at intervals of 5 min, 10 min, and 30 min, with 6 measurements each, for all pre-defined temperatures. Then, with an interval of 60 min until the dough was constant. Immediately after, the sample was subjected to drying for 24 h, at the same drying temperature, to obtain the equilibrium mass, and then for another 24 h at a temperature of 100 °C, to obtain the mass of the product completely dry.
Figure 3 illustrates the specimen model used in the experiments, with 3D and 2D images. Figure 4 illustrates a compensator scheme, indicating the point where the temperature on the compensator surface was measured, and the coding of the dimensions of the ceramic product used in the experiments.
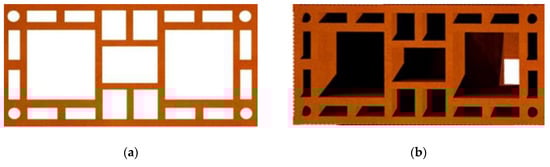
Figure 3.
Compensator 07 images: (a) 2D; (b) 3D.
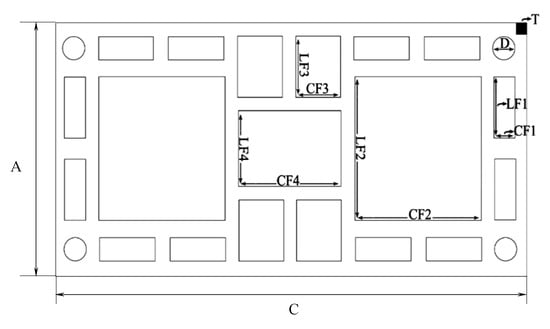
Figure 4.
Scheme of compensator 07 showing its dimensions.
2.3. Auxiliary Parameters
Supplementary calculations were developed, before and after drying all samples, to determine some important parameters, based on the dimensions, mass, and temperature of the ceramic block.
- (a)
- Mass of water
The amount of water obtained in each compensator (ma) and in each measurement time, was based on the value of the initial mass of the compensator (mo) and the mass of the completely dry compensator (ms), as follows:
- (b)
- Moisture content
The determination of the moisture content (on a dry basis) of the compensator (M) was carried out based on the value of the mass of each compensator in time (mt), and of the dry mass of the compensator (ms), as follows:
The determination of the instantaneous dimensionless moisture content of each compensator (M*) was performed based on the value of the moisture content (M), the equilibrium moisture content (Me), and the initial moisture content (Mo), as follows form:
- (c)
- Dimensional temperature
The determination of the instantaneous compensator temperature (θ*) was performed based on the temperature value as a function of time (θt), equilibrium temperature (θe), and initial temperature (θo), as follows:
- (d)
- Volume
The determination of the compensator 07 volume was carried out from the total volume (VT) and the holes’ volume (VF), as described in Equation (5):
where:
- (e)
- Relative humidity of drying air
The determination of the relative humidity (RH) of the drying air at different temperatures was made based on the average temperature and humidity of the ambient air outside the oven using the CATT® computational software (CATT, Gothenburg, Sweden).
Table 1 presents a summary of the experimental parameters for air and compensator 07. For drying air inside the oven, temperature, relative humidity, and speed are shown. For compensator 07, the initial and final moisture contents, initial and final temperatures, and drying time are presented.

Table 1.
Air and compensator experimental parameters on drying.
2.4. Drying Performance and Specific Energy Consumption
In order to evaluate the drying performance and specific energy efficiency of the process, some parameters were calculated at each time interval between two measures of mass and temperature of the clay block along the drying process. These include, the latent heat used to water evaporation (QL), the sensible heat used to heat the industrial block (QS), the total energy received by the industrial block (ET), the total heat flux received by the industrial block (QT), the specific moisture removal rate (SMR), the moisture removal rate (MR), and the specific energy consumption (SEC). They are the indicators of the drying process performance, which depend on the drying air conditions, and are given as follows:
where mwev represents the mass of evaporated water, cp is the specific heat capacity, hfg is the latent heat of water evaporation, and Δt corresponds to the time intervals between two consecutive measures. A robust and comprehensive discussion of SMR, MR, and SEC transient values obtained in the experiments will be provided in the Results and Discussion section.
3. Results and Discussion
3.1. Clay Characterization
3.1.1. Chemical Analysis
After analysis, the chemical composition of the ceramic mass used in the molding of the ceramic blocks showed the following percentages: SiO2, 57.533%, Al2O3, 23.426%, Fe2O3, 8.887%, K2O, 3.211%, MgO, 2.653%, CaO, 2.337%, TiO2, 1.126%, BaO, 0.338%, SO3, 0.222%, MnO, 0.136%, P2O5, 0.700%, SrO, 0.400%, Rb2O, 0.160%, ZnO, 0.014%, and C, 0.000%.
Analyzing the results, it appears that the clay has high levels of silica and alumina, in accordance to the literature. These components are mostly combined, forming aluminosilicates such as muscovite mica and kaolinite. These percentages are typical of kaolinite clay, influencing the clay impurity.
Because of the large amount of silica present in the clay, it can be said that the raw material has a large amount of non-plastic material, increasing the porosity of the compensator. Free silica in clay causes a reduction in plasticity and volumetric shrinkage.
Color is an important property of clay products. Several factors determine this color, but iron is usually its main determinant. The color of a clay product is influenced by the oxidation state of iron, the size of iron mineral particles, such as hematite and goethite, the firing temperature, the degree of vitrification, the proportion of alumina and magnesium in the ceramic, and the composition of the gases that come into contact with the material during burning. Ceramics that turn white after firing contain less than 1% Fe2O3. Ceramics that contain between 1% and 5% of Fe2O3 have rosacea color; the red ceramic contains 5% or more of Fe2O3 in its composition [31].
Calcium and magnesium oxides (MgO and CaO) can act as merges during the firing stage and tend to lower the refractoriness of the clays. They are generally from calcite, dolomite, gypsum, and are rarely found in refractory kaolinite clays. These oxides react with amorphous phases and form crystalline phases that are more stable in the moisture presence [32].
3.1.2. Mineralogical Analysis
The X-ray diffractogram (Figure 5) indicates that the clay consists of the following mineralogical phases: kaolinite (C), quartz (Q), and feldspar (F). Kaolinite is responsible for the development of plasticity when mixed with water. Quartz is responsible for the increase in porosity and the degree of hardness, thus decreasing the volumetric variation, moisture content, and plasticity. Feldspar increases the strength and durability of ceramics. In addition to clay minerals, clay can contain several impurities, such as: micas, iron and aluminum oxides and hydroxides, organic matter, and non-crystalline or amorphous chemical compounds.
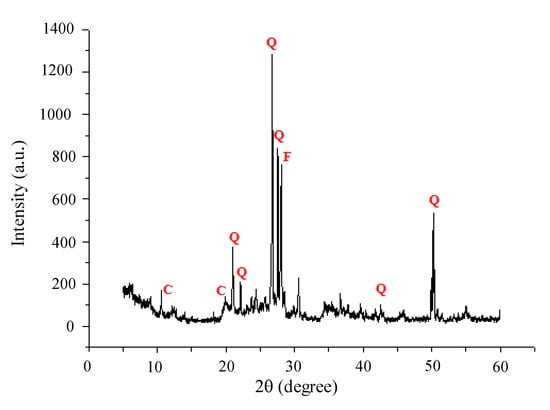
Figure 5.
Mineralogical analysis of the sample used in the experiment via X-ray diffractogram, kaolinite (C), quartz (Q), and feldspar (F).
Furthermore, quartz is considered the main impurity present in clays and acts as a non-plastic and inert raw material during firing. Gibsite provides increased refractoriness of clays and loss of mass during firing. The material’s refractoriness allows the acquisition of the characteristic of withstanding high temperatures, without deforming or melting. Goethite represents the content of iron present in the clay mass. Muscovite mica is a mineral that presents lamellar morphology and can cause defects in the ceramic [31].
3.1.3. Particle Size Analysis
Table 2 summarizes the values of the particle size distribution of the studied raw material. Analyzing these values, it appears that the clay has in its composition, high levels of silt and sand (81.6%) and a fraction of clay of 18.4%. The average particle diameter was 13.36 μm.
Table 2.
Air and compensator experimental parameters on drying.
Figure 6 shows the particle size distribution curve for the clay. After analyzing this figure, a large concentration of particles around 2–100 μm can be observed. The graph shows values of D10, D50, and D90 of 1.06 μm, 9.20 μm, and 33.60 μm, respectively.
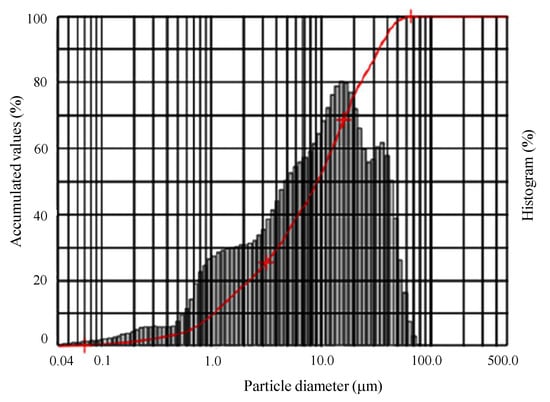
Figure 6.
Clay particle size distribution.
3.1.4. Thermal and Gravimetric Analysis
Figure 7 illustrates the thermo-differential and thermogravimetric curves of the studied clay, that is, the temperature variation and moisture loss as a function of temperature. Analyzing the curve of the differential thermal analysis (TDA), an endothermic peak is verified at 120 °C, characterized by the loss of free water; an exothermic band between 200 °C and 500 °C, characterized by the loss of organic matter; an endothermic peak at 547 °C characterized by the presence of hydroxyl, and a small variation between 900 °C and 1000 °C, due to the mullite nucleation.
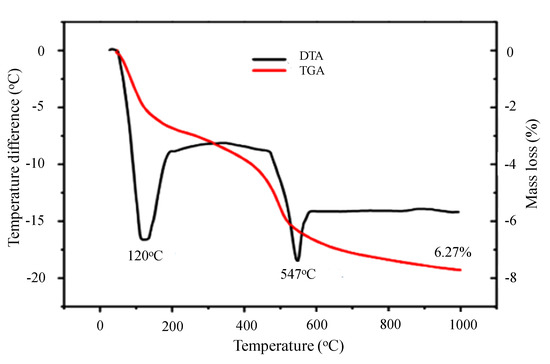
Figure 7.
Thermogravimetric (TGA) and thermo-differential (DTA) curves of the ceramic mass as a function of temperature.
Regarding the thermogravimetric curve (TGA), there is a loss of mass around 2%, corresponding to free water, between 0 and 170 °C; about 4% of organic matter, between 170 °C and 510 °C, and loss of 2% of hydroxyl, approximately, between 510 °C and 1000 °C.
3.2. Kiln Drying of Industrial Compensators
3.2.1. Drying and Heating Kinetics
Figure 8 illustrates the behavior of the moisture content and dimensionless temperature of the product, throughout the drying process. When analyzing the results, it appears that moisture loss and temperature rise on the surface of the ceramic block are higher in the initial 120 min of the process, and that the reduction in humidity occurs more slowly compared to its heating. The rate of humidity variation is directly influenced by the drying conditions, being directly proportional to the temperature of the drying air and inversely proportional to the process time. It was found that the higher the temperature, the greater the moisture loss and the shorter the total drying time until the sample reaches its hygroscopic equilibrium condition.
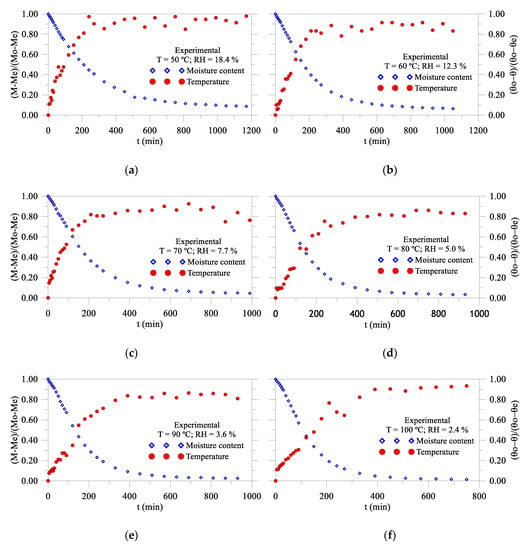
Figure 8.
Dimensional moisture content and temperature of the ceramic block as a function of drying time at different drying conditions: (a) T = 50 °C; (b) T = 60 °C; (c) T = 70 °C; (d) T = 80 °C; (e) T = 90 °C; (f) T = 100 °C.
However, very high temperature and lower relative humidity can have negative effects on drying. As the temperature in the sample fence is higher than inside the ceramic block, high water and thermal stresses can be generated inside the sample, making the appearance of cracks and deformations. These defects, generated by humidity and temperature gradients, can cause unacceptable tension and compression stresses, which drastically reduce the quality of the product at the end of the process [16,17,18,19,33,34].
3.2.2. Volumetric Variation Kinetics
The geometric shape also influences the drying kinetics. When the material is poured, the drying air has a better circulation inside it. Thus, the water contained within the material migrates to the surface more quickly, and the heat diffuses in the material in the opposite way, from the surface to the center of the material.
Figure 9 illustrates the transient volumetric retraction suffered by the samples in relation to their initial volume, due to the loss of moisture and heating during the drying process. Analyzing the results, there is a strong variation in the dimensions of the solid in the first 50 min of drying, tending to a constant value for long times. In addition, it is possible to observe the non-uniformity in the volumetric shrinkage, due to the pieces’ expansion and contraction, mainly in the final drying stages (t > 100 min). Similar behavior has been reported in the literature [16,34].
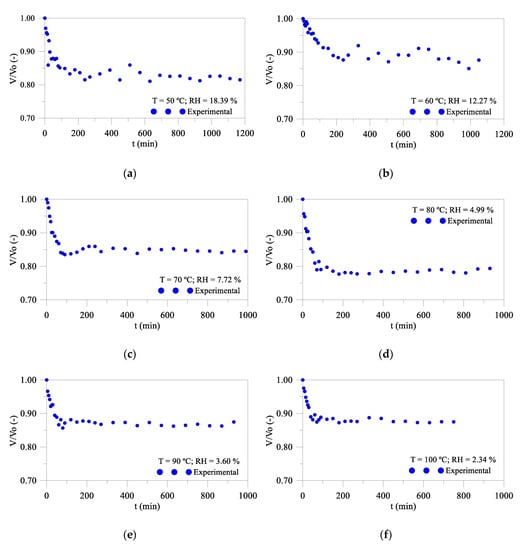
Figure 9.
Dimensional volume of the ceramic block as a function of drying time, at different drying conditions: (a) T = 50 °C; (b) T = 60 °C; (c) T = 70 °C; (d) T = 80 °C; (e) T = 90 °C; (f) T = 100 °C.
Table 3 shows the dimensions of the external parameters of the samples, before and after drying, and the absolute and percentage variations.
Table 3.
External geometric and gravimetric parameters of the ceramic block, before and after drying, at different temperatures.
The compensator volume varies, on average, 15.4%, with the greatest variation for a temperature of 80 °C (20.7%), due to cracks arising during the process. The width had a greater percentage variation (4.6%) in relation to the length and height, due to the amount of empty spaces (holes). Regarding the moisture content, when the temperature increased, there was an increase in the water removed from the product, reaching 100% of lost water (completely dry ceramic block), when using a drying temperature of 100 °C.
Table 4 presents the samples internal parameters dimensions before and after drying and their variations.
Table 4.
Internal geometric parameters of the ceramic block, before and after drying, at different temperatures.
After analyzing this table, a length variation between the holes of 4.33% is observed, having, on average, its greatest variation for a temperature of 60 °C. This variation was caused by the deformations that arose during the drying process for all pre-established temperatures. Its greatest variations occurred in the largest dimensions (holes 2 and 4), with an average variation of 7.06%.
Figure 10 illustrates the industrial ceramic block during the drying process for a temperature of 50 °C, in three different times (at the beginning of the drying process, t = 0 min; in an intermediate stage of the drying process, t = 30 min, and at the end of the drying process, t = 1170 min).
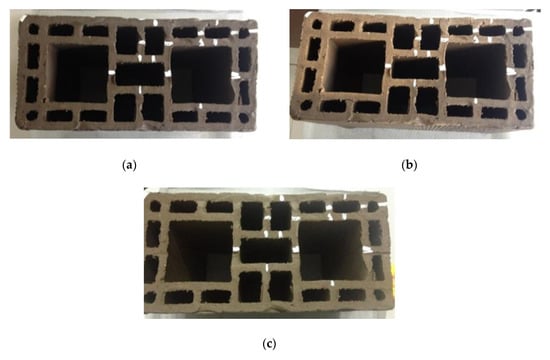
Figure 10.
Compensator 07 during the drying process at 50 °C: (a) t = 0 min; (b) t = 30 min; (c) t = 1170 min.
Analyzing the figure, it is noticed that at the beginning of the process, there are no cracks, appearing small cracks during the process and, apparently, disappearing in the final stage of the process. However, as the temperature increases, the cracks become more visible.
Figure 11 illustrates the samples during the drying process (t = 0.30 min and t = 750 min) for a temperature of 100 °C. It is noticed in this test that cracks appear more frequently than in cases where the drying temperature is lower, showing that drying at a constant high temperature results in a defective material.
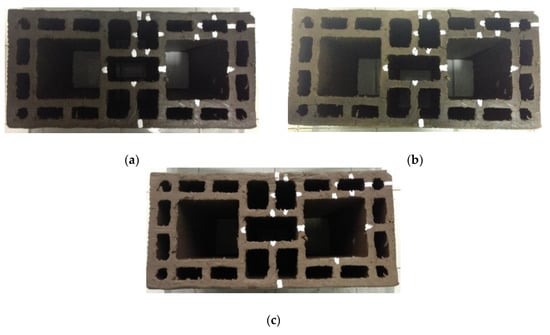
Figure 11.
Images of compensator 07 during the drying process at 100 °C: (a) t = 0 min; (b) t = 30 min; (c) t = 750 min.
In general, it is clear that when drying is done very quickly, the water removed from the product is uncontrolled, which can cause structural damage such as cracks, deformations, warping and, consequently, a great loss of the product. In the first minutes of the process, cracks appear for all pre-established temperatures. After a certain amount of time, these fissures start to disappear, apparently, but in practice they only diminished.
The outer and inner layers of the product dry faster than the center, contracting first, producing a reduction in the body dimensions and consequently in its volume. This reduction in volume corresponds, in some cases, exactly to the loss of water by the evaporation process. However, the heat transfer also influences the process, increasing the body volume, thus alternating the value of this parameter for long drying times, where the volumetric contraction of the material, due to the loss of water is practically insignificant.
3.2.3. Drying Performance
In this research, three parameters (SMR, MR, and SEC) were determined from the evaporated water amount and energy received by the clay block during in the experiments, in order to verify drying performance. In essence, the MR parameter is equivalent to the moisture removal rate (drying rate).
Figure 12 illustrates the effects of drying conditions on the SMR (kilograms of evaporated water per kilowatt-hour), MR (kilograms of evaporated water per hour), and SEC (kilojoule per kilograms of evaporated water) parameters during the drying process of the clay ceramic blocks. From the analysis of these figures, it is clear that the drying conditions affect these parameters. It can be seen that the SMR increases in the few minutes of the process and decreases as a function of the time, especially for higher air temperature and lower relative humidity. The highest and lowest SMR obtained were 1.55 kg/kWh (80 °C, 270 min elapsed time) and 0.58 kg/kWh (70 °C, 5 min elapsed time), respectively, as shown in Figure 12a. Similar transient behavior was verified for the MR parameter. The maximum value of the MR parameter achieved in the experiments was 0.444 kg/h (100 °C, 90 min elapsed time) as shown in Figure 12b. Unlike the SMR and MR parameters, the SEC parameter showed an increased behavior as a function of the time, reaching highest value of 6190.24 kJ/kg (70 °C, 5 min elapsed time) and lowest value of 2308.06 kJ/kg (90 °C, 80 min elapsed time), as shown in Figure 12c, during the drying.
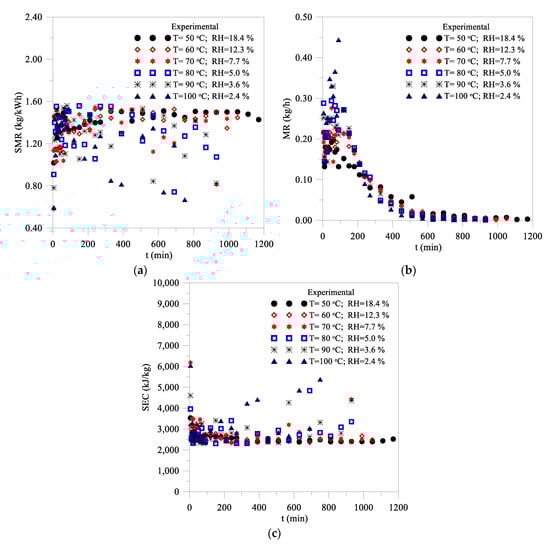
Figure 12.
Transient behavior of the drying performance parameters for different air conditions: (a) SMR; (b) MR; (c) SEC.
Furthermore, by analyzing other thermal parameters, it was verified that the highest instantaneous latent heat used for water evaporation and total energy received by the clay block obtained in the experiments were 195.40 kJ (330 min elapsed time) and 203.89 kJ (120 min elapsed time), respectively, in T = 50 °C, and 243.49 kJ (150 min elapsed time) and 396.32 kJ (120 min elapsed time), respectively, in T = 100 °C. The highest instantaneous heat flux used for water evaporation and heat the clay block were obtained in the few minutes of drying: 0.21 kW (T = 50 °C) and 0.44 kW (T = 100 °C), both at 5 min elapsed time.
Table 5 summarize all drying performance parameters based on their arithmetic mean. By analyzing the obtained results, it can be seen that, almost all parameters increase with increased temperature, except the SMR parameter, which showed a decreasing behavior as the air temperature is increased. It can be verified that the latent heat ranged from 92.4% (50 °C) to 76.9% (100 °C) of the total energy received by the clay block. Since that a high SMR value indicates that the drying process is efficient (higher energy performance) and has lower energy consumption, a high MR value indicates that the drying process is faster (lower drying time) and can provoke lower product quality (see Figure 11), and high SEC value indicates that the drying process is less efficient (lower energy performance) and has higher energy consumption, it can be noticed as the best drying condition: temperature 80 °C and relative humidity 5.0%, in the range of drying conditions established in this research. The beneficial effect due to the moderated temperature and relative humidity is related to the moderate drying rate and energy saving, thus, resulting in good quality and low cost of the clay product. It obvious that other better drying conditions can be analyzed, for example, high relative humidity and temperature, however, the total drying time is increased.
Table 5.
Average values of the drying performance parameters for different air conditions.
According to literature, in the brick production, the energy consumption is very high, ranging from 0.54 MJ/kg to 3.14 MJ/kg, depending on the efficiency of the kiln and type of fuel used for heat production. Unfortunately, it is the firing and drying processes which are responsible for the largest part of the energy consumption [3,35]. Then, it is obvious that the results obtained in this research are in concordance with the literature.
4. Block Thermal Behavior for Applications in Buildings
The ceramic sector needs interesting solutions that can be optimized in terms of thermal behavior and mechanical performance. The industrial ceramic block described and studied here is commonly used in construction and particularly in Brazil. Then, innovative research in this area is of paramount importance.
In view of the comments cited in the text, one question can be formulated. Is a good thermal insulator, the brick studied in this research? In general, clay brick has better insulating capabilities than other building materials. In addition to these comments, the building element studied is this research presents good thermal characteristics, which can help to reduce heat transfer through it. For example, it presents good mechanical performance and increased mechanical resistance, and it can help maintain the interior temperature of the building approximately constant in summer or winter days and, thus, increase thermal comfort (better thermal insulation efficiency). Thus, it can be used as an excellent alternative for building construction.
It can be said that the blocks here presented, Figure 2, Figure 3, Figure 4, Figure 10 and Figure 11, display air cavities that will contribute to a better thermal performance. It can be noticed that, despite the need of thermal isolation for accomplishing thermal standards U-values (sometimes referred to as overall heat transfer coefficient or thermal transmittance), in several countries and climates, there are some places where, considering the stable and moderate climate (as an example some places in Brazil), the optimized blocks can be adequate to guarantee a good thermal performance.
In this sense, some technical and economic benefits of the clay block here studied, which means lower building costs, are cited below:
- (a)
- Low thermal transmittance and high thermal resistance due to the original shape of the brick, which includes different cavities (holes and rectangular prisms). However, we state that results related to these parameters were not effectively obtained and will be subject of new research;
- (b)
- Low porosity, so, the brick has low water absorbability, thus reducing many troubles due to negative environmental action (for example, rain and wet soil);
- (c)
- The brick was constructed by extrusion. Because of the shape of the brick, it is possible, for example, to fill the external void space with air or another isolating material, and thus, to reduce thermal transmittance easily.
It is very useful to reduce extreme heat transfer due to action of a thermal sink. When the appropriate procedure is used, the brick slowly releases the stored energy over a long time. The net result is that the temperature within the building remains almost stable within a comfortable thermal condition, so, avoiding the occupant’s desire to turn on the air conditioning system. Adequate designing and constructing of an energy efficient building can substantially minimize the amount of energy consumed. One strategy is to incorporate different isolating materials (especially that lighter weight) into the void space (holes) of the brick. Some isolating materials such as mineral wool or polystyrene beads can be used, however, if the wall has a risk of flooding, polyurethane foam may sometimes be used [24]. Besides, larger cavities are more suitable for moisture drainage and drying as extreme climate conditions are applied, so, the material studied here is in consonance with this issue.
The added thermal materials have as the main characteristic, to absorb thermal energy from the sun during the day and to emit it out as the temperature drops in the night, and it becomes highly effective at regulating temperatures within the building. The idea is to obtain a new brick of higher thermal and mechanical performance. This way, a perfect combination of materials is obtained, which will demonstrate a significant contribution to research and innovation in the building construction sector. As a result of this procedure, we have modern construction (low-energy demand) and passive building, increase in the energy efficiency of the composed material; lower production costs, space savings, increased compression strength of the bricks, and sometimes sound propagation reduction through it. This procedure becomes more useful, especially is situations no brickwork on the outside of the building, as for example, cement plaster.
5. Conclusions
Analyzing the experimental data of clay characterization and drying of industrial ceramic blocks, it can be concluded that:
- (a)
- Regarding the chemical, mineralogical, granulometric, thermal, and gravimetric clay characterizations, it was found that:
- -
- The raw material presents characteristic of red clay, prevailing silica (57.53%), alumina (23.43%), and iron oxide III (8.89%), being basically constituted of kaolinite, quartz, and feldspar, with high silt content (80.09%), a percentage of 1.51% sand, and a fraction of clay of 18.4%.
- -
- Regarding the thermogravimetric curve of the clay, there was a loss of 2% of mass, between 0 and 170 °C, a loss of 4% of organic matter, between 170 °C and 510 °C, and loss of hydroxyl in temperatures above 510 °C.
- -
- Regarding the thermo-differential curve of the clay, endothermic peaks were detected due to water loss, at 120 °C, and the presence of hydroxyl, at a temperature of 547 °C.
- (b)
- Regarding the drying of the ceramic blocks in an oven, it was found that:
- -
- Drying air parameters such as relative humidity and temperature directly affect drying kinetics and the heating of the wet solid. For lower temperatures and higher relative humidity of the drying air, the rates of drying, heating, and dimensional variations are lower, reducing the risk of defects in the product, post-drying.
- -
- Drying at high temperatures and low relative humidity of the air, generate high rates of water loss, temperature rise, and volumetric retraction of the ceramic block, which can generally cause the propagation of cracks, which can compromise the quality and the product’s ability to resist to compression stresses when in operation.
- -
- The product showed an almost linear shrinkage in the first 60 min in all drying conditions, with oscillations for long times, due to the successive heating and cooling of the product, during measurements.
- -
- The industrial compensator presented a volumetric variation of 15.37%, with a temperature of 80 °C being the greatest variation (20.7%). On average, its moisture content has decreased by more than 99%.
- (c)
- Regarding the drying performance, it was found that:
- -
- The major portion of the energy received by the clay block is related to latent heat for water evaporation.
- -
- The total energy received by the wet clay block increases as the air temperature is increased.
- -
- Instantaneous SMR and MR parameters have shown decreasing behavior as a function of the time, opposite to the SEC parameter, which increased along the process, in all drying conditions.
- -
- When the temperature ranged from 50 °C to 100 °C, the average values of the SMR, MR, and SEC parameters ranged from 1.408 kg/kWh, 0.096 kg/h, and 2576.905 kJ/kg to 1.212 kg/kWh, 0172 kg/h, and 3172.534 kJ/kg, respectively.
- -
- Based on the visual analysis of the brick at different moments of drying, and the SMR, MR, and SEC performance parameters, the best drying conditions recommended are air temperature 80 °C and relative humidity 5.0%.
Author Contributions
All the authors contributed to the development, analysis, writing, and revision of the paper. All authors have read and agreed to the published version of the manuscript.
Funding
This work was supported by: Base Funding-UIDB/04708/2020 and Programmatic Funding-UIDP/04708/2020 of the CONSTRUCT-Instituto de I & D em Estruturas e Construções-funded by national funds through the FCT/MCTES (PIDDAC) and CNPq, CAPES and FINEP (Brazilian Research Agencies).
Acknowledgments
The authors would like to thank to the Materials Technology Laboratory, from the Materials Engineering Department, and the Experimental Laboratory of Thermal and Fluids, from the Mechanical Engineering Department, both from the Federal University of Campina Grande (Brazil), for the research infrastructure.
Conflicts of Interest
The authors declare no conflict of interest.
References
- Gomez, R.S.; Porto, T.R.N.; Magalhães, H.L.F.; Moreira, G.; André, A.M.M.C.N.; Melo, R.B.F.; Lima, A.G.B. Natural gas intermittent kiln for the ceramic industry: A transient thermal analysis. Energies 2019, 12, 1568. [Google Scholar]
- Ombaka, O. Characterization and classification of clay minerals for potential applications in Rugi Ward, Kenya. African J. Environm. Sci. Technol. 2016, 10, 415–431. [Google Scholar]
- Kočí, V.; Scheinherrová, L.; Madeřa, J.; Keppert, M.; Suchorab, Z.; Łagód, G.; Černý, R. Experimental and computational study of thermal processes in red clays exposed to high temperatures. Energies 2020, 13, 2211. [Google Scholar] [CrossRef]
- Gualtieri, A.F.; Ricchi, A.; Gualtieri, M.L.; Maretti, S.; Tamburini, M. Kinetic study of the drying process of clay bricks. J. Therm. Anal. Calorim. 2016, 123, 153–167. [Google Scholar] [CrossRef]
- Vieira, C.M.F.; Morais, A.S.C.; Monteiro, S.N.; Delaqua, G.C.G. Industrial test of heavy clay ceramic incorporated with fluorescent lamp waste. Cerâmica 2016, 62, 376–385. (In Portuguese) [Google Scholar] [CrossRef]
- Andrade, M.C.; Sampaio, J.A.; Luz, A.B.; Buoso, A. RMIs: Rocks and minerals for ceramic coating. In Industrial Rocks and Minerals in Brazil: Uses and Specifications, 2nd ed.; CETEM/MCTI: Rio de Janeiro, Brazil, 2008; pp. 723–745. (In Portuguese) [Google Scholar]
- Mota Neto, J. Simultaneous control of temperature and stoichiometric applied to a vertical dryer ceramic feeded with natural gas. Master’s Thesis in Mechanical Engineering, Federal University of Rio Grande do Sul, Rio de Janeiro, Brazil, 2008. (In Portuguese). [Google Scholar]
- Silva, W.P.; Silva, C.M.D.P.S.; Silva, L.D.; Farias, V.S.O. Drying of clay slabs: Experimental determination and prediction by two-dimensional diffusion models. Ceram. Int. 2013, 39, 7911–7919. [Google Scholar] [CrossRef]
- Oliveira, B.F.; Silva, M.A.; Freitas, M.S. Drying of Ceramic Materials; Undergraduate Report; State University of the Norte Fluminense Darcy Ribeiro: Campos dos Goytacazes, RJ, Brazil, 2010. (In Portuguese) [Google Scholar]
- Vasić, M.; Radojević1, Z. Non isothermal drying process optimisation—Drying of clay tiles. IOP Conf. Ser. Mater. Sci. Eng. 2015, 95, 012025. [Google Scholar] [CrossRef]
- Silva, L.D.; Silva, W.P.; Silva, C.M.D.P.S.; Farias, V.S.O. Description of drying ceramic plates by a diffusion model. Cerâmica 2013, 59, 409–416. [Google Scholar] [CrossRef]
- Lopez, E.M.; Cortes, L.L. Moisture transfer analysis during drying of brick by temperature and relative humidity profiles. Eur. Sci. J. 2012, 9, 109–122. [Google Scholar]
- Silva, W.P.; Farias, V.S.O.; Neves, G.A.; Lima, A.G.B. Modeling of water transport in roof tiles by removal of moisture at isothermal conditions. Heat Mass Transf. 2012, 48, 809–821. [Google Scholar] [CrossRef]
- Van der Zanden, A.J.J.; de Wit, M.H. A procedure to measure the diffusion coefficient of water in brick as a function of the water concentration. Dry. Technol. 2012, 30, 526–534. [Google Scholar] [CrossRef]
- Telljohann, U.; Junge, K.; Specht, E. Moisture diffusion coefficients for modeling the first and second drying sections of green bricks. Dry. Technol. 2008, 26, 855–863. [Google Scholar] [CrossRef]
- Silva, J.B.; Almeida, G.S.; Lima, W.C.P.B.; Neves, G.A.; Lima, A.G.B. Heat and Mass Transfer and Volume Variations during Drying of Industrial Ceramic Bricks: An Experimental Investigation. Defect Diff. Forum 2012, 326, 267–272. [Google Scholar] [CrossRef]
- Araújo, M.V.; Santos, R.S.; Silva, R.M.; Nascimento, J.B.S.; Santos, W.R.G.; Lima, A.G.B. Drying of Industrial Hollow Ceramic Brick: A Numerical Analysis Using CFD. Defect Diffus. Forum 2019, 391, 48–53. [Google Scholar] [CrossRef]
- Araújo, M.V.; Pereira, A.S.; Oliveira, J.L.; Brandão, V.A.A.; Brasileiro Filho, F.; De, A.; Silva, R.M.; Lima, A.G.B. Industrial Ceramic Brick Drying in Oven by CFD. Materials 2019, 12, 1612. [Google Scholar] [CrossRef]
- Araújo, M.V.; Correia, B.R.B.; Brandão, V.A.A.; Oliveira, I.R.; Santos, R.S.; Oliveira Neto, G.L.; Silva, L.P.L.; Lima, A.G.B. Convective Drying of Ceramic Bricks by CFD: Transport Phenomena and Process Parameters Analysis. Energies 2020, 13, 2073. [Google Scholar] [CrossRef]
- Muñoz, P.; Morales, M.P.; Mendívil, M.A.; Juárez, M.C.; Muñoz, L. Using of waste pomace from winery industry to improve thermal insulation of fired clay bricks. Eco-friendly way of building construction, Constr. Build. Mater. 2014, 71, 181–187. [Google Scholar] [CrossRef]
- Zukowski, M.; Haese, G. Experimental and numerical investigation of a hollow brick filled with perlite insulation. Energy Build. 2010, 42, 1402–1408. [Google Scholar] [CrossRef]
- Morales, M.P.; Juárez, M.C.; López-Ochoa, L.M.; Doménech, J. Study of the geometry of a voided clay brick using rectangular perforations to optimize its thermal properties. Appl. Thermal Eng. 2011, 31, 2063–2065. [Google Scholar] [CrossRef]
- Bai, G.-L.; Du, N.-J.; Xu, Y.-Z.; Qin, C.-G. Study on the Thermal Properties of Hollow Shale Blocks as Self-Insulating Wall Materials. Adv. Mater. Sci. Eng. 2017, 2017, 9432145. [Google Scholar] [CrossRef]
- Abu-Jdayil, B.; Mourad, A.-H.; Hittini, W.; Hassan, M.; Hameedi, S. Traditional, state-of-the-art and renewable thermal building insulation materials: An overview. Constr. Build. Mater. 2019, 214, 709–735. [Google Scholar] [CrossRef]
- Meng, X.; Yan, B.; Gao, Y.; Wang, J.; Zhang, W.; Long, E. Factors affecting the in situ measurement accuracy of the wall heat transfer coefficient using the heat flow meter method. Energy Build. 2015, 86, 754–765. [Google Scholar] [CrossRef]
- Meng, X.; Luo, T.; Gao, Y.; Zhang, L.; Shen, Q.; Long, E. A new simple method to measure wall thermal transmittance in situ and its adaptability analysis. Appl. Thermal Eng. 2017, 122, 747–757. [Google Scholar] [CrossRef]
- Gualtieri, M.L.; Gualtieri, A.F.; Gagliardi, S.; Ruffini, P.; Ferrari, R.; Hanuskova, M. Thermal conductivity of fired clays: Effects of mineralogical and physical properties of the raw materials. Appl. Clay Sci. 2010, 49, 269–275. [Google Scholar] [CrossRef]
- Jain, M.; Pathak, K.K. Thermal modelling of insulator for energy saving in existing residential building. J. Build. Eng. 2018, 19, 62–68. [Google Scholar] [CrossRef]
- Ozturk, S.; Sutcu, M.; Erdogmus, E.; Gencel, O. Influence of tea waste concentration in the physical, mechanical and thermal properties of brick clay mixtures. Constr. Build. Mater. 2019, 217, 592–599. [Google Scholar] [CrossRef]
- Sousa, H.; Sousa, L.; António, C.; Castro, C. Optimization of the geometry of blocks for masonry in a thermal perspective. In Proceedings of the National Construction Conference 2004—2nd National Construction Congress, Porto, Portugal, 13–15 December 2004; Faculty of Engineering, University of Porto: Porto, Portugal, 2004; pp. 479–484. [Google Scholar]
- Coutinho, N.C.; Vieira, C.M.F. Characterization and incorporation of MSWI ash in red ceramic. Cerâmica 2016, 62, 249–255. [Google Scholar] [CrossRef]
- Silva, V.S. Heat and Mass Transfer in Materials with Complex Shape via Lumped Analysis Method. Case Study: Drying of Ceramic Materials. Ph.D. Thesis, Federal University of Campina Grande, Campina Grande, Brazil, 2016; p. 198f. [Google Scholar]
- Nascimento, J.J.S.; Lima, A.G.B. Experimental Drying of Ceramics Bricks Including Shrinkage. Defect Diffus. Forum 2015, 365, 106–111. [Google Scholar] [CrossRef]
- Silva, J.B.; Almeida, G.S.; Lima, W.C.P.B.; Neves, G.A.; Lima, A.G.B. Heat and mass diffusion including shrinkage and hygrothermal stress during drying of holed ceramics bricks. Defect Diffus. Forum 2011, 312, 971–976. [Google Scholar] [CrossRef]
- Murmu, A.L.; Patel, A. Towards sustainable bricks production: An overview. Constr. Build. Mater. 2018, 165, 112–125. [Google Scholar] [CrossRef]


© 2020 by the authors. Licensee MDPI, Basel, Switzerland. This article is an open access article distributed under the terms and conditions of the Creative Commons Attribution (CC BY) license (http://creativecommons.org/licenses/by/4.0/).