Abstract
The energy consumption of sheep milk cooling systems (MCSs) was quantified in this study to provide original information filling a literature gap on the impact of sheep milk cooling on the energy and economic balance in dairy farms. Performance and energy monitoring tests were conducted simultaneously on 22 MCSs in Sardinia (Italy). The results determined the cooling time as a function of the performance class and number of milkings. The Energy Utilization Index (EUI) was applied to measure the energy required to cool down the milk and estimate the incidence on its price. The average EUI was 1.76 kWh 100 L−1 for two-milkings and 2.43 kWh 100 L−1 for four-milkings MCSs, whereas the CO2 emissions ranged from 998 to 1378 g CO2 100 L−1 for two- and four-milkings MCSs, respectively. The estimated energy consumption for the storage of refrigerated sheep milk was 0.12 kWh 100 L−1. The malfunctioning MCSs averagely consumed 31% more energy than regular systems. The energy cost for cooling accounted for 0.61% on the current sheep milk price in Italy. Based on the analysis, the reported EUI values can be used as a preliminary indicator of the regular operation of MCSs.
1. Introduction
The progress of dairy farming has been accompanied by increases in the energy demand and application of different energy sources that change depending on the structural characteristics of the farm [1]. Rationalizing energy consumption and applying renewable energy sources, especially in remote areas where grid power is not available, reduce farming costs and improve the competitiveness of dairy farms [2]. The energy consumption and efficiency of the breeding system can be estimated considering both direct (fuels, lubricants, electricity, gas, etc.) and indirect components, as the energy required by the production factors [3]. Alternately, only the direct electric and thermal energy consumption can be considered, identifying the most demanding operations. In dairy farms the largest impact is the milk cooling system (MCS), accounting for 31–43% of the total energy consumed in the milking parlour, followed by the electric boiler for hot water used for washing (23–27%), and the vacuum pump for milking (15–20%), whereas other users have less influence on the energy balance [4,5]. However, when the milking operation is automatized, the main electricity consumers are the milking unit and the compressor, which can reach 35–40% of yearly operational costs [6]. The cooling equipment should ensure the preservation of the milk quality and safety, by inducing a stasis of the bacterial multiplicative effect, which is inhibited completely at 4 °C [7,8]. Cooling is not a sanitary process but only a stabilization of the microbial charge. As a consequence, all practices preventing the initial contamination should be used, both during milking and cooling. The cooling rate may affect the sensory properties and the pasteurized shelf life, especially when the storage time exceeds 48 h [9,10].
The energy efficiency indicators are parameters used for the identification of critical operations expressed in terms of energy price (EP), that is, the energy needed to produce 1 L of milk [3,11]. When the indirect energy for the production of a unit cannot be calculated, the Energy Utilization Index (EUI) is applied. The EUI is the total energy consumed for each animal bred (kWh head−1) or unit of marketable product (kWh L−1 or kWh 100 L−1 of milk) [12,13]. However, the EUI available in literature refers to cow dairy farms and does not present exhaustive data concerning either the energy consumption for cooling sheep milk or the incidence of breeding sheep on the overall energy demand, even though the technologies for sheep milk cooling are similar. In fact, the MCSs for sheep milk are characterized by the same refrigeration technologies, but usually with rated volumes considerably lower (around or under 1000 L) and a top hatch for manual washing (Figure 1).
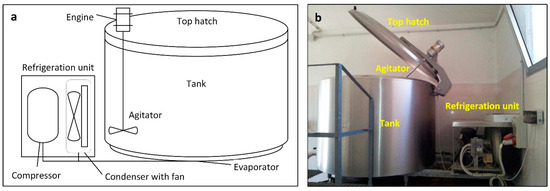
Figure 1.
Scheme of a common milk cooling system used for sheep milk (a) and a real milk cooling system where the main components1 are highlighted (b). The energy consumption is mainly due to the compressor of the refrigeration unit and the agitator. Other minor absorptions are related to the control devices.
The EUI for cow milk cooling in Italy is 96.7 kWh head−1 (corresponding to 1.1 kWh 100 L−1) and it is the most energy-demanding operation, equal to approximately 21–24% of the total farm energy demand [14]. In the United States, the MCSs for cow’s milk show an EUI ranging between 0.8 and 1.2 kWh 100 L−1 [15]. Furthermore, when plate heat exchangers were added for milk pre-cooling, the EUI decreased to 0.6–0.9 kWh 100 L−1, whereas a pre-cooler with variable frequency drive (that can decrease the rotation speed of the pump) further reduced both the milk flow inside the heat exchanger and the EUI to 0.4–0.7 kWh 100 L−1 [15].
In the Italian livestock sector, Sardinia is the region’s leader for sheep and goat milk production, with 45% of the national sheep population (the third largest European Union (EU) region for sheep livestock farming), corresponding to more than 3 million sheep units, 5.3 ML of sheep milk and 202,000 L goat milk production [16,17]. Given the scarcity of EUI data specific to sheep milk cooling, the present work measured and analysed the energy consumption and performance of MCSs in Sardinian sheep dairy farms to quantify the EUI. The performance of the sheep MCSs was measured according to the official procedure currently adopted in the EU, which was reviewed to provide the information needed to calculate energy consumption. The results fill a literature gap on the EUI data for sheep milk, by estimating its impact on the energy and economic balance of sheep dairy farms for energy auditing applications. In addition, the study highlights that the EUI can be used as an indicator of the correct milk cooling rate, to diagnose eventual malfunctioning of the MCSs that can reflect on the milk quality.
2. Reference Framework for Analysis of Milk Cooling Systems
The quantification of the energy for milk cooling presupposes the performance measurement of the milk cooling tank. For this reason, the normative classification and test methods used in the experimental part are provided in this section.
2.1. Operating Specifications of a Milk Cooling System
The current operating specifications are defined by the EU standard regulation EN 13732:2013 [18] and must be indicated in the identification plate using the following classification (Table 1):

Table 1.
Performance classes of milk cooling systems, according to the European Union (EU) regulation EN 13732:2013.
- Number of milkings to be stored in the tank before collection (two, four or six milkings), indicated by a number before the temperature class;
- Temperature class, which is the maximum ambient temperature of the milking room necessary for optimal performance (25, 32 or 38 °C), indicated using a capital letter;
- Cooling time class, indicated with a Roman numeral, represents the maximum time required for cooling down the milk from 35 to 4 °C.
2.2. Performance Tests
The performance test is aimed to determine the cooling time. The tests can be conducted with milk or water under the standard test conditions (SCs), which are characterized by: a milk/water rate in the tank of 50% or 25% for two- or four-milkings MCSs, respectively; initial milk/water temperature of 35 °C, monitored till 4 °C; ambient temperature constant and equal to the temperature class. Under such conditions, the standard cooling time (SCT) can be measured. The SCT establishes the cooling time class that is commonly shown in the identification plate. When testing any MCS in the dairy farm, the operating test conditions (OCs) are different from the SCs, causing the time required for cooling down the milk to change. This time is called the total cooling time (TCT). As a consequence, the variables should be corrected after the test by applying correction factors referring to the SCs. Therefore, the performance of all MCSs can be compared when the OCs are different from the SCs.
2.2.1. Ambient Temperature
The ambient temperature indicated by the manufacturer (38 °C for class A, 32 °C for class B and 25 °C for class C MCSs) can be held only in a laboratory. A correction is necessary when the actual ambient temperature is different, by applying experimental equations already developed and specific for sheep MCSs [7,19]. The effect of the ambient temperature on the cooling time can be calculated with the correction factors:
where Ta is the average ambient temperature (°C), hatB and hatC are the ambient temperature correction coefficients (dimensionless) for C and B class MCSs, respectively.
2.2.2. Milk Rate
The milk rate in the tank should be 50% of the volume for two-milkings tanks or 25% for four-milkings tanks. When the milk rate is different, the following correction coefficients are necessary [7]:
where mr is the milk rate in the tank (dimensionless, expressed as fraction of 1), hr2 and hr4 are the correction coefficients (dimensionless) for milk rate of two- and four-milkings cooling tanks, respectively.
2.2.3. Initial Milk Temperature
This initial temperature of the liquid in the tank is supposed to be 35 °C. When it is different, the following correction coefficient hmt can be used [7]:
where Tm is the initial milk temperature (°C) and hmt is the correction coefficient for the initial milk temperature (dimensionless). The overall correction coefficient (ho) for a 2BII class MCS can be calculated by multiplying all the corresponding correction factors [7]:
when the total cooling time (TCT) of a test is multiplied by ho, the standard cooling time (SCT) can be obtained:
The SCT is the main parameter to compare the MCSs under the same SCs, even when the test is performed under OCs.
3. Materials and Methods
The performance and energy consumption tests were conducted on 22 sheep MCSs located in Northern Sardinia (Italy) from May to July 2012 (Table 2).
Table 2.
Technical specifications of the MCSs of the sample. The systems are listed from the lowest rated volume.
The sample was balanced according to the rated volume (Vr) of the tank (<400 L: 3 tanks; 401–600 L: 8 tanks; 601–800 L: 7 tanks; >800 L: 4 tanks). All MCSs had B temperature class, top hatch (except No. 22), direct expansion (the most representative in Sardinia), two- or four-milkings, single- or three-phase current. No MCS of the sample was provided with pre-cooling. Since four-milkings systems were scarce, only three MCSs were included in the sample. The consistency of the lactating flock is also reported to assess a correlation with the tank volume chosen by the farmer (volume sheep−1). The technical specifications of the MCSs were retrieved from the identification plate (when it was available and legible). When the sheep milk collected was insufficient (mr below 20%), water was used to replace it and reach a mr around 50% for two-milkings tanks or around 25% for four-milkings tanks.
The performance tests were conducted by monitoring the milk or water bulk temperature and the ambient temperature at 30 s intervals for the whole cooling process, using a temperature probe (Delta Ohm TP472, Padua, Italy) and a hot wire thermo-anemometer (Delta Ohm AP 471 S1, Padua, Italy) connected to the same datalogger (Delta Ohm DO 2003, Italy). The electricity consumption was measured using a power meter (Schneider PowerLogic PM9C, Rueil-Malmaison, France) with data logger (Schneider PowerLogic EGX 300 Integrated Gateway Server, Rueil-Malmaison, France) installed on a portable electric panel connected between the power plug of the MCS and the power outlet. The energy consumption under OP (EOP) was measured at 5 min intervals till the end of the test (up to the TCT) by using the following expression:
where EA is the active energy (kWh) and Pa the average active power (kW) measured during the performance test. The electricity consumption under SC (EST) was estimated with the expression:
This expression was used to estimate and compare the electricity consumption of MCSs of the sample in the ST.
On two MCSs (Nos. 21 and 22), the tests were prolonged for 24 or 72 h during daily operations with sheep milk to study the energy consumption for storing the refrigerated milk between cooling sessions. In this case, the energy consumed was measured at 5 min intervals from the end of the cooling session (when the milk temperature reaches 4 °C) to the next milking session.
A maximum tolerance of 10 min was accepted on the SCT for the classification of the MCS performance class. For each MCS of the sample, the EUI under OCs was expressed in kWh 100 L−1 by dividing EOP and mr, which was determined using the level indicator provided in the tanks and the manufacturer’s table that associates levels to volumes:
where Vr is the rated volume of the tank (l). The EUI under ST conditions (EUIS) was expressed in kWh 100 L−1 by dividing EST and the amount of milk/water equal to a mr of 50% or 25%, for two- and four-milkings MCSs, respectively:
The energy cost for milk cooling was estimated by calculating the sheep milk production of the sample farms, based on the consistency of the flock and the standard lactation curve of the “Sarda” sheep (220 days), using the Wood’s incomplete gamma function [20,21]:
where a is equal to 934, b to 0.181, c to 0.041 and t is the time of lactation expressed in weeks.
y(t) = a tb e−ct
Based on the Standard EUI and the average milk production of the flock, the yearly cost for the operation of MCSs was calculated, including its influence on the price of sheep milk in Italy in 2012 (0.69 € L−1) and an average electricity price of 0.20 € kWh−1 [22,23]. In this study the EUI was added to the energy for storing the refrigerated milk and multiplied by the yearly milk production of the dairy farms of the sample to estimate the energy consumption for sheep milk cooling. The potential energy saving was estimated for malfunctioning tanks considering the Standard EUI as reference.
To calculate the coefficient of performance (COP), the following energy balance was applied:
where Qt is the total thermal energy extracted from the tank by the refrigeration unit, Qm the energy extracted from the milk bulk, and Qc the heat transfer from the ambient air to the tank walls. Qm was cumulated at 5 min intervals till TCT with the following equation:
in which Cs is the specific heat of the bulk liquid (3.90 kj kg−1 °C−1 for sheep milk or 4.18 kj kg−1 °C−1 for water), 3600 converts kj to kWh, Tm is the initial milk temperature that decreases up to 4 °C and m is the milk/water mass (kg), calculated as:
where ρ is the density of the sheep milk (1.028 kg L−1). The heat transfer from the ambient air to the tank walls depends on the difference between the ambient temperature (Ta) and Tm till 4 °C. According to this, Qc was calculated at 5 min intervals till the TCT with the formula:
where At is the surface area of the tank (estimated with the manufacturer’s technical specifications), 5/60 converts W in Wh every 5 min, 1000 converts to kWh, and Uc is the overall heat transfer coefficient of the tank, function of conduction and convection, estimated through the following formula:
where L1 and L2 are the estimated thicknesses of the two materials of the tank wall (stainless steel and insulation material), assumed 0.6 and 3 cm respectively, k1 is the thermal conductivity coefficient of the steel (0.07 W m−1 K−1), k2 the thermal conductivity of the insulation material (assumed polyurethane foam for all tanks, with a k2 of 0.028 W m−1 K−1), α1 is the free convection heat transfer coefficient of the ambient air (10 W m−2 K−1) and α2 the free convection heat transfer coefficient of the liquid medium in the tank (assumed 50 W m−2 K−1). Finally, the COP was calculated for each MCS as the average of the observations at 5 min intervals till the TCT as following:
Qt = Qm + Qc (kWh)
m = Vrρ mr (kg)
4. Results
4.1. Performance Tests
Figure 2 depicts an example of performance and energy monitoring on an MCS after a test in the dairy farm. The MCS worked regularly, bringing the water temperature to 4 °C within 180 min, corresponding to a well-functioning BII system. The active power showed limited fluctuations during the test, resulting in a linear increase of the energy consumption, whereas the ambient temperature of the milk room increased due to the heating produced by the compressor unit.
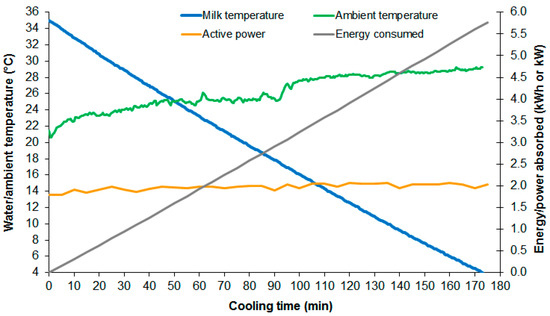
Figure 2.
An example of performance and energy consumption test conducted with water on an 800 L milk cooling tank 2BII and Vr of 0.50 (milk cooling system (MCS) No. 16), showing the cooling curve, the active power and the electricity consumption.
The sample showed the predominance of BII class MCSs in Sardinia, for both two- and four-milkings (Table 3). No I class MCSs was found, whereas those without an identification plate were assigned with a BII or BIII performance class after the performance test. The most diffused refrigerant was R22, since the average age of the MCSs was high (19 years old in 2012). The R12 is still used in a few MCSs and only two employed the R404a. The power/volume ratio amounted to 0.387 kW 100 L−1 and 0.281 kW 100 L−1 for 2BII and 4BII MCSs, respectively. Only tank No. 22 (the biggest of the sample) had a power/volume ratio considerably lower than the sample mean. The average specific rate volume of the sample was equal to 2.9 l head−1 of flock.
Table 3.
Main results of the performance and the energy consumption tests. The Energy Utilization Index (EUI) observed under both operating (EUIO) and standard (EUIS) conditions is reported. M represents the medium used for the test (M for milk or W for water). Tanks with a standard cooling time (SCT) beyond III class limits were classified as malfunctioning (MCS Nos. 7-9-13-14-20), whereas the underlined performance classes are referred to tanks with no available/readable identification plates that were classified after the test.
The TCT was characterized by a high heterogeneity due to the different OCs, even among MCSs belonging to the same performance class. For this reason, the performance class of the MCSs was confirmed by using the calculated SCT, which allowed to assign it to those with missing or unreadable identification plates. An average difference of 75% was observed between the power indicated on the plate and that actually absorbed by the compressor. The average SCT was 173 ± 13.3 min and 176 ± 15.4 min for the 2BII and 4BII MCSs, respectively. MCSs Nos. 1, 4, 10 and 19 showed a SCT close to I class, even though they belonged to the II class. Indeed, such systems took advantage of occasional or ordinary maintenance (check and refrigerant refilling) that kept or improved their performance. In addition, five systems (MCS Nos. 7, 9, 13, 14 and 20), corresponding to 22% of the sample, showed a SCT with a delay higher than 10 min compared to the maximum SCT of III class (210 min) and equal to 288 min on average, thus classified as malfunctioning 2BIII MCSs. The breeders owning such MCSs were recommended for immediate maintenance.
4.2. Energy Consumption Tests
The results of the energy consumption monitoring are reported in Table 3. Data showed a high variability caused by the different OCs among the MCSs. The average Pa was 2.13 and 0.90 kW respectively for the 2BII and 4BII MCSs, whereas the MCSs classified as BIII class (all malfunctioning, thus with a SCT beyond 210 min) showed an average Pa of 1.63 kW. The energy consumption ranged between 1.56–8.00 kWh for two-milkings tanks, and between 1.86–3.50 kWh for four-milkings tanks. The values increased when performance issues occurred (as for MCS Nos. 7, 9, 13, 14 and 20). The BII class MCSs resulted in a consumption under SC of 5.44 kWh on average, whereas the malfunctioning MCSs showed 8.07 kWh, thus 48% higher than the BII class MCSs. Such systems were classified as malfunctioning BIII class MCSs. The average COP of the MCSs measured during the tests, was 2.27 ± 0.29, whereas the malfunctioning MCSs showed an average COP of 1.39 ± 0.32. In the sample, the decrease of the COP was almost linear by 9% on average for each variation of 1 °C of Ta. The sample resulted in a heterogeneous decrease depending on the considered system and the test conditions, that can be summarized by MCS No. 16 in Figure 3 (whose performance was already shown in Figure 1). This MCS showed a COP that decreased linearly by 14.3% from Ta of 21.7 to 29.2 °C, with an average value of 2.54. The MCS extracted a Qt of 14.51 kWh from 35 to 4 °C in 173 min. If EA was calculated using the maximum power indicated in the identification plate (see Table 2) instead of the actual Pa, MCS No. 16 would have shown an EA 31% higher than what was observed, whereas it would result averagely 11% higher on the whole sample.
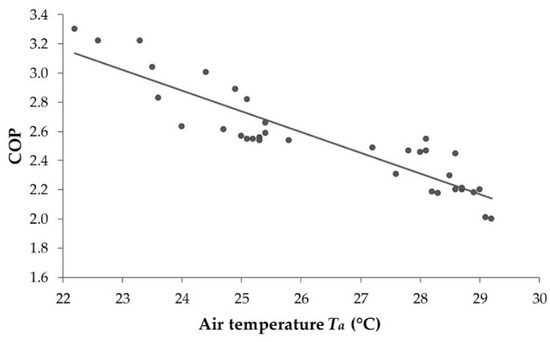
Figure 3.
Example of relation between coefficient of performance (COP) and Ta on MCS N°16 (Vr = 800 L; mr = 0.50; Tm = 35 °C; Ta = 26.2 °C; total cooling time (TCT) = 173 min; R2 = 0.82).
4.3. Energy Utilization Index
Table 4.
Average EUIS of the sample. The CO2 emissions (g CO2 100 L−1) are reported in brackets.
The average EUIO and EUIS showed a significant difference of 16% (Student’s t-test with p-value < 0.05). All EUIs are depicted in Table 4, together with the CO2 emissions expressed in g CO2 100 L−1, where 1 kWh corresponds to 567 g CO2 kWh−1 [24]. The average EUIs values appeared to be heterogeneous as a function of the milkings. The four-milkings MCSs had EUIs and CO2 emissions on average 30% higher than two-milkings MCSs. The EUIs of the BII class MCSs was 1.76 kWh 100 L−1 for two-milkings and 2.43 kWh 100 L−1 for the four-milkings MCSs.
On the other hand, the malfunctioning BIII MCSs showed an average EUIS of 2.56 ± 0.54 kWh 100 L−1. For this reason, the EUIS values of the BIII MCSs were corrected and estimated by using an SCT equal to 220 min (210 min limit for the III performance class plus 10 min) and the average Pa of the III class MCSs of the sample (1.63 kW), resulting in a EUIS of 1.92 kWh 100 L−>1 for regular operating BIII MCSs, meaning that the performance issues increased the EUIS by 31% on average, and up to 58% on MCS No. 20. The EUIS of the BIII class was 8% higher than the EUIS of the BII MCSs. The CO2 emissions of the BII MCSs ranged from 998 for the two-milkings to 1378 g CO2 100 L−1 for the four-milkings.
Based on these results, if a tolerance of 10 min over the time performance class is applied (thus an SCT of 190 min for BII and 220 min for BIII MCSs), the EST of the sample and the deriving EUIS could be recalculated using Equations (9) and (11) to estimate the consumption limit of a good operating MCS. These values ranged from 2.16 to 2.31 kWh 100 L−1 for BII and BIII classes, obtained by adding the standard deviation (0.24 and 0.33) to the recalculated values of the sample (1.92 and 1.97 for BII and BIII class, respectively) as a limit beyond which a malfunction is certain.
4.4. Electricity Consumption of the Refrigerated Milk Storage
The energy consumption of the refrigerated milk was monitored only on MCS Nos. 21 and 22. MCS No. 21 showed an energy consumption between two milking sessions of 0.85 kWh with two short ignitions of the refrigerating unit during the night, which consumed on average 0.21 kWh 100 L−1 (93 g CO2 100 L−1) (Figure 4a). From the second milking to the end of the observations, the MCS consumed 0.39 kWh, equal to 0.06 kWh 100 L−1 (26 g CO2 100 L−1). The increase of the milk temperature and the power absorption corresponded to the milking, in which the hot milk is stored in the tank. The temporary power peaks corresponded to the activation of the compressor unit around a milk temperature of 5 °C, to bring it back to 4 °C, whereas the small fluctuating power absorptions were due to the agitator.
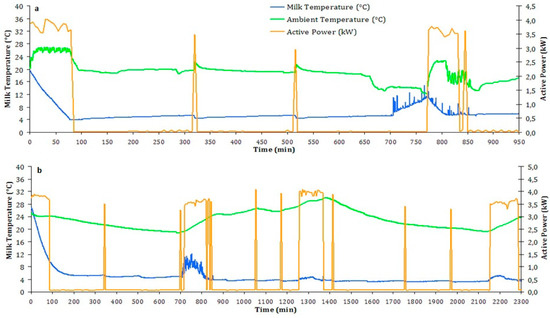
Figure 4.
Power consumption monitoring of two MCSs. (a) Tank No. 21, volume 1055 L, monitored for 24 h over 2 cooling sessions; (b) Tank No. 22, volume 2500 l, monitored for 72 h over 4 cooling sessions. During the second cooling session of MCS No. 21, the refrigeration unit was started after the milking to perform another performance check with limited temperature fluctuations of the milk bulk (data not used for evaluating the MCS).
MCS No. 22 consumed 1.60 kWh during the first night, 1.19 kWh between milkings and 1.85 kWh during the second night, equal to 0.80, 0.26 and 0.18 kWh 100 L−1 (453, 147 and 102 g CO2 100 L−1), respectively (Figure 4b). The most reliable consumption was retrieved when a mr around 50% was available (i.e., 0.06 and 0.18 kWh, respectively for MCS “a” and “b”).
The energy consumption for storing the refrigerated milk was estimated as the average between the values showed by MCS Nos. 21 and 22, which means 0.12 kWh 100 L−1 (68 g CO2 100 L−1), corresponding to 6.8% of the standard EUI of II class MCSs (1.76 kWh 100 L−1).
4.5. Cost Estimation for Sheep Milk Cooling
Based on the productivity and consistency of the flock of the sample dairy farms, the average electricity consumption of the farms was estimated to be 1244 kWh y−1, corresponding to 705 kg CO2 y−1. This value accounted for both the cooling and the storage of refrigerated milk. The yearly electricity cost for sheep milk cooling was assessed by the ratio of the electricity expense and the collected milk. This value was about 0.0042 € L−1, corresponding to 0.61% of the sheep milk price in 2012, whichaverage price was 0.69 € L−1 [22]. The incidence was 31% higher on the malfunctioning BIII MCSs, bringing it to 0.80%.
5. Discussion
The MCS sample showed a predominance of the BII class MCSs in Sardinia, which is positive in the Mediterranean area, where the average ambient temperature rarely exceeds 32 °C during the milking season and it is the best compromise between the need for a good cooling rate and the purchase cost, compared to the expensive I class MCSs. The EUI of the four-milkings MCSs was significantly higher than those for two-milkings, because the energy consumption for two-milkings MCSs was distributed on a milk bulk equal to 50% of the rated volume, whereas in four-milkings it was distributed only on 25%, resulting in a higher EUI. The lack of maintenance increased the probability of failure or malfunctions. These performance problems are common in Sardinian sheep dairy farms (diagnosed in 22% of the sample) and do not seem to be related to the age of the MCSs, showing that even old refrigerating systems can work properly with regular maintenance. The refilling of the refrigerant brings the refrigerating circuit back to a good efficiency and decreases the energy consumption up to 8%, especially if replaced with a mixture of propane and ethane [25]. The BII class MCSs that received a refilling (tank Nos. 4, 5, 10 and 19), showed a performance close to the I class, with SCT slightly higher than 150 min (Table 3). Despite the power fluctuations shown by the compressor during its operation, the energy consumption increased linearly (Figure 1). This aspect is relevant in energy auditing, since a linear consumption trend simplifies estimations. The difference of 75% between the actual absorbed power and the power reported on the identification plate is related to the maximum absorption the compressor may develop, whereas it is always lower during operation. Consequently, a coefficient of 75% can be applied as a correction factor to estimate the actual power absorption of the MCS to avoid overestimations of the energy consumption (11% on average on the sample) when the power reported in the identification plate is used for calculations.
The results showed that the EUI for sheep milk cooling was systematically higher than those for cow milk; while the average EUIS for sheep milk was 1.76 kWh 100 L−1 for 2BII MCSs (Table 4), the cow milk cooling with the same performance class ranged from 0.90 to 1.10 kWh 100 L−1 [9,14], thus approximately 95% higher. The EUI ranged from the values of tank No. 22, which showed an EUIS of only 0.90 kWh 100 L−1 (corresponding to the average energy consumption for cow milk cooling), to those of tank Nos. 19 and 21, which were respectively 1.98 and 2.15 kWh 100 L−1 (Table 3). The EUIS of MCS No. 2, which was the smallest of the sample (rated volume 320 L), was 1.94 kWh 100 L−1, comparable to 1.8–1.9 kWh 100 L−1 observed on a small MCS with Vr of 150 L [26]. The observations showed that the variability of the EUIS is correlated mostly to the number of milkings and the performance class. The refrigerant is an additional factor affecting the performance, in particular the coefficient of performance (COP) of the refrigeration unit. Nowadays new refrigerants are available, such as propane (R290) and ethane (R170) which can improve the COP up to 9%, leading to consistent energy savings [25].
The difference between the EUIS and EUIO was limited to 16% on average, despite the heterogenous OCs during the tests, compared to the SCs. This difference was due only to Ta and Tm, since mr cannot be considered a variable anymore, since both EUIS and EUIO are expressed based on the same amount of milk (100 L). Therefore, by accepting an error of 16%, the EUIS can be considered representative of the operating electricity consumption and a preliminary diagnosing parameter of the correct operation of any MCS for sheep milk. In particular, when the estimated EUIS limits for a correct operation (2.16–2.31 kWh 100 L−1 for BII and BIII class) are exceeded, that means a malfunctioning issue is affecting the system.
The malfunctioning MCSs represented a large percentage of the sample (22%), suggesting that failures and damages are a common issue in Sardinian MCSs. The lack of regular maintenance leads to the persistence of performance problems, higher consumption and gradual deterioration of the refrigerating system, as shown also by the COP of the malfunctioning MCSs, which was 39% lower than regular systems. The COP was negatively affected by Ta during the test with a variable magnitude depending on the MCS and the OC. Furthermore, the microbiological quality of the milk bulk is affected, since a prolonged storage time and a slow or incomplete cooling results in a higher microbial load [27,28]. The maximum microbial charge in sheep milk is established by the EU Directive CEE 92/46: below 1·106 cells mL−1 for drinking milk and below 5·105 cells mL−1 for raw milk used for dairy use [29,30]. Since the coliforms and the somatic cells are higher in midsummer, the cooling time becomes a critical factor especially in this period [31,32]. The somatic cells are a discomfort indicator negatively correlated to milk production [33], whereas the bacterial charge is correlated to the health status of the lactating animals, the staff training and the procedures for washing the MCS and milking plant [34]. A high number of milkings is positively correlated to an increase of the charge, because of the higher storage time before the collection. In particular, some studies observed a statistical difference in terms of microbial charge between milk collected on a daily basis or at two and three days intervals, highlighting that two-milkings MCSs perform a more efficient inhibition of bacterial growth, compared to four- and six-milkings MCSs [35,36].
A mechanism for linking the milk price to its quality (still not applied on a large-scale in Sardinia) can be considered an initiative to invest in the achievement of excellent nutritional and quality parameters. The goal can be achieved by applying good breeding practices and sanitation measures, ensuring the maintenance of the milking system and the MCS, and establishing bacterial charge limits awarded with a higher price [37]. Hygienic practices are crucial in any breeding technique to produce high-quality milk and can also be achieved in small sheep farms with a low technology level [36]. Farms investing in improvements of their sanitation level can succeed with a significant decrease in the microbial charge and somatic cells count [38]. The present study accurately determined the incidence of the cooling operation on the sheep milk price. This information can be considered as a valuable element for the definition of milk price that should consider the higher costs related to a high-quality product.
6. Conclusions
The livestock sector should consider the connection between energy consumption and the quality of animal products. Mechanical milking and milk cooling are the key factors determining the power consumption of a dairy farm. This study quantified the energy consumption of sheep MCSs in Sardinia (Italy), which is one of the leading EU regions producing sheep dairy products. The EUI was used as an indicator to relate the energy consumption and milk production, expressed in kWh 100 L−1 of refrigerated sheep milk. Performance and energy consumption tests were performed on 22 MCSs with direct expansion. The MCSs belonged mainly to the BII class (95% of the sample). The average energy utilization index (EUI) of the sample ranged from 1.76 to 1.92 kWh 100 L−1 for two-milkings BII and BIII class, respectively, whereas it was 2.43 kWh 100 L−1 for four-milkings MCSs. The consumption for the storage of the refrigerated milk was estimated at 0.12 kWh 100 L−1. The EUI is strictly correlated to the SCT and the active power absorbed, which was on average 75% of the value shown on the identification plate. The standard EUI can be considered an indicator of the correct operation of the MCS, that contributes to a high milk quality in terms of bacterial charge and detecting performance issues. The milk quality can be awarded through a sheep milk quality payment policy to promote the modernization and the regular maintenance of the MCSs.
Author Contributions
Conceptualization, M.C.; methodology, M.C. and A.P.; software, M.C.; validation, M.C. and A.C.; formal analysis, M.C.; investigation, M.C.; resources, A.P. and L.L.; data curation, M.C. and A.C.; writing—original draft preparation, M.C.; writing—review and editing, M.C. and S.S.; visualization, M.C. and S.S.; supervision, A.P. and L.L.; project administration, M.C. and A.P.; funding acquisition, A.P. and L.L. All authors have read and agreed to the published version of the manuscript.
Funding
This research received no external funding.
Acknowledgments
The authors would like to thank the Regional Agency for Assistance in Agriculture of Sardinia (LAORE) and the technical assistant Giannetto Fadda for his support. This research did not receive any specific grant from funding agencies in the public, commercial or not-for-profit sectors.
Conflicts of Interest
The authors declare no conflicts of interest.
Nomenclature
| a | Coefficient of the lactation curve equal to 934 |
| b | Coefficient of the lactation curve equal to 0.181 |
| c | Coefficient of the lactation curve equal to 0.041 |
| COP | Coefficient of performance (dimensionless) |
| Cs | Specific heat of the bulk liquid (kj kg−1 °C−1) |
| e | Nepero constant (2.71) |
| EA | Active energy (kWh) |
| EOP | Energy consumption under operating conditions (kWh) |
| EP | Energy price (MJ L−1) |
| EST | Energy consumption under standard conditions (kWh) |
| EUI | Energy Utilization Index (kWh 100 L−l) |
| EUIO | Energy Utilization Index during OC (kWh 100 L−l) |
| EUIS | Energy Utilization Index during SC (kWh 100 L−l) |
| hatB | Ambient temperature coefficient for B class MCSs (dimensionless) |
| hatC | Ambient temperature corrections coefficient for C class MCSs (dimensionless) |
| hmt | Initial milk temperature correction coefficient (dimensionless) |
| ho | Overall correction coefficient (dimensionless) |
| hr2 | Milk rate correction coefficient for two-milkings tanks (dimensionless) |
| hr4 | Milk rate correction coefficient for four-milkings tanks (dimensionless) |
| k1 and k2 | Conduction coefficient of the tank wall materials (W m−1 K−1) |
| L1 and L2 | Thickness of the tank wall materials (m) |
| m | Milk/water bulk volume in the tank (L) |
| MCS | Milk cooling system |
| mr | Milk/water rate (dimensionless) |
| OC | Operating test conditions |
| Pa | Active power (kW) |
| Qc | Heat transfer from the air to the tank during the test (kWh) |
| Qm | Heat extracted for the milk/water bulk during the test (kWh) |
| Qt | Total heat extracted for the tank during the test (kWh) |
| SC | Standard test conditions |
| SCT | Standard cooling time (min) |
| t | Time of lactation (weeks) |
| Ta | Ambient temperature (°C) |
| TCT | Total cooling time (min) |
| Tm | Initial milk/water temperature (°C) |
| Tr | Cooling time from 24 to 14 °C (min) |
| Uc | Overall heat transfer coefficient of the tank (W m−2 K−1) |
| Vr | Rated volume of the tank (L) |
| y | Sheep milk production (L) |
| α1 | Free convection heat transfer coefficient of the ambient air (W m−2 K−1) |
| α2 | Free convection heat transfer coefficient of the liquid medium in the tank (W m−2 K−1) |
References
- Rossi, P.; Gastaldo, A.; Leso, L.; Pignedoli, S.; Zappavigna, P.; Riva, G. Consumi energetici e produzione di energia fotovoltaica in zootecnia. C.R.P.A. Pubbl. Collana Suppl. Agric. 2011, 47. Available online: http://www.crpa.it/nqcontent.cfm?a_id=10424&tt=crpa_www (accessed on 25 February 2020).
- Lukuyu, J.M.; Blanchard, R.E.; Rowley, P.N. A risk-adjusted techno-economic analysis for renewable-based milk cooling in remote dairy farming communities in East Africa. Renew. Energy 2019, 130, 700–713. [Google Scholar] [CrossRef]
- Meul, M.; Nevens, F.; Reheul, D.; Hofman, G. Energy use efficiency of specialised dairy, arable and pig farms in Flanders. Agric. Ecosyst. Environ. 2007, 119, 135–144. [Google Scholar] [CrossRef]
- ADEME, Institut de l’Elevage FR2E. Maîtrise de la Demande d’Électricité, de nombreuses solutions dans les exploitations laitières. 2009. Available online: http://documents.cdrflorac.fr/InstitutElevage_MaitriseElectriciteBovinLait.pdf (accessed on 25 February 2020).
- Upton, J.; Humphreys, J.; Koerkamp, P.W.G.G.; French, P.; Dillon, P.; Boer, I.J.M.D. Energy demand on dairy farms in Ireland. J. Dairy Sci. 2013, 96, 6489–6498. [Google Scholar] [CrossRef]
- Calcante, A.; Tangorra, F.M.; Oberti, R. Analysis of electric energy consumption of automatic milking systems in different configurations and operative conditions. J. Dairy Sci. 2016, 99, 4043–4047. [Google Scholar] [CrossRef]
- Pazzona, A. Impianti Di Mungitura e Di Refrigerazione Del Latte Nell’allevamento Ovino e Caprino: Dimensionamento, Costruzione e Prestazioni; Comunicazione Estro Editrice: Cagliari, Italy, 1999. [Google Scholar]
- FAO. FAO Technical and Investment Guidelines for Milk Cooling Centres; Moffat, F., Khanal, S., Bennett, A., Thapa, T.B., George, S.M., Eds.; Food and Agriculture Organization of the United Nations (FAO): Rome, Italy, 2016. [Google Scholar]
- Leggett, J.A.; Peebles, R.W.; Patoch, J.W.; Reinemann, D.J. USDA DMRY Research Centre Milking System Improvements; Paper No. 973037. ASAE Meeting Presentation, Minneapolis, MN, USA, 10–14 August 1997. [Google Scholar]
- Paludetti, L.F.; Kelly, A.L.; O’Brien, B.; Jordan, K.; Gleeson, D. The effect of different precooling rates and cold storage on milk microbiological quality and composition. J. Dairy Sci. 2018, 101, 1921–1929. [Google Scholar] [CrossRef]
- Refsgaard, K.; Halberg, N.; Kristensen, E.S. Energy utilization in crop and dairy production in organic and conventional livestock production systems. Agric. Syst. 1998, 57, 599–630. [Google Scholar] [CrossRef]
- Edens, W.C.; Pordesimo, L.O.; Wilhelm, L.R.; Burns, R.T. Energy use analysis of major milking center components at a dairy experiment station. Appl. Eng. Agric. 2003, 19, 711. [Google Scholar] [CrossRef]
- Ludington, D.; Johnson, E. Dairy Farm Energy Audit Summary. Energy Research and Development Autority. New York State Energy Research and Development Authority. 2003. Available online: https://www.nyserda.ny.gov/-/media/Files/Publications/Research/Energy-Audit-Reports/dairy-farm-energy.pdf (accessed on 24 February 2020).
- Murgia, L.; Caria, M.; Pazzona, A. Energy use and management in dairy farms. In Proceedings of the International Conference in Innovation Technology to Empower Safety, Health and Welfare in Agriculture and Agro-food Systems, Ragusa, Italy, 15–17 September 2008; Available online: http://ragusashwa.it/CD_2008/lavori/TOPIC9/orale/MURGIA.pdf (accessed on 24 February 2020).
- Southern California Edison (SCE).Dairy Farm Energy Management Guide: California. 2004. Available online: http://www.energy.wsu.edu/EnergyLibrary/AgricultureMatters/CatalogItemDetail.aspx?id=429 (accessed on 24 February 2020).
- ISTAT, (National Agency for Statistics) Annuario Statistico Italiano. 2018. Available online: https://www.istat.it/it/archivio/225274 (accessed on 6 November 2019).
- Eurostat Number of Sheep. Available online: https://ec.europa.eu/eurostat/web/products-datasets/product?code=tag00017 (accessed on 6 November 2019).
- European Union UNI EN 13732:2013. Food Processing Machinery—Bulk Milk Coolers on Farms—Requirements for Performance, Safety and Hygiene. Available online: http://store.uni.com (accessed on 22 October 2019).
- Cossu, M. Energy Consumption Analysis of Sheep Milk Cooling Systems. PhD Thesis, University of Sassari, Sassari, Italy, 2013. [Google Scholar]
- Wood, P.D.P. Algebraic model of the lactation curve in cattle. Nature 1967, 216, 164–165. [Google Scholar] [CrossRef]
- Pulina, G.; Macciotta, N.; Nudda, A. Milk composition and feeding in the Italian dairy sheep. Ital. J. Anim. Sci. 2005, 4, 5–14. [Google Scholar] [CrossRef]
- Italian Farmers Association—Federazione Coldiretti Sardegna PREZZO DEL LATTE OVINO. Available online: http://www.sardegna.coldiretti.it/prezzo-del-latte-ovino-partenza-sprint.aspx?KeyPub=GP_CD_SARDEGNA_HOME%7CCD_SARDEGNA_HOME&subskintype=Detail&Cod_Oggetto=43982232 (accessed on 26 March 2020).
- Statista Industry Prices for Electricity in Italy 2008–2018. Available online: https://www.statista.com/statistics/595826/electricity-industry-price-italy/ (accessed on 26 March 2020).
- European Environment Energy Overview of the Electricity Production and Use in Europe. Available online: https://www.eea.europa.eu/data-and-maps/indicators/overview-of-the-electricity-production/assessment-2 (accessed on 26 March 2020).
- Cleland, D.J.; Keedwell, R.W.; Adams, S.R. Use of hydrocarbons as drop-in replacements for HCFC-22 in on-farm milk cooling equipment. Int. J. Refrig. 2009, 32, 1403–1411. [Google Scholar] [CrossRef]
- Vogelauer, R. Test report on refrigerated tank, type RHS 150, manufactured by Fa. Muller-Europa, Lichtenvoorde, Netherlands. Milchwirtschaftliche Berichte Aus Den Bundesanstalten Wolfpassing und Rotholz 1980, 65, 343–344. Available online: https://eurekamag.com/research/000/997/000997970.php (accessed on 25 February 2020).
- Murgia, L.; Pazzona, A. Indagine sugli impianti aziendali per la refrigerazione del latte in Sardegna. L’informatore Agrar. 1992, 18, 41–45. [Google Scholar]
- Jayarao, B.M.; Wolfgang, D.R. Bulk-tank milk analysis. A useful tool for improving milk quality and herd udder health. Vet. Clin. N. Am. Food Anim. Pract. 2003, 19, 75–92. [Google Scholar] [CrossRef]
- European Union. Council Directive 92/46/EEC. Health Rules for the Production and Placing on the Market of Raw Milk, Heat-Treated Milk and Milk-Based Products. 1992. Available online: https://eur-lex.europa.eu/legal-content/EN/TXT/HTML/?uri=CELEX:31992L0046&from=EN (accessed on 25 February 2020).
- Torres-Toledo, V.; Hack, A.; Mrabet, F.; Salvatierra-Rojas, A.; Müller, J. On-farm milk cooling solution based on insulated cans with integrated ice compartment. Int. J. Refrig. 2018, 90, 22–31. [Google Scholar] [CrossRef]
- Elmoslemany, A.M.; Keefe, G.P.; Dohoo, I.R.; Dingwell, R.T. Microbiological quality of bulk tank raw milk in Prince Edward Island dairy herds. J. Dairy Sci. 2009, 92, 4239–4248. [Google Scholar] [CrossRef]
- Gillespie, B.E.; Lewis, M.J.; Boonyayatra, S.; Maxwell, M.L.; Saxton, A.; Oliver, S.P.; Almeida, R.A. Short communication: Evaluation of bulk tank milk microbiological quality of nine dairy farms in Tennessee. J. Dairy Sci. 2012, 95, 4275–4279. [Google Scholar] [CrossRef]
- Pulina, G.; Brandano, D. Il Benessere Animale e La Qualità Delle Produzioni Nei Piccoli Ruminanti; Supplemento a I Georgofili. Atti dell’Accademia dei Georgofili; Avenue Media: Bologna, Italy, 2005; Volume 2. [Google Scholar]
- Perkins, N.R.; Kelton, D.F.; Hand, K.J.; MacNaughton, G.; Berke, O.; Leslie, K.E. An analysis of the relationship between bulk tank milk quality and wash water quality on dairy farms in Ontario, Canada. J. Dairy Sci. 2009, 92, 3714–3722. [Google Scholar] [CrossRef]
- Tirard-Collet, P.; Zee, J.A.; Carmichael, L.; Simard, R.E. A study of the microbiological quality of goat milk in Quebec. J. Food Prot. 1991, 54, 4. [Google Scholar] [CrossRef]
- Zweifel, C.; Muehlherr, J.E.; Ring, M.; Stephan, R. Influence of different factors in milk production on standard plate count of raw small ruminant’s bulk-tank milk in Switzerland. Small Rumin. Res. 2005, 58, 63–70. [Google Scholar] [CrossRef]
- Botaro, B.G.; Gameiro, A.H.; Santos, M.V. Quality based payment program and milk quality in dairy cooperatives of Southern Brazil: An econometric analysis. Sci. Agric. 2013, 70, 21–26. [Google Scholar] [CrossRef]
- Delgado-Pertiñez, M.; Alcalde, M.J.; Guzmán-Guerrero, J.L.; Castel, J.M.; Mena, Y.; Caravaca, F. Effect of hygiene-sanitary management on goat milk quality in semi-extensive systems in Spain. Small Rumin. Res. 2003, 47, 51–61. [Google Scholar] [CrossRef]


© 2020 by the authors. Licensee MDPI, Basel, Switzerland. This article is an open access article distributed under the terms and conditions of the Creative Commons Attribution (CC BY) license (http://creativecommons.org/licenses/by/4.0/).