Article

Cooling Effect on the Floating Solar PV: Performance and Economic Analysis on the Case of West Java Province in Indonesia

by
Adimas Pradityo Sukarso
and
Kyung Nam Kim
*
KU-KIST Graduate School of Energy and Environment (Green School), Korea University, Seoul 02841, Korea
*
Author to whom correspondence should be addressed.
Energies 2020, 13(9), 2126; https://doi.org/10.3390/en13092126
Submission received: 18 March 2020 / Revised: 15 April 2020 / Accepted: 22 April 2020 / Published: 26 April 2020
(This article belongs to the Section A2: Solar Energy and Photovoltaic Systems)

Abstract

:
Solar photovoltaic technology is one of the most well established new and renewable energy technologies. Many researchers have undertaken wide research and development in this sector, including material and system design. To protect the exhaustion of global terrestrial land and to avoid the occupation of extensive farmlands, solar photovoltaic (PV) developers, as well as policymakers, have pursued various solutions, including the development of floating solar PV (FPV). This study consists of a technological and economic perspective to analyze the floating solar PV system. The authors utilize remote sensing results to predict FPV efficiency and measure energy yield from the system while also developing an economics analysis on an FPV project by comparison with ground-based solar PV (GPV). The results from the remote sensing method found that the lake has a cooler temperature than the ground, with an annual difference of around 8 °C. FPV efficiency was also shown to be around 0.61% higher than GPV in terms of the prediction. FPV economic parameter comparison also resulted in 3.37 cents/kWh lower levelized cost of electricity (LCOE), and 6.08% higher internal rate of return (IRR) compared to GPV in the base scenario.

Graphical Abstract

1. Introduction

Consumption of energy is related to human welfare in life. Nowadays, the welfare of the world population is facing constraints of climate change that occur on earth after the period of industrialization. Energy consumption and production activities are responsible for two-thirds of greenhouse gasses (GHG) emissions. Almost 80% of the total energy sources are currently from fossil fuels [1]. The electric power generation sector plays a significant role in total world energy consumption, where almost 70% usage of primary energy goes into electric power supply generation.
With a surface area of more than 1,900,000 km2 and abundant natural resources, Indonesia has a high potential for renewable energy. The Indonesian state-owned electric company, PT Perusahaan Listrik Negara (PT PLN), from Indonesia national energy general plan [2] estimates that a total potential capacity of 442.9 GW of electric power could be generated from renewable energy sources. A report from the national energy general plan explains that the average solar PV potential in Indonesia is 4.80 kWh/m2/day.
The innovation of existing technology, especially electric energy supply, can contribute a significant role in developing an environmental-friendly electric energy supply [3]. A new and renewable energy (NRE) technology and paradigm could constitute a solution to the problem of world dependence on fossil fuel-based energy. Technological innovation has made solar photovoltaic (PV) systems, wind energy systems, energy storage, and electric vehicles mature, commercially competitive, and well-developed [1]. Solar PV global increasing capacity in 2017 was approximately 402 GW [4]. Simultaneous to the increase in international awareness of solar PV beneficiaries, world-wide experts have predicted that the solar PV market will keep developing in the near future. Solar PV market penetration is also expected to create a positive collateral effect on the labor sector regarding work opportunity and availability [5].
Nonetheless, technology is facing several significant challenges, such as intermittent limitations, low efficiency, land use, and tariff policy. Nowadays, the most popular installation type of solar PV is a ground-based installation type, which generally faces land price constraints because of the usage of land, which is a premium commodity. It is also well known that solar PV energy production has a strong correlation with operating panel temperature to determine solar PV panel efficiency.
In order to address land-use constraints, methods of solar PV installation have also evolved and now include rooftop, canal top, offshore, and floating (FPV) installations. FPV was first introduced in Aichi, Japan, 2007, and became prominent with its installation in Napa Valley, USA 2008 [6]. Its total world capacity in 2013 was around 1.1 8MW and this was increased to 98.6 MW in 2017 [7]. FPV has also become a solution for unused vast water surface areas such as lakes, dams, and water irrigation ponds to be recreated as economically and environmentally attractive projects in NRE production. Therefore, FPV is a suitable solution for a country which has a lot of hydropower plants with dams and open water areas. Even though FPV has been in use since 2007, there is no specific software to date that will allow us to include the cooling effect in its energy production measurement.
The economic parameter of an NRE is generally examined through the cost of electricity generation price. Utilization of NRE solar PV is also supported by market price reduction of the technology. At the end of 2018, with various types of commercial solar PV product, solar panel installation cost in the range of between $0.215 and $0.419/Watt [8]. Therefore, electricity generated from that PV will have better competitiveness than fossil fuel-based electricity. The cost of generation also becomes one of the significant parameters to encourage investor attractiveness in the NRE sector. According to Indonesia’s state-owned electric company PT PLN’s statistical report [9], in 2018, the estimation cost of NRE in Indonesia was still very high (around 54.8 cents/kWh) compared to a traditional steam power plant (5.93 cents/kWh).
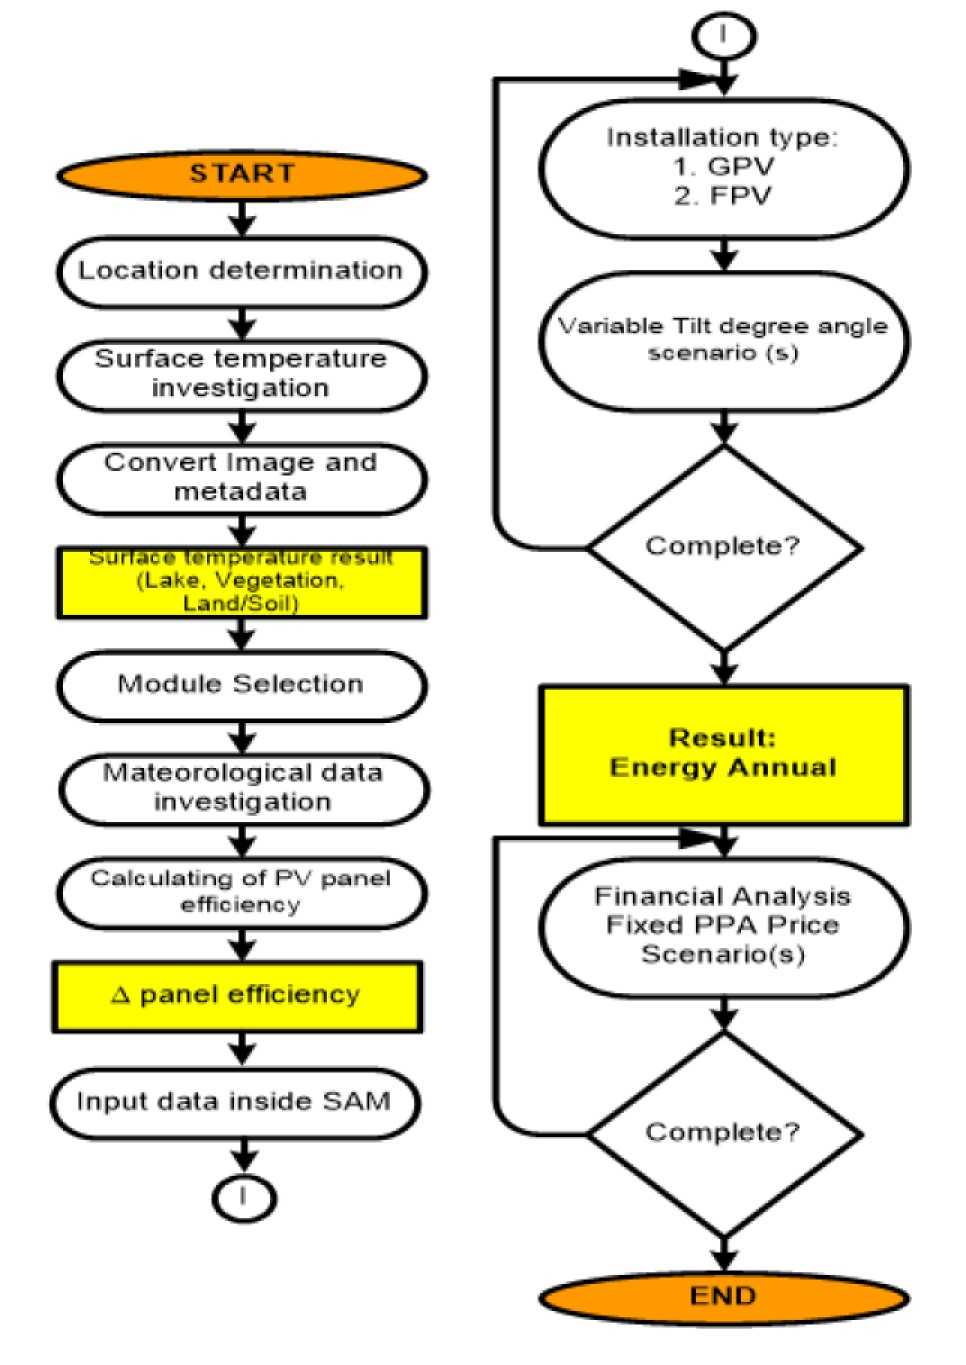
The author realizes that predicting the energy produced by FPV is a challenge for many researchers. Therefore, in this article, the author designs a system to develop a combination of remote sensing methods and a process of calculating the efficiency of FPV, then completes this assessment with economic analysis. In particular, this study is the first trial to measure the location temperature from the remote sensing through emissivity and apply it to the FPV system performance. Therefore, the authors hope that the methodology and tools in this paper can be helpful to future FPV performance research.

2. Literature Review

According to Thi, 2017 [10] and Sahu, Yadav et al. 2016 [11], typical well known solar PV installations are ground-mounted, rooftop, canal top, offshore, and floating systems. The primary motivation of using floating solar PV (FPV) was related to premium land cost, utilization of open water area, and energy efficiency. The impact of the temperature rise of the PV module is one of the reasons for energy efficiency reduction from ground solar PV installation. Solar PV installation above water bodies will partly solve the mentioned deficiencies. This installation method also will prevent water evaporation, and with cooler temperatures beneath the solar panel, panel temperature will reduce, increasing energy production [12]. Several cooling methods, including evaporative cooling, for the solar PV module, were proposed and investigated by Kalaiselvan, Karthikeyan et al. 2018 [13], Rishi, Balachandran et al. 2018 [14], Peng, Herfatmanesh et al. 2017 [15], and Siecker, Kusakana et al. 2017 [16].
FPV was shown to have a better environmental impact within construction, operation, and end-of-life period compared to GPV [17]. Blocked sunlight due to FPV installation above the water reservoir and beneath the panel was considered to stop uncontrolled algae bloom growth and reduce the water reservoir evaporation process. FPV also only requires a smaller ground area compared to GPV for laydown and connecting processes. The previous floating installation resulted in solar PV efficiency increasing with various values compared to the ground installation of solar PV systems. In late 2018, Hydrelio© floater technology was one example of a type of floater that was available for FPV installation. Hydrelio© is a floater product from French company Ciel and Terre (Sainghin-en-Mélantois, France) which dominates around 75% of the Japanese market, which is the location of the most significant installations of the world’s FPV [7].
Many studies have measured FPV efficiency in comparison to GPV (Table 1).
The results showed that FPV efficiency is significantly superior to that of GPV. Kamuyu, Lim, et al. 2018 [27] performed a study on a 500 kW installation at Hapcheon Dam, a water reservoir located in Hapcheon-Gun, South Korea. They were able to calculate the FPV module temperature as a function of wind speed, irradiation, ambient temperature, and water temperature before comparison with real measurements. The result shows that ambient temperature is one of the critical factors in determining FPV panel temperature, in addition to a method to calculate direct in-situ measurement or data access is through the national aeronautics and space administration (NASA) software named “NASA power” online application. Remote sensing results of lake surfaces’ water temperatures have generally been monitored to check global environmental change [28] as well as limnetic contribution to the global carbon cycle [29].
The satellites employed for water surface temperature monitoring include the advanced very high-resolution radiometer (AVHRR) as well as the along track scanning (ATSR) [28,30], moderate resolution imaging spectroradiometer (MODIS) [31] and landsat satellite [32]. The Landsat program was initiated in 1965 by the US government to gather facts about natural resources of the earth, and the government launched the first Landsat satellite in 1972. Currently, Landsat 7 and the most recent Landsat 8 are operating after being launched in 1999 and 2013, respectively [33]. Landsat satellites provide the longest record of space-based land surface observations [34]. Compared to the previously launched Landsat 7, Landsat 8 has a narrower spectral band, improved calibration and signal to noise characteristics, higher 12 bit radiometric resolutions, and more precise geometry [35]. In this study, the authors also use remote sensing satellite imaginary methods to obtain water surface temperature.
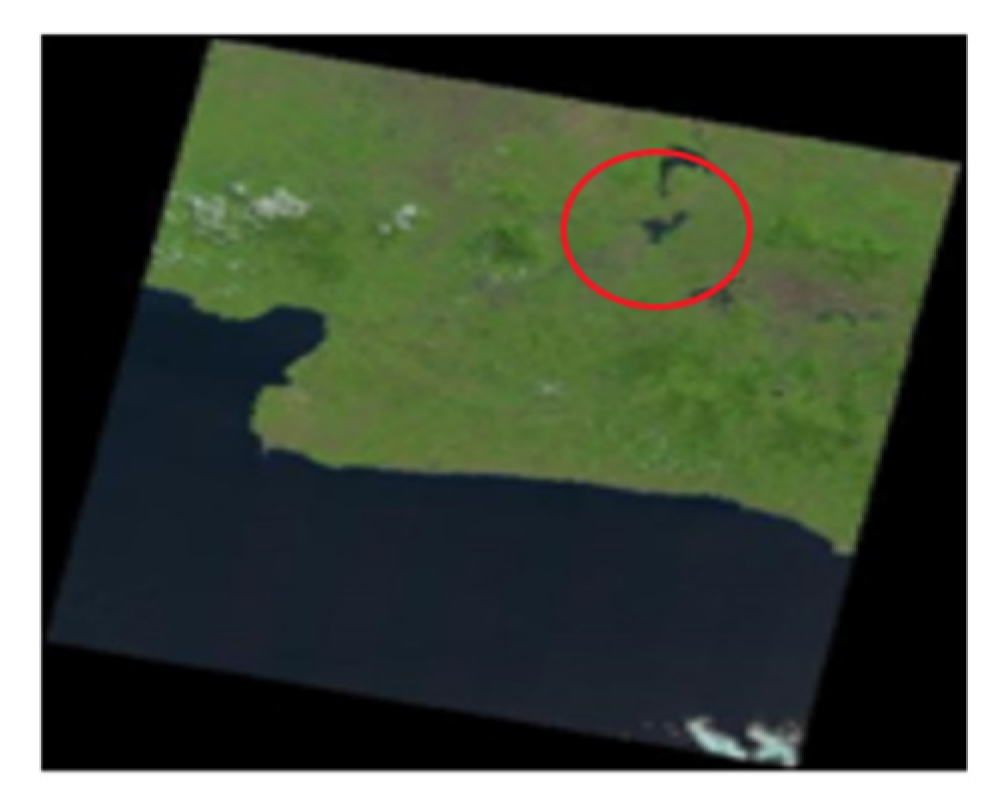
For study purposes, the authors simulate a fixed type model of the FPV system with a capacity of 1 MW similar to that installed and operating at Cirata Dam, West Java province, Indonesia. The design of 1 MW FPV adopts the mathematical equation from Pašalić, Akšamović et al. 2018 [36] which is planned at Jablanica Lake, Bosnia and Herzegovina and Song and Choi, 2016 [37] at Ssangyong Open pit limestone, Korea. Several popular software packages such as RETScreen (Government of Canada), PVGIS (European Union/EU science hub, European Comission), PVWatts (The national renewable energy laboratoty/NREL, Washington, D.C., USA), System Advisor Model/SAM (NREL, Washington, D.C., USA), Homer can deliver a tool to calculate energy production of the NRE project [38] while Psomopoulos, Ioannidis et al. 2015 [39] and Blair, Dobos et al. 2014 [40] compared and briefly reviewed the NRE software systems.
SAM is free software developed by NREL Lab for predicting the performance of renewable energy systems and analyzing the financial feasibility of a project. SAM is a techno-economic computer model that supports people who interest in the NRE industry. SAM is suitable for simulating NRE on-grid performance systems with the financial model of the NRE project. SAM’s advantages are the availability of simulations in the analysis section, which provide parametric, sensitivity, statistical, and probability results as an extension of analysis [40].
Economic analysis composes a variety of evaluation methods such as the levelized cost of energy (LCOE), net present value (NPV), internal rate of return (IRR) and power purchase agreement (PPA). LCOE is a parameter that allows for the comparison of the alternative technologies within different scales of operation, different investment, and operating periods. LCOE also could be used to compare the cost of energy generated by renewable resources with fossil fuel-based power plants. PPA of electricity is a contract between two parties, commonly done by electricity sellers and electricity undertakers. The IRR of a project is the discount rate (nominal value according to SAM) that corresponds to zero NPV for the PPA financial models [41]. IRR of an investment that has a series of future cash flows is a rate that sets the NPV of the cash flows equal to zero. IRR analysis is commonly used for either acceptation or rejection decisions, allowing a quick comparison with a minimum acceptable rate of return.

3. Data and Methodology

3.1. Systematic Workflow

This paper consists of four main analytical parts, as shown in Figure 1. First, the authors investigate surface temperature by remote sensing methodology. Secondly, the developed formula and conditions generate the solar module efficiency in four location cases, labeled Lake 1, Lake 2, Soil, and Dam. Lake 1 and Lake 2 represent water-based locations, while Soil and Dam represent ground-based locations. Thirdly, the authors compare the analyzed energy production, i.e., the performance of each case. Lastly, the authors analyze the financial results with the PPA price scenario.
Based on the performance analysis results, using SAM software facilities and other financial parameter input, the authors make a simulation to find the impact of the uncertainty with parametric, stochastic, and macro-tornado analysis in the business as well as policy perspective before making a conclusion.

3.2. Remote Sensing Methodology

This study uses Landsat 8 satellite images data to obtain the surface area around West Java Province, the Cirata lake area. The located GPS is 6°41′59.9″S 107°22′01.6″E in Figure 2 (red circle). According to Landsat database path and row systems, it is located in path 122 and row 065. Data repository screening is undertaken for the day only data, under cloudless conditions for 20% of the area of interest, and starting from 2014 database.
A geographical information system (GIS) mapping software is a useful tool for converting Landsat satellite imagery into a user-friendly image. Two software packages, ArcGIS (Environmental systems research institute/ESRI, Redlands, California, USA) and QGIS (QGIS development team) are well-known GIS software [42,43]. QGIS is open-source software, and ArcGIS is a non-open source software application for desktop. For this study, operation inside the QGIS software uses an additional plug-in semi-automatic classification program (SCP) introduced by Congedo, 2016 [44]. For converting imaginary satellite data, this study uses conversion through the emissivity value. Emissivity value is an effective value of the material of emitting energy in a thermal radiation image. Uses of land surface emissivity value, normalized difference vegetation index (NDVI) value from QGIS recognition and calculation of satellite metadata are necessary in order to acquire surface temperature. This study uses the emissivity values as in Table 2.

3.3. Solar Panel Efficiency

Notable formula to calculate traditional linear expression of solar PV module efficiency in function of module temperature explained by Evans and Florschuetz, 1977 [45] where
η = η s t c { 1 β r e f ( T c T r e f ) }
A notable equation created by Kamuyu, Lim et al. 2018 [27] to obtain FPV module temperature from GIS and water temperature data is
T f p v = { 1.8081 + ( 0.9282 T a ) + ( 0.021 G ) ( 1.2210 V w 1 ) + ( 0.0246 T w 2 ) }
The general formula to calculate the operating temperature of ground-mounted solar PV panel is a function of material, radiation, ambient temperature, and wind speed, developed by Duffie and Beckman, 2013 [46] and shown as follows
T g p v = T a + { ( G G n o c t ) ( T c n o c t T a ) ( 9.5 5.7 + ( 3.8 V w ) ) }
This study uses a solar panel and inverter from SAM database repository, as shown in Table 3.

3.4. Economic Analysis

The financial calculation methodology for this study calculates the value from NPV, IRR, and LCOE of this proposed study. The authors utilize all parameters in SAM software functions to calculate the financial parameter of the project. This research also requires comparative sensitivity analysis among FPV and GPV projects. Financial parameters for economic analysis will obtain the input data from Indonesia’s national database, literature reviews, and assumptions. SAM provides the software with various simulation analysis tools that capable of analyzing impacts to output regarding variations and uncertainty in input assumptions on the model results. The parametric analysis tool is a sensitivity analysis which use to assign multiple values as input variables to create graphs and tables showing the output metrics for each value. This analysis tool is useful for optimization and exploring relationships between input variables and results.
The stochastic analysis uses a statistical distribution method to assign multiple variable input values. A stochastic analysis is also a parametric analysis, which generates values of input variables over a range, and a probability distribution that specifies automatically, as is the case for SAM. Stochastic analysis tools show the effect on metrics output with uncertain input values. This study also includes a tornado chart for the simplicity of sensitivity analysis of uncertain parameter input that affects output results. Since SAM has no input for floater cost in the parameters, the authors searched for a floater reference in $/Watt data to apply in the research. The authors set the logic that the cost of floater is an input in Land with a $/Watt unit parameter while the Land cost is an input in Land with a $/acre unit parameter.

4. Result and Analysis

4.1. The Solar PV Design Result

This study proposes solar PV with 1 MW capacity and a central inverter system. Based on system design calculation, as seen in the literature review, the system will require ten modules per string with a total of 460 strings. The system also requires two inverters’ central model types. With these configurations, the system is predicted to occupy 1.5 acres of area for the solar PV capacity.

4.2. Remote Sensing Result

The authors select four locations in the Cirata lake for the analysis. The information on the location areas is in Table 4. This study proposes solar PV with 1 MW capacity and a central inverter system, based on system design calculation.
The selected four locations show the monthly trends of the temperature as Figure 3. Lake 1 and Lake 2 represent water-based temperature, while soil and building represent ground base temperature.
The result from remote sensing is introduced to Equations (1)–(3) to calculate solar PV project efficiencies (Table 5) and the annual average result is shown in Figure 3.
Based on Figure 3 above, the authors consider that remote sensing measurement has a generally consistent pattern. Differences between water-based and ground-based temperatures are on average 8 °C in the measurement value. The results in the figure clearly show that there is a difference between the predicted results of the panel efficiency based on the locations of installation. FPV in water-based area Lake 1 and Lake 2 locations have a higher efficiency compared to ground installation. Energy production from each location was calculated after introducing a predicted efficiency value to the simple efficiency module model and system design inside SAM software with specific GIS data based on the individual location. A variable tilting degree among all locations was calculated to determine maximum energy yield, as shown in Table 6 below.

4.3. Economic Analysis Result

In this subsection, the authors examine the results of an economic analysis based on the best result among the representative type of location. From the performance results of four cases, the authors select Lake 1 and Soil for a more detailed economic analysis. The first approach of economic analysis is to find financial parameters NPV, IRR, and LCOE in the base scenario. Electricity price in Indonesia is unequally applied based on territory condition and population area. The Ministry of Energy and Mineral Resources (MoEMR) developed the basic cost of generation (BCoG) [47], which consists of three methods, such as national, regional, and local BCoG. Local BCoG in 2019 has widely differentiated tariffs from 6.91 cents/kWh to 21.34 cents/kWh. The base condition utilizes the existing sell tariff regarding the existing ratified policy on NRE for selling energy to the utility. West Java province, the area of interest, ratifies 6.91 cents/kWh from the NRE source. The financial parameter results are shown in Table 7.
In the case of two higher energy yield locations that represent water and ground-based installations, through an existing tariff in base scenario, LCOE from FPV installed at Lake 1 resulted in values that were 3.37 cents/kWh lower compared to GPV installation on the soil location. However, from the IRR and NPV parameters, both methods of installation show negative values, which means that the existing tariff is too low to draw attention to solar PV project investment.

4.4. Parametric Analysis in the Policy Perspective

In the second approach of economic analysis, the authors expected to find the implications from the policy perspective. Therefore, the authors considered the price policy in NRE to see the impact on the financial results. The main impact factor in the alternative price policy is the time on delivery (ToD) factor. ToD is a constant value of electricity sales to the grid, depending on the time when the electricity was delivered. It is possible to change the tariff multiplier of electricity on the power purchase agreement negotiations. Even though Indonesia only recognizes the NRE tariff based on the BCoG method, this study tries to analyze the ToD factor in terms of the NPV value. Previous analysis on the base scenario uses a flat-rate universal dispatch where the multiplier value is equal to 1.0. After observation of a heat map of the irradiation result, as shown in Figure 4 below, the authors found it shows that most of the energy yield in the area of interest is from 09:00 to 16:00. Therefore, the authors developed a manual ToD, as shown in Figure 5, as the second scheme, considering a heat map of Irradiation obtained from weather files. A classification created with various incremental steps and maximum multiplier is 2.0 of the existing tariff.
Under the ToD scheme, the financial results shown in Table 8 describe the effect ToD with an existing tariff to IRR and NPV parameter for both projects. ToD in this section was created with consideration of the location heat map with multiplier tariff differences. Under the same ToD scheme among two types of installations, FPV has resulted in positive NPV, and higher IRR percentage compared to GPV installation. Therefore, the authors can have justified that FPV is more attractive compared to GPV. ToD can be a useful government incentive to encourage NRE penetration in a country like Indonesia, which has a significant target to achieve in the future.
SAM delivers multiple solutions that the users can choose according to two types of solution mode from the financial parameter. PPA price is price value, which discussed in PPA negotiations. The specified IRR target solution mode allows the user to specify, through SAM, the IRR percentage as an input. Based on the expected IRR, SAM discovers the most appropriate PPA price to meet the target. For the IRR target year, this study uses the estimation years, which are commonly used, of a solar PV project, which is 10 years per IRR target year. The IRR value that is usually chosen is higher than the nominal discount rate, which is applicable in Indonesia. SAM calculates the nominal discount rate considering real and inflation rates. With the national data shown above, the nominal discount rate from SAM’s result is 13.56%. The findings of the PPA price results are shown as follows in Table 9.
From the result in this section, the authors try to shift the point of view in terms of project initiator from the government side, to state PPA price, to the investor point of view, which concerns the IRR target percentage. Therefore, the authors select an IRR of 14% as the minimum IRR to draw attention from the investor. From Table 9, on an IRR basis of 14%, the difference among FPV PPA and GPV PPA is 4.427 cents/kWh. The expansion of the PPA Price difference is not linear for increased IRR target sets. This means that, for more significant IRR targeted from the investors, GPV will cost exponentially higher compared to FPV.

4.5. Stochastic and Macro-Tornado Analysis in the Business Perspective

The authors see that various uncertain values of system inputs in the calculation will affect the system output result. Therefore, the authors set the +/− range of change in each main parameter, as shown in Table 10.
For minimizing and analyzing the result, this study uses stochastic analysis inside SAM to examine the output result of uncertain input value with a minimum of 800 sample simulations. The first analysis studies the effect of uncertain parameter inputs within the system cost to examine the LCOE output of both proposed projects. The second analysis uses uncertain determined input to examine IRR, and the third analysis examines NPV as an output result. This study develops sensitivity analysis through a tornado graph with a variable setting of the value alteration to describe specific factors of FPV and GPV that most affect the output results. After capturing the top 5 most significant impacts on output from the tornado graph, the authors subsequently undertake stochastic analysis with normal distribution in the probability scheme.
From the tornado graph chart in Figure 6 and histogram data sets in Table 11, the LCOE value in FPV is mostly dependent on many variables such as module cost, floater cost, engineering, the balance of the system, and O&M cost. Nevertheless, GPV influenced factors dominated by the land cost. However, a reduction in the GPV land cost parameter with 50% less input value still generates higher LCOE compared to the FPV LCOE base scenario. From the stochastic analysis, the histogram shows that the top 5 range possibility result, in the LCOE value from FPV, is located variously from 9.2 to 10.2 cents/kWh.
On the other hand, the top 5 range possibility from GPV shows the variation from 12.6 to 13.8 cents/kWh. The IRR on both FPV and GPV is mainly affected by the PPA Price value. PPA Price significantly affects the IRRS in both projects, with a range of variance of more than 70%.
Other parameters do not significantly impact IRR value. The second factor that affects IRR is the parameter of land cost in the GPV project and module cost on FPV. With IRR expectance above the nominal discount rate (13.56%), both projects create an IRR promising percentage. Net Present Value (NPV) is one of the methods to measure the economic analysis of project feasibility. It includes both cost and revenue values. A positive NPV indicates that a project is economically feasible, while a negative NPV value indicates an economically infeasible project. Uncertain values of floater cost on the FPV system affect the NPV value but not as significantly as the land cost impact on GPV NPV. The real discount rate and inflation rate uncertainty possibilities do not significantly affect NPV value on either project. From the histogram results, uncertainty input values still create the most positive NPV, more than 90% among all possibilities within value 0.18 to 0.34 million $. The GPV stochastic analysis result has a higher positive NPV value, of upto 0.9 million $, however among 800 running tests of statistical analysis and histogram analysis from Table 11 show that 8.7% (70 of 800) has a negative value (below zero) NPV.

5. Conclusions and Discussion

Through remote sensing methodology, the authors found that water temperature in the area of interest, Lake 1 and Lake 2 at the Cirata dam area, has a higher cooling temperature value compared to ground temperature of the Soil and Dam. There is approximately an 8 °C consistent annual temperature difference among water and ground surface temperature in the area of interest. The highest average temperature difference among water-based and ground-based areas of interest is 15 °C in early October, while the lowest difference is 3.8 °C in November and December. From the calculation, the authors estimate that FPV has a lower operating panel temperature, and generates higher efficiency compared to GPV. The authors calculate that FPV installation on location Lake 1 has 0.11% higher efficiency compared to ground solar PV.
Regarding system design, the required area to create 1 MW of solar PV system is approximately 1.527 acres. According to financial performance calculations, and considering the MoEMR regulation No 50 of 2017, and its amendment by regulation No 53 of 2018, the NRE tariff buy rate based on BCoG and its province show that the solar PV project in West Java province is economically unfeasible. The tariff is too low to attract attention from private investors to invest in solar PV projects. Financial parametric results show a negative NPV either for FPV or GPV projects.
The authors conclude that it requires a tariff of 9.90 cents/kWh for FPV and 13.4 cents/kWh for GPV to have a positive NPF in West Java province. The difference among those technologies is about 3.5 cents/kWh. If the difference is then applied to the annual energy yield that is produced from 1 MW of installation capacity, it estimates around $46,260 (647 million rupiahs) of savings, which can be obtainable from FPV utilization. Considering this benefit from FPV, a supported and clear regulation policy of FPV utilization in Indonesia must be put in place.
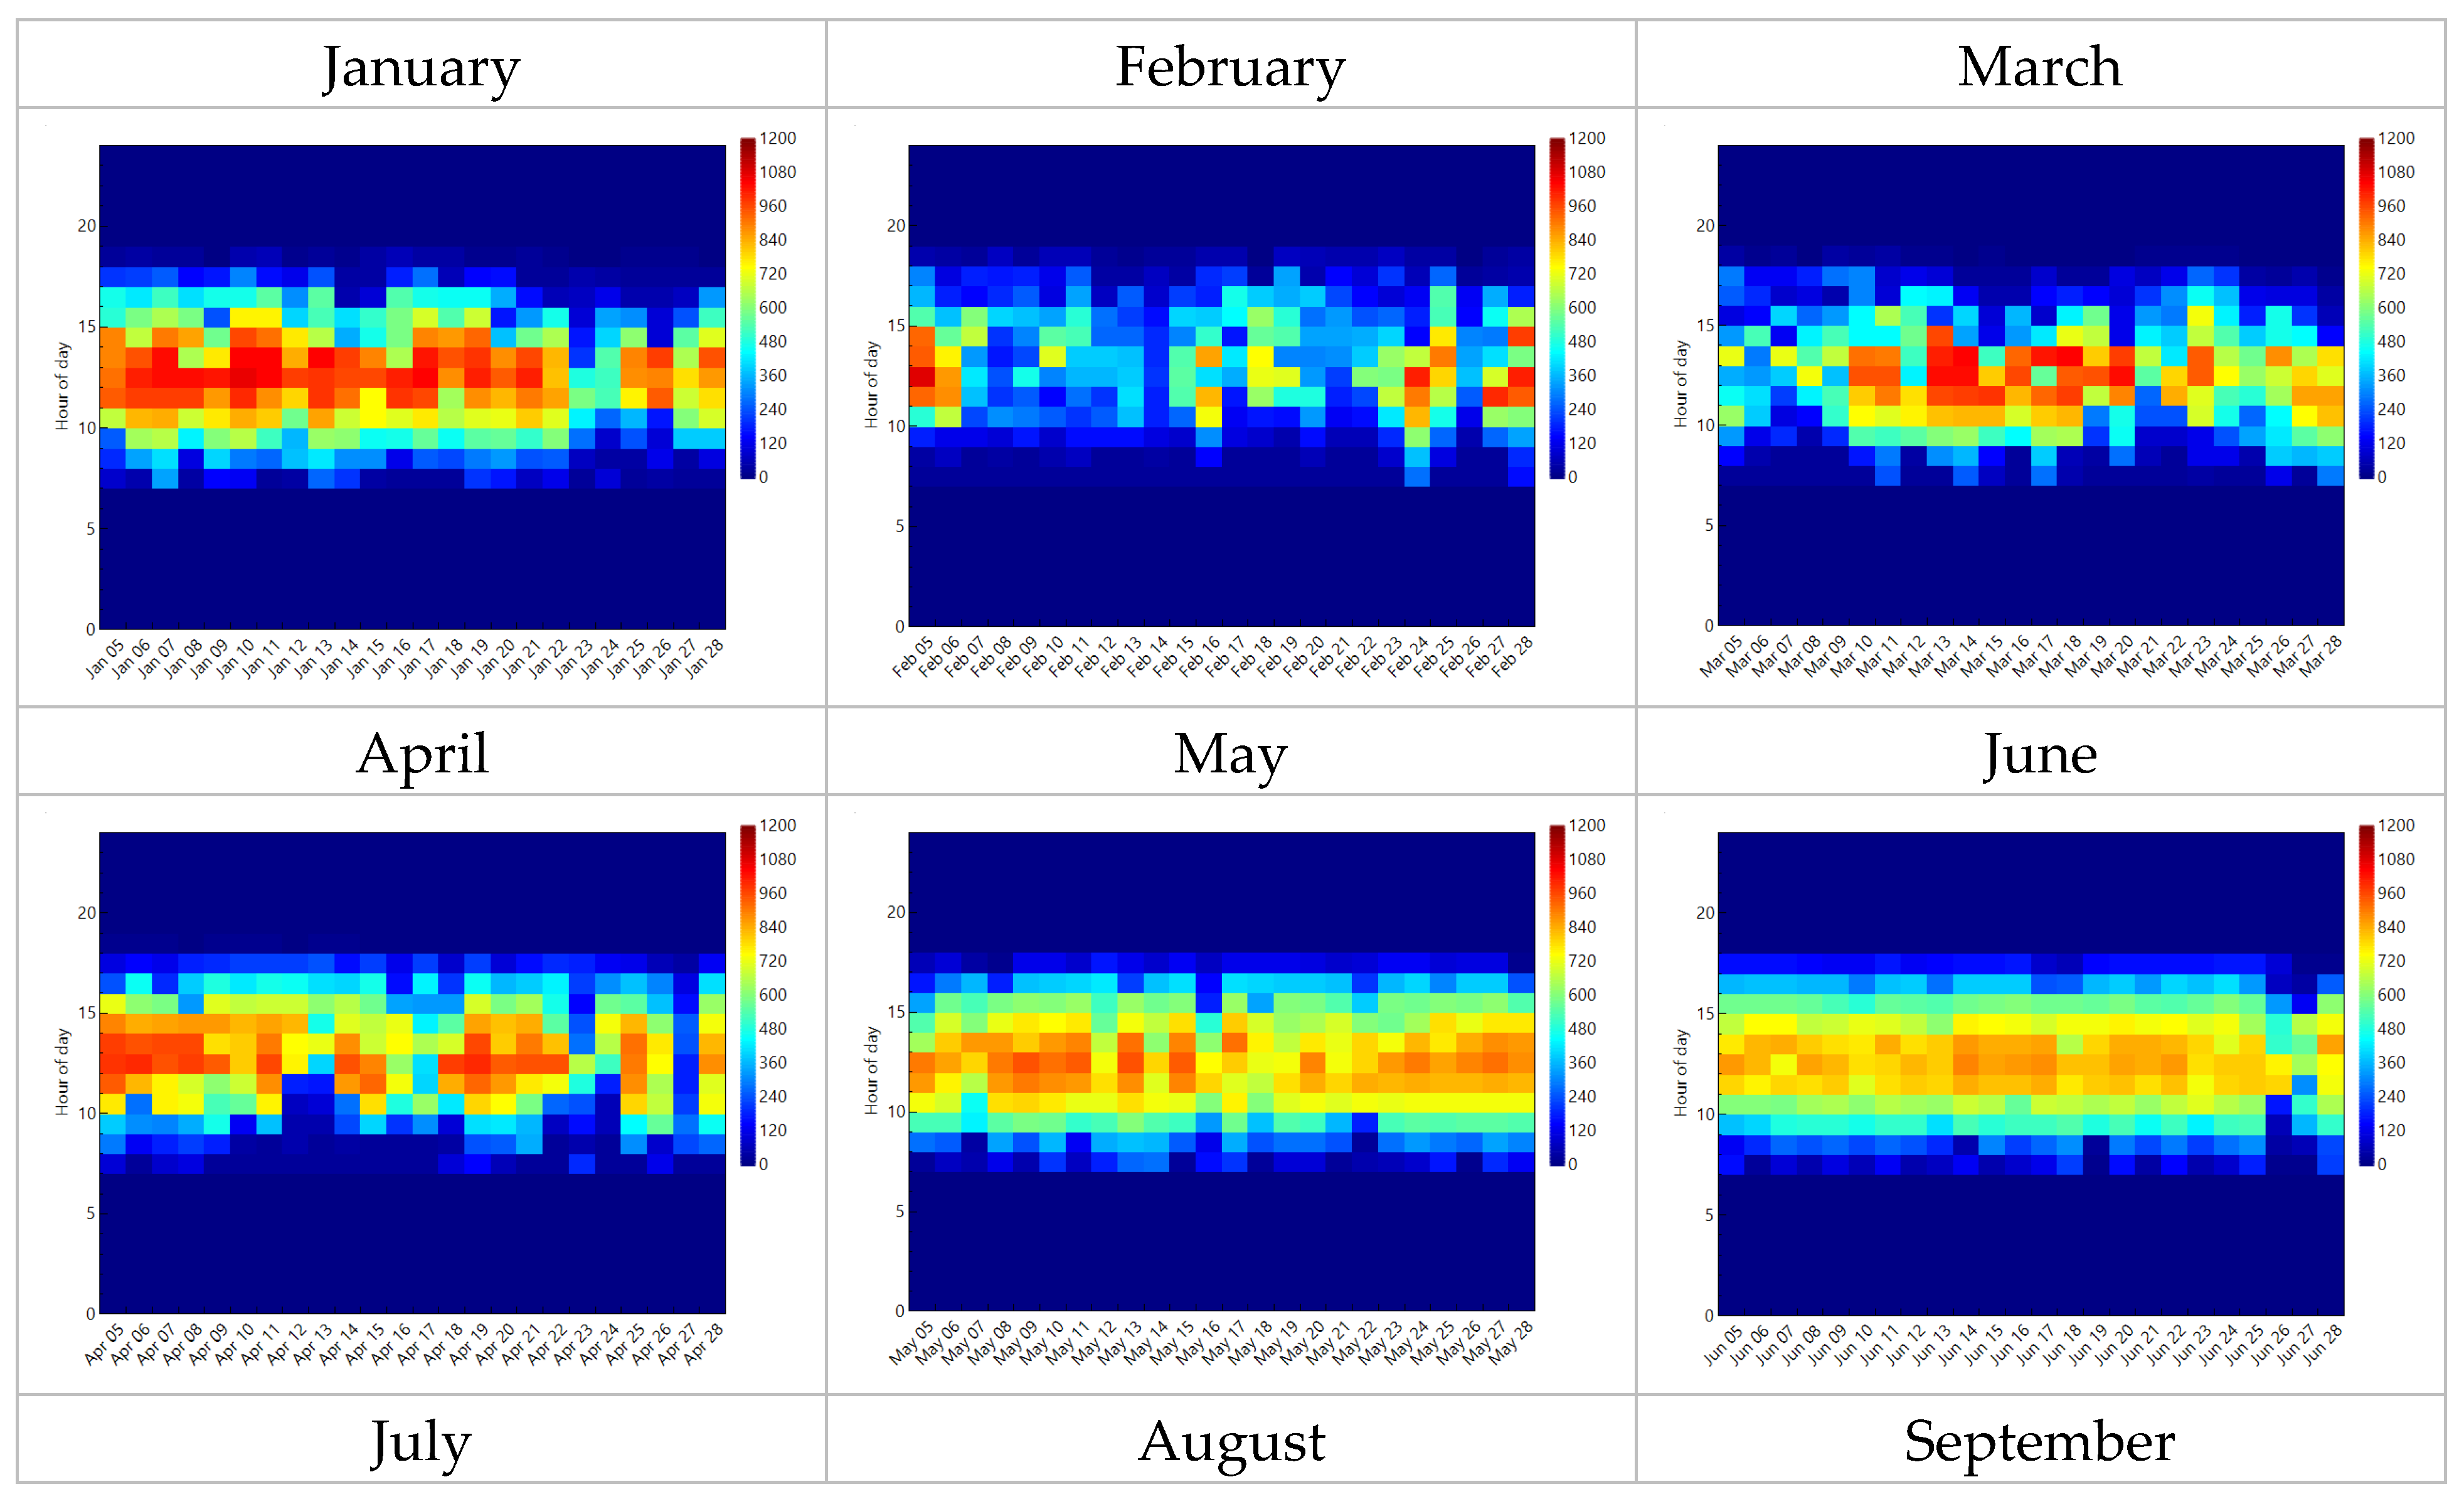
The suggestion of a more economically feasible solution on existing tariffs is tariff adjustment. The government can carry out this approach by raising tariffs within the range of BCoG and implementation of time on delivery (ToD) scheme factors. As done in analysis through using the ToD factor considering heat map irradiation, it is possible to achieve positive NPV by creating a unique ToD scheme. ToD scheme can become an active policy to achieve maximum cost by considering of the system itself. The proposed system in this study does not apply the energy storage system to release energy at peak hours, only the application of the ToD scheme in the study.
Financial analysis with stochastic uncertain values on the input parameter shows that FPV is a more promising and interesting investment project than GPV. With an existing parameter, the LCOE value of FPV was estimated at within 9.2 to 10.2 cents/kWh while GPV was estimated to be within 12.6 to 13.8 cents/kWh. The IRR stochastic result showed that a value for FPV and GPV of more than 14% are both associated with possible increases of more than 88%. Positive NPV for the FPV installation has a better probability value with 99.6% while GPV is in the 91.2% range possibility. Considering the performance and financial results of both technologies, this factor will draw attention from both the government and investor side to develop FPV. The authors consider that the limitations regarding this paper are uncertainty values. The first of these is in determining an exact point for the location to increase the accuracy of temperature measurement. The authors tried to mitigate this with detailed and thorough reading. The second is the assumption values on a couple of cost parameters. The authors tried to apply sensitivity and stochastic analysis to fluctuating cost and price in order to represent the most accurate approach. Based on the results, the authors can conclude that FPV offers several advantages to mitigate the challenges in the deployment of solar PV. Therefore, the authors suggest a better and clear policy regarding the utilization of water reservoirs as a location for FPV installation as one of the leading solutions for energy transition.

Author Contributions

Conceptualization, A.P.S.; Methodology, A.P.S., and K.N.K.; Validation, A.P.S., and K.N.K.; Investigation, A.P.S., and K.N.K.; Writing—original draft preparation, A.P.S.; Writing—review and editing, A.P.S. and K.N.K.; supervision, K.N.K.; Project administration, K.N.K.; funding acquisition, K.N.K. All authors have read and agreed to the published version of the manuscript.

Funding

This work was supported by a grant from the Human Resources Development program 20154010400100 of the Korea Institute of Energy Technology Evaluation and Planning (KETEP), funded by the Ministry of Trade, Industry, and Energy of the Korean Government, and supported by the KU-KIST Graduate School Project.

Conflicts of Interest

The authors declare no conflict of interest.

Nomenclature

ηpanel efficiency (%)
Ttemperature (°C)
βpanel coefficient value (°C)
GIrradiance (kWh/m2/day)
Vspeed (m/s)
stcstandard test condition
refreference/nominal condition
coperating condition
gpvground solar PV
fpvfloating solar PV
aambient
w1wind
w2water
noctnormal operating condition temperature (1000 W/m2)

References

  1. IEA. Energy Technology Perspectives 2017, IEA, Paris. 2017. Available online: https://www.iea.org/reports/energy-technology-perspectives-2017 (accessed on 5 October 2019).
  2. Government of Indonesia. President of Republic Indonesia Regulation no 22/2017 on National Energy General Plan; Government of Indonesia: Jakarta, Indonesia, 2017.
  3. World Economic Forum. Accelerating Sustainable Energy Innovation; World Economic Forum: Cologny, Switzerland, 2018. [Google Scholar]
  4. REN21 Century. Renewable Energy Network For 21st Renewables 2018 Global Status Report; REN21: Bonn, Germany, 2018. [Google Scholar]
  5. IRENA. Renewable Energy Benefits: Leveraging Local Capacity For Solar PV; IRENA: Abu Dhabi, UAE, 2017. [Google Scholar]
  6. S Corporation. US vineyard uses space saving floatovoltaics. Renew. Energy Focus 2008, 9, 64–65. [Google Scholar] [CrossRef]
  7. Mesbahi, M.; Minamino, S. Top 70 Floating Solar pv Plants Solarplaza. Available online: https://www.solarplaza.com/channels/top-10s/11761/top-70-floating-solar-pv-plants/ (accessed on 10 February 2019).
  8. IRENA. Renewable Power Generation Cost 2018; IRENA: Abu Dhabi, UAE, 2018. [Google Scholar]
  9. PLN, PT Statistik PT PLN 2018; PLN PT: Jakarta, Indonesia, 2018.
  10. Thi, N.D.A. The Evolution of Floating Solar Photovoltaics; Research Gate: Berlin, Germany, 2017. [Google Scholar]
  11. Sahu, A.; Yadav, N.; Sudhakar, K. Floating photovoltaic power plant: A review. Renew. Sustain. Energy Rev. 2016, 66, 815–824. [Google Scholar] [CrossRef]
  12. Durković, V.; Djurisic, Z. Analysis of the potential for use of floating pv power plant on the skadar lake for electricity supply of aluminium plant in Montenegro. Energies 2017, 10, 1505. [Google Scholar] [CrossRef] [Green Version]
  13. Kalaiselvan, S.; Karthikeyan, V.; Rajesh, G.; Kumaran, A.S.; Ramkiran, B.; Neelamegam, P. Solar pv active and passive cooling technologies—A review. In Proceedings of the 2018 International Conference on Computation of Power, Energy, Information and Communication (ICCPEIC), Tamil Nadu, India, 28–29 March 2018; pp. 166–169. [Google Scholar]
  14. Rishi, K.; Balachandran, M.; Raagul, G.; Srinivasagopalan, A.; Ramkiran, B.; Neelamegam, P. Solar cooling technologies—A review. In Proceedings of the 2018 International Conference on Computation of Power, Energy, Information and Communication (ICCPEIC), Tamil Nadu, India, 28–29 March 2018. [Google Scholar]
  15. Peng, Z.; Herfatmanesh, M.R.; Liu, Y. Cooled solar pv panels for output energy efficiency optimisation. Energy Convers. Manag. 2017, 150, 949–955. [Google Scholar] [CrossRef] [Green Version]
  16. Siecker, J.; Kusakana, K.; Numbi, B. A review of solar photovoltaic systems cooling technologies. Renew. Sustain. Energy Rev. 2017, 79, 192–203. [Google Scholar] [CrossRef]
  17. Pimentel da Silva, G.; Castelo Branco, D. Is floating photovoltaic better than conventional photovoltaic? Assessing environmental impacts. Impact Assess. Project Apprais. 2018, 36, 390–400. [Google Scholar] [CrossRef]
  18. Choi, Y.-K.; Lee, N.-H.; Kim, K.-J. Empirical research on the efficiency of floating pv systems compared with overland pv systems. In Proceedings of the 3rd International Conference on Circuits, Control, Communication, Electricity, Electronics, Energy, System, Signal and Simulation, Guam, USA, 19–20 July 2013; pp. 284–289. [Google Scholar]
  19. Trapani, K.; Redón Santafé, M. A review of floating photovoltaic installations: 2007–2013. Progress Photovol. Res. Appl. 2015, 23, 524–532. [Google Scholar] [CrossRef] [Green Version]
  20. Spencer, R.S.; Macknick, J.; Aznar, A.; Warren, A.; Reese, M.O. Floating photovoltaic systems: Assessing the technical potential of photovoltaic systems on man-made water bodies in the continental United States. Environ. Sci. Technol. 2018, 53, 1680–1689. [Google Scholar] [CrossRef] [PubMed]
  21. Liu, L.; Wang, Q.; Lin, H.; Li, H.; Sun, Q. Power generation efficiency and prospects of floating photovoltaic systems. Energy Proc. 2017, 105, 1136–1142. [Google Scholar] [CrossRef]
  22. Lee, Y.-G.; Joo, H.-J.; Yoon, S.-J. Design and installation of floating type photovoltaic energy generation system using frp members. Solar Energy 2014, 108, 13–27. [Google Scholar] [CrossRef]
  23. Rosa-Clot, M.; Tina, G.M. Submerged and Floating Photovoltaic Systems: Modelling, Design and Case Studies; Academic Press: Cambridge, MA, USA, 2017. [Google Scholar]
  24. Yadav, N.; Gupta, M.; Sudhakar, K. Energy assessment of floating photovoltaic system. In Proceedings of the 2016 International Conference on Electrical Power and Energy Systems (ICEPES), Bhopal, Madhya Pradesh, India, 14–16 December 2016; pp. 264–269. [Google Scholar]
  25. Azmi, M.S.M.; Othman, M.Y.H.; Ruslan, M.H.H.; Sopian, K.; Majid, Z.A.A. Study on electrical power output of floating photovoltaic and conventional photovoltaic. AIP Conf. Proc. 2013, 1571, 95–101. [Google Scholar]
  26. Majid, Z.; Ruslan, M.H.; Sopian, K.; Othman, M.Y.; Azmi, M. Study on performance of 80 watt floating photovoltaic panel. J. Mech. Eng. Sci. 2014, 7, 1150–1156. [Google Scholar] [CrossRef]
  27. Charles Lawrence Kamuyu, W.; Lim J., R.; Won C., S.; Ahn H., K. Prediction model of photovoltaic module temperature for power performance of floating pvs. Energies 2018, 11, 447. [Google Scholar] [CrossRef] [Green Version]
  28. Sharma, S.; Gray, D.K.; Read, J.S.; O’Reilly, C.M.; Schneider, P.; Qudrat, A.; Gries, C.; Stefanoff, S.; Hampton, S.E.; Hook, S. A global database of lake surface temperatures collected by in situ and satellite methods from 1985–2009. Sci. Data 2015, 2, 150008. [Google Scholar] [CrossRef] [Green Version]
  29. Verpoorter, C.; Kutser, T.; Seekell, D.A.; Tranvik, L.J. A global inventory of lakes based on high-resolution satellite imagery. Geophys. Res. Lett. 2014, 41, 6396–6402. [Google Scholar] [CrossRef]
  30. Hook, S.J.; Prata, F.J.; Alley, R.E.; Abtahi, A.; Richards, R.C.; Schladow, S.G.; Pálmarsson, S. Retrieval of lake bulk and skin temperatures using along-track scanning radiometer (atsr-2) data: A case study using Lake Tahoe, California. J. Atmospheric Oceanic Technol. 2003, 20, 534–548. [Google Scholar] [CrossRef] [Green Version]
  31. Pagano, T.S.; Durham, R.M. Moderate resolution imaging spectroradiometer (modis). In Proceedings of the Sensor Systems for the Early Earth Observing System Platforms, Orlando, FL, USA, 13–14 April 1993; pp. 2–17. [Google Scholar]
  32. Wloczyk, C.; Richter, R.; Borg, E.; Neubert, W. Sea and lake surface temperature retrieval from landsat thermal data in Northern Germany. Int. J. Remote Sens. 2006, 27, 2489–2502. [Google Scholar] [CrossRef]
  33. USGS. Landsat Missions. 2019. Available online: https://www.usgs.gov/land-resources/nli/landsat (accessed on 16 February 2019).
  34. Roy, D.P.; Wulder, M.A.; Loveland, T.R.; Woodcock, C.; Allen, R.G.; Anderson, M.C.; Helder, D.; Irons, J.R.; Johnson, D.M.; Kennedy, R. Landsat-8: Science and product vision for terrestrial global change research. Remote Sens. Environ. 2014, 145, 154–172. [Google Scholar] [CrossRef] [Green Version]
  35. Irons, J.R.; Dwyer, J.L.; Barsi, J.A. The next landsat satellite: The landsat data continuity mission. Remote Sens. Environ. 2012, 122, 11–21. [Google Scholar] [CrossRef] [Green Version]
  36. Pašalić, S.; Akšamović, A.; Avdaković, S. Floating photovoltaic plants on artificial accumulations—Example of Jablanica Lake. In Proceedings of the 2018 IEEE International Energy Conference (ENERGYCON), Limassol, Cyprus, 3–7 June 2018; pp. 1–6. [Google Scholar]
  37. Song, J.; Choi, Y. Analysis of the potential for use of floating photovoltaic systems on Mine Pit Lakes: Case study at the Ssangyong open-pit limestone mine in Korea. Energies 2016, 9, 102. [Google Scholar] [CrossRef]
  38. Lalwani, M.; Kothari, D.; Singh, M. Investigation of solar photovoltaic simulation softwares. Int. J. Appl. Eng. Res. 2010, 1, 585–601. [Google Scholar]
  39. Psomopoulos, C.S.; Ioannidis, G.C.; Kaminaris, S.D.; Mardikis, K.D.; Katsikas, N.G. A comparative evaluation of photovoltaic electricity production assessment software (pvgis, pvwatts and retscreen). Environ. Proces. 2015, 2, 175–189. [Google Scholar] [CrossRef]
  40. Blair, N.; Dobos, A.P.; Freeman, J.; Neises, T.; Wagner, M.; Ferguson, T.; Gilman, P.; Janzou, S. System Advisor Model, Sam 2014.1. 14: General Description; National Renewable Energy Lab. (NREL): Golden, CO, USA, 2014.
  41. Short, W.; Packey, D.J.; Holt, T. A Manual for the Economic Evaluation of Energy Efficiency and Renewable Energy Technologies; National Renewable Energy Lab.: Golden, CO, USA, 1995.
  42. Friedrich, C. Comparison of ArcGIS and QGIS for Applications in Sustainable Spatial Planning. Ph.D. Thesis, Universitat Wien, Vienna, Austria, 2014. [Google Scholar]
  43. Österman, A. Map visualization in ArcGIS, QGIS and Mapinfo. Master’s Thesis, KTH, Stockholm, Sweden, 2014. [Google Scholar]
  44. Congedo, L. Semi-automatic classification plugin documentation. Release 2016, 4, 29. [Google Scholar]
  45. Evans, D.; Florschuetz, L. Cost studies on terrestrial photovoltaic power systems with sunlight concentration. Solar Energy 1977, 19, 255–262. [Google Scholar] [CrossRef]
  46. Duffie, J.A.; Beckman, W.A. Solar Engineering of Thermal Processes; John Wiley & Sons: Hoboken, NJ, USA, 2013. [Google Scholar]
  47. Indonesia Ministry of Energy and Mineral Resources. In Mechanism for Determining Basic Cost of Generation PT PLN no 24/2017; Ministry of Energy and Mineral Resources: Jakarta, Indonesia, 2017. Available online: https://jdih.esdm.go.id/index.php/web/result?nomor_peraturan=24&tahun_terbit=2017 (accessed on 25 January 2019).
Figure 1. Schematic workflow of the Study.
Energies 13 02126 g001
Figure 2. Area of Interest (red circle).
Energies 13 02126 g002
Figure 3. Areas of the interest temperature trend.
Energies 13 02126 g003
Figure 4. Cirata dam irradiation heat map.
Energies 13 02126 g004aEnergies 13 02126 g004b
Figure 5. ToD scheme.
Energies 13 02126 g005
Figure 6. Stochastic and tornado chart result of LCOE, IRR, and NPV.
Energies 13 02126 g006aEnergies 13 02126 g006b
Table 1. Previous studies: Difference degrees of floating solar photovoltaic (FPV) efficiency with ground-based solar PV (GPV).
AuthorsReference No.Efficiency Differences
(+/− %)
Choi, Lee, et al. 2013[18]10.3; 13.5; and 11
Durković, Djurisic et al. 2015[12]31.29
Trapani, Santafé et al. 2015[19]20.0–25.0
Spencer, Macknick et al. 2018[20]−4.0–2.0
Liu, Wang, et al. 2017[21]1.58–2.0
Lee, Joo, et al. 2014[22]0.6–1.8
Rosa-clot, Tina, et al. 2017[23]10.0
Yadav and Gupta. 2016[24]0.79
Azmi, Othman, et al. 2013[25]2.82–14.58
Majid, Ruslan, et al. 2014[26]5.93–15.5
Kamuyu, Lim, et al. 2018[27]14.69
Table 2. Emissivity Value.
WaterBuilding DamVegetationBare Soil
0.990.940.980.94
Table 3. Solar module and Inverter specification.
Solar Module: SunPower SPR-220-BLKInverter Type: Schneider Electric Solar Inverter USA
GT500–480 (480 V)
Rated Power: 221.443 WattRated Power: AC: 500 kW
Nominal Efficiency (η): 17.8%Vmax_mppt: 480 V
Voltage Module: 40.8 VVmin_mppt: 310 V
βreff: −0.041/°CInverter DC to AC ratio: 0.99
Length × Width: 1.244 m × 1 mEfficiency: 97%
Lifetime Expectancy: 25 Years
Solar Module NOCT ConditionIrradiation: 1000 W/m2; Ambient temp (Ta): 25 °C; Module temp (Tc): 49.2 °C
Table 4. Area of interest coordinate.
Areas of InterestLake 1Lake 2SoilDam
GPS Coordinate6°41′54.2″S6°41′28.6″S6°39′19.0″S6°42′02.1″S
107°21′55.2″E107°20′47.6″E107°22′09.5″E107°22′02.4″E
Table 5. Solar PV efficiency prediction result.
LocationLake 1Lake 2SoilBuilding DamUnit
Efficiency17.58117.56417.46917.473%
Table 6. Predicted energy production of solar PV.
LocationLake 1Lake 2SoilDamUnit
Tilting12121012degrees
Potential Energy Yield1.4391.4321.4081.396GWh/year
Table 7. Base scenario result.
LocationTypeEnergy Yield (GWh)LCOE_Nominal_After Tax (cents/kWh)IRR(%)Net Present Value ($)
Lake 1Water1.4399.81−1.10−285,733
SoilGround1.40813.18−7.18−605,312
Table 8. Time on the Delivery result.
LocationTypeEnergy Yield (GWh)LCOE_Nominal_After Tax (cents/kWh)IRR (%)Net Present Value ($)
Lake 1ToD1.4399.8115.60320,025
SoilToD1.40813.187.13−15,132
Table 9. Power purchase agreement (PPA) price result under the target internal rates of return (IRRs).
LocationLake 1Soil
flip_target_irr (%)PPA price (cents/kWh)NPV
(million $)
PPA price (cents/kWh)NPV
(million $)
89.9860.01813.4740.028
1412.3740.25316.8010.349
Table 10. The range value of the financial parameter.
ParameterValueUnitSensitivity RangeUnit
Module Cost0.25$/Watt0.22–0.42$/Watt
Inverter Cost0.10$/Watt20%
Operation & Maintenance (O&M) Cost14.5$/kilo Watt10–19$/kWatt
Balance of System Cost0.13$/Watt50%
Analysis Period25Years−5–+10Years
Engineering Cost0.14$/watt50%
Permit and Environment Studies0.01$/Watt50%
Land Preparation Cost0.02$/Watt50%
PPA Price FPV12.374Cents/kWh60%
PPA Price GPV16.801Cents/kWh60%
Real Discount Rate10.11%5%
Floater Cost0.15$/Watt50%
Land Cost303,515$/acre−25–+100%
Degradation Rate0.5%10%
Insurance Rate0.5%20%
Inflation Rate3.131%10%
Table 11. Histogram data sets.
TypeParameterMeanMedianStandard DeviationUnit
GPVLCOE13.18013.1840.899Cents/kWh
IRR18.67918.6633.811%
NPV0.3500.3540.260Million $
FPVLCOE9.8079.8130.588Cents/kWh
IPP18.61318.5943.868%
NPV0.2530.2550.058Million $

