Article

Chronological Transition of Relationship between Intracity Lifecycle Transport Energy Efficiency and Population Density

1
Graduate School of Energy Science, Kyoto University, Kyoto 606-8501, Japan
2
Department of Mechanical Engineering, College of Science and Engineering, Ritsumeikan University, Shiga 525-8577, Japan
*
Author to whom correspondence should be addressed.
Energies 2020, 13(8), 2094; https://doi.org/10.3390/en13082094
Submission received: 27 March 2020 / Revised: 15 April 2020 / Accepted: 18 April 2020 / Published: 22 April 2020
(This article belongs to the Special Issue Life Cycle Assessment (LCA) of Environmental and Energy Systems)

Abstract

:
Interests in evaluating lifecycle energy use in urban transport have been growing as a research topic. Various studies have evaluated the relationship between the intracity transport energy use and population density and commonly identified its negative correlation. However, a diachronic transition in an individual city has yet to be fully analyzed. As such, this study employed transport energy intensity widely used for evaluating transport energy efficiency and obtained the transport energy intensity for each transportation means including walk, bicycle, automobile (conventional vehicles, electric vehicles, hybrid vehicles, and fuel cell vehicles), bus and electric train by considering the lifecycle energy consumption. Then, the intracity lifecycle transport energy intensity of 38 cities in Japan in 1987–2015 was computed, assuming that the cause of diachronic transition of intracity transport energy efficiency is the modal shifting and electricity mix change. As a result, the greater level of population density was associated with the lower intracity transport energy intensity in Japanese cities. The negative slope of its regression line increased over time since the intracity lifecycle transport energy intensity in cities with low population density continuously increased without any significant change of population density. Finally, this study discussed the strategic implications particularly in regional areas to improve the intracity lifecycle transport energy efficiency.

1. Introduction

In the last few decades, the global energy landscape in cities has dramatically changed due to the expansion of the global population and heavy industrialization [1]. Sustainable urban development is difficult to be achieved in view of current climate change and damages to the ecological environment [2]. Given the utmost importance of developing sustainable cities with high energy efficiency for policy makers [3], interests in evaluating energy consumption in cities have increasingly been growing as a research topic [4,5].
In particular, due to the rapid motorization and urbanization, the energy consumption in the city transport sector has been growing in the fastest manner in all energy-intensive sectors [6,7]. The transport sector is considered the most complex sector in which to reduce emissions [8] and the fuel use in the road transportation in 2050 is expected to increase by two times compared to that in 2010 [9]. Therefore, the improvement of intracity transport energy efficiency through the analysis of energy consumption in urban transport is required [10,11].
Various studies evaluated the relationship in the urban transport sector between the energy consumption and the city-related variables [12,13,14,15,16,17,18,19,20,21,22,23,24,25,26]. Some studies employed the top-down approach at the macro level by using cross-section data in cities (e.g., [16]), while other studies conducted the bottom-up approach by collecting the individual trip data (e.g., [19]). Energy-related indicators include transport energy consumption (e.g., gasoline consumption) and carbon dioxide emissions. Meanwhile, the city-related variables cover various perspectives including the urban form such as population, density, area as well as the social form such as gender, age, income, and job.
Although these relationships have been reviewed and summarized in detail in many studies (see [12,22,24]), in particular, a negative correlation between intracity transport energy consumption and population density was commonly identified in earlier studies.
However, a diachronic transition of energy-related value and urban form in an individual city has yet to be fully analyzed. Some papers assessed the transport energy consumption in a certain time range and identified the growth rate of transport energy consumption and land form in the provincial areas [15,20,26], whereas the transition of an individual city was not considered.
In addition, lifecycle thinking of energy consumption in the city transportation is of significant importance. One of the major lifecycle approaches accounts for the entire fuel consumption covering from well to wheel (WTW) [27]. The WTW fuel consumption has been analyzed for various transportation modes including automobiles [28] (conventional vehicles [29], hybrid vehicles [30], electric vehicles [31] and fuel cell vehicles [32]), trains [33] and bicycles [34]. The other lifecycle approach accounts for the energy consumption during all lifecycle phases including manufacture, operation, maintenance, and end-of-life [35]. These lifecycle approaches need to be integrated in the transport energy consumption in cities for an encompassing understanding of city transport.
One of the approaches for measuring the intracity transport energy efficiency is the consideration of modal split in a given area [36]. By using modal split, Schipper and his colleagues have analyzed the national transport energy intensity as a form of transport energy efficiency in Spain, Australia, France, United Kingdom, Japan and United States [37,38]. While various studies attempted to classify the determinants of urban modal choice from the perspectives of socio demography, spatial characteristics and socio psychology to further explore modal split [39,40], this study uses the modal split in the calculation to evaluate the intracity transport energy efficiency.
This study focuses on the passenger transport energy efficiency in Japanese cities. Limited studies on the urban transport energy consumption in Japan have been reported so far. Waygood et al., evaluated CO2 emissions in the transport sector in Osaka city considering the modal share [41]. Since Yang et al. pointed out the difficulty of applying the empirical studies in one country to another in this topic [26], the focus on Japanese cities would assist in the exploration of new spatial scope.
As such, the objective of this study is to analyze the chronological transition of relationship between intracity transportation energy efficiency and population density in Japanese cities by considering the lifecycle energy consumption of various transportation means. This study assumes that the cause of diachronic transition of intracity transport energy efficiency is the modal shifting and electricity mix change.
This study is structure as follows: Section 2 illustrates the methodology consisting of boundary of transport energy consumption, introduction of intracity transportation mode, the calculation of intracity transport energy efficiency, and data collection. The transport energy efficiency of each transportation mode is presented in Section 3. Section 4 presents the chronological relationship between intracity transport energy efficiency and population density. Section 5 discusses the potential implications of the current city transportation in Japan based on the obtained results and highlights the research limitations and future perspectives. Section 6 concludes the paper.

2. Materials and Methods

2.1. Boundary of Energy Consumption

A lifecycle phase of transportation means includes the material structure, assembly, operation, maintenance, and disposal. Most existing studies on the transport energy consumption in cities have focused on the tank to wheel (TTW) energy consumption during the operational phase. Meanwhile, the significant impact of energy consumption during the manufacturing phase, especially material structure, has been widely highlighted [28,42,43,44]. As such, this study considers energy consumption during the phases of material structure and operation among all lifecycle stages. The other phases are out of scope.
In addition, this study extends its boundary from TTW to WTW during the operational phase. In particular, energy consumption from well to tank (WTT) represents the energy input for the fuel production, which is the same range of energy consumption for material structure during the phase of manufacturing.
Although energy input for the development of transport infrastructure is significant and varies depending on the transportation modes, this study does not consider the energy input for the infrastructure.

2.2. Transporation Mode

Transportation modes in Japanese cities are mainly comprised of road, and urban rail. The transportation means and their corresponding fuel types in each of the transportation modes are summarized in Table 1.

2.3. Intracity Transport Energy Efficiency

This study employs the transport energy intensity which has been widely utilized for evaluating the transport energy efficiency [45,46]. The transport energy intensity of transportation means, referring to TEI (J/kg/m), is represented by energy consumption per distance per weights of both passengers and means.
The detailed steps for obtaining transport energy intensity are presented as follows. Subscripts and abbreviations used in this paper are summarized in Table 2.
First, energy consumption for the material structure was calculated based on the weight and rate of the composition of the transportation means and the energy consumption rate of composition, using the following equation:
Q m a t e r i a l =   ( M c i e i )
Energy consumption for the material structure accounts for the energy input of material production required for a vehicle body. Given that the inclusion of the manufacturing phase causes a change in the transport energy efficiency with operational duration, energy consumption during the operational phase was calculated on the basis of time series. TTW energy consumption during the operational phase per year was obtained by using the following equation:
Q o p e r a t i o n TTW = L d k
TTW energy consumption during the operational phase was multiplied with the fuel production rate to obtain the well-to-tank (WTT) energy consumption during the operational phase using the following equation:
Q o p e r a t i o n WTT = p f Q o p e r a t i o n TTW
WTW energy consumption during the operational phase was calculated using the following equation:
Q o p e r a t i o n = Q o p e r a t i o n WTT + Q o p e r a t i o n TTW
This study considered the entire weight of transportation by summing the weights of both the passengers and means. The average weight of a passenger was assumed to be 60 kg and the average occupancy rate was used for the calculation. The entire weight was obtained using the following equation:
m = M + 60 P r a v e .
Then, the transport energy intensity for each of transportation means was calculated using the following equation:
TEI t ,   x = Q m a t e r i a l ,   x + t Q o p e r a t i o n ,   x m x t L x
For the calculation of transport energy intensity in this study, the use duration of transportation means is a major parameter.
Finally, the intracity transport energy intensity was obtained by using the following equation.
CTEI y = x TEI y ,   x s y , x
38 cities in Japan are selected, and the chronological range assessed in this study is 1987–2015. In addition, for the calculation of intracity transport energy intensity, this study uses the TEI in the case of use duration of lifetime. In addition, since the assessed year range is 1987–2015, this study uses the TEI of conventional vehicles (CV) as a representative value of an automobile.
Two assumptions must be noted. Technical features of each transportation means are assumed to be identical through the assessed years. The WTT energy consumption of gasoline, light diesel and each power generation type is also assumed to be identical during the assessed years. Meanwhile, the transition of WTT energy consumption of electricity with time is calculated on a basis of electricity mix in Japan in each of assessed years. In other words, this study assumes that the cause of diachronic transition of intracity transport energy efficiency is the modal shifting and electricity mix change.

2.4. Data Collection

The energy consumption of material structure was obtained from MiLCA (version 2, Japan Environmental Management Association for Industry, Tokyo, Japan) [47]. The WTT energy consumption including gasoline, light diesel and each power generation type were obtained from Japan Automobiles Research Institute [48].
In the case of roadways, Corolla Fielder (Toyota), LEAF (Nissan), PRIUS (Toyota) and MIRAI (Toyota) represent CV, electric vehicles (EV), hybrid vehicles (HV) and fuel cell vehicles (FCV), respectively. The data for each type was taken from the authors’ previous research [28]. ERGA (Isuzu) represents buses and data was obtained from Kudo’s work [49]. In the case of railways, Yamanote line 205 system (JR-EAST) data represents electric trains and data was taken from the report of Institute of Energy Economics, Japan [50].
Modal split and population density in 38 Japanese cities in 1987, 1992, 1999, 2005, 2010, and 2015 were taken from Ministry of Land, Infrastructure and Transport [51], and Ministry of Internal Affairs and Communications [52]. Thirty-eight Japanese cities include Sapporo, Hirosaki, Morioka, Sendai, Shiogama, Yuzawa, Koriyama, Utsunomiya, Tokorozawa, Chiba, Matsudo, Tokyo, Yokohama, Kawasaki, Yamanashi, Kanazawa, Gifu, Nagoya, Kasugai, Kyoto, Uji, Osaka, Sakai, Kobe, Nara, Kainan, Matsue, Yasugi, Hiroshima, Kure, Tokushima, Imabari, Kochi, Nankoku, Kitakyusyu, Fukuoka, Kumamoto, and Hitoyoshi.

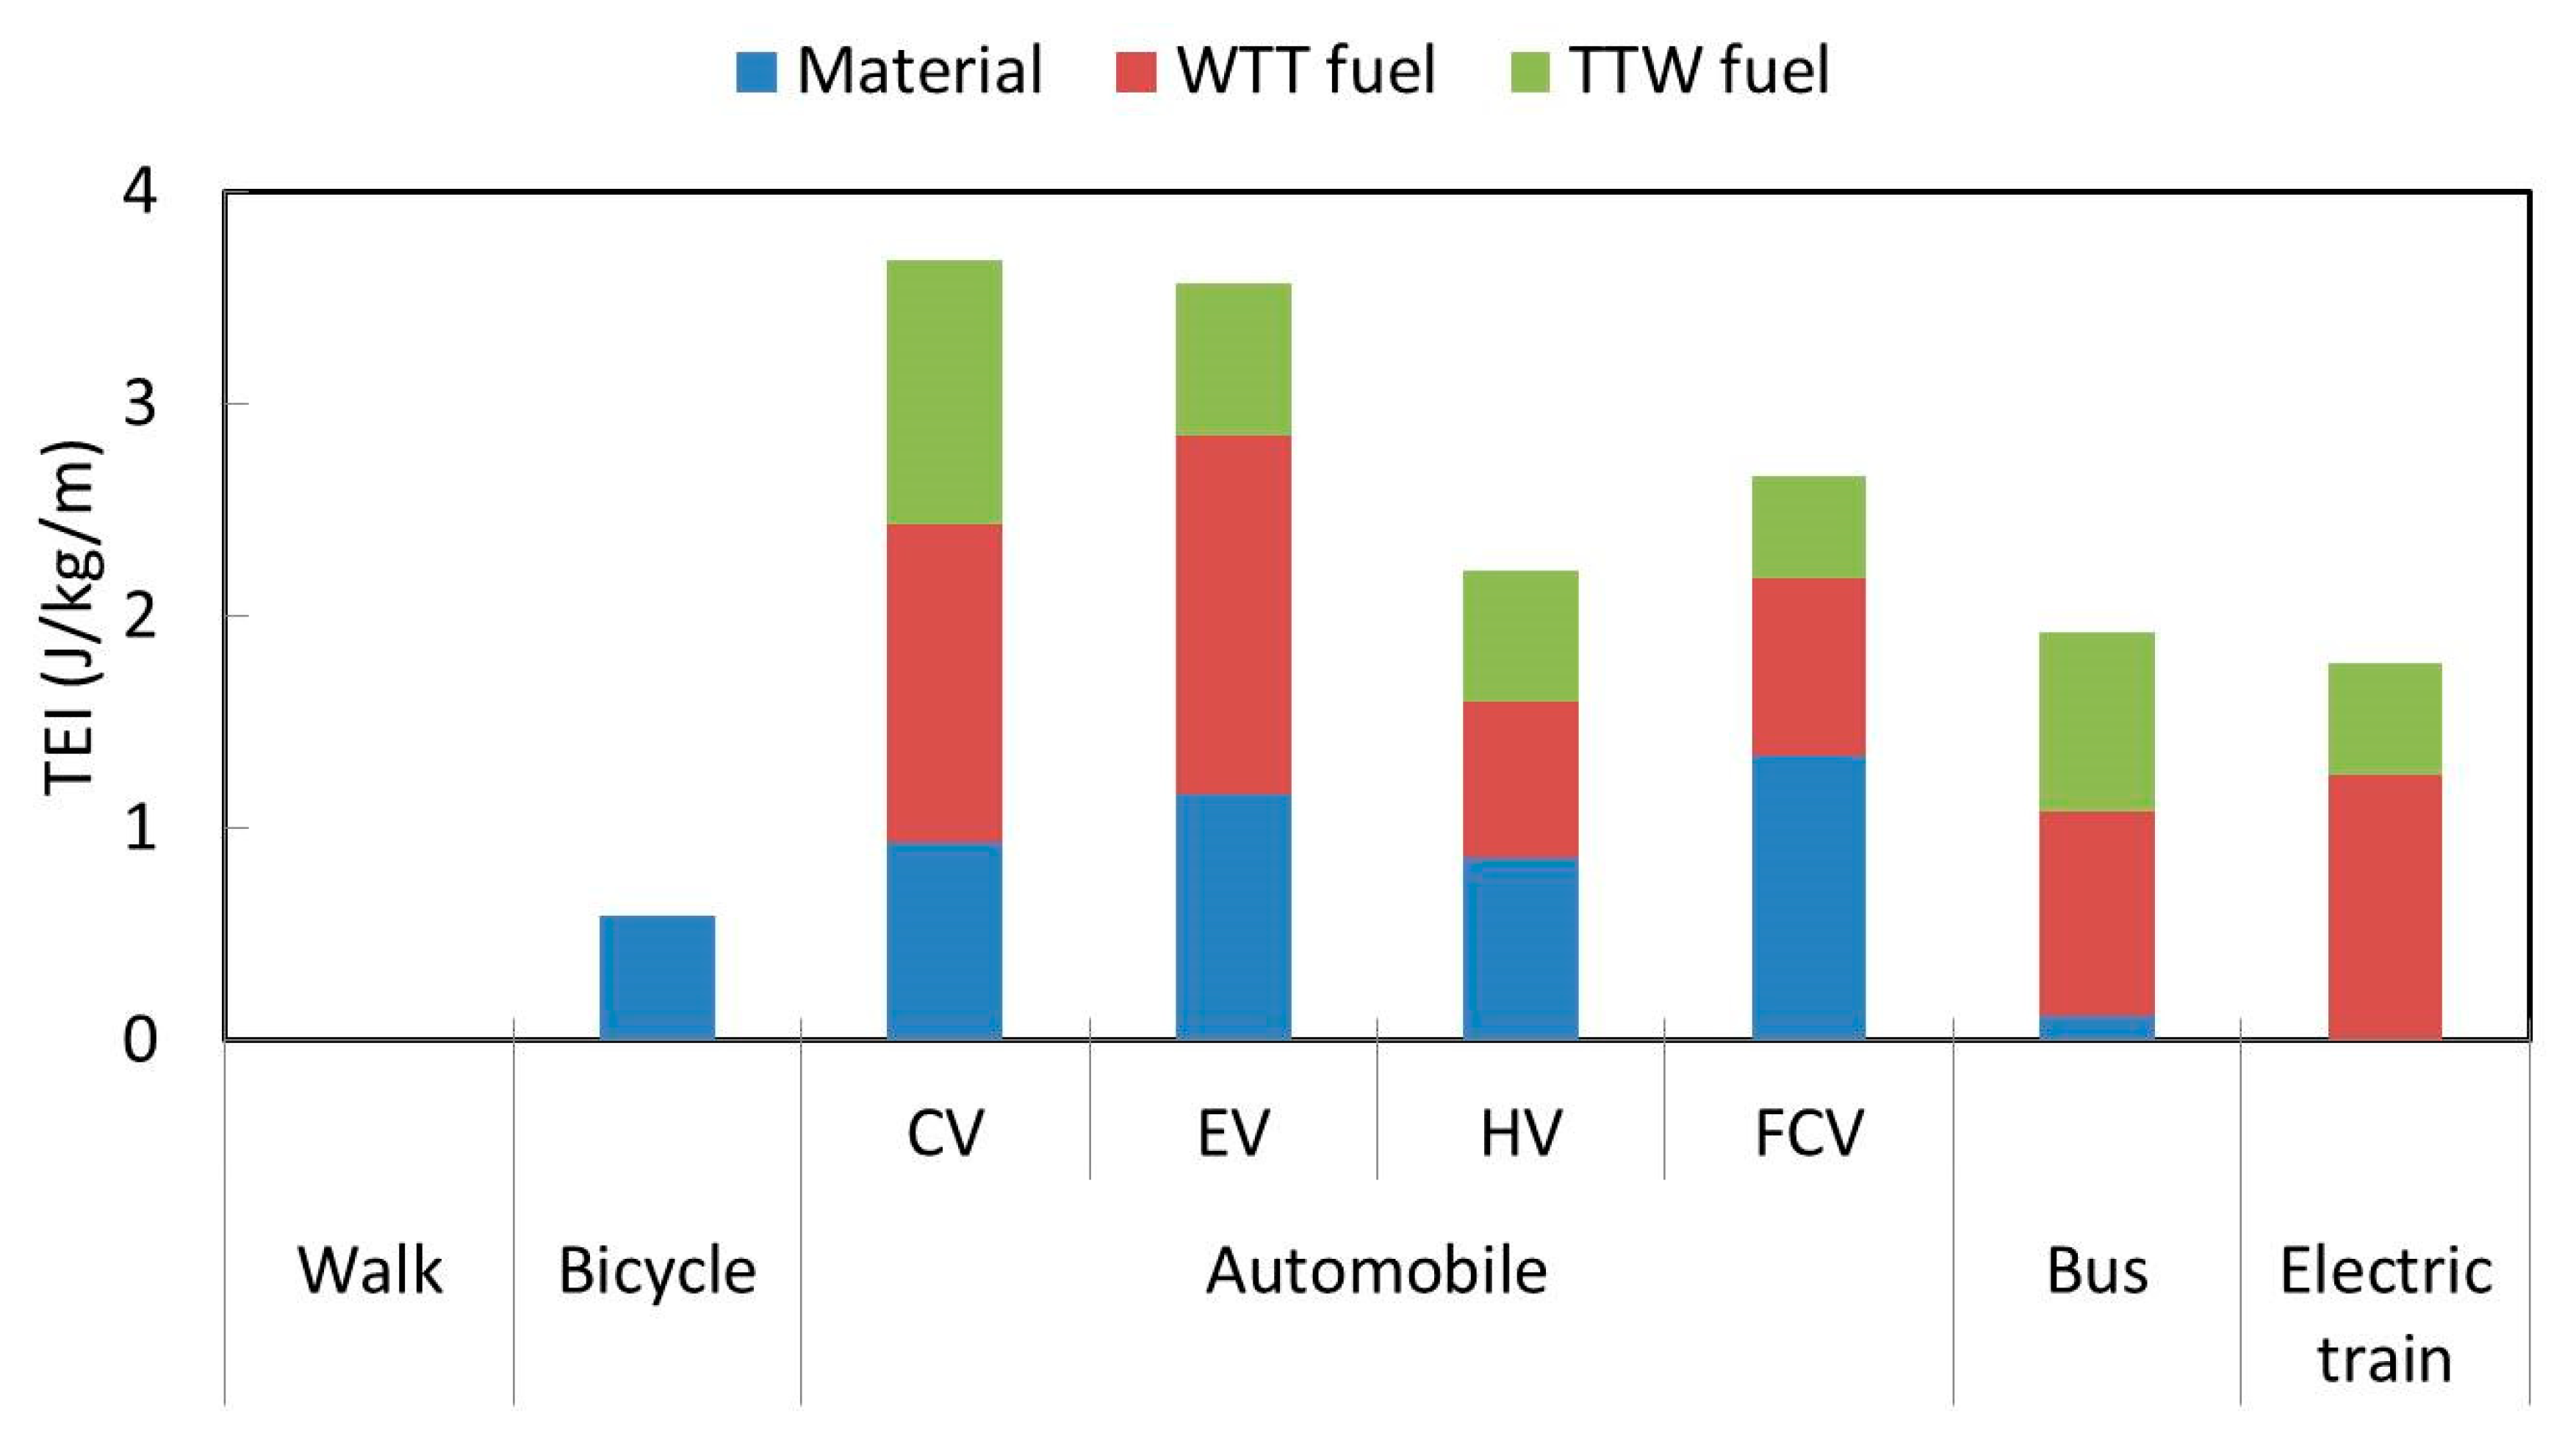
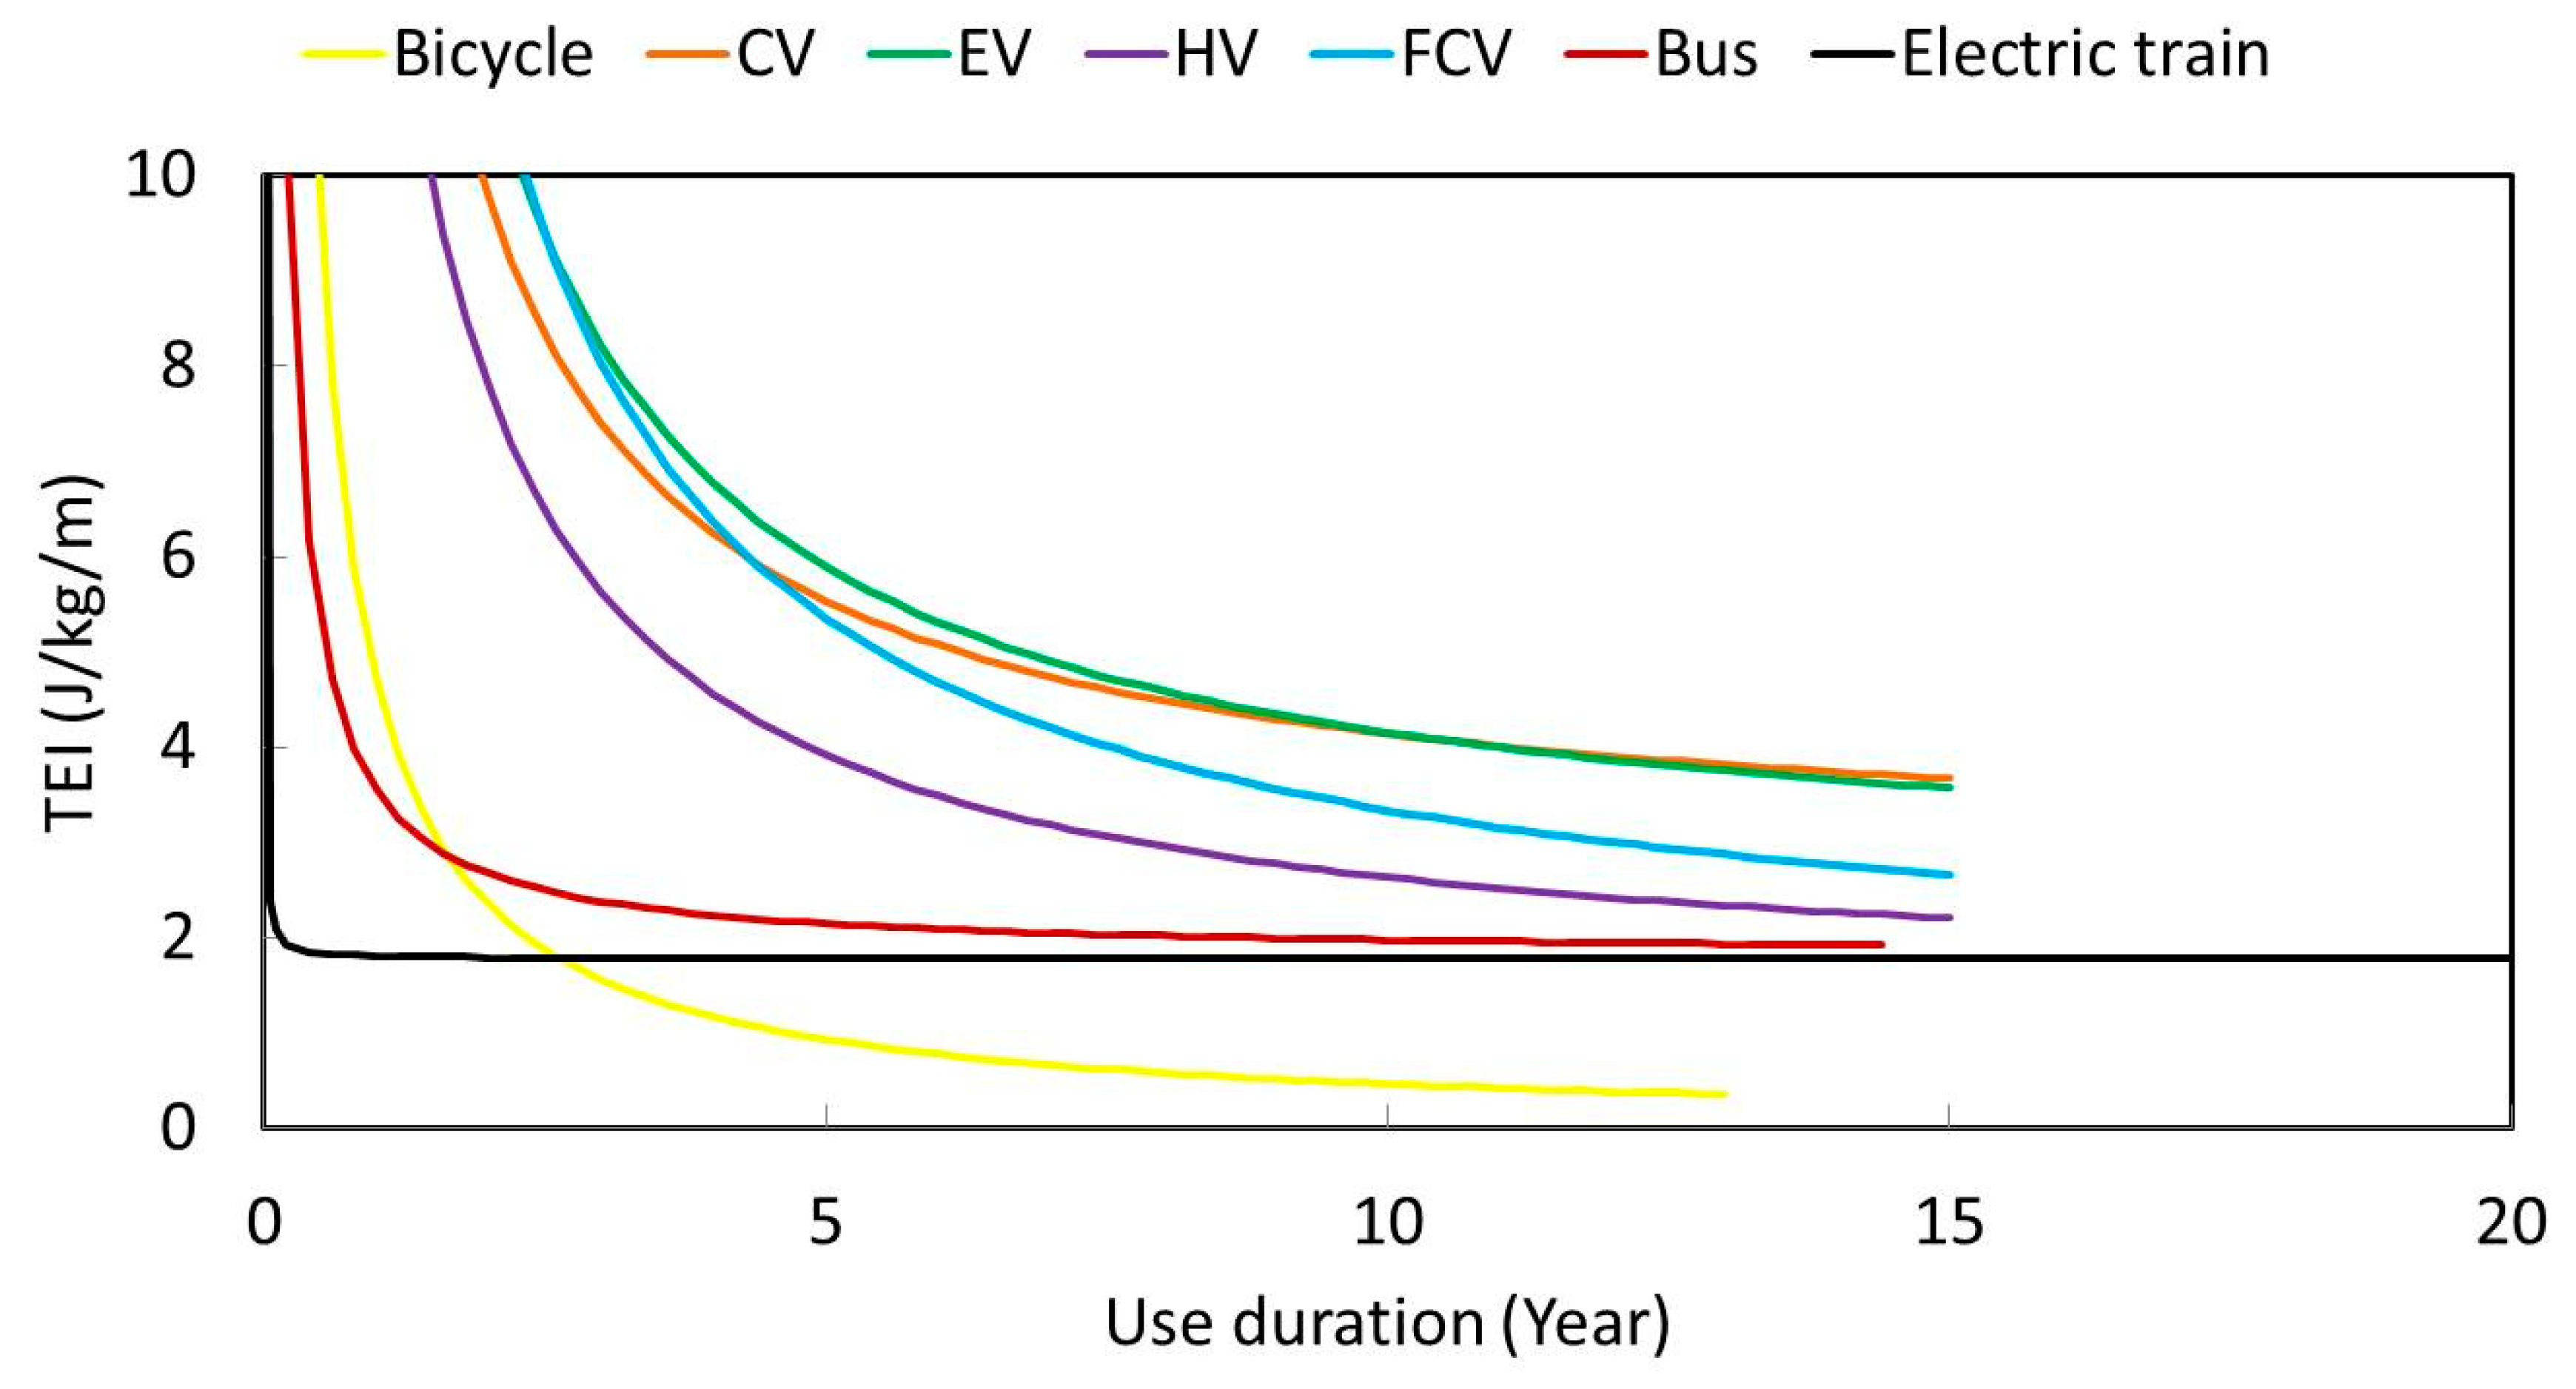
3. Transport Energy Intensity for Each of the Transportation Means

The energy utilization at the assessed phases is computed and summed to present the transport energy intensity for each of the transportation means. Parametric analysis is executed by changing the use duration.
First, the result in 2015 in the case of use duration of lifetime is shown in Figure 1. Transport energy intensity decreases in the order of automobiles, buses, electric trains, bicycles and walks. For small-scale transportation means including bicycles and automobiles, energy consumption for the material structure has a great contribution to determining the TEI. Meanwhile, the material structure hardly affects the transport energy intensity for large-scale transportation means including buses and electric trains.
In the various types of automobile, its TEI increases in the order of HV, FCV, EV and CV. The CV presents the greatest TTW fuel consumption in the TEI, whereas the EV and FCV have a higher impact of energy consumption for material structure. The installation of additional equipment such as motor and battery and the substituted material for the body such as aluminum replaced with iron in the EV and FCV [53] requires the greater volume of energy input for the material structure. Consequently, the difference of the TEI between CV and EV appears to be slight. Notably, whether to include the weight of vehicle body in the calculation of intensity brings upon different trends of outcomes. The previous author’s study [28], in which the transport energy efficiency of these automobile types was computed without considering the weight of vehicle body, showed the EV is the least efficient vehicle type.
In particular, due to the current electricity configuration in Japan, the WTT fuel consumption for the electricity production is significant. Given the lesser amount of energy input required for electricity production by renewables compared to fossil fuels [48], the increase in the share of renewables in the energy mix would contribute to the mitigation of the TEI of EV and electric trains.
Notably, the virgin materials are only taken into account and the recycled materials are not considered in the calculation of energy consumption under the manufacturing stage. The use of recycled materials would highly contribute to the reduction of energy consumption. For example, the recycling process could mitigate 97% and 65% of energy consumption for producing the virgin Al [54] and virgin Fe [55], respectively. Meanwhile, the recycling rate of Al in Japan has already reached 92.5% in 2017 [54]. The appropriate distribution of virgin and recycled Al is important to meet its incremental demand in the vehicle industry.
Then, the transport energy intensity in 2015, with the change of use duration, is monitored. The result is presented in Figure 2. The transport energy intensity of all of the transportation means decreases in inverse proportion to use duration. Particularly, for automobiles and bicycles, there remains room to improve the transport energy intensity by increasing in the use duration. If the lifetime is extended for another 5 years, the transport energy intensity of bicycle and automobile potentially increases by 38% and 6%, respectively. For electric trains, due to the negligibly small impact of material consumption on the transport energy intensity, its TEI almost remains the same after the three months of operation. This is because the dominator in Equation (6) is significantly greater than the energy consumption for material structure of electric train. The much heavier weight and longer movement distance of electric train compared with other transportation means would highly affect this difference. Given the longer lifetime of railway rolling stock compared with automobiles and buses, electric train would be an appropriate mean for urban transport.
Given that the lifetime extension of both bicycles and automobiles improve the transport energy intensity, promotions of domestic reuse and improvements of material durability are of utmost importance. While the various business models are involved in shipping used bicycles towards Asia and Middle East, its domestic reuse has yet to be fully operated [56]. On the other hand, improvement of material durability needs to be carefully taken into account. Particularly for automobiles, the material structure has been altered to the lightweight design [57]. While the reduction of vehicle weight leads to the improvement of fuel economy, there is a possibility that the energy requirement for a material structure is not mitigated due to the greater energy input for producing the replaced materials. Furthermore, the transition of material composition provokes the issue of raw material criticality. For example, replacement of steel with aluminum mitigates the environmental impacts [58] and relieves the concern of reserve [59] but deteriorates net import reliance [59]. Given that the reliance on raw materials in other countries is highly associated with security of supply and criticality issue [60], the transition of material structure affects not only the transport energy intensity of transportation means but also the criticality of product manufacturing.

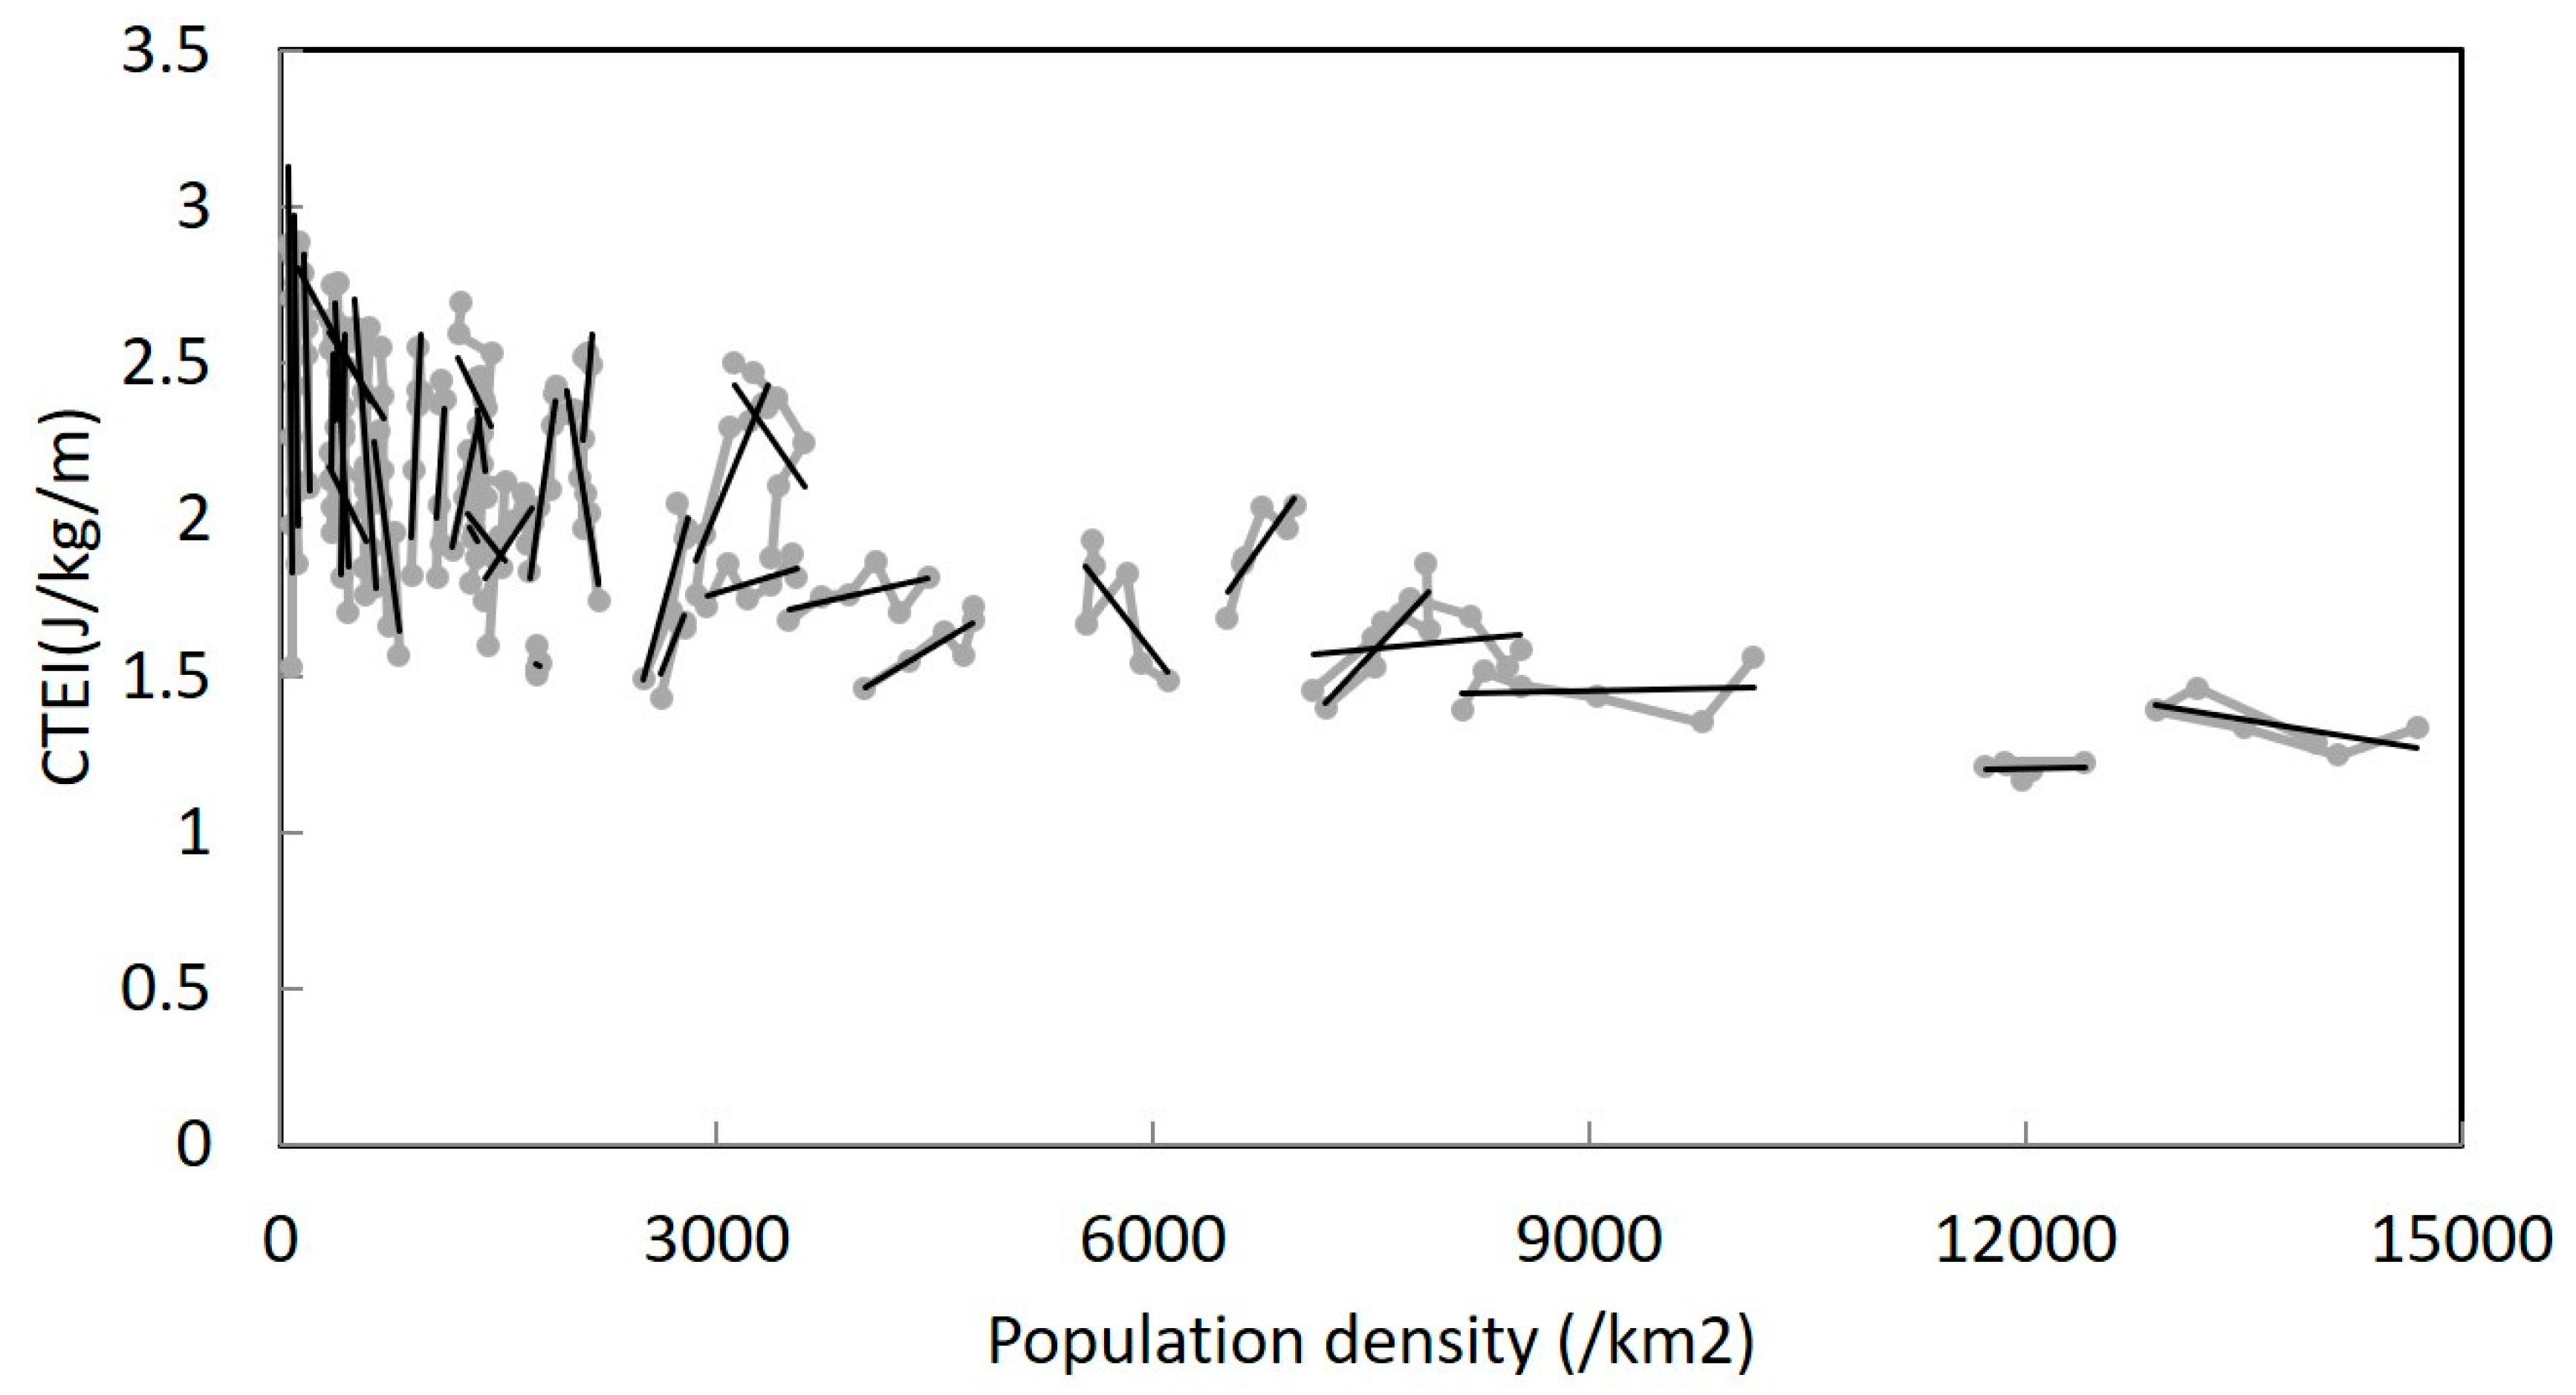
4. Relationship between Intracity Transport Energy Intensity and Population Density by Year

This Section presents the relationship between intracity transport energy intensity and population density. The obtained intracity transport energy intensities in 38 Japanese cities are presented in Appendix A.
First, the relationship between intracity transport energy intensity and population density in 1987, 1992, 1999, 2005, 2010, and 2015 is illustrated in Figure 3 and its regression model is presented in Table 3. In 1987–2015, the greater level of population density is associated with the lower intracity transport energy intensity in Japanese cities. This negative trend matches the global trend which has been widely reported (e.g., see the most well-known research work relevant to its trend conducted by Newman and Kenworthy [14]). Given the high score of R2, the high level of negative correlation in the range of 1987–2015 could be seen in Japan’s case. Meanwhile, it is seen that the regression coefficient becomes lower with time, which means the negative slope of regression line increases in the course of year.
Why did the regression coefficient increasingly grow with time? A more in-depth analysis is required to shed light on the mechanism of its relationship in Japan.
After the descriptive characteristics of the relationship between the intracity transport energy intensity and population density by year, a visual inspection with a focus on the transition of each of the assessed cities is executed to reveal the mechanism of its relationship.
The intracity transport energy intensity in the course of change in population density by city is presented in Figure 4. To show the trend of each city, the regression line is presented as well.
As for the group of low population density (~2500 persons/km2), in most of cities intracity transport energy intensity has been increasingly growing with almost no change of population density in 1987–2015. Some cities (e.g., Imabari, Kure, and Yamanashi) drastically decrease in population density while continuously increase in intracity transport energy intensity. The slope of regression line of most cities in this group indicates nearly 80°–90°.
As for the group of medium population density (2500 persons/km2 ~ 7000 persons/km2), the degree of increase in intracity transport energy intensity is moderated while the population density has slightly grown in some cities (Uji, Kobe, Kasugai, Nagoya, Matsudo) after 2000. The slope of regression line of these cities indicates 45°–65°. In addition, in some cities (Chiba, Fukuoka, Tokorozawa), the slight increase in intracity transport energy intensity is presented, while the population density has continuously grown due to population influx from regional areas. The slope of regression line of these cities indicates 10°–30°.
As for the group of high population density (7000 persons/km2~), the slope of regression line in all of cities (Yokohama, Kawasaki, Osaka, and Tokyo) indicates less than 1°. In Kawasaki, Osaka, Tokyo, the intracity transport energy intensity has almost remained the same or even has decreased, while the population density has continuously grown. Meanwhile, the U-shaped figure is observed in Yokohama. It must be noted that the intracity transport energy intensity in Kawasaki and Tokyo has increased from 2010 to 2015 although the modal split has not changed much. This might be because the fossil fuel contributes to the greater share in electricity mix after the Fukushima nuclear accident [61] and this causes the increase in the transport energy intensity of electric train.
Therefore, the main cause of the decrease in regression coefficient with time in 1987–2015 presented in Table 3 would be because the intracity transport energy intensity of each city continuously increased under the case of low population density while it slightly increased under the case of medium population density and remained almost the same in the case of high population density.

5. Discussion

The negative correlation between intracity transport energy intensity and population density was observed in the case of Japan. It was indicated that the negative slope of its regression line increases in the course of time in 1987–2015. In particular, the intracity transport energy intensity in cities with low population density has continuously increased without any significant change of population density. This would be because the reliance on automobiles has increased due to the difficulties in the development and extension of public transport systems from a financial perspective. For example, it is not considerably worthwhile from the financial perspective to invest money on extending the existing urban rail for a few settlements in less densely populated areas. In fact, transportation by rail in regional areas has declined and the operation of the railway in some regional areas has eventually been abandoned due to fiscal deficit in Japan. Meanwhile, the intracity transport energy intensity has slightly increased in cities with medium population density and almost remained the same in cities with high population density. This would be because the public transport system has already been well developed and the modal share of public transport (bus and electric train) has been consistently high.
Japanese population in 2050 is anticipated to decrease by 20% compared to 2012 [62]. Especially, population in cities of regional areas is projected to decrease by more than 20% due to the population influx as previously mentioned [63]. Considering the negative correlation presented in this study, there is a possibility that the intracity transport energy intensity will increase particularly in regional cities.
To address this issue in regional areas, the improvement of transport energy intensity is of significant importance for not only the technical aspects such as fuel economy and service life but also the social and regulatory aspects.
As for technical aspects, the transition of automobile type is important. According to Figure 1, the replacement of CVs with EVs may not significantly change the trend of intracity transport energy efficiency among 38 Japanese cities, whilst its replacement with HVs and FCVs would improve the intracity transport energy efficiency, particularly in regional areas. Considering various challenges in the development of hydrogen infrastructure for FCVs, improving the diffusion of HVs in less densely populated areas would be the first choice.
One of the promising social and regulatory approaches is to introduce the system of ridesharing. It must be noted that the transport energy intensity of automobiles in Japan have a significant room for improvement by increasing the occupancy rate. The number of vehicles privately owned in regional areas has increased in recent decades [64], which may potentially cause a decrease in a number of carried passengers for each of transportation means by trip and a drop in the transport energy intensity of automobiles. The promotion of ridesharing systems might contribute to an increase in occupancy rate. Still, ridesharing is an emerging concept in Japan. Although ridesharing was recently introduced in two underpopulated areas in Japan empirically, the taxi industry staunchly opposes the legalization of ridesharing. In addition, 70% of Japanese people are not willing to make use of ridesharing because of uncomfortableness of sharing vehicles with strangers [65]. To the contrary of negative impressions, ridesharing could deliver various advantages for passengers including reduction of fee and waiting time and free from commute stress [66]. Control of vehicle ownership by taxation [67], establishment of legal system and briefing of ridesharing concept for public hearing would be necessary to increase automobile occupancy rate.
Other conceivable social and regulatory approach would be to obligate elderly drivers to return the driver license. Following a series of frequent fatal traffic accidents caused by elderly drivers, its suitability for making compulsory has been heavily debated. The National Police Agency in Japan has only advised drivers 65 and older to consider surrendering their driver license of their own accord, although it has yet to be legalized [68]. The findings in this research may imply its necessity from the perspectives of transport energy efficiency. The population aging rate in 2050 will increase by 40% compared with 2012 [69]. The automobile modal split for people aged 65 or older has increased from 15% in 1987 to 37.3% in 2010 in three major metropolitan areas as well as from 18.5% in 1987 to 57.6% in 2010 in regional urban areas [70]. Particularly in cities with low population density, this trend would highly affect the increase in the CTEI. Considering that the super-aging society in Japan will potentially exacerbate problems with intracity transport energy efficiency on the basis of the current trend, to obligate elderly drivers to return the driver license would contribute to its improvement.
Notably, this obligation would raise a concern about deteriorating the quality of life for the elderly in regional cities where public transportation is not well developed. People tend to stay at the attached city where they have lived even in an inconvenient area [63]. The establishment of transportation systems such as ridesharing as previously mentioned and small-scale public transportation (e.g., minibus) with financial support as well as city compactification without a forced relocation, would be important.
Future perspectives of this study need to be mentioned.
The chronological transition in technical features in each transportation means and the energy consumption for the production of gasoline, light diesel and each power generation type will be further investigated to aid in more accurate calculation of intracity transport energy intensity.
Other lifecycle stages including maintenance and end-of-life need to be included in the future research. The next generation vehicles such as EV, in particular, need to replace the battery due to the degradation of its quality, and its replacement requires energy to some extent during the maintenance stage. The lifespan of battery used in the next generation vehicles is around 8–10 years, and the battery needs to be replaced even before exhausting the lifetime of vehicle. Besides that, the energy consumption for the infrastructure development for each of the transportation means will be addressed. In spite of the argument in favor of electric trains in urban railways in this study, the inclusion of energy consumption for the development of rail infrastructure might change the result. The extension of the boundary for energy consumption in the transport sector would provide more comprehensive information on the transport energy intensity for each transportation means.
The energy consumption under the operation stage used in this study was on the basis of average fuel economy given in the data lists of representative transport means in a top-down approach, whereas the energy efficiency in the transport sector is somewhat dependent on the local urban environment and driving patterns [71]. The empirical examination in a bottom-up approach would assist in a detailed investigation of the relationships between energy use and city form.

6. Conclusions

This study has first obtained the transport energy intensity for each of the transportation means including walk, bicycle, automobile (CV, EV, HV, FCV), bus and electric train by considering the lifecycle energy consumption. Based on the modal split, the intracity transport energy intensity of 38 cities in Japan in 1987–2015 has been computed. Then, the chronological relationship between intracity transport energy intensity and population density by year has been presented. Finally, to reveal the mechanism of its relationship, the transition of each of assessed cities has been visually monitored.
Findings are as follows:
  • Transport energy intensity decreases in the order of automobiles, buses, electric trains, bicycles and walks.
  • For small-scale transportation means including bicycles and automobiles, energy consumption for the material structure has a great contribution to determining the transport energy intensity.
  • Material structure hardly affects the transport energy intensity for large-scale transportation means including buses and electric trains.
  • The greater level of population density is associated with the lower intracity transport energy intensity in Japanese cities, as seen in earlier studies with a focus on other spatial scopes.
  • The negative slope of its regression line between intracity transport energy intensity and population density increases over time in 1987–2015.
The main cause of the decrease in the regression coefficient with time in Japan in 1987–2015 between intracity transport energy intensity and population density could be that, in cities with low population density, the intracity transport energy intensity continuously increases without any significant change of population density while, with increasing population density slightly increases in cities with a medium population density and almost remains the same in cities with a high population density.

Author Contributions

Conceptualization, S.K., M.Y. and E.Y.; methodology, S.K., M.Y. and E.Y.; validation, S.K., M.Y. and E.Y.; formal analysis, S.K. and M.Y.; investigation, M.Y.; resources, S.K. and M.Y.; data curation, M.Y.; writing—original draft preparation, S.K.; writing—review and editing, E.Y.; visualization, S.K.; supervision, E.Y.; project administration, E.Y.; funding acquisition, E.Y. All authors have read and agreed to the published version of the manuscript.

Funding

This study was partly supported by research funds from KAKENHI Grants (26281056, and 19H04329) and from the Environment Research and Technology Development Fund (S-16).

Conflicts of Interest

The authors declare no conflict of interest. The funders had no role in the design of the study; in the collection, analyses, or interpretation of data; in the writing of the manuscript, or in the decision to publish the results.

Appendix A

Table A1. Intracity transport energy intensity for each of 38 Japanese cities#.
CityYear
198719921999200520102015
Sapporo1.741.951.992.081.921.99
Hirosaki1.832.052.392.552.542.64
Morioka1.761.842.032.102.222.12
Sendai1.771.902.072.222.212.30
Shiogama1.882.102.252.392.472.50
Yuzawa1.531.982.272.712.882.88
Koriyama1.822.302.362.492.612.56
Utsunomiya1.962.272.362.532.592.69
Tokorozawa1.461.551.641.561.681.72
Chiba1.721.861.741.791.891.82
Matsudo1.401.531.671.691.651.86
Tokyo1.291.461.391.331.241.33
Yokohama1.461.621.751.691.531.58
Kawasaki1.391.511.471.431.351.56
Yamanashi2.172.382.612.662.892.85
Kanazawa1.822.152.362.412.552.40
Gifu1.972.252.502.512.532.52
Nagoya1.681.861.872.041.972.05
Kasugai1.761.952.292.312.372.36
Kyoto1.541.521.601.501.521.55
Uji1.491.701.941.971.952.05
Osaka1.221.231.211.221.161.20
Sakai1.481.541.831.661.931.85
Kobe1.431.661.711.671.671.65
Nara1.601.801.882.051.942.10
Kainan1.781.912.092.402.592.61
Matsue1.962.042.142.602.632.75
Yasugi1.862.092.432.712.762.84
Hiroshima1.601.881.852.122.132.06
Kure1.571.961.662.162.282.13
Tokushima1.932.182.072.382.462.45
Imabari1.702.022.262.472.512.57
Kochi1.812.041.922.382.442.37
Nankoku2.032.292.162.472.762.75
Kitakyusyu1.742.022.082.132.352.34
Fukuoka1.681.751.761.871.701.82
Kumamoto1.832.042.092.302.402.42
Hitoyoshi2.102.122.522.612.712.78

References

  1. Parshall, L.; Gurney, K.; Hammer, S.A.; Mendoza, D.; Zhou, Y.; Geethakumar, S. Modeling energy consumption and CO2 emissions at the urban scale, methodological challenges and insights from the United States. Energy Policy 2010, 38, 4765–4782. [Google Scholar] [CrossRef]
  2. Dulal, H.B.; Brodnig, G.; Onoriose, C.G. Climate change mitigation in the transport sector through urban planning: A review. Habitat Int. 2011, 35, 494–500. [Google Scholar] [CrossRef]
  3. Kennedy, C.; Baker, L.; Dhakal, S.; Ramaswami, A. Sustainable urban systems. J. Ind. Ecol. 2012, 16, 775–779. [Google Scholar] [CrossRef]
  4. Bulkeley, H.; Broto, V.C.; Maassen, A. Low carbon transitions and the reconfiguration of urban infrastructure. Urban Stud. 2014, 51, 1471–1486. [Google Scholar] [CrossRef] [Green Version]
  5. Rutherford, J.; Jaglin, S. Introduction to the special issue-Urban energy governance: Local actions, capacities and politics. Energy Policy 2015, 78, 173–178. [Google Scholar] [CrossRef]
  6. Ma, J.; Liu, Z.; Chai, Y. The impact of urban form on CO2 emission from work and non-work trips: The case of Beijing, China. Habitat Int. 2015, 47, 1–10. [Google Scholar] [CrossRef]
  7. Wang, Y.; Yang, L.; Han, S.; Li, C.; Ramachandra, T.V. Urban CO2 emissions in Xi’an and Bangalore by commuters: Implications for controlling urban transportation carbon dioxide emissions in developing countries. Mitig. Adapt. Strateg. Glob. Chang. 2017, 22, 993–1019. [Google Scholar] [CrossRef]
  8. Brand, C.; Tran, M.; Anable, J. The UK transport carbon model: An integrated life cycle approach to explore low carbon futures. Energy Policy 2012, 41, 107–124. [Google Scholar] [CrossRef] [Green Version]
  9. IEA. Technology Roadmap. Fuel Economy of Road Vehicles; Technical Report; International Energy Agency: Paris, France, 2012. [Google Scholar]
  10. Osorio, C.; Nanduri, K. Energy-Efficient Urban Traffic Management: A Microscopic Simulation-Based Approach. Transp. Sci. 2015, 49, 637–651. [Google Scholar] [CrossRef]
  11. Zhao, P.J.; Diao, J.J.; Li, S.X. The influence of urban structure on individual transport energy consumption in China’s growing cities. Habitat Int. 2017, 66, 95–105. [Google Scholar] [CrossRef]
  12. Cao, X.; Yang, W. Examining the effects of the built environment and residential self-selection on commuting trips and the related CO2 emissions: An empirical study in Guangzhou, China. Transp. Res. Part D Transp. Environ. 2017, 52, 480–494. [Google Scholar] [CrossRef]
  13. Hughes, B.; Chambers, L.; Lansdell, H.; White, R. Cities, area and transport energy. Road Transp. Res. 2004, 13, 72. [Google Scholar]
  14. Newman, P.W.G.; Kenworthy, J.R. Gasoline Consumption and Cities: A comparison of U.S. Cities with a Global Survey. J. Am. Plan. Assoc. 1989, 55, 24–37. [Google Scholar] [CrossRef]
  15. Muniz, I.; Galindo, A. Urban form and the ecological footprint of commuting: The case of Barcelona. Ecol. Econ. 2005, 55, 499–514. [Google Scholar] [CrossRef]
  16. Newman, P. The environmental impact of cities. Environ. Urban. 2006, 18, 275–295. [Google Scholar] [CrossRef]
  17. Shim, G.E.; Rhee, S.M.; Ahn, K.H.; Chung, S.B. The relationship between the characteristics of transportation energy consumption and urban form. Ann. Reg. Sci. 2006, 40, 351–367. [Google Scholar] [CrossRef]
  18. Alford, G.; Whiteman, J. Macro-urban form and transport energy outcomes: Investigations for Melbourne. Road Transp. Res. 2009, 18, 53–67. [Google Scholar]
  19. Brownstone, D.; Golob, T.F. The impact of residential density on vehicle usage and energy consumption. J. Urban Econ. 2009, 65, 91–98. [Google Scholar] [CrossRef] [Green Version]
  20. Hankey, S.; Marshall, J.D. Impacts of urban form on future US passenger-vehicle greenhouse gas emissions. Energy Policy 2010, 38, 4880–4887. [Google Scholar] [CrossRef]
  21. Karathodorou, N.; Graham, D.; Noland, R. Estimating the effect of urban density on fuel demand. Energy Econ. 2010, 32, 86–92. [Google Scholar] [CrossRef] [Green Version]
  22. Su, Q. The effect of population density, road network density, and congestion on household gasoline consumption in U.S. urban areas. Energy Econ. 2011, 33, 445–452. [Google Scholar] [CrossRef]
  23. Clark, T.A. Metropolitan density, energy efficiency and carbon emissions: Multi-attribute tradeoffs and their policy implications. Energy Policy 2013, 53, 413–428. [Google Scholar] [CrossRef]
  24. Modarres, A. Commuting and energy consumption: Toward an equitable transportation policy. J. Transp. Geogr. 2013, 33, 240–249. [Google Scholar] [CrossRef]
  25. Aguiléra, A.; Voisin, M. Urban form, commuting patterns and CO2 emissions: What differences between the municipality’s residents and its jobs? Transp. Res. Part A Policy Pract. 2014, 69, 243–251. [Google Scholar] [CrossRef]
  26. Yang, W.; Li, T.; Cao, X. Examining the impacts of socio-economic factors, urban form and transportation development on CO2 emissions from transportation in China: A panel data analysis of China’s provinces. Habitat Int. 2015, 49, 212–220. [Google Scholar] [CrossRef]
  27. Fiori, C.; Ahn, K.; Rakha, H.A. Power-based electric vehicle energy consumption model: Model development and validation. Appl. Energy 2016, 168, 257–268. [Google Scholar] [CrossRef]
  28. Kosai, S.; Nakanishi, M.; Yamasue, E. Vehicle Energy Efficiency Evaluation from Well-to Wheel Lifecycle Perspective. Transp. Res. Part D Transp. Environ. 2018, 65, 355–367. [Google Scholar] [CrossRef]
  29. Zhang, B.; Sarathy, S.M. Lifecycle optimized ethanol-gasoline blends for turbocharged engines. Appl. Energy 2016, 181, 38–53. [Google Scholar] [CrossRef]
  30. Hawkins, T.R.; Gausen, O.M.; Strømman, A.H. Environmental impacts of hybrid and electric vehicles—A review. Int. J. Life Cycle Assess. 2012, 17, 997–1014. [Google Scholar] [CrossRef]
  31. Casals, L.C.; Martinez-Laserna, E.; Garcia, B.A.; Nieto, N. Sustainability analysis of the electric vehicle use in Europe for CO2 emissions reduction. J. Clear. Prod. 2016, 127, 425–437. [Google Scholar] [CrossRef]
  32. Larsson, M.; Mohseni, F.; Wallmark, C.; Gronkvist, S.; Alvfors, P. Energy system analysis of the implications of hydrogen fuel cell vehicles in the Swedish road transport system. Int. J. Hydrog. Energy 2015, 40, 11722–11729. [Google Scholar] [CrossRef]
  33. Washing, E.M.; Pulugurtha, S.S. Well-to-Wheel Analysis of Electric and Hydrogen Light Rail. J. Public Transp. 2015, 18, 74–88. [Google Scholar] [CrossRef] [Green Version]
  34. Baptista, P.; Pina, A.; Duarte, G.; Rolim, C.; Pereira, G.; Silva, C.; Farias, T. From on-road trial evaluation of electric and conventional bicycles to comparison with other urban transport modes: Case study in the city of Lisbon, Portugal. Energy Convers. Manag. 2015, 92, 10–18. [Google Scholar] [CrossRef]
  35. Facanha, C.; Horvath, A. Evaluation of life-cycle air emission factors for freight transportation. Environ. Sci. Technol. 2007, 41, 7138–7144. [Google Scholar] [CrossRef]
  36. Schipper, L.; Saenger, C.; Sudarshan, A. Transport and Carbon Emission in the United States: The Long View. Energies 2011, 2011, 563–581. [Google Scholar] [CrossRef]
  37. Kamakaté, F.; Schipper, L. Trends in truck freight energy use and carbon emissions in selected OECD countries from 1973 to 2005. Energy Policy 2009, 37, 3743–3751. [Google Scholar] [CrossRef]
  38. Mendiluce, M.; Schipper, L. Trends in passenger transport and freight energy use in Spain. Energy Policy 2011, 39, 6466–6475. [Google Scholar] [CrossRef]
  39. de Witte, A.; Hollevoet, J.; Dobruszkes, F.; Hubert, M.; Macharis, C. Linking modal choice to motility: A comprehensive review. Transp. Res. Part A Policy Pract. 2013, 49, 329–341. [Google Scholar] [CrossRef]
  40. Limtanakool, N.; Dijst, M.; Schwanen, T. The influence of socioeconomic characteristics, land use and travel time considerations on mode choice for medium- and longer-distance trips. J. Transp. Geogr. 2006, 14, 327–341. [Google Scholar] [CrossRef]
  41. Waygood, E.O.D.; Sun, Y.L.; Susilo, Y.O. Transportation carbon dioxide emissions by built environment and family lifecycle: Case study of the Osaka metropolitan area. Transp. Res. Part D Transp. Environ. 2014, 31, 176–188. [Google Scholar] [CrossRef]
  42. Burnham, A.; Wang, M.; Wu, Y. Development and Applications of GREET 2.7—The Transportation Vehicle-cycle Model; ANL/ESD/06-5; Center for Transportation Research, Argonne National Laboratory: Argonne, IL, USA, 2006. [Google Scholar]
  43. Chester, M.V.; Horvath, A.; Madanat, S. Comparison of life-cycle energy and emissions footprints of passenger transportation in metropolitan regions. Atmos. Environ. 2010, 44, 1071–1079. [Google Scholar] [CrossRef]
  44. Sullivan, J.L.; Burnham, A.; Wang, M.Q. Model for the Part Manufacturing and Vehicle Assembly Component of the Vehicle Life Cycle Inventory. J. Ind. Ecol. 2013, 17, 143–153. [Google Scholar] [CrossRef]
  45. Chung, W.; Zhou, G.; Yeung, I.M.H. A study of energy efficiency of transport sector in China from 2003 to 2009. Appl. Energy 2013, 112, 1066–1077. [Google Scholar] [CrossRef]
  46. Lipscy, P.Y.; Schipper, L. Energy efficiency in the Japanese transport sector. Energy Policy 2013, 56, 248–258. [Google Scholar] [CrossRef]
  47. Japan Environmental Management Association for Industry. JEMAI-LCA Pro. Available online: http://www.jemai.or.jp/ (accessed on 12 May 2017).
  48. Japan Automobiles Research Institute. Overall Efficiency and GHG Emissions. Available online: http://www.jari.or.jp/Portals/0/jhfc/data/report/2010/pdf/result.pdf (accessed on 14 February 2018). (In Japanese).
  49. Kudo, Y.; Ishitani, H.; Matsuhashi, R. Kokyo yuso kikan no raifu saikuru CO2 haishutsu tokusei no kensho. KeiO Associated Repository of Academia Resources. AA12113622-00000116-0001. 2007. Available online: https://core.ac.uk/download/pdf/56669183.pdf (accessed on 21 February 2020). (In Japanese).
  50. Oki, Y. Survey on Energy Saving in the Steel Products. Available online: http://eneken.ieej.or.jp/data/pdf/468.pdf (accessed on 9 August 2017). (In Japanese).
  51. Ministry of Land, Infrastructure and Transport. Transport and City Planning Report. Available online: http://www.mlit.go.jp/toshi/tosiko/toshi_tosiko_fr_000024.html (accessed on 18 February 2018). (In Japanese)
  52. Statistics Japan. Population Statistics; Ministry of Internal Affairs and Communications: Tokyo, Japan. (In Japanese)
  53. Liedl, G.; Bielak, R.; Ivanova, J.; Enzinger, N.; Figner, G.; Bruckner, J.; Pasic, H.; Pudar, M.; Hampel, S. Joining of Aluminum and Steel in Car Body Manufacturing. Phys. Procedia 2011, 12, 150–156. [Google Scholar] [CrossRef] [Green Version]
  54. Japan Auminum Can Recycling Association. Recyling. Available online: http://www.alumi-can.or.jp/publics/index/24/ (accessed on 8 September 2018).
  55. COSMO RECYCLE CO., Ltd. Iron Scap Recycling. Available online: http://www.cosmorecycle.com/english/ (accessed on 6 September 2018).
  56. Ministry of Environmnet. Annual Report on the Environment, the Sound Material-Cycle Society and the Biodiversity in Japan. Available online: http://www.env.go.jp/en/wpaper/2017/pdf/2017_all.pdf (accessed on 10 December 2017).
  57. Bai, J.; Li, Y.; Zuo, W. Cross-sectional shape optimisation for thin-walled beam crashworthiness with stamping constraints using genetic algorithm. Int. J. Veh. Des. 2017, 73, 76–95. [Google Scholar] [CrossRef]
  58. Nuss, P.; Eckelman, M.J. Life Cycle Assessment of Metals: A Scientific Synthesis. PLoS ONE 2014, 9, e101298. [Google Scholar] [CrossRef]
  59. Graedel, T.E.; Harper, E.M.; Nassar, N.T.; Nuss, P.; Reck, B.K. Criticality of metals and metalloids. PNAS 2015, 112, 4257–4262. [Google Scholar] [CrossRef] [Green Version]
  60. Kosai, S.; Hashimoto, S.; Matsubae, K.; McLellan, B.; Yamasue, E. Comprehensive Analysis of External Dependency in terms of Material Criticality by Employing Total Material Requirement: Sulfuric Acid Production in Japan as a case study. Minerals 2018, 8, 114. [Google Scholar] [CrossRef] [Green Version]
  61. Kosai, S.; Unesaki, H. Quantitative Analysis on the Impact of Nuclear Energy Supply Disruption on Electricity Supply Security. Appl. Energy 2017, 208, 1198–1207. [Google Scholar] [CrossRef]
  62. The Institute of Energy Economics, Japan. Asia/World Energy Outlook. Available online: https://eneken.ieej.or.jp/data/6332.pdf (accessed on 26 November 2017).
  63. Ministry of Land, Infrastructure and Transport. Grandline 2050: Appendix. Available online: http://www.mlit.go.jp/common/001050896.pdf (accessed on 17 February 2018). (In Japanese)
  64. Ministry of Land, Infrastructure and Transport. Analysis of Current Transport Trend in Japan. Available online: http://www.mlit.go.jp/road/ir/kihon/26/1-1_s1.pdf (accessed on 11 January 2018). (In Japanese)
  65. Ministry of Internal Affairs and Communications. WHITE PAPER Information and Communications in Japan; Ministry of Internal Affairs and Communications: Tokyo, Japan, 2016.
  66. Chan, N.D.; Shaheen, S. Ridesharing in North America: Past, present, and future. Transp. Rev. 2012, 32, 93–112. [Google Scholar] [CrossRef]
  67. Cervero, R.; Tsai, Y.S. City CarShare in San Francisco, California—Second-year travel demand and car ownership impacts. Transp. Res. Rec. 2004, 1887, 117–127. [Google Scholar] [CrossRef]
  68. National Police Agency. White Paper on Police. Available online: https://www.npa.go.jp/hakusyo/h29/english/full_text_WHITE_PAPER_2017_E.pdf (accessed on 17 October 2019).
  69. Nationl Institute Population and Social Security Research. Population Projections for Japan. Available online: http://www.ipss.go.jp/pp-zenkoku/j/zenkoku2017/pp29_gaiyou.pdf (accessed on 5 March 2018).
  70. Ministry of Land, Infrastructure, Transport and Tourism. Human Mobility in City. Available online: https://www.mlit.go.jp/common/001032141.pdf (accessed on 9 July 2019). (In Japanese)
  71. Ruzzenenti, F.; Basosi, R. Evaluation of the energy efficiency evolution in the European road freight transport sector. Energy Policy 2009, 37, 4079–4085. [Google Scholar] [CrossRef]
Figure 1. Transport energy intensity for each means of transportation in 2015 in the case of lifetime use duration.
Energies 13 02094 g001
Figure 2. Transport energy intensity in 2015 with the change of use duration.
Energies 13 02094 g002
Figure 3. Intracity transport energy intensity and population density.
Energies 13 02094 g003
Figure 4. Intracity transport energy intensity and population density.
Energies 13 02094 g004
Table 1. Transportation modes, means and fuel types.
Transportation ModeTransportation MeansFuel Type
RoadWalk-
Bicycle-
Automobile
Conventional vehicle (CV)Gasoline
Electric vehicle (EV)Electricity
Hybrid vehicle (HV)Gasoline
Fuel cell vehicle (FCV)Hydrogen
BusLight diesel
Urban railElectric trainElectricity
Table 2. Summary of subscripts and abbreviations.
Subscript/AbbreviationDefinitionUnit
TEI Transport energy intensity of each transportation meansJ/kg/m
CTEI Intracity transport energy intensityJ/kg/m
Q m a t e r i a l Energy consumption during the manufacture phaseMJ
Q o p e r a t i o n WTW Energy consumption during the operational phase per yearMJ/year
Q o p e r a t i o n WTT WTT energy consumption during the operational phase per yearMJ/year
Q o p e r a t i o n TTW TTW energy consumption during the operational phase pear yearMJ/year
k Fuel economykm/L, km/kWh
t Operation durationyears
m Weight of both transportation mean and passengerkg
M Weight of transportation meankg
P Maximum capacityPerson
r a v e . Average vehicle occupancy%
L Average traveled distance per yearkm/year
c Composition rate%
e Energy consumption rateMJ/kg
d Calorific valueMJ/L, MJ/kWh
p Fuel production rateMJ/MJ
s Modal split in a given city%
i Composition of transportation means-
f Fuel type-
x Transportation means-
y Assessed year
Table 3. Regression model of CTEI vs. population density.
YearR2Regression Coefficient
19870.520−4.93 × 10⁵
19920.583−6.49 × 10⁵
19990.540−7.71 × 10⁵
20050.666−1.02 × 10⁴
20100.668−1.12 × 10⁴
20150.617−1.01 × 10⁴

