Article

Ethanol Production from High Solid Loading of Rice Straw by Simultaneous Saccharification and Fermentation in a Non-Conventional Reactor

by
Inês C. Roberto
1,
Rafael C. A. Castro
1,
João Paulo A. Silva
2 and
Solange I. Mussatto
3,*
1
Departamento de Biotecnologia, Escola de Engenharia de Lorena, Universidade de São Paulo, Lorena/SP 12602-810, Brazil
2
Departamento de Engenharia Química, Escola de Engenharia de Lorena, Universidade de São Paulo, Lorena/SP 12602-810, Brazil
3
Novo Nordisk Foundation Center for Biosustainability, Technical University of Denmark, Kemitorvet, Building 220, 2800 Kongens Lyngby, Denmark
*
Author to whom correspondence should be addressed.
Energies 2020, 13(8), 2090; https://doi.org/10.3390/en13082090
Submission received: 16 March 2020 / Revised: 12 April 2020 / Accepted: 16 April 2020 / Published: 22 April 2020
(This article belongs to the Section A4: Bio-Energy)

Abstract

:
Simultaneous saccharification and fermentation (SSF) at high solid loading is a potential approach to improve the economic feasibility of cellulosic ethanol. In this study, SSF using high loading of rice straw was assessed using a vertical ball mill reactor. First, the conditions of temperature and number of glass spheres were optimized at 8% (w/v) initial solids (41.5 °C, 18 spheres). Then, assays were carried out at higher solid loadings (16% and 24% w/v). At 8% or 16% solids, the fermentation efficiency was similar (ηF~75%), but the ethanol volumetric productivity (QP) reduced from 1.50 to 1.14 g/L.h. By increasing the solids to 24%, the process was strongly affected (ηF = 40% and QP = 0.7 g/L.h). To overcome this drawback, three different feeding profiles of 24% pre-treated rice straw were investigated. Gradual feeding of the substrate (initial load of 16% with additions of 4% at 10 and 24 h) and an inoculum level of 3 g/L resulted in a high ethanol titer (52.3 g/L) with QP of 1.1 g/L.h and ηF of 67%. These findings demonstrated that using a suitable fed-batch feeding strategy helps to overcome the limitations of SSF in batch mode caused by the use of high solid content.

1. Introduction

The first-generation ethanol production based on well-established processes from sugarcane and corn as feedstock will not be able to satisfy the world’s growing energy needs. Lignocellulosic biomass is then viewed as a key feedstock to provide enough renewable energy for the future [1]. Among the different types of lignocellulosic biomass, agricultural residues including rice straw, corn stover, wheat straw and sugarcane bagasse have been pointed out as the major feedstock for ethanol production due to their large availability and high content of polysaccharides (cellulose and hemicellulose) that can be hydrolyzed into fermentable sugars [2]. The worldwide production of rice straw, for example, is estimated in approx. 770 million tons per year, considering that 512 million tons of rice were produced in the period 2019/2020 [3] and 1.5 tons of straw are generated per ton of rice. In addition to the large availability and significant content of polysaccharides, non-sugar fractions and wastes generated during the biomass processing could also be converted into valuable products, adding value within a biorefinery [4]. However, since the technologies required to obtain fermentable sugars from lignocellulosic feedstock are more complex, the costs of the second-generation ethanol production are still higher when compared to the first-generation ethanol production [5].
The process for second-generation ethanol production includes the following steps: (i) pre-treatment of biomass, (ii) enzymatic hydrolysis, (iii) fermentation and (iv) distillation. However, for an efficient depolymerization of lignocellulose into fermentable sugars, pre-treatment and enzymatic hydrolysis steps cannot be evaluated separately since the optimum performance of the enzyme cocktail will depend on the pre-treatment technology applied [6,7].
In the last decades, many efforts have been made to make the second-generation ethanol production more economically competitive, including advances in pre-treatment technologies [8], developments in enzyme technology for cellulose conversion [9] and construction of efficient fermenting yeasts [10]. Nevertheless, there are also several technical obstacles to overcome in order to have a more cost-effective ethanol production process, which include the development of reactors able to operate with high solids content, especially during enzymatic hydrolysis [11]. High solid content negatively affects the mass transfer in enzymatic hydrolysis of cellulosic materials due to the poor mixing of the material and low mass transfer rate. However, the extent of this limitation depends also on other variables including the physical and chemical properties of the substrate and mechanical factors such as the type of reactor and mixing speed [12].
High solid content is one of the pre-requisites to attain a high glucose concentration that in turn is fundamental to obtain high ethanol titers (above 4% v/v, ~50 g/L). In this way, capital investment costs can be improved and the energy demand for the distillation step can be reduced, resulting in significant economic benefits [13,14]. According to Jørgensen et al. [15], to attain high ethanol titers from lignocellulosic materials it is necessary to process a minimum solid loading of 15% (w/v) dry matter containing about 60% (w/w) of cellulose. However, to make this a reality, many efforts must still be directed towards not only the development of efficient pre-treatments, enzymatic cocktail with high catalytic activity and microorganisms with a high fermentative capacity, since the problems of mass transfer and mixing during the processing of high biomass solid loading require being solved properly. Solving mixing problems at high solid loading in conventional bioreactors is a difficult task. Therefore, to overcome these limitations, new bioreactor configurations have been designed and tested to make the use of high substrate loading during the bioconversion process feasible [16]. Alterations in the agitation system of the bioreactor have shown an impact on the performance of simultaneous saccharification and fermentation (SSF) processes. For example, an improvement of 14% in the production of ethanol from corn stover at high solid loading was obtained when the bioreactor was equipped with a double helical impeller instead of the common Rushton impeller [17]. In another study, also employing corn stover at high solids, an increase of about 21% in ethanol production was reported when the reactor was equipped with a single helical ribbon impeller [18].
In addition to the efficient agitation system, the employment of a fed-batch operational mode, where biomass, enzyme and/or microorganism are added at different times throughout the process, can substantially improve the liquefaction of the fibrous suspension, decreasing the viscosity of the material and consequently reducing mass transfer limitation problems [12].
According to the literature, SSF processes, which combine enzymatic hydrolysis and fermentation steps in a single reaction vessel, can result in a lower capital cost and lower contamination risk when compared to the separate hydrolysis and fermentation (SHF) process [19]. SSF also contributes to reduce the inhibition of cellulolytic enzymes by substrate, since glucose is immediately consumed by the microorganism [20,21]. However, this operation system requires the use of thermotolerant microorganisms able to efficiently ferment glucose into ethanol in the range of temperature (40 °C to 50 °C) considered as optimal for cellulolytic enzymes [2,22].
Our previous study [23] revealed the potential of a non-conventional reactor, namely a vertical ball mill (VBM) reactor, for use in the enzymatic hydrolysis of alkali-acid-pre-treated rice straw at 8% (w/v) solid load, as well as in glucose fermentation by a thermotolerant yeast strain (Kluyveromyces marxianus NRRL Y-6860). The glass beads added to the VBM reactor had an important effect on both processes, enzymatic hydrolysis and fermentation, but with a positive effect on the conversion of cellulose and a negative effect on ethanol volumetric productivity. Thus, if the necessary adjustments were made on the levels of the variables for each process (hydrolysis and fermentation), it is expected to obtain an improved performance of the VBM reactor for use in the conversion of biomass to ethanol, with also a possibility for application in SSF processes. Taking this into account, the aim of the present study was to design a SSF process at high solid loading in the VBM reactor. This is the first time a VBM reactor is used for SSF of biomass. Initially, efforts were done to optimize the operational variables for SSF in batch mode at solids loading of 8% (w/v). Under the optimized conditions, the effect of high solid loading on the fermentability of pre-treated rice straw was assessed. Finally, a substrate-feeding strategy (fed-batch mode) was developed to overcome the major limitation observed when using high solid loading (24% w/v). At the end, by establishing the most appropriate conditions for the SSF process at high solid loading in the VBM reactor, this study resulted in one of the highest volumetric productivities already reported in the literature for second generation ethanol production, with titers above 50 g/L.

2. Materials and Methods

2.1. Raw Material Preparation

Rice straw was obtained from a local farm (Canas, São Paulo, Brazil) and naturally dried to a moisture content of about 10% (w/w). The biomass was milled (1 cm length per 1 mm thickness) in a hammer-mill and stored at room temperature. The pre-treatment of rice straw consisted of an alkaline step (deacetylation) using 80 mg NaOH/g of biomass, at 70 °C and 45 min, followed by a dilute acid step using 100 mg H2SO4/g deacetylated rice straw, at 121 °C for 85 min, as described by Castro et al. [24]. Both treatments were performed in a 50-L batch reactor with a liquid-to-solid ratio of 10:1 (mL/g). After pre-treatment, the remaining solid material (cellulignin) was washed with water to eliminate inhibitory compounds present in the slurry, and dried to a 10% (w/w) moisture content to be stored safely until use in the SSF experiments. The composition of the resulting solid after each pre-treatment step was determined according to standard protocol [25] and is summarized in Table 1. Assays were performed in triplicate.

2.2. Simultaneous Saccharification and Fermentation (SSF)

SSF experiments were carried out in a 1.5-L vertical ball mill (VBM) reactor made of 316 stainless steel and equipped with a three flat-disk impeller as previously reported by Castro et al. [23]. All assays were carried out under agitation of 200 rpm.

2.2.1. Enzymes and Microorganism

Cellulase (Cellubrix, Novozymes Corp.) and β-glucosidase (Novozyme 188, Novozymes Corp.) enzymes were used in all the SSF experiments. The activity of Cellubrix as determined by Adney and Backer [26] was 30 FPU/mL and β-glucosidase (Novozyme 188) as determined by Wood and Bath [27] was 920 IU/mL. In this study, the thermotolerant yeast Kluyveromyces marxianus NRRL Y-6860 was used as described by Castro et al. [23].

2.2.2. Effect of Process Variables

An experimental design was performed to select the optimum conditions of temperature and number of glass spheres to use in the SSF in the VBM reactor. The range and levels of the variables investigated in this study are given in Table 2. The design included three replicates at the central point to estimate the experimental error. All assays were carried out under agitation of 200 rpm and initial solid loading of 8% (w/v). The glass spheres (23 mm diameter and 8.16 ± 0.35 g each) were used as grinding elements and placed above each disk. To achieve the desired temperature, an external thermostatic water bath was used to recirculate water through the reactor jacket.
Initially, 40 g dry mass of pre-treated rice straw were added to the reactor under agitation of 200 rpm. Then, the desired volume of each component (nutrients, buffer, enzymes and cells) was added to make a final volume of 0.5 L. The medium for SSF process was composed of 1.5 g/L KH2PO4, 1.0 g/L (NH4)2SO4, 0.1 g/L MgSO4·7H2O, 3.0 g/L yeast extract, sodium citrate buffer 50 mM—pH 4.8, 21.5 FPU Cellubrix + 26.5 IU Novozyme188 per gram of glucan, and 1.0 g/L of cells. During the process, samples were taken at different times for the estimations of glucose and ethanol concentrations.

2.2.3. Effect of Solid Loading in Batch SSF

After optimizing the operational conditions for SSF at 8% (w/v) solid loading in the VBM reactor (18 spheres; 41.5 °C), two higher solid loadings (16% and 24% w/v) were tested in batch mode. Initially, the desired mass of pre-treated rice straw (40, 80 or 120 g dry matter) was added to the VBM reactor, previously sterilized (121 °C, 20 min) and filled with 18 spheres of glass (6 units in each disk). The reactor was then fed with the nutrient solution and the temperature was adjusted to 41.5 °C under agitation of 200 rpm. After ten minutes of residence time, enzymes, buffer solution and cell-suspension were added to the reactor. All experiments were carried out with a final volume of 0.5 L to obtain the desired solid loading (8%, 16% or 24% w/v). The enzymes dosage, nutrients composition and cell concentrations were the same as described in Section 2.2.2. During the experiments, samples were withdrawn for glucose and ethanol estimations. Assays were performed in duplicate.

2.2.4. Fed-Batch Strategies

Three fed-batch strategies were evaluated for the SSF process at 24% solid loading (pre-treated rice straw). All experiments were carried out in the VBM reactor at 41.5 °C using 18 glass spheres (6 units in each disk) and agitation of 200 rpm; however, the solid feeding time, enzyme and cell load varied in each experiment (Table 3). The final concentration of nutrients was the same as used previously. Samples were taken at different times for the estimations of the glucose and ethanol concentrations.

2.3. Parameters Calculation

From the experimental data of glucose and ethanol concentrations, the parameters of the SSF process were calculated according to the equations shown in Table 4. The calculations were based on the total glucose available in the form of glucan present in pre-treated rice straw and on the theoretical ethanol yield.

2.4. Analysis

The concentrations of glucose and ethanol were determined by high-performance liquid chromatography (HPLC) using an Agilent 1260 Infinity HPLC system equipped with a Bio-Rad Aminex HPX-87H column (Bio-Rad, Hercules, CA, USA) coupled with a refractive index detector at 45 °C. Sulfuric acid (0.005 M) was used as a mobile phase at a flow rate of 0.6 mL/min. For analysis, the samples were diluted with deionized water and filtered through Sep Pak C18 filters (Millipore).

2.5. Statistical Analysis

Design expert (version 6.0 by Stat-Ease, Inc., Minneapolis, MN, USA), Statgraphics® (Centurion XV by Statpoint Technologies, Inc., The Plains, VA, USA) and Statistica (version 10.0 by Statsoft, Inc., Tulsa, OK, USA) software were used for statistical and graphical analyses of the experimental data. The most important effects of the independent variables on the target responses were determined by the Pareto chart. The statistical significance of the models was determined by analysis of variance (ANOVA) and their proportion of variance was given by the multiple coefficient of determination, R2. The optimum levels of the variables were obtained by graphical analysis based on the criterion of desirability.

3. Results and Discussion

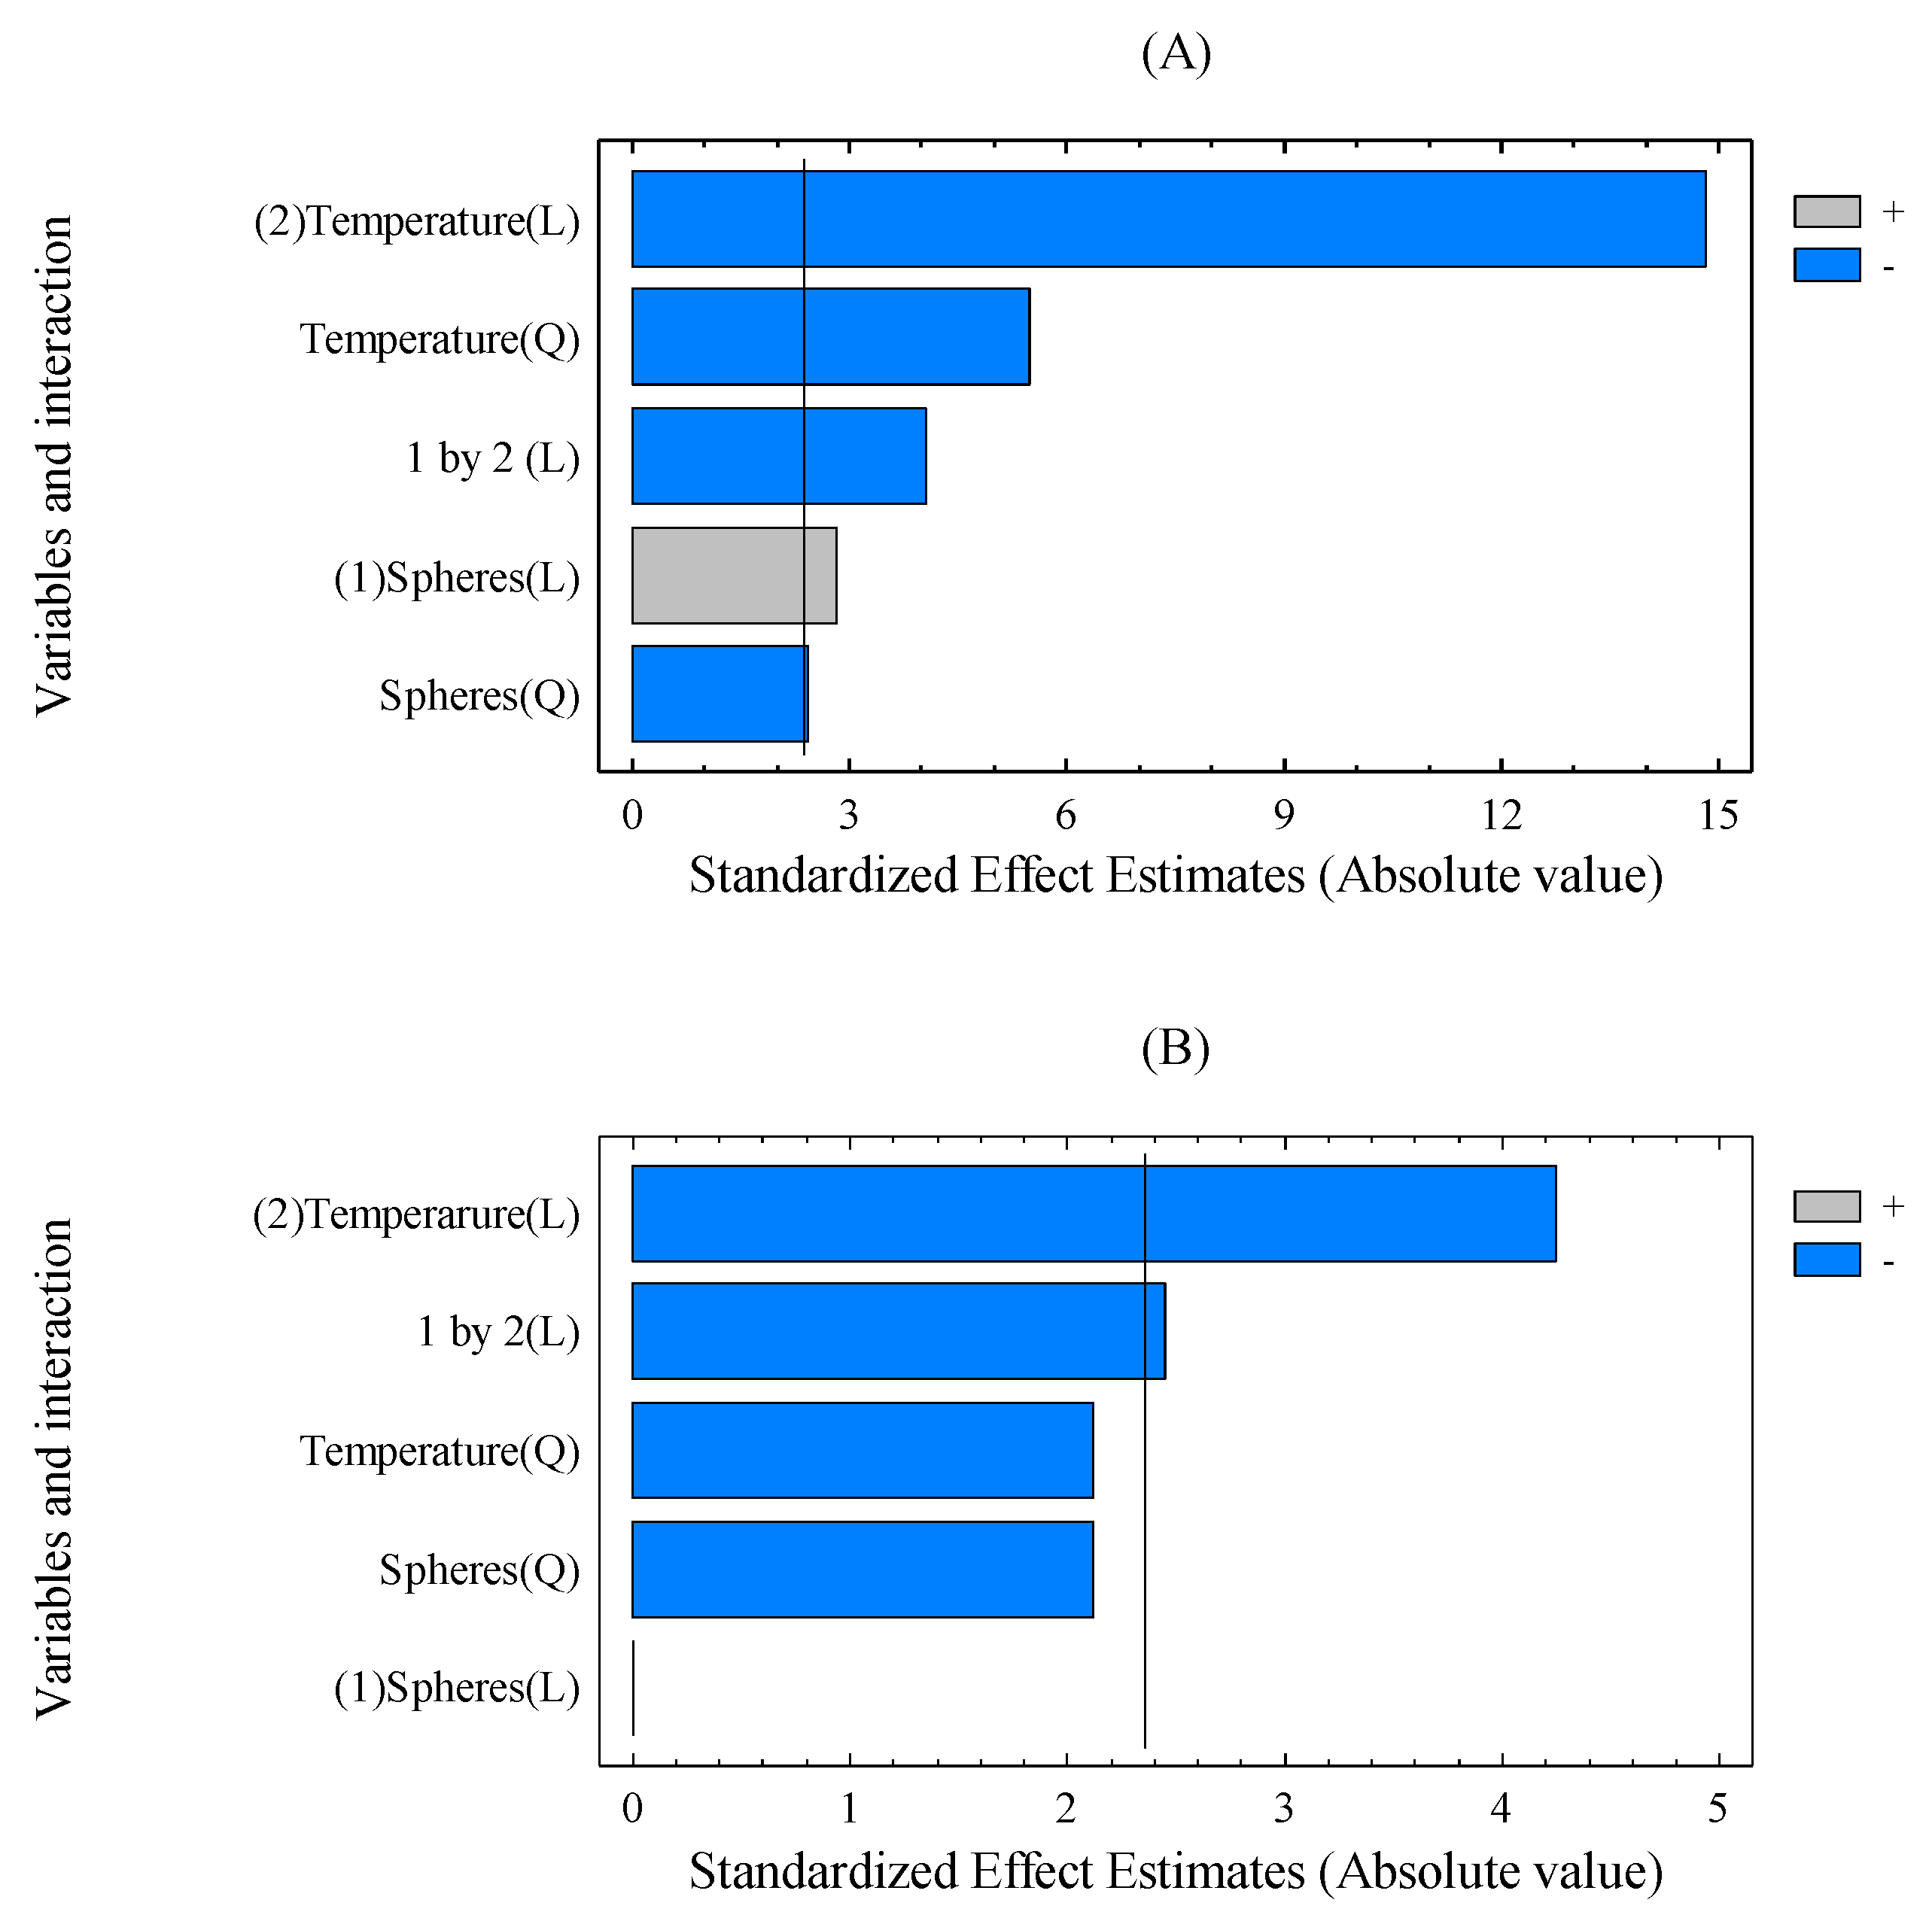
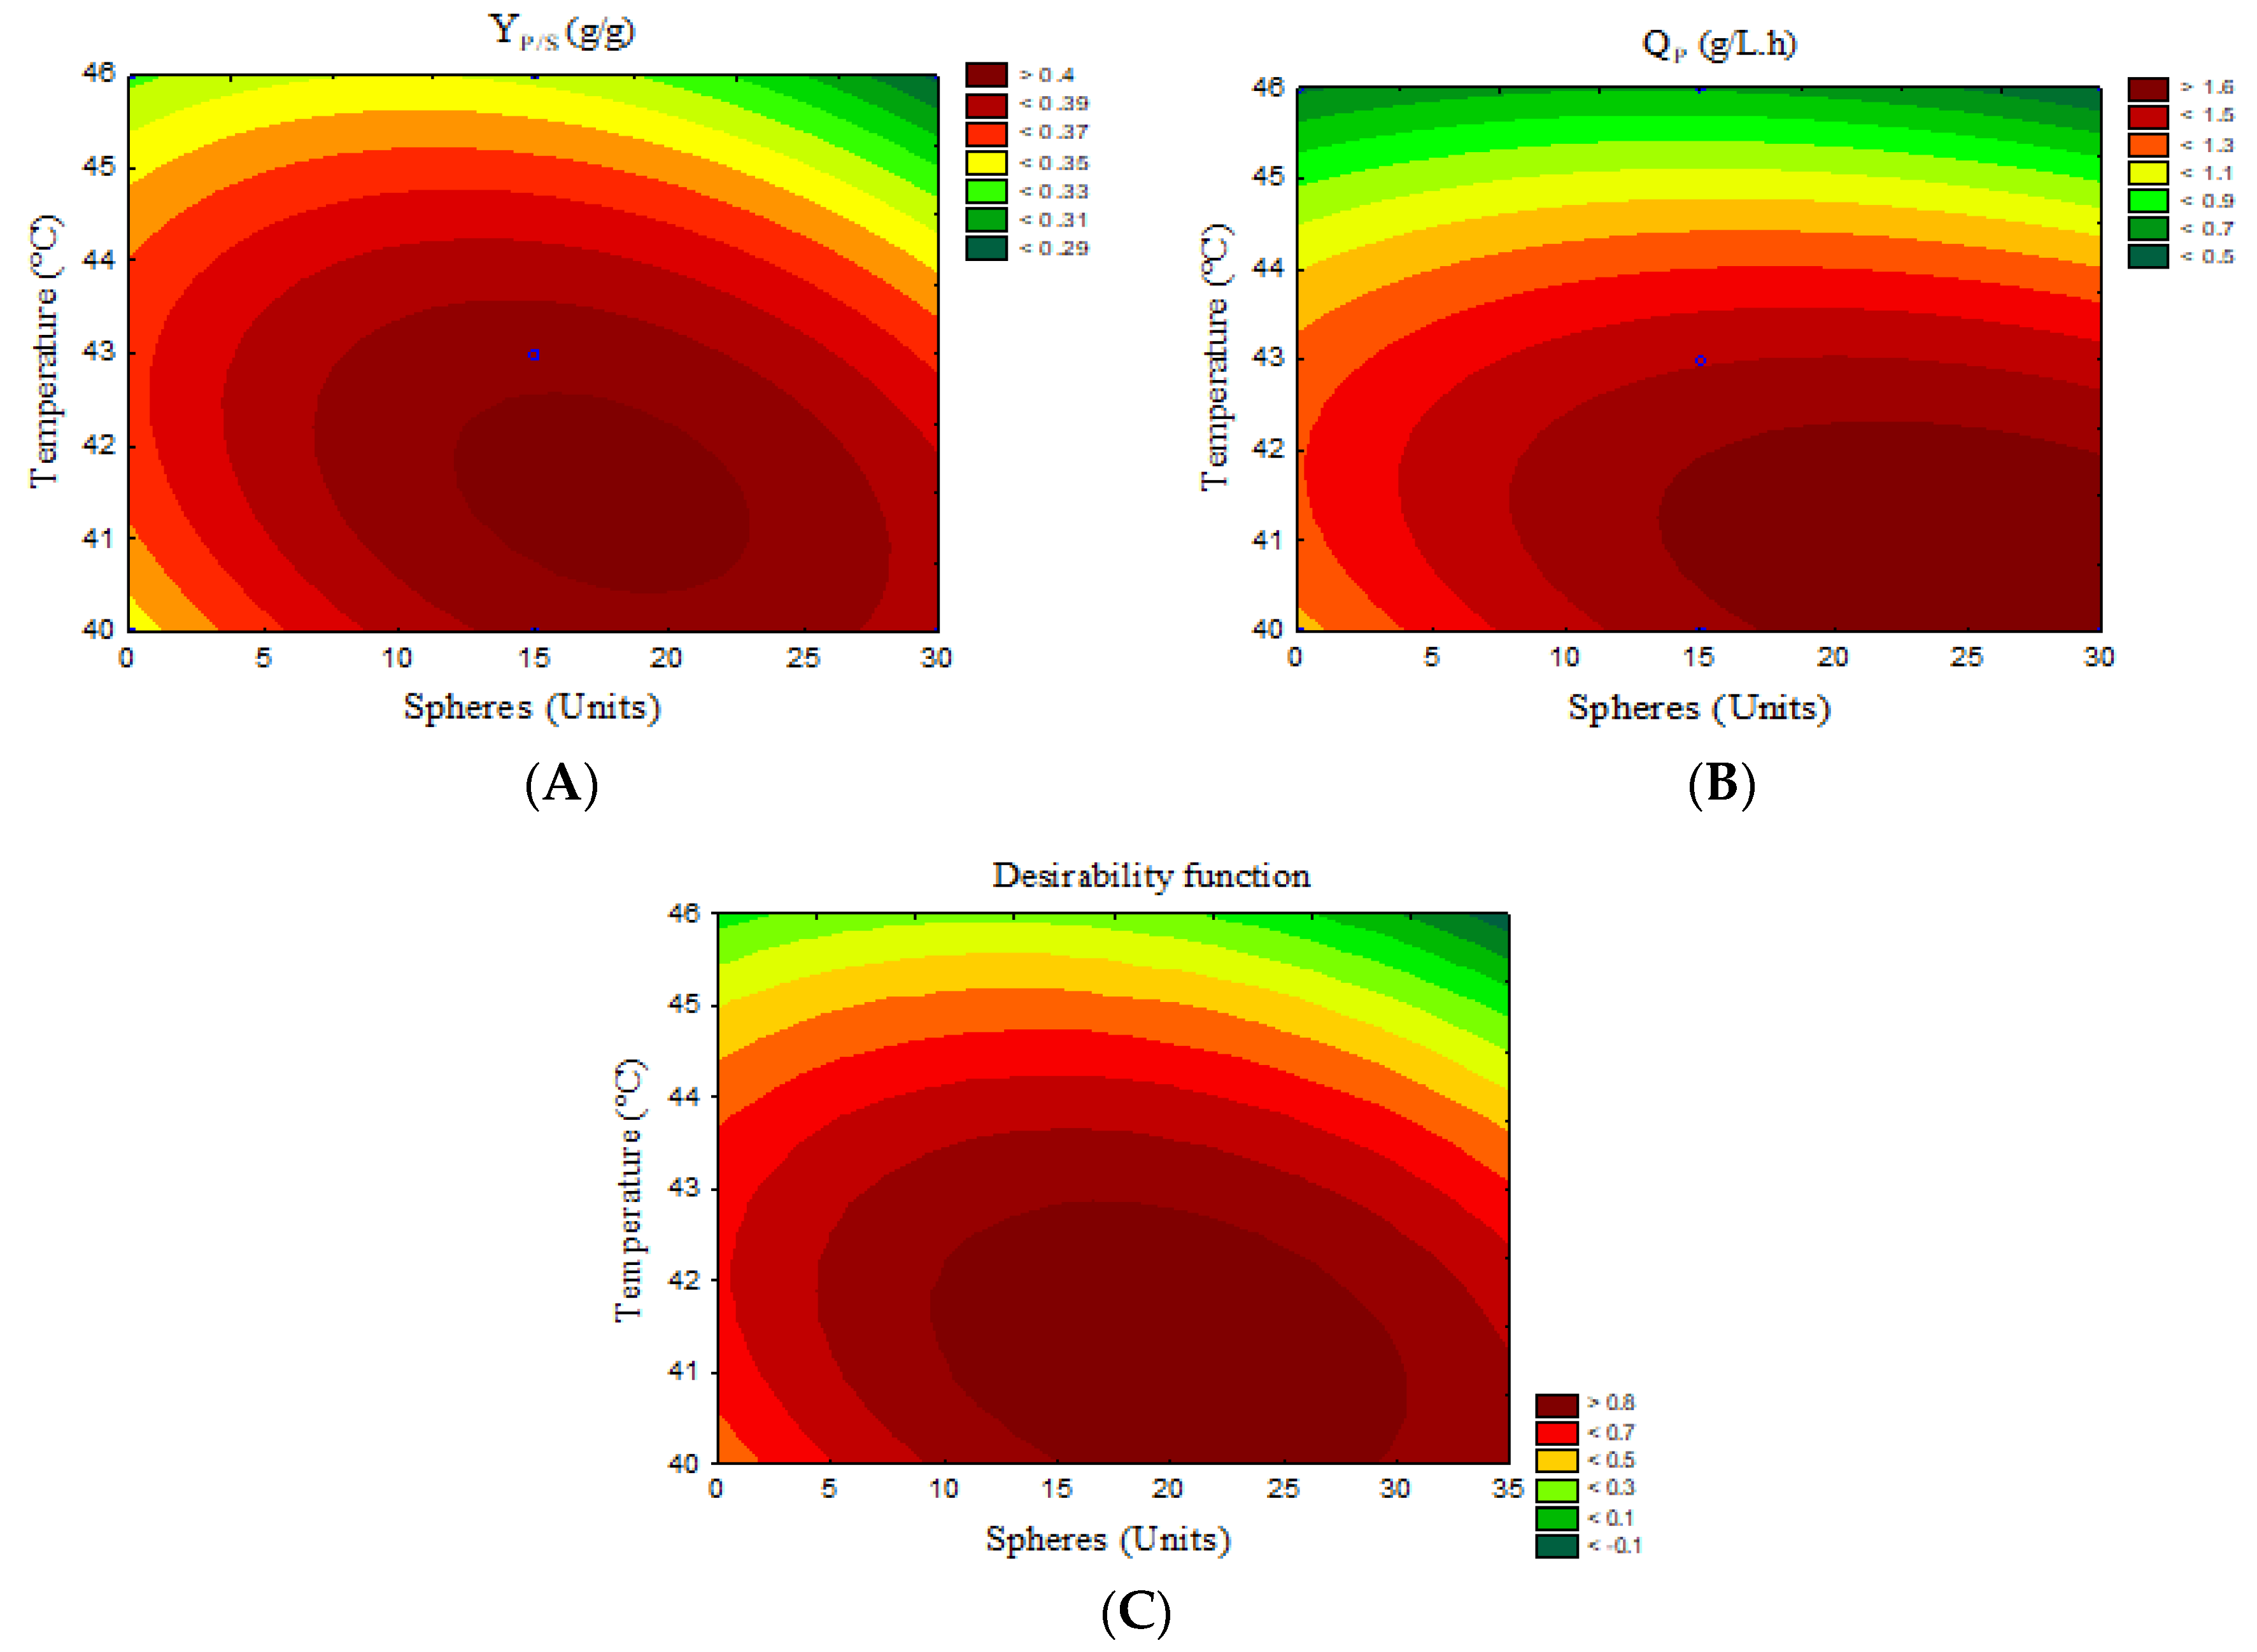
3.1. Effect of Operational Variables on SSF Process in the VBM Reactor

In our previous study, the use of glass spheres in the VBM reactor for enzymatic conversion of pre-treated rice straw was demonstrated to improve the cellulose digestibility, while the glucose fermentation by K. marxianus was affected by the mechanical impact [23]. The present study is the first time the VBM reactor was used for SSF of biomass. Initially, an experimental design was proposed to optimize the levels of temperature and number of spheres to be used in the SSF of pre-treated rice straw at 8% (w/v) in batch mode. As can be seen in Table 5, the responses varied widely according to the experimental conditions used (YP/S from 0.28 to 0.41 g/g and QP from 0.51 to 1.64 g/L.h).
The lowest values of ethanol production (<20 g/L), QP (<0.7 g/L.h) and YP/S (<0.35 g/g) were obtained in the experiments performed at the highest temperature (46 °C, assays 3, 4 and 9). It is also interesting to note that the highest ethanol yield (~0.40 g/g) and volumetric productivity (~1.6 g/L.h) were obtained at the lowest temperature (40 °C) regardless of the number of spheres used (15 or 30 units, assays 2 and 8). Such results indicate that both variables may negatively affect the fermentation process. However, their contribution, individually and in combination, can be better evaluated by statistical analysis, as follows.
The Pareto charts in Figure 1A,B with the standardized effects of the variables and a confidence level of 90%, reveal that the linear effect of temperature was highly significant for both responses, QP and YP/S, followed by the quadratic effect of temperature and then by the number of spheres. The negative signal of both variables corroborates with the previous direct analysis of the data. The Pareto charts also show significant interaction effects between the variables, with a negative signal indicating that the simultaneous decrease in the levels of temperature and number of spheres do not improve the responses, as it would be expected considering their individual effects. On the other hand, the negative signal of the quadratic terms indicates the existence of a maximum point for QP and YP/S in the range of the experimental values evaluated.
To estimate the responses as a function of the variables, an ANOVA was performed and the statistical significance of the quadratic models was evaluated by the F-test (Table 6). The F-values, 66.41 and 9.72 for QP and YP/S respectively, imply that the models are significant. In addition, no lack-of-fit was observed and the coefficient of determination presented a high value for both responses (R2 = 0.94 for YP/S and 0.99 for QP), demonstrating that the greatest proportion of variance is accounted by the models. Therefore, the variations of YP/S and QP, in the experimental region studied, can be expressed according to Equations (1) and (2), where YP/S is the ethanol yield (g/g); QP is the ethanol volumetric productivity (g/L.h), and X1 and X2 are the coded values for the number of spheres and temperature, respectively:
YP/S = 0.39 − 0.028 X2 − 0.030 X12 − 0.032 X22 − 0.020 X1X2
QP = 1.49 + 0.10 X1 − 0.44 X2 − 0.15 X12 − 0.36 X22 − 0.15 X1X2
The contour plots described by the quadratic models for YP/S and QP (Figure 2A,B, respectively) show that the interaction between the variables presented an elliptical shape indicating an optimum region for each response. The maximum value predicted for QP (1.68 ± 0.16 g/L.h) can be achieved using number of spheres equal to 25 (X1 = 0.69) and a temperature of 40.8 °C (X2 = −0.74), whereas the maximum value of YP/S (0.40 ± 0.03 g/g) can be obtained using 18 spheres (X1 = 0.17) and a temperature of 41.5 °C (X2 = −0.50).
Comparing the contour plots for the ethanol yield (Figure 2A) and volumetric productivity (Figure 2B), it is possible to visualize a common region where both responses can be maximized. To select an optimum operational condition able to provide the highest values for both fermentation parameters, the desirability criterion tool was used. The contour plot for the desirability function (Figure 2C) shows that the region where both responses can be maximized consists in using a number of spheres between 15 and 26 and temperature ranged between 40 °C and 42 °C. The program indicated an optimal condition within this region (X1 = 0.17 and X2 = −0.50), which corresponded to 18 spheres and 41.5 °C. Under these conditions, the desirability model predicts an ethanol yield of 0.40 g/g and volumetric productivity of 1.64 g/L.h. Assays to validate these conditions were performed and revealed a close agreement between the values predicted by the model and those obtained experimentally (21 ± 0.8 g/L of ethanol after 14 h—YP/S of 0.38 g/g and QP of 1.50 g/L.h).
These results of ethanol production by SSF under the optimized conditions in the VBM reactor represented an important improvement when compared to the ethanol titers and yields previously observed by Castro and Roberto [28], using a solids content of 8% w/v from dilute-acid-pre-treated rice straw employing the same yeast strain (K. marxianus NRRL Y-6860). The authors obtained a maximum ethanol titer of 11.55 g/L (YP/S = 0.24 g/g and QP of 1.44 g/L.h) using Erlenmeyer flasks. The gains obtained in the present study can be attributed to two factors: (1) the use of the VBM reactor under the optimized conditions and (2) the strategy used for rice straw pre-treatment in the present study (deacetylation followed by dilute acid).

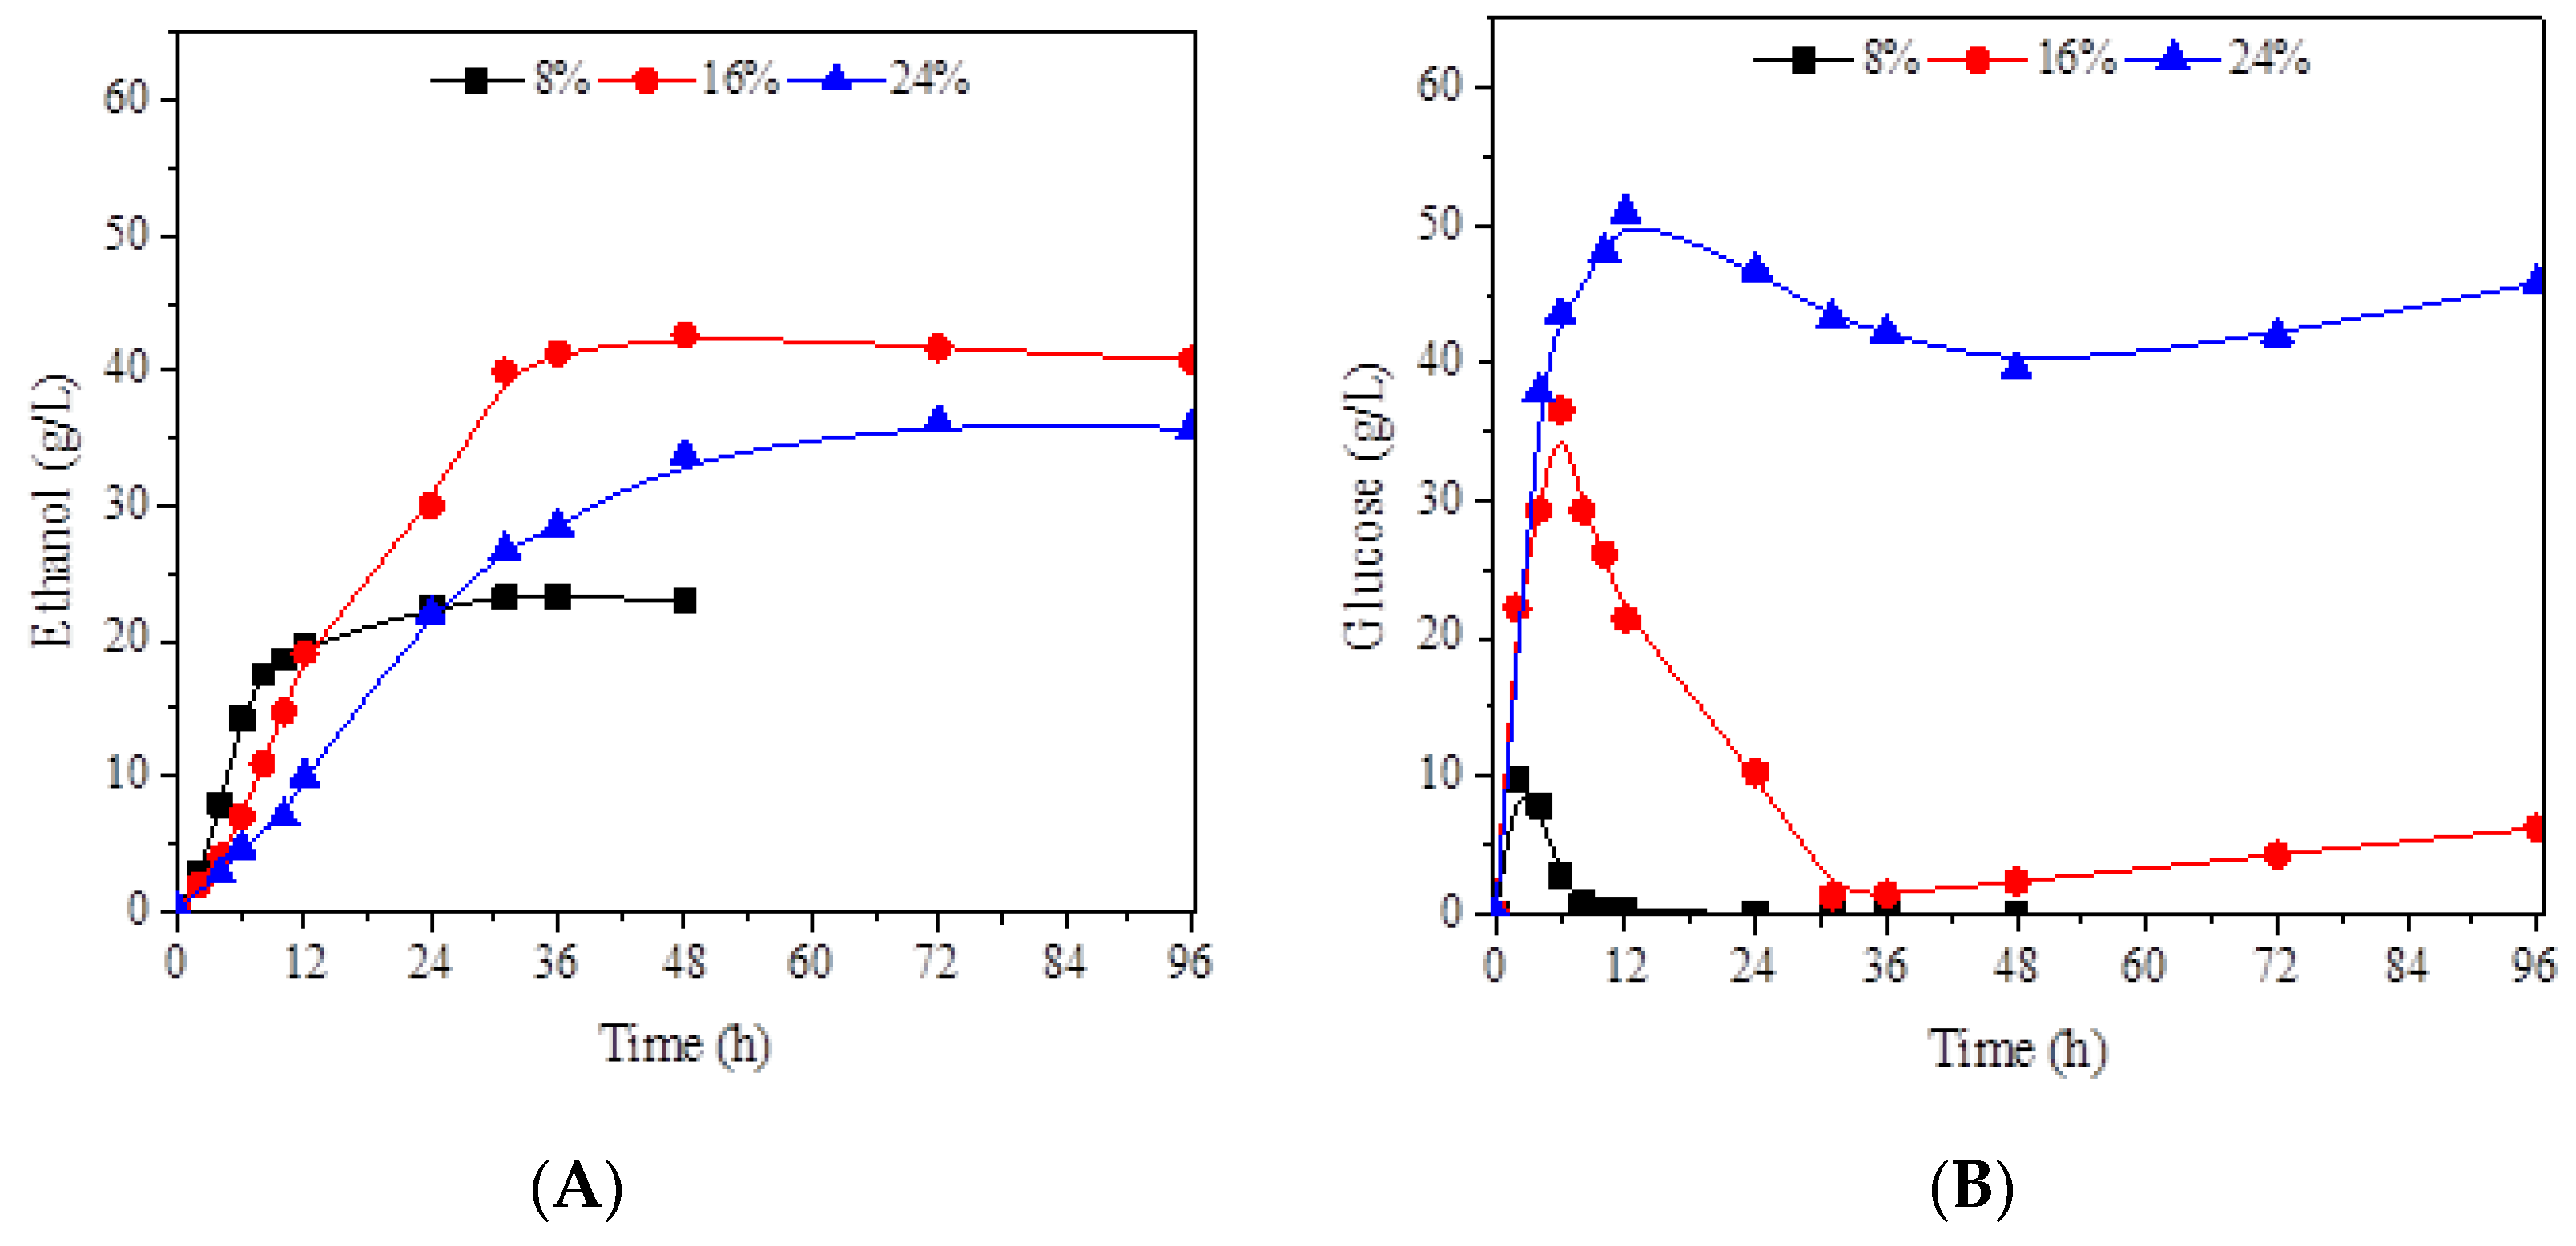
3.2. Effect of Solid Loading in Batch SSF

After optimizing the operational conditions for batch SSF in the VBM reactor (18 spheres, 41.5 °C) at 8% (w/v) of biomass, assays were carried out at increased solid loading in order to obtain higher ethanol titers at the end of the process. Figure 3 shows the ethanol and glucose concentrations throughout the SSF experiments performed with 8%, 16% and 24% (w/v) solid loadings.
As can be seen in Figure 3A, the ethanol concentration was almost doubled (from 21.0 to 41.3 g/L) when the solid content was increased from 8% to 16%, indicating that the ethanol production was proportional to the content of solids used for the process. However, increasing the solid loading to 24% (w/v) resulted in a marked reduction of the ethanol production, achieving 33.7 g/L after 48 h. This decrease could be explained by an incomplete glucose uptake by the cells (Figure 3B). In fact, the glucose profile during the batch SSF at 24% solid loading reveals a considerable accumulation of this sugar after 48 h (around 40 g/L), which was maintained until 96 h, suggesting a loss of cellular viability. In addition, taking into account the experimental data of ethanol production and residual glucose after 48 h at 24% (w/v) solid loading, the glucose released during enzymatic hydrolysis was estimated at 106 g/L, which is a value lower than the theoretical value (165 g/L) calculated from the glucan available in the pre-treated rice straw. Thus, it is possible to infer that both processes, glucan digestibility and glucose fermentation, were limited by the high solid loading.
In order to assess the relative contribution of each process (saccharification and fermentation) on the overall limitation of SSF in batch mode, the efficiency of hydrolysis (ηH) and the efficiency of fermentation (ηF) were compared at different solid loadings. The results revealed that ηH and ηF values were similar (approx. 75%) at 8% and 16% solid loading, while the QP value decreased by 24% (from 1.50 to 1.14 g/L.h) (Table 7). However, when the solid loading was increased from 16% to 24% (w/v), the ηH was reduced by 15% (from 75% to 64%), while ηF and QP decreased by 46% and 31%, respectively. These findings clearly show that at 24% (w/v) solid consistency the microbial system was more impacted than the enzymatic system, suggesting that the metabolic activity of the yeast cannot be sustained under this condition. In fact, considering that the pre-treated material (cellulignin) used for SSF was washed with water to eliminate the inhibitory compounds present in the slurry, and its cellulose composition was significantly increased after pre-treatment, compared to the other fractions (Table 1), it was expected to have suitable conditions for a good performance of the cellulolytic enzymes during hydrolysis. Regarding the fermentation performance, it is important to highlight that HPLC analysis revealed that degradation compounds from sugars (hydroxymethylfurfural and furfural) and lignin (phenolic compounds), as well as acetic acid, which are toxic to microorganisms [29], were not found in the composition of the hydrolysates. This fact allows concluding that an insufficient mass transfer was probably the main problem affecting the yeast performance when high solid loadings were used.
Based on the above data, the ideal solid loading in batch SSF in the VBM reactor was found to be about 16% (w/v), which is very close to the value of 15% (w/w) reported by Varga et al. [30] in batch SSF experiments performed in 0.5 L flasks using pre-treated corn stover as a substrate. According to those authors, increasing the solids content to 20% (w/w) led to a significant reduction in the ethanol yield (from 78% to around 5%) due to insufficient mass transfer. In fact, mass transfer problems play a critical role on overall SSF effectiveness at high solid loading [31,32]. However, the extent of process limitation is dependent on the various factors including the characteristics of biomass, the reactor configuration as well as operational conditions used. In this context, the evaluation of the different configurations of mechanically stirred reactors concomitant to the use of the fed-batch mode has been pointed out as an attractive strategy to overcome the rheological problems observed in SSF process at high biomass loadings [12,33,34,35].

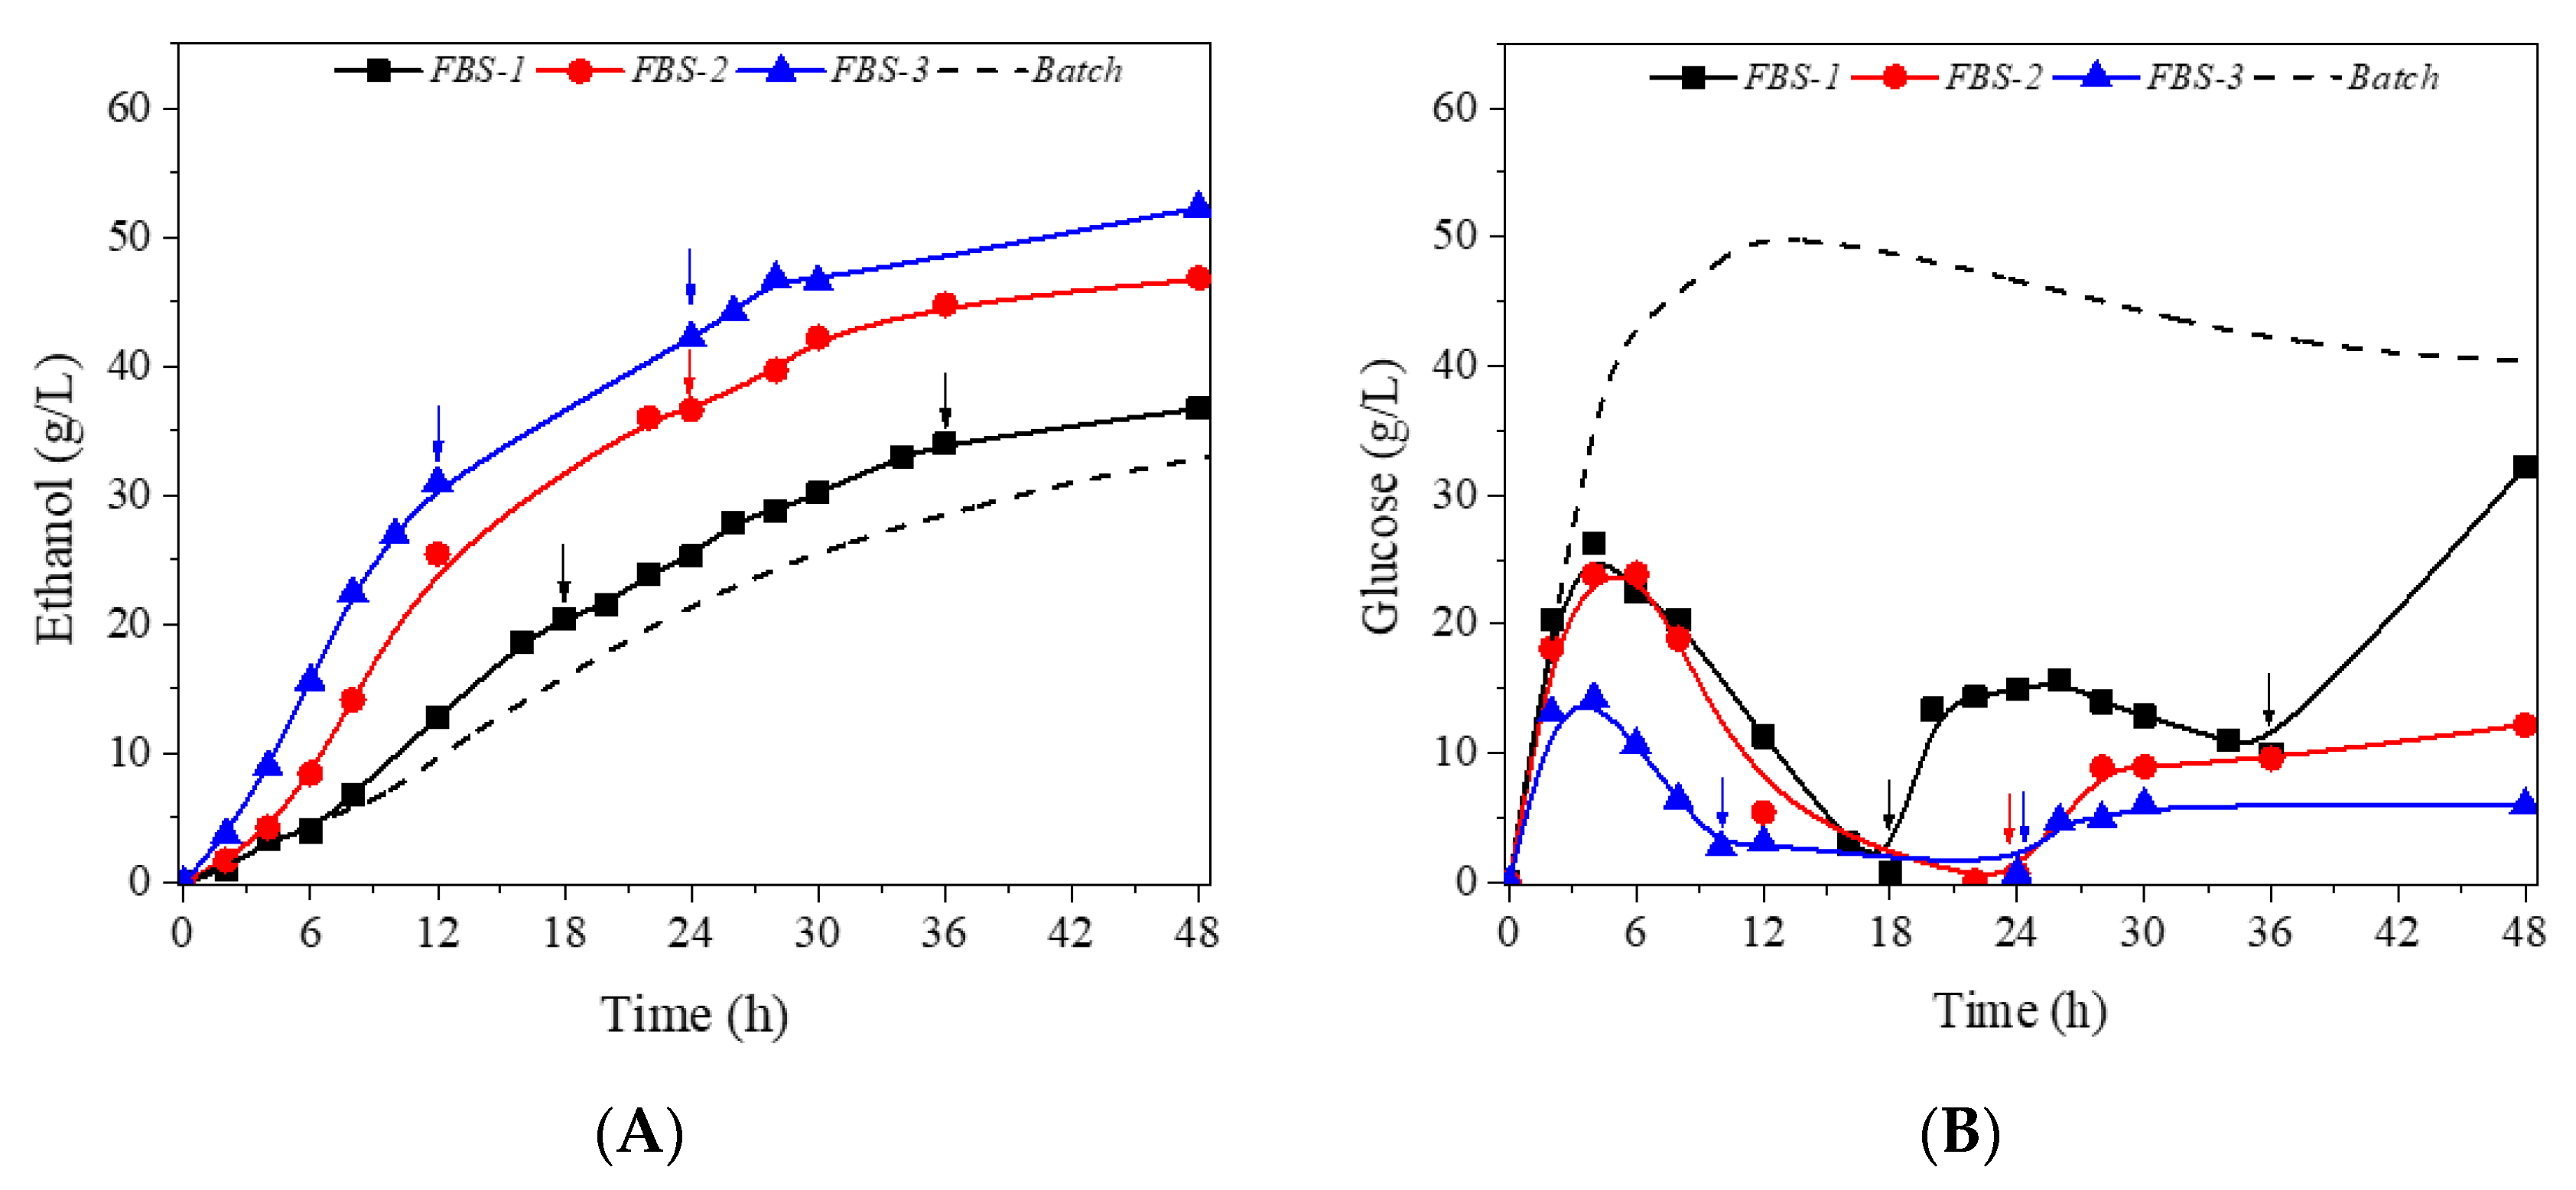
3.3. Evaluation of Fed-Batch Strategies

In the present study, the fermentation efficiency during SSF using pre-treated rice straw as a substrate in the VBM reactor was 75%, 74% and 40% for the solid contents of 8%, 16% and 24% (w/v), respectively (Table 7). Such results demonstrate that for this reactor configuration it is possible to operate efficiently up to 16% (w/v) of solid loading in batch mode. However, the ethanol concentration obtained using this solid content was 41.3 g/L, which is still below the feasible reference values for distillation. According to Nguyen et al. [14], achieving ethanol titers higher than 50 g/L is important to reduce energy demands for ethanol recovery, thus obtaining significant savings in operating and capital costs.
An alternative to circumvent the inherent limitations of SSF with high solid contents is the conduction of the process in a fed-batch mode. This process configuration allows a controlled feed of biomass during the reaction. Since the substrate is continuously hydrolyzed, a sensible reduction in the viscosity of the medium is observed, which in turn favors the enzymatic and fermentative processes. Thus, in order to improve the ethanol production from K. marxianus from pre-treated rice straw, different strategies of fed-batch SSF at 24% (w/v) total solid loading were investigated.
For all the fed-batch strategies evaluated (Table 3), the ethanol production was improved concomitantly to the decrease of glucose accumulation (Figure 4A,B). When compared to the batch SSF at 24% (w/v) solid loading, the first fed-batch SSF strategy (FBS-1) showed a small increase in ethanol production (from 33.7 to 36.7 g/L) and a lower glucose accumulation (from 45.0 to 32.2 g/L) at 48 h. The strategy FBS-1 started with 8% solids and after 18 and 36 h, the reactor was fed with an additional 8%, making up a total load of 24% (w/v). It is worth mentioning that all the enzyme load (21.5 FPU + 26.5 IU/g glucan) was added at the beginning of the process, leading to an excess of enzyme when the reaction started, which could explain the high glucose accumulation and modest ethanol improvement.
The second strategy of fed-batch SSF (FBS-2) was designed to start with 16% (w/v) solid loading and only one feeding of 8% solids after 24 h, and a lower enzyme load (14.3 FPU + 17.6 IU/g glucan) than FBS-1. By using this strategy, ethanol production reached 46.8 g/L at 48 h (Figure 4A), corresponding to an improvement of 39% and 28% when compared to the batch and fed-batch (FBS-1) processes, respectively. Glucose accumulation in FBS-2 was also lower than in FBS-1, reaching 12 g/L at the end of the reaction (Figure 4B).
Based on the previous results, a third strategy of fed-batch SSF (FBS-3) was proposed, starting with 16% (w/v) solid loading and after 10 and 24 h the reactor was fed with an additional 4% (w/v) of substrate. The enzyme loading was the same used as in FBS-2 (14.3 FPU + 17.6 IU/g glucan), but the initial cell concentration was increased from 1.0 to 3.0 g/L. As shown in Figure 4, the FBS-3 strategy resulted in the highest ethanol concentration (52.3 g/L) and the lowest glucose accumulation (only 6.0 g/L) after 48 h. These results corresponded to an improvement of 55% in ethanol production and a reduction of 85% in glucose accumulation when compared to the batch SSF process at 24% (w/v) solid loading. In addition, the value of ethanol concentration achieved in FBS-3 (52.3 g/L) was above the minimum requirements to make the distillation process economically feasible.
Table 8 summarizes the results of the batch and fed-batch SSF processes under different strategies using pre-treated rice straw at 24% (w/v) solid loading in the VBM reactor. As can be seen, all the fermentation parameters were increased when the process was performed in fed-batch compared to batch mode, being observed an improvement of 40% in ηF values and 10% in ηH when the FBS-3 strategy was used. It is interesting to note that the FBS-3 resulted in a ηH/ηF ratio close to 1, indicating that the desirable balance between the saccharification and fermentation processes were achieved under these conditions.
In order to assess the saccharification profile of pre-treated rice straw at 24% (w/v) solid loading in fed-batch mode, experiments of enzymatic hydrolysis (EH) under the conditions of the FBS-3 strategy were carried out. As can be seen in Figure 5, the profile of glucan digestibility was similar for both processes (SSF and EH) up to 10 h, achieving at this point a glucose concentration of about 55 g/L (ηF = 36%). However, after this time, the performance of SSF was superior, and at the end of 48 h the cellulose conversion reached 72%, corresponding to an increase of 15% when compared to the enzymatic hydrolysis (61%). This improvement can be attributed to the lower sugar inhibition effect, since under FBS-3 conditions, a low level of glucose (around 5.0 g/L) was observed after 24 h and this level was maintained until the end of the process (Figure 4B). These results of hydrolysis efficiency are in agreement with that of Du et al. [12] who reported similar values (59%) in fed-batch process in a tank-rotating reactor at 20% (w/w) pre-treated corn stover and enzyme loading of 10 FPU/g dry matter. However, in Du’s work, the final cellulose conversion was observed at 72 h; while the time in the present study was shorter (48 h). According to the authors, advanced enzymes formulations including more endoglucanases, which provide dramatic reductions in the viscosity of lignocellulosic slurry, might be used to facilitate the mass transfer at high solid loading.
The SSF findings of the present study are also advantageous when compared to separate hydrolysis and fermentation (SHF) for ethanol production. In fed-batch enzymatic hydrolysis, for example, the maximum glucose concentration was 92.3 g/L (Figure 5), which in turn could be theoretically converted into 47.1 g/L ethanol. This value is 10% lower than the ethanol concentration (52.3 g/L) obtained in the fed-batch strategy FBS-3.
Finally, a global analysis of the results obtained in the present study compared to the current literature on ethanol production by SSF in fed-batch mode using different biomass types at high solids content ([17,31,33,36,37,38,39]—Table 9) revealed that the strategy proposed here is very promising. As can be seen, Zhao et al. [36] and Zhang et al. [17] achieved the highest ethanol titers (80.0 and 84.7 g/L) using pre-treated sugarcane bagasse and corncob, respectively. However, the global time of their processes was 120 and 96 h, respectively, giving an overall ethanol volumetric productivity of approximately 0.70 g/L.h. This productivity value was about 45% lower than that obtained in the present work (1.1 g/L.h) using pre-treated rice straw in the VBM reactor. Only the overall process efficiency obtained in the present study (67%) can still be improved. In order to do that, efforts will be directed at increasing the enzymatic conversion of cellulose and consequently, the ethanol production.

4. Conclusions

This study demonstrated that the vertical ball mill (VBM) reactor, equipped with an adjustable flat-disk impeller and operated with glass spheres as shear agents, can be effectively used for processing lignocellulosic biomass at high solid loading. In this study, the optimal conditions of temperature and number of spheres for SSF process in the VBM reactor using pre-treated rice straw and K. marxianus were established. SSF operation in fed-batch mode was an efficient strategy for ethanol production from pre-treated rice straw at high solid loading (24% w/v). The selected fed-batch SSF strategy (FBS-3) resulted in a 1.6-fold increase in the ethanol titer compared to the batch mode (from 33.7 to 52.3 g/L) after 48 h, which represented an important advance for industrial-scale application. Furthermore, the data revealed that the limitation of SSF in fed-batch mode is more related to the incomplete hydrolysis of cellulose than to the ability of the yeast to convert glucose into ethanol. Considering the whole process of cellulose conversion into ethanol (enzymatic hydrolysis and fermentation), this study resulted in one of the highest volumetric productivities with titers above 50 g/L reported in the literature for second generation ethanol production. The data obtained in the strategy FBS-3 will be used for economic analysis studies considering the application of rice straw for ethanol production within the biorefinery context.

Author Contributions

Conceptualization, I.C.R.; Methodology, R.C.A.C. and J.P.A.S.; Analysis, R.C.A.C.; Investigation, R.C.A.C. and J.P.A.S.; Resources, I.C.R. and S.I.M.; Data curation, I.C.R., R.C.A.C. and S.I.M.; Writing—original draft preparation, I.C.R and S.I.M.; Writing—review and editing, S.I.M.; Project administration, I.C.R.; Funding acquisition, I.C.R. and S.I.M. All authors have read and agreed to the published version of the manuscript.

Funding

This research was funded by Fundação de Amparo à Pesquisa do Estado de São Paulo (FAPESP), Brazil, grant numbers 2013/13953-6 and 2015/24813-6; the Novo Nordisk Foundation, Denmark, grant number NNF10CC1016517; the Coordenação de Aperfeiçoamento de Pessoal de Nível Superior (CAPES), Brazil, Finance Code 001; and by the Conselho Nacional de Desenvolvimento Científico e Tecnológico (CNPq), Brazil.

Conflicts of Interest

The authors declare no conflict of interest.

References

  1. Hughes, S.R.; Qureshi, N. Biofuel demand realization. In Biomass to Biofuels: Strategies for Global Industries; Vertès, A.A., Qureshi, N., Blaschek, H.P., Yukawa, H., Eds.; Wiley: Hoboken, NJ, USA, 2010; pp. 55–69. [Google Scholar]
  2. Saini, J.K.; Agrawal, R.; Satlewal, A.; Saini, R.; Gupta, R.; Mathur, A.; Tuli, D. Second generation bioethanol production at high gravity of pilot-Scale pretreated wheat straw employing newly isolated thermotolerant yeast Kluyveromyces marxianus DBTIOC-35. RSC Adv. 2015, 5, 37485–37494. [Google Scholar] [CrossRef]
  3. Food and Agriculture Organization of the United States. FAO Cereal Supply and Demand Brief. Available online: http://www.fao.org/worldfoodsituation/csdb/en/ (accessed on 7 April 2020).
  4. Mussatto, S.I. Biomass Fractionation Technologies for a Lignocellulosic Feedstock Based Biorefinery; Elsevier Inc.: Waltham, MA, USA, 2016; p. 674. [Google Scholar]
  5. Mussatto, S.I.; Dragone, G.; Guimarães, P.M.R.; Silva, J.P.A.; Carneiro, L.M.; Roberto, I.C.; Vicente, A.; Domingues, L.; Teixeira, J.A. Technological trends, global market, and challenges of bio-ethanol production. Biotechnol. Adv. 2010, 28, 817–830. [Google Scholar] [CrossRef] [Green Version]
  6. Li, J.; Zhou, P.; Liu, H.; Xiong, C.; Lin, J.; Xiao, W.; Gong, Y.; Liu, Z. Synergism of cellulase, xylanase, and pectinase on hydrolyzing sugarcane bagasse resulting from different pretreatment technologies. Bioresour. Technol. 2014, 155, 258–265. [Google Scholar] [CrossRef]
  7. Di Risio, S.; Hu, C.S.; Saville, B.A.; Liao, D.; Lortie, J. Large-Scale, high-Solids enzymatic hydrolysis of steam-Exploded poplar. Biofuels Bioprod. Bioref. 2011, 5, 609–620. [Google Scholar] [CrossRef]
  8. Mussatto, S.I.; Dragone, G.M. Biomass pretreatment, biorefineries and potential products for a bioeconomy development. In Biomass Fractionation Technologies for a Lignocellulosic Feedstock Based Biorefinery; Mussatto, S.I., Ed.; Elsevier Inc.: Waltham, MA, USA, 2016; pp. 1–22. [Google Scholar]
  9. Horn, S.J.; Vaaje-Kolstad, G.; Westereng, B.; Eijsink, V.G.H. Novel enzymes for the degradation of cellulose. Biotechnol. Biofuels 2012, 5, 45. [Google Scholar] [CrossRef] [Green Version]
  10. Ha, S.-J.; Galazka, J.M.; Kim, S.R.; Choi, J.-H.; Yang, X.; Seo, J.-H.; Glass, N.L.; Cate, J.H.D.; Jin, Y.-S. Engineered Saccharomyces cerevisiae capable of simultaneous cellobiose and xylose fermentation. Proc. Natl. Acad. Sci. USA 2010, 108, 504–509. [Google Scholar] [CrossRef] [Green Version]
  11. Chen, H.-Z.; Liu, Z.-H. Enzymatic hydrolysis of lignocellulosic biomass from low to high solids loading. Eng. Life Sci. 2017, 17, 489–499. [Google Scholar] [CrossRef]
  12. Du, J.; Cao, Y.; Liu, G.; Zhao, J.; Li, X.; Qu, Y. Identifying and overcoming the effect of mass transfer limitation on decreased yield in enzymatic hydrolysis of lignocellulose at high solid concentrations. Bioresour. Technol. 2017, 229, 88–95. [Google Scholar] [CrossRef]
  13. Kang, K.E.; Chung, D.-P.; Kim, Y.; Chung, B.-W.; Choi, G.-W. High-Titer ethanol production from simultaneous saccharification and fermentation using a continuous feeding system. Fuel 2015, 145, 18–24. [Google Scholar] [CrossRef]
  14. Nguyen, T.Y.; Cai, C.M.; Kumar, R.; Wyman, C.E. Overcoming factors limiting high-solids fermentation of lignocellulosic biomass to ethanol. Proc. Natl. Acad. Sci. USA 2017, 114, 11673–11678. [Google Scholar] [CrossRef] [Green Version]
  15. Jørgensen, H.; Vibe-Pedersen, J.; Larsen, J.; Felby, C. Liquefaction of lignocellulose at high-Solids concentrations. Biotechnol. Bioeng. 2007, 96, 862–870. [Google Scholar] [CrossRef] [PubMed]
  16. Liguori, R.; Ventorino, V.; Pepe, O.; Faraco, V. Bioreactors for lignocellulose conversion into fermentable sugars for production of high added value products. Appl. Microbiol. Biotechnol. 2016, 100, 597–611. [Google Scholar] [CrossRef] [PubMed] [Green Version]
  17. Zhang, M.; Wang, F.; Su, R.; Qi, W.; He, Z. Ethanol production from high dry matter corncob using fed-Batch simultaneous saccharification and fermentation after combined pretreatment. Bioresour. Technol. 2010, 101, 4959–4964. [Google Scholar] [CrossRef] [PubMed]
  18. He, Y.; Zhang, L.; Zhang, J.; Bao, J. Helically agitated mixing in dry dilute acid pretreatment enhances the bioconversion of corn stover into ethanol. Biotechnol. Biofuels 2014, 7, 1. [Google Scholar] [CrossRef] [Green Version]
  19. Chen, M.L.; Wang, F.S. Optimization of a fed-Batch simultaneous saccharification and cofermentation process from lignocellulose to ethanol. Ind. Eng. Chem. Res. 2010, 49, 5775–5785. [Google Scholar] [CrossRef]
  20. Alfani, F.; Gallifuoco, A.; Saporosi, A.; Spera, A.; Cantarella, M. Comparison of SHF and SSF processes for the bioconversion of steam-Exploded wheat straw. J. Ind. Microbiol. Biotechnol. 2000, 25, 184–192. [Google Scholar] [CrossRef]
  21. Ballesteros, M.; Oliva, J.M.M.; Negro, M.J.J.; Manzanares, P.; Ballesteros, I. Ethanol from lignocellulosic materials by a simultaneous saccharification and fermentation process (SFS) with Kluyveromyces marxianus CECT 10875. Process Biochem. 2004, 39, 1843–1848. [Google Scholar] [CrossRef]
  22. Cannella, D.; Jørgensen, H. Do new cellulolytic enzyme preparations affect the industrial strategies for high solids lignocellulosic ethanol production? Biotechnol. Bioeng. 2014, 111, 59–68. [Google Scholar] [CrossRef]
  23. Castro, R.C.A.; Mussatto, S.I.; Roberto, I.C. A vertical ball mill as a new reactor design for biomass hydrolysis and fermentation process. Renew. Energy 2017, 114, 775–780. [Google Scholar] [CrossRef] [Green Version]
  24. Castro, R.C.A.; Fonseca, B.G.; Santos, H.T.L.; Ferreira, I.S.; Mussatto, S.I.; Roberto, I.C. Alkaline deacetylation as a strategy to improve sugars recovery and ethanol production from rice straw hemicellulose and cellulose. Ind. Crops Prod. 2017, 106, 65–73. [Google Scholar] [CrossRef]
  25. Sluiter, A.; Hames, B.; Ruiz, R.; Scarlata, C.; Sluiter, J.; Templeton, D.; Crocker, D. Determination of Structural Carbohydrates and Lignin in Biomass; Technical Report NREL/TP-510-42618; National Renewable Energy Laboratory: Golden, CO, USA, 2012. [Google Scholar]
  26. Adney, B.; Baker, J. Measurement of Cellulase Activities. Technical Report NREL/TP-510-42628; National Renewable Energy Laboratory: Golden, CO, USA, 2008. [Google Scholar]
  27. Wood, T.M.; Bhat, K.M. Methods for measuring cellulase activities. In Methods Enzymology; Wood, W.A., Kellogg, S.T., Eds.; Academic Press: London, UK, 1998; pp. 87–112. [Google Scholar]
  28. Castro, R.C.A.; Roberto, I.C. Effect of nutrient supplementation on ethanol production in different strategies of saccharification and fermentation from acid pretreated rice straw. Biomass Bioenerg. 2015, 78, 156–163. [Google Scholar] [CrossRef]
  29. Mussatto, S.I.; Roberto, I.C. Alternatives for detoxification of diluted-Acid lignocellulosic hydrolyzates for use in fermentative processes-A review. Bioresour. Technol. 2004, 93, 1–10. [Google Scholar] [CrossRef]
  30. Varga, E.; Klinke, H.B.; Reczey, K.; Thomsen, A.B. High solid simultaneous saccharification and fermentation of wet oxidized corn stover to ethanol. Biotechnol. Bioeng. 2004, 88, 567–574. [Google Scholar] [CrossRef] [PubMed]
  31. Koppram, R.; Olsson, L. Combined substrate, enzyme and yeast feed in simultaneous saccharification and fermentation allow bioethanol production from pretreated spruce biomass at high solids loadings. Biotechnol. Biofuels 2014, 7, 54. [Google Scholar] [CrossRef] [PubMed] [Green Version]
  32. Roberts, K.M.; Lavenson, D.M.; Tozzi, E.J.; McCarthy, M.J.; Jeoh, T. The effects of water interactions in cellulose suspensions on mass transfer and saccharification efficiency at high solids loadings. Cellulose 2011, 18, 759–773. [Google Scholar] [CrossRef]
  33. Unrean, P.; Khajeeram, S.; Laoteng, K. Systematic optimization of fed-Batch simultaneous saccharification and fermentation at high-Solid loading based on enzymatic hydrolysis and dynamic metabolic modeling of Saccharomyces cerevisiae. Appl. Microbiol. Biotechnol. 2016, 100, 2459–2470. [Google Scholar] [CrossRef] [PubMed]
  34. Zhang, J.; Hou, W.; Bao, J. Reactors for high solid loading pretreatment of lignocellulosic biomass. Adv. Biochem. Eng. Biotechnol. 2015, 152, 75–90. [Google Scholar]
  35. Koppram, R.; Tomás-Pejó, E.; Xiros, C.; Olsson, L. Lignocellulosic ethanol production at high-Gravity: Challenges and perspectives. Trends Biotechnol. 2014, 32, 46–53. [Google Scholar] [CrossRef]
  36. Zhao, X.; Dong, L.; Chen, L.; Liu, D. Batch and multi-Step fed-Batch enzymatic saccharification of Formiline-pretreated sugarcane bagasse at high solid loadings for high sugar and ethanol titers. Bioresour. Technol. 2013, 135, 350–356. [Google Scholar] [CrossRef]
  37. Wang, R.; Unrean, P.; Franzén, C.J. Model-Based optimization and scale-Up of multi-Feed simultaneous saccharification and co-Fermentation of steam pre-treated lignocellulose enables high gravity ethanol production. Biotechnol. Biofuels 2016, 9, 88. [Google Scholar] [CrossRef] [Green Version]
  38. Gladis, A.; Bondesson, P.-M.; Galbe, M.; Zacchi, G. Influence of different SSF conditions on ethanol production from corn stover at high solids loadings. Energy Sci. Eng. 2015, 3, 481–489. [Google Scholar] [CrossRef] [Green Version]
  39. Vargas, F.; Domínguez, E.; Vila, C.; Rodríguez, A.; Garrote, G. Agricultural residue valorization using a hydrothermal process for second generation bioethanol and oligosaccharides production. Bioresour. Technol. 2015, 191, 263–270. [Google Scholar] [CrossRef] [PubMed]
Figure 1. Pareto charts for the effects of the number of spheres (X1) and temperature (X2) on ethanol volumetric productivity (A) and ethanol yield (B) from simultaneous saccharification and fermentation (SSF) experiments of pre-treated rice straw in the VBM reactor.
Energies 13 02090 g001
Figure 2. Responses surfaces described by the quadratic models representing the ethanol volumetric productivity (A), ethanol yield (B) and the optimized region (C) as a function of the number of spheres (X1) and temperature (X2) from SSF experiments of pre-treated rice straw in the VBM reactor.
Energies 13 02090 g002
Figure 3. Effect of the solid loading during batch SSF of pre-treated rice straw in the VBM reactor under optimized conditions (18 spheres, 41.5 °C) at 200 rpm. Ethanol production (A) and glucose consumption (B). Standard deviations were lower than 10%.
Energies 13 02090 g003
Figure 4. Ethanol (A) and glucose (B) concentrations from different strategies of fed-batch SSF at 24% (w/v) solid loading. Dotted line represents the batch SSF experiment at 24% (w/v) solids and the arrows above the curves indicates the substrate feed time for each strategy.
Energies 13 02090 g004
Figure 5. Time course for enzymatic hydrolysis (EH) and simultaneous saccharification and fermentation (SSF) of pre-treated rice straw at 24% (w/v) solid loading under the fed-batch mode using the FBS-3 strategy.
Energies 13 02090 g005
Table 1. Composition (g/100 g, dry matter) of the original (in natura) and pre-treated rice straw used in this study.
ComponentRice Straw in naturaDeacetylated Rice StrawCellulignin
Cellulose35.3 ± 0.243.5 ± 0.261.8 ± 0.7
Hemicellulose23.8 ± 0.427.8 ± 0.511.1 ± 0.1
Acetyl groups2.6 ± 0.40.07 ± 0.020.06 ± 0.01
Total lignin17.5 ± 0.711.5 ± 1.117.1 ± 0.3
Insoluble lignin13.1 ± 0.79.1 ± 0.416.2 ± 0.6
Soluble lignin4.4 ± 0.22.3 ± 0.30.9 ± 0.1
Ashes11.3 ± 0.13.8 ± 0.046.0 ± 0.1
Table 2. Experimental range and levels of the independent process variables (number of glass spheres and temperature) used during the production of ethanol by simultaneous saccharification and fermentation (SSF) of pre-treated rice straw in a vertical ball mill (VBM) reactor.
Independent VariableSymbolRange and Levels
−10+1
Number of spheres (units)X101530
Temperature (°C)X2404346
Table 3. Summary of the conditions used for the fed-batch SSF process with the different feeding strategies of pre-treated rice straw in the VBM reactor under optimized conditions (41.5 °C, 18 glass spheres) at 200 rpm.
ParametersFed-Batch Strategies
FBS-1FBS-2FBS-3
Initial solid loading (%, w/v)81616
Feeding number (load %, w/v)2 (8)1 (8)2 (4)
Feeding time (h)16 and 362410 and 24
Total solids (%, w/v)242424
Cellubrix loading (FPU/gglucan)21.514.314.3
Novozyme 188 loading (IU/gglucan)26.517.617.6
Initial cell concentration (g/L)1.01.03.0
Table 4. Equations used for calculation of the parameters in the SSF process.
ParameterSymbolUnitEquation
Ethanol yield
(g ethanol/g glucose available in biomass)
YP/Sg/g Y P / S = E M × V G × M S × f c
Fermentation efficiency
(ethanol yield/theoretical ethanol yield)
ηF% η F = Y P / S Y P / S * × 100
Ethanol volumetric productivity
(ethanol concentration/time)
QPg/L.h Q P = E M t
Hydrolysis efficiency
(g glucose/g glucose available in biomass)
ηH% η H = [ ( E M × f e ) + G R ] × V G × M S × f c × 100
EM = maximum ethanol concentration (g/L); V = aqueous phase volume in SSF (L); G = glucan fraction in dry biomass (g/g); MS = dry weight of biomass (g); fc = 1.11 (conversion factor of glucan to equivalent glucose); Y*P/S = 0.511 (theoretical ethanol yield from glucose); t = time correspondent to the maximum ethanol concentration obtained in SSF; fe = 1.955 (conversion factor of ethanol to glucose); GR = residual glucose (g/L).
Table 5. Experimental conditions and results of batch SSF in the VBM reactor at 8% loading of pre-treated rice straw containing 61.8% ± 0.7% (w/w) of glucan.
RunIndependent VariableResponses
Number of Spheres (Units)Temperature (°C)Maximum Ethanol (g/L)QP (g/L.h)YP/S (g/g)Residual Glucose (g/L)
104019.451.140.351.14
2304021.291.640.391.64
304617.310.600.320.60
4304615.400.510.280.51
5154321.271.520.411.52
6154321.161.410.391.41
7154321.571.540.391.54
8154020.931.610.381.61
9154619.280.640.350.64
Table 6. Analysis of variance (ANOVA) of the quadratic models for ethanol yield and volumetric productivity in batch mode SSF of pre-treated rice straw in the VBM reactor.
SourceEthanol Yield (YP/S)Ethanol Volumetric Productivity (QP)
SSdfF-Ratiop-ValueSSdfF-Ratiop-Value
Model0.013059.720.0452 a1.7600566.410.0029 a
X10.000010.001.00000.042017.940.0668
X20.0048118.060.0239 a1.16161219.50.0007
X120.001214.500.12400.031015.860.0941
X220.001214.510.12370.1599130.210.0119
X1·X20.001616.000.09170.0870116.450.0270
Residual0.00083 0.01593
Lack of Fit0.000514.000.1835 b0.006111.240.3814 b
Pure Error0.00032 0.00982
Total (Corr)0.01408 1.77308
R2 = 0.94R2 = 0.99
SS: sum of squares; df: degrees of freedom. a Significant at 95% confidence level; b Not significant at 95% confidence level.
Table 7. Parameters of the batch SSF in the VBM reactor under the different solid loadings of pre-treated rice straw.
Solid loading * (%)EM (g/L)QP (g/L.h)GR (g/L) η H   ( % ) η F   ( % ) η H η F
821.01.500.0075751.00
1641.31.141.4075741.01
2433.70.7039.664401.60
* glucan content of 61.8%, EM = maximum ethanol concentration, QP = ethanol volumetric productivity, GR = residual glucose, ηH = hydrolysis efficiency, ηF = fermentation efficiency.
Table 8. Comparison of the batch and fed-batch SSF in the VBM reactor at 24% (w/v) final loading of pre-treated rice straw.
SSF ExperimentsEM (g/L)QP (g/L.h)GR (g/L) η H   ( % ) η F   ( % ) η H η F
Batch *33.70.7039.664401.60
FBS-1 *36.70.8032.263441.43
FBS-2 **45.30.9012.967581.15
FBS-3 **52.31.106.071671.06
* glucan content of 61.8%; ** glucan content of 57.2%; EM = maximum ethanol concentration, QP = ethanol volumetric productivity, GR = residual glucose, ηH = hydrolysis efficiency, ηF = fermentation efficiency.
Table 9. Comparison of fed-batch simultaneous saccharification and fermentation experiments using different pre-treated feedstocks for ethanol production at high solid loading.
FeedstockPre-TreatmentSolids (% w/w)Enzyme LoadYeast Strain and InoculumReactor TypeOperational ConditionsFermentation ParametersRef.
Rice strawAlkali/Acid1914.3 FPU Cellubrix and 17.6 IU β-glucosidase Novozyme 188/g glucanK. marxianus
NRRL Y-6860 (3 g/L)
1.7-L vertical ball mill reactor41.5 °C, 200 rpm, 48 hEM = 52.3 g/L
QP = 1.1 g/L.h
ηF = 67%
This work
SpruceNot informed207.5 FPU CellicCTec2/g solidS. cerevisiae Thermosacc®
(5 g/L)
3.6-L reactor (Infors HT-Labfors)35 °C, 400 rpm, 96 hEM = 40.0 g/L
QP = 0.42 g/L.h
ηF = 53%
[31]
Sugarcane bagasseAcid-catalyzed steam2215 FPU CellicCTec2/g solidS. cerevisiae Thermosacc®
(0.02 g cell/g solid)
2-L reactor (Biostat B. Braum Biotech)35 °C, 500 rpm, 120 hEM = 65.4 g/L
QP = 0.45 g/L.h
ηF = 85%
[33]
Sugarcane bagasseFormalin 2010 FPU /g solidS. cerevisiae CICC 31014
(10% v/v)
150-mL Erlenmeyer flasks37–38 °C, 150 rpm, 120 hEM = 80.0 g/L
QP = 0.67 g/L.h
ηF = 83%
[36]
Wheat strawAcid-catalyzed steam2010 FPU CellicCTec2/g solidS. cerevisiae KE-6-12A
(0.02 g/g solid)
3.6-L reactor (Infors HT-Labfors)35 °C, 400 rpm, 72 hEM = 57.3 g/L
QP = 0.79 g/L.h
ηF = 66%
[37]
Corn stoverAcid-catalyzed steam207.5 FPU CellicCTec2/g solidS. cerevisiae dry baker yeas
T(3 g/L)
2-L reactor (Infors AG)35 °C, 144 hEM = 53.4 g/L
QP = 0.74 g/L.h
ηF = 75%
[38]
Barley strawHydrothermal2510 FPU Celluclast 1.5L/g solid and 5 IU Novozyme 188/FPUS. cerevisiae CECT-1170
(10 mL)
250-mL Erlenmeyer flasks35 °C, 120 rpm, 96 hEM = 51.7 g/L
QP = 0.54 g/L.h
ηF = 77%
[39]
CorncobAcid/Alkali2522.8 FPU GC220/g glucanS. cerevisiae
(5.0 g/L)
6-L reactor (Biostat B. Braum Biotech)Pre-hydrolysis (50 °C, 24 h)
Fermentation (37 °C, 96 h)
EM = 84.7 g/L
QP = 0.70 g/L.h
ηF = 79%
[17]
EM = maximum ethanol concentration, QP = ethanol volumetric productivity (calculated from the maximum ethanol obtained divided by the total time of the process including pre-hydrolysis stage); ηF = fermentation efficiency.

