Article

A Building Life-Cycle Embodied Performance Index—The Relationship between Embodied Energy, Embodied Carbon and Environmental Impact

School of Architecture, Planning and Preservation, University of Maryland, College Park, MD 20742, USA
Energies 2020, 13(8), 1905; https://doi.org/10.3390/en13081905
Submission received: 28 March 2020 / Revised: 9 April 2020 / Accepted: 11 April 2020 / Published: 13 April 2020
(This article belongs to the Special Issue Life Cycle Assessment (LCA) of Environmental and Energy Systems)

Abstract

:
Knowledge and research tying the environmental impact and embodied energy together is a largely unexplored area in the building industry. The aim of this study is to investigate the practicality of using the ratio between embodied energy and embodied carbon to measure the building’s impact. This study is based on life-cycle assessment and proposes a new measure: life-cycle embodied performance (LCEP), in order to evaluate building performance. In this project, eight buildings located in the same climate zone with similar construction types are studied to test the proposed method. For each case, the embodied energy intensities and embodied carbon coefficients are calculated, and four environmental impact categories are quantified. The following observations can be drawn from the findings: (a) the ozone depletion potential could be used as an indicator to predict the value of LCEP; (b) the use of embodied energy and embodied carbon independently from each other could lead to incomplete assessments; and (c) the exterior wall system is a common significant factor influencing embodied energy and embodied carbon. The results lead to several conclusions: firstly, the proposed LCEP ratio, between embodied energy and embodied carbon, can serve as a genuine indicator of embodied performance. Secondly, environmental impact categories are not dependent on embodied energy, nor embodied carbon. Rather, they are proportional to LCEP. Lastly, among the different building materials studied, metal and concrete express the highest contribution towards embodied energy and embodied carbon.

Graphical Abstract

1. Introduction

The environmental impact from operating energy use is a well-established area of research and practice, with well-defined metrics, methodologies, building codes and regulations. There has been substantial progress made by practitioners to improve building operating energy efficiencies, which in turn leads to carbon emission reductions. As the building codes become more stringent, operating energy and related emissions will decrease dramatically, thus decreasing the role of operating energy in a building’s life cycle.
Numerous studies have demonstrated the increasingly important role that embodied energy plays in the building life cycle. For a conventional single-family house, the percentage of embodied energy could account for up to 40%–50% of the total life-cycle primary energy use [1]. For low-energy buildings (energy-efficient buildings) and net zero energy buildings, the percentage embodied energy accounts for could be as high as 74%–100% [2]. Regardless, the commonly accepted guidelines and methods of assessment and measurement for embodied energy have not been established. Previous studies demonstrate considerable variation in reported embodied energy values due to the high number of variables [3,4], including building materials [5] and building construction types [2]: there is inadequate published information on whole building life-cycle embodied energy reports [6]. Aside from a lack of consensus on measurement and procedures, embodied energy emissions and related carbon emissions are being largely ignored [7] as the focus is solely on operating energy.
Embodied energy is the energy consumed during a building’s whole life cycle. This excludes the operating energy, but includes raw material extraction, product production, manufacturing, installation, on-site construction, maintenance, repair and replacement, and finally the demolition and disposal of a building [8]. Embodied carbon is used to measure the building’s contribution to climate change, which is closely related to, but not equal to, embodied energy [8]. There are three principal differences between embodied energy and embodied carbon: (1) the same amount of embodied energy could be converted to a different amount of embodied carbon, depending on the energy mix of the regional energy resources [9] and other factors. For example, if coal comprises a higher percentage of the energy source than wind, there will be a higher conversion rate from embodied energy to embodied carbon. (2) Carbon can be emitted due to chemical processes and reactions that do not involve energy consumption; the carbon emitted during cement production is one example [9]. (3) Carbon can also be sequestered, as is the case with wood during its growth phase [8]. Hence, the material can consume energy and reduce emissions at the same time. For these reasons, the ratio between embodied energy and embodied carbon could be a more meaningful tool to assess the life-cycle embodied performance (LCEP) of a building.
The main purpose of this study is to investigate the utility of the ratio between embodied energy and embodied carbon. This ratio has the potential to measure the building’s embodied and environmental impact. There are three essential investigative questions that will aid in this pursuit: (1) Is there correlation between life-cycle embodied energy (LCEE) and life-cycle embodied carbon (LCEC)? (2) Can a building’s environmental impact be predicted by the life-cycle embodied performance (LCEP)? (3) Which building components and materials contribute most to the overall embodied energy, embodied carbon and environmental impact?

2. Background and Terminology

2.1. Embodied Carbon

The term embodied carbon (EC) has been used in a variety of ways, which can be confusing. In this paper, life-cycle embodied carbon (LCEC) is not the carbon encapsulated in building materials. Instead, it refers to all the life-cycle greenhouse gas emissions related to the building outside of building operations. It includes carbon associated with energy consumed throughout the entire life-cycle, and excludes carbon saved through recycle and reuse at the end of building service life. The building life-cycle stages are defined in BS EN 15798 norms (BSI [10]). Embodied carbon is also known as “value chain emissions”, and it includes upstream and downstream emissions. Figure 1 illustrates the embodied carbon through the building life-cycle, including upstream and downstream emission.
Hu (2019) defines four primary categories that comprise life-cycle embodied carbon (LCEC): Initial embodied carbon (IEC), recurring embodied carbon (REC), demolition embodied carbon (DEC) and recycled embodied carbon (REYC); refer to Equation (1) [11]. In this study, life-cycle embodied carbon (LCEC) is represented by the most commonly used indicator: global warming potential (GWP) [12], measured in kgCO2eq.
This project uses two variables to measure the LCEC: (a) life-cycle embodied carbon coefficient (LCECC), demonstrated in Equation (2), and (b) life-cycle embodied carbon intensity (LCECI), demonstrated in Equation (3). These variables are investigated and compared for their reliability to evaluate building performance. In 1996, Alcorn proposed the term “Embodied Energy Coefficients” (EEC), which they used to measure the change of embodied energy for a variety of building materials used in New Zealand Housing between 1983 and 1996. The results showed 32% to 56% percentage for different materials reflecting the changes in construction and manufacturing methods and processes [13]. EEC was then later used by Dias and Polliyadda (2004) as “embodied carbon coefficients” [14] to measure the embodied performance of buildings. ”Life-cycle embodied energy intensity” is the new unit proposed in this project; it is most determined by building materials and assemblies, and is measured in kgCO2e /m2/yr.
LCEC = c = end c = 1 ( IEC c +   REC c +   DEC c )   REYC e  
LCECC   b u i l d i n g = LCEC   W   ×   L
where LCECC is life-cycle embodied carbon coefficient, measured by kgCO2eq/kg/yr. LCEC is the life-cycle embodied carbon of the building, measured by kgCO2e. W is the total weight of the building, calculated by kg. L is the total building life span, in years.
LCECI   b u i l d i n g = LCEC A   ×   L
where LCECI represents life-cycle embodied carbon intensity, measured in kgCO2eq/m2/yr., LCEC is the life-cycle embodied carbon of the building, measured in kgCO2eq. A represents the total floor area of the building (conditioned and unconditioned), measured in square meters (m2). L is the total building life span, in years.

2.2. Embodied Energy

Life-cycle embodied energy (LCEE) comprises all energy consumed during the entire building’s life span, except the operating energy. In this project, LCEE is measured by the life-cycle embodied energy intensity (LCEEI), measured in MJ/m2/yr from Equation (4). The life-cycle embodied energy coefficient (LCEEC), measured in MJ/kg/yr, refers to Equation (5). These measurements allow buildings with different sizes, life spans and construction types to be compared, which will provide a more accurate assessment of how energy intensive the buildings are:
LCEEC   b u i l d i n g = LCEE   W   ×   L
where LCECC is the life-cycle embodied carbon coefficient, measured in kgCO2eq/ m2/yr. LCEE is the total life-cycle embodied carbon of the building, measured in kgCO2eq. W is the total weight of building, calculated in kg. L is the total building life span, in years:
LCEEI   b u i l d i n g = LCEE A   ×   L
where LCECI represents life-cycle embodied carbon intensity, measured in kgCO2eq/m2/yr. LCEC is the total life-cycle embodied carbon of the building, measured in kgCO2eq. A represents the total floor area of the building (conditioned and unconditioned), measured in square meters(m2). L is the total building life span, in years.

2.3. Embodied Environmental Impact

To better understand a building’s embodied environmental impact, four midpoint impact categories are included in the study: acidification potential (AP), measured in kgSO2eq; ozone depletion potential (OD), measured in CFCeq; smog formation potential (SF), measured in kgO3eq; and eutrophication potential (EP), measured in kgNeq. Each category is related to LCEC and LCEE, respectively. Carbon emissions can have acidifying effects [15], therefore the use of building materials with lower embodied carbon can reduce this acidification effect. The primary causes of ozone depletion are electricity generation and motor vehicles [16,17]. Using less-harmful materials and optimizing construction methods could help to reduce the ozone depletion potential. Smog is specific type of air pollution whose formation is caused by NOx, SOx, CO and VOC in the presence of sunlight [18,19], which can be intensified in dense urban areas. Reducing energy use, using less building material, and improving construction methods can all contribute to the reduction of smog formation. Lastly, eutrophication is excessive nutrient enrichment, that can cause undesirable shifts in aquatic ecosystem. Production of building materials, such as concrete is one cause of eutrophication [20,21].

2.4. Current Status of Research

Table 1 summaries a broad range of data from published studies, categorized in terms of the building type, carbon emission, and energy attributed to LCECI and LCEEI (the functional unit is floor area). The results show that previous studies on embodied energy of buildings varies. The different methods of analysis produce results that range from a maximum of 18,000–33,000 MJ/m2 /yr with a hybrid analysis method to a minimum of 1000–12,000 MJ/m2/yr with a process analysis method for nearly net zero residential buildings [2]. Table 1 illustrates some of the most current case studies with embodied energy and embodied carbon assessments. The sample consists of more than 100 case studies from around the world, with a time span between 1994 to 2018. The assessed embodied energy range between 20.2 MJ/m2 /yr to 660 MJ/m2/yr using different assessment methods for buildings of different construction types, and from different geographic locations. Such large variations make it difficult to compare these case studies and gain a deeper understanding of the primary impact factors driving the embodied energy value. In the same table, embodied carbon information is also provided, and compared to the embodied energy. However, there are a lack of sufficient/published embodied carbon values for buildings. Out of more than 100 case studies, only 29 included embodied carbon in their research process. Even then, only half of those studies used assumed data instead of actual project construction documents. Based on this data, the embodied carbon coefficient ranges from 1.44 to 3200 (kgCO2eq/m2/yr), which is a wider proportional variance than the embodied energy. The general ratio between LCECI and LCEEI is 0.25–3.94 kgCO2eq/MJ, represented by LCEP and Equation (6).

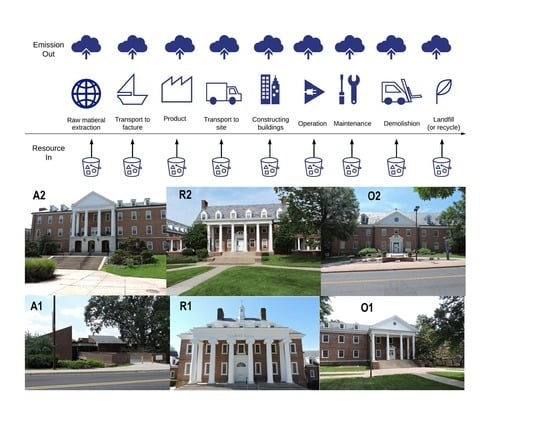
3. Method and Materials

This study is based on life-cycle assessment; a variety of approaches were used, including a cost-optimality approach that originated in industry [33,34] and an energy-savings approach [35,36]. The study is organized into the following steps: (a) collecting data from case buildings; (b) defining systems and boundaries; (c) building 3D models and creating a bill of materials; (d) conducting embodied energy and embodied carbon analysis; (e) conducting environmental analysis; (f) comparing embodied energy, embodied carbon and their correlation to environmental impact.

3.1. Life-Cycle Embodied Performance (LCEP)

This project proposes a new measure: life-cycle embodied performance (LCEP). It is the ratio between embodied carbon intensity and embodied energy-use intensity. The ratio is measured in kgCO2eq/MJ. The smaller the LCEP value, the less carbon emitted is from the equal amount embodied energy used, whereas the higher LCEP value indicate higher embodied carbon emission with same amount of energy consumption. Therefore, the lower LCEP value, the better the life-cycle embodied performance of the building.
LCEP = LCECI   LCEEI  

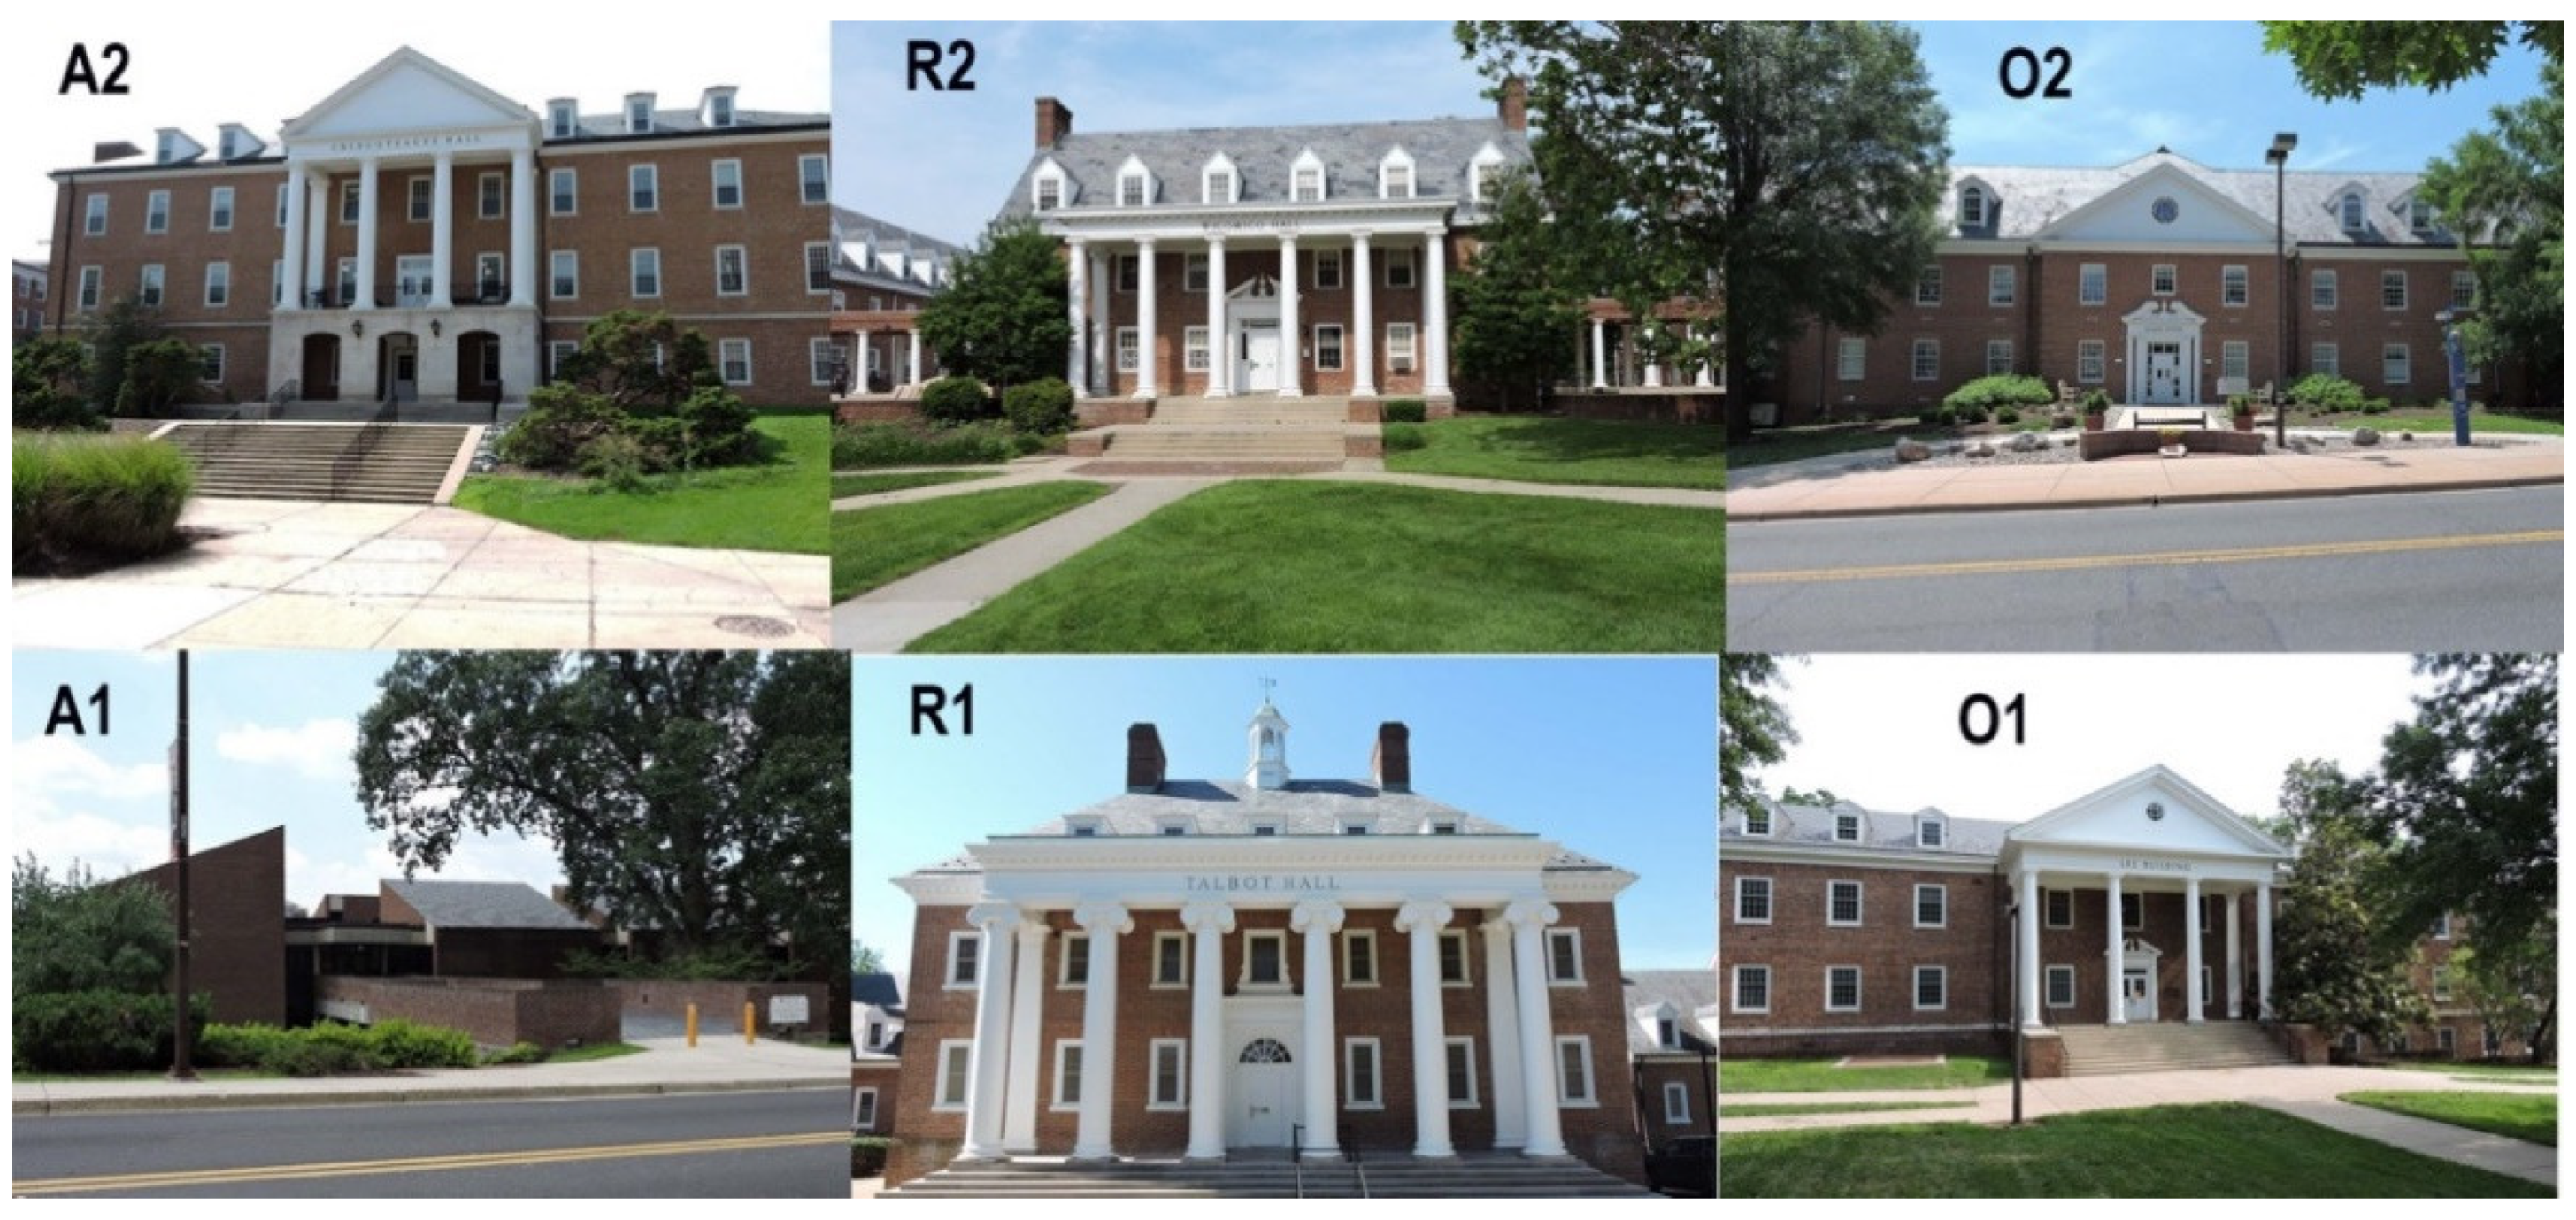
3.2. Case Project Specification

The building types include in this study are academic (educational) buildings (A1, A2), residential buildings (R1, R2) and office buildings (O1, O2). Building floor plans and 3D models are presented in Figure 2. Floor area, building height, year of construction, and year of renovation are listed in Table 2. The total floor area of buildings ranges between 982 m2 to 7015 m2. Floor heights range between 2 stories to 4 stories. The buildings are all over 45 years old, and three buildings have had major renovations since initial construction, while the other three have not.

3.3. Data Collection

Due to intellectual property concerns, the data from buildings used for this study are represented in an anonymous format, as opposed to individual projects. Data was collected on each buildings’ physical properties from the following two sources:
  • Original construction documents and renovation documents (if any), provided by facility managers.
  • Field measurements by the research team.
Life-cycle inventory (LCI) data was collected from the following three sources:
  • Existing data on material quantities and embodied carbon dioxide are extracted and gathered from literature.
  • New LCI data on new materials is obtained through leading practitioners, from major AEC companies, working with authors.
  • The open-source Inventory of Carbon and Energy database from the University of Bath was published in 2008. (It is currently the most frequently used embodied carbon database in this industry, due to its comprehensive summary of the best available embodied carbon data [37]).

3.4. System, Boundaries, Building Models and Software

For the purposes of this inquiry, only primary systems are included in the analysis for each building. The primary system includes the structure system, foundation, building roof, building façade, and building interior partition/ceiling. The prescribed building life span for this assessment is 50 years. The energy mix for initial construction, repair, replacement and maintenance is assumed to remain the same over the entire building life span. Autodesk’s Revit is used to construct 3D models based on construction documents and other collected data. Information on the building’s materials and components is manually inputted in the 3D models. Next, a bill of materials (BOM) is created for each studied case building. Then BOMs are exported into an Excel-format file; the Excel files are cleaned, organized and simplified in order to edit out the non-essential information. Finally, a clean spreadsheet is imported to a software called Athena IE4B for life-cycle analysis. The essential building components included in the analysis are shown in Table 3.
LCEE and LCEI are calculated from input information in Athena. Four environmental impact categories are assessed as well. LCEEI, LCEEC, LCECI, LCECC, LCEP are calculated using Equations (2)–(6), for each of the studied buildings (shown in Table 4).

3.5. Statistical Analyses

Four single variable regression models are used to determine the dependency between the environment impact categories (AP, OD, SF, EP) and LCEP. A 95% confidence interval for each outcome measure and a Pearson’s value of 0.05 were used determine statistical significance:
Yi= β0 + β1Xi + ϵI
where Yi is the life-cycle embodied performance (LCEP), Xi is the environmental impact category, β0 is the intercept, and ϵI is standard deviation. Table 4 and Table 5 represent the variables included in the four models.

4. Analysis Findings

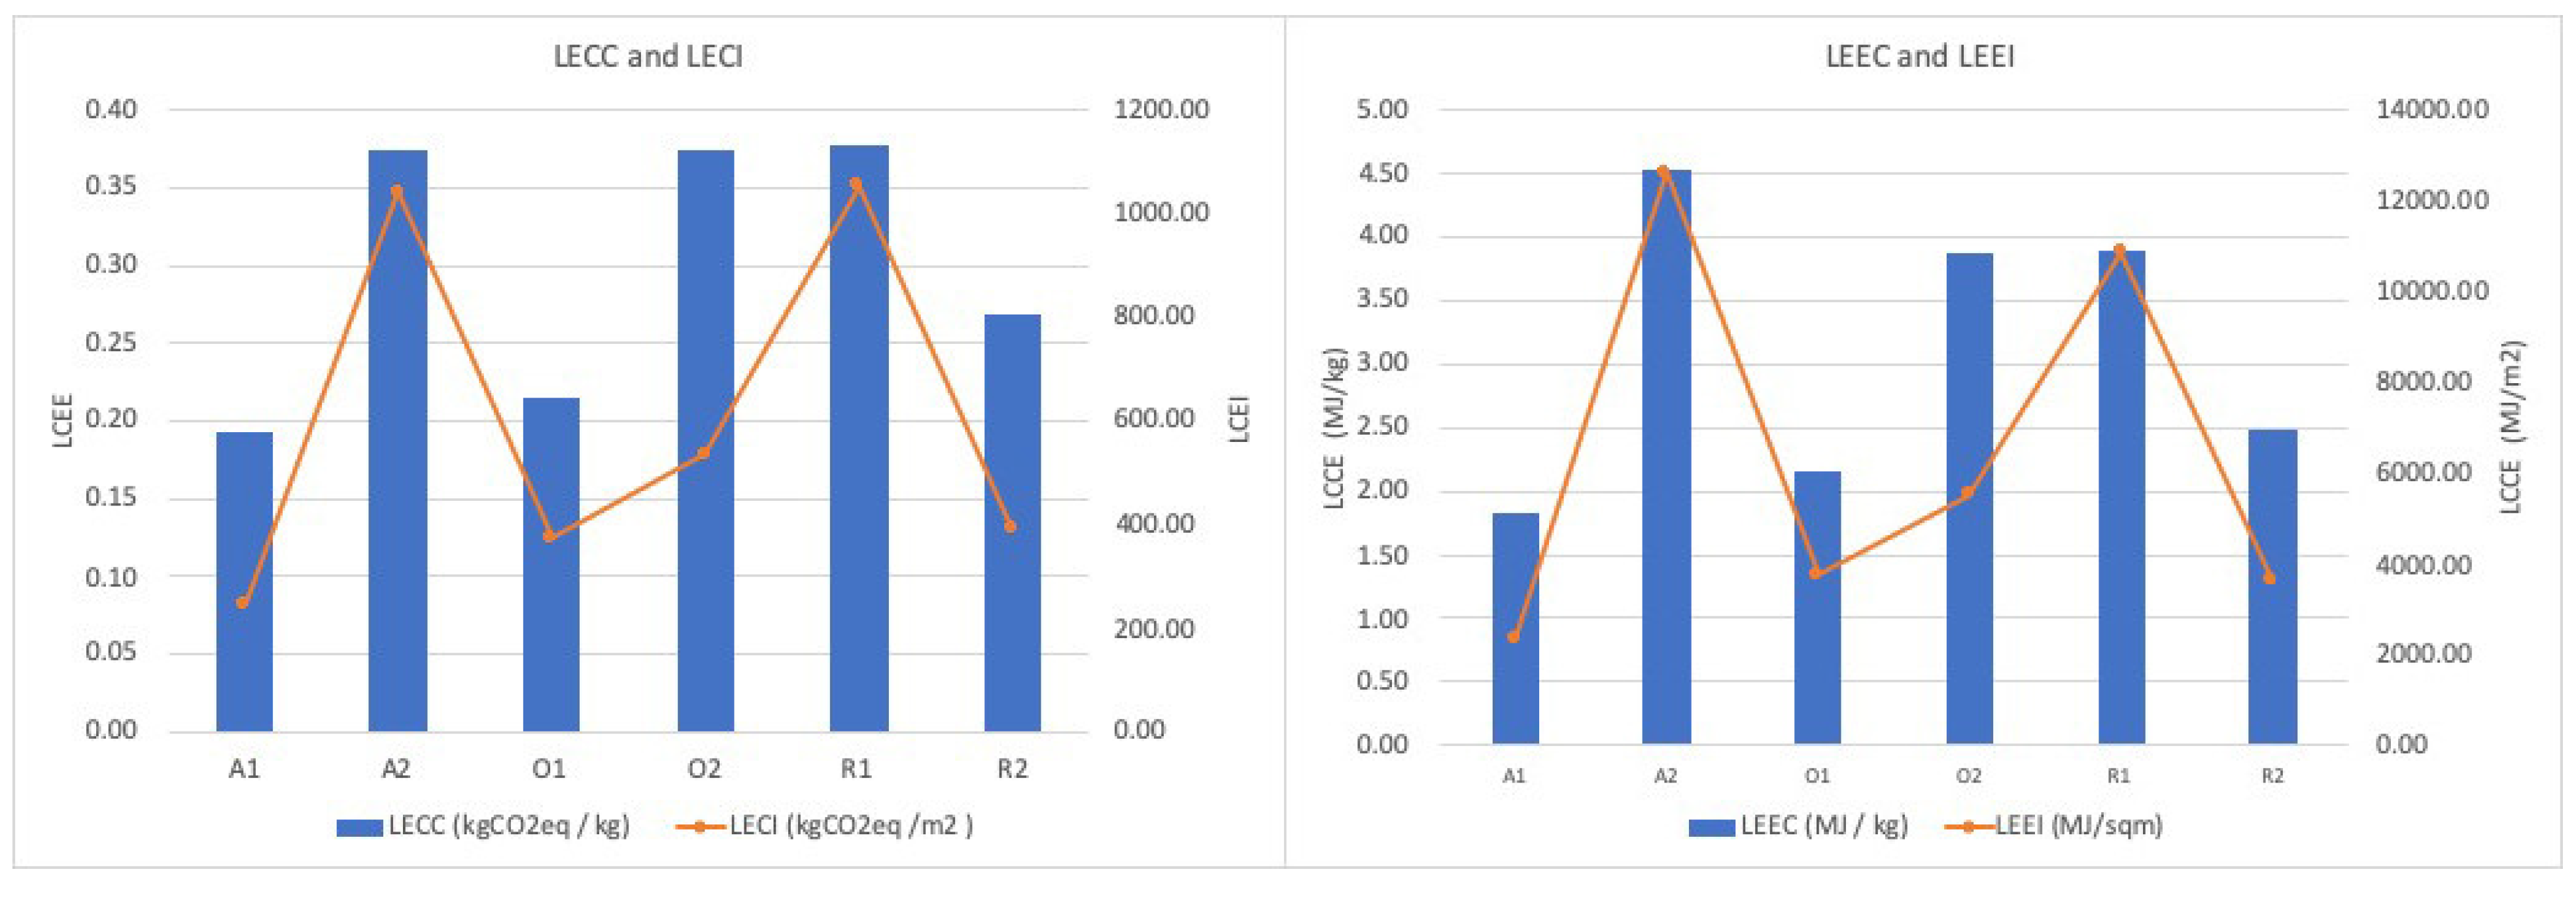
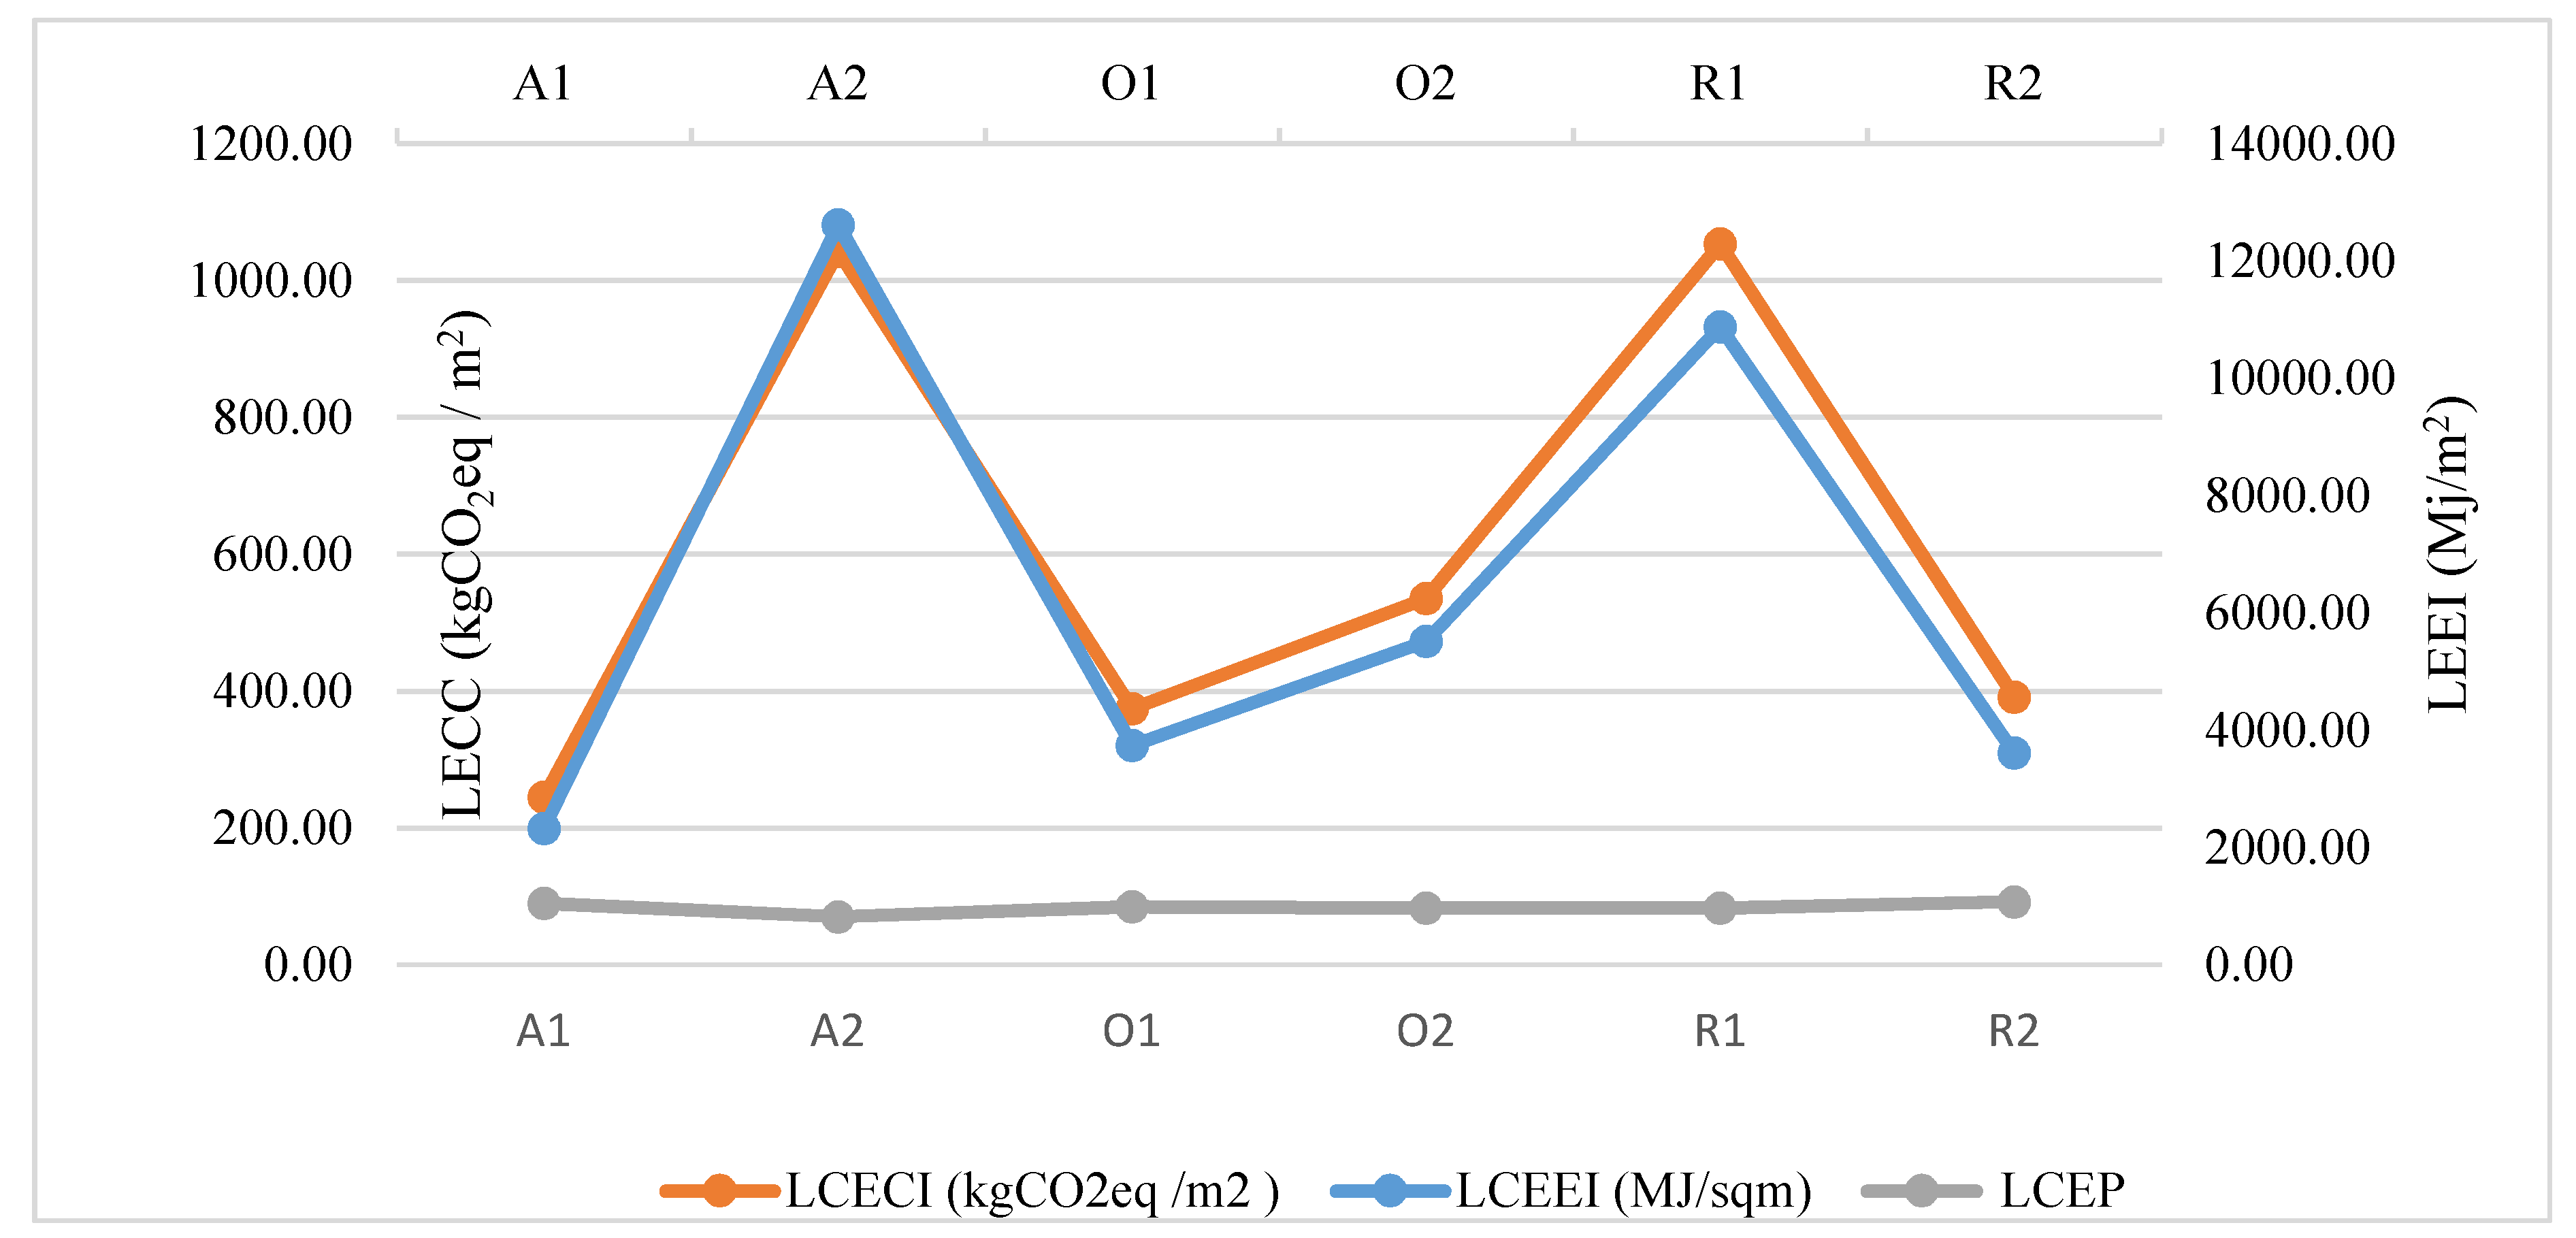
4.1. Correlation between Embodied Energy and Embodied Carbon

Two findings illustrated in Figure 3. First, the measured intensity has different results compared to the coefficient. For example, building O2 and R1 have similar coefficient (LCECC and LCEEC) value, although R1 has > 97% higher intensity (LCECI and LCEEI) value than those of O2. Also, O1 and O2 have comparable intensities, whereas, the coefficient of O2 is twice that of O1. Secondly, findings reveal that the buildings’ function (type), size and height do not have a direct influence on life-cycle-embodied carbon and life cycle embodied energy. For instance, building O2 area is almost 6 times over the R1, however, those two buildings have similar embodied energy coefficient. A2 and R2 have similar building area, but very different embodied energy coefficients.
Table 4 summarizes values for the six case buildings for life-cycle embodied energy coefficient (LCEEC), life-cycle embodied carbon coefficient (LCECC), life-cycle embodied carbon intensity (LCECI), life-cycle embodied energy intensity (LCEEI), and life-cycle embodied performance (LCEP).
Table 4 and Figure 4 demonstrate that the ratio between energy and carbon is a better measurement for building performance compared to coefficient or intensity alone. When we look at the embodied energy and embodied carbon independently from each other, A2 has highest LCEEI, 12,614.20 kgCO2eq/kg (illustrated in blue), and the second highest LCECC, 0.37 MJ/m2 (illustrated in orange). Based on these scores, A2 can be rated with the lowest performance, which opposes the results when using the ratio between embodied energy and embodied carbon. As explained previously, a lower LCEP value implies a better embodied performance on the part of the building. Among the six buildings studied, A2 has the lowest LCEP score, 0.083, which means A2 emits the least amount of carbon while consuming the same amount of energy. Therefore, using the proposed model, building A2 has the best life-cycle embodied performance within the sample size.

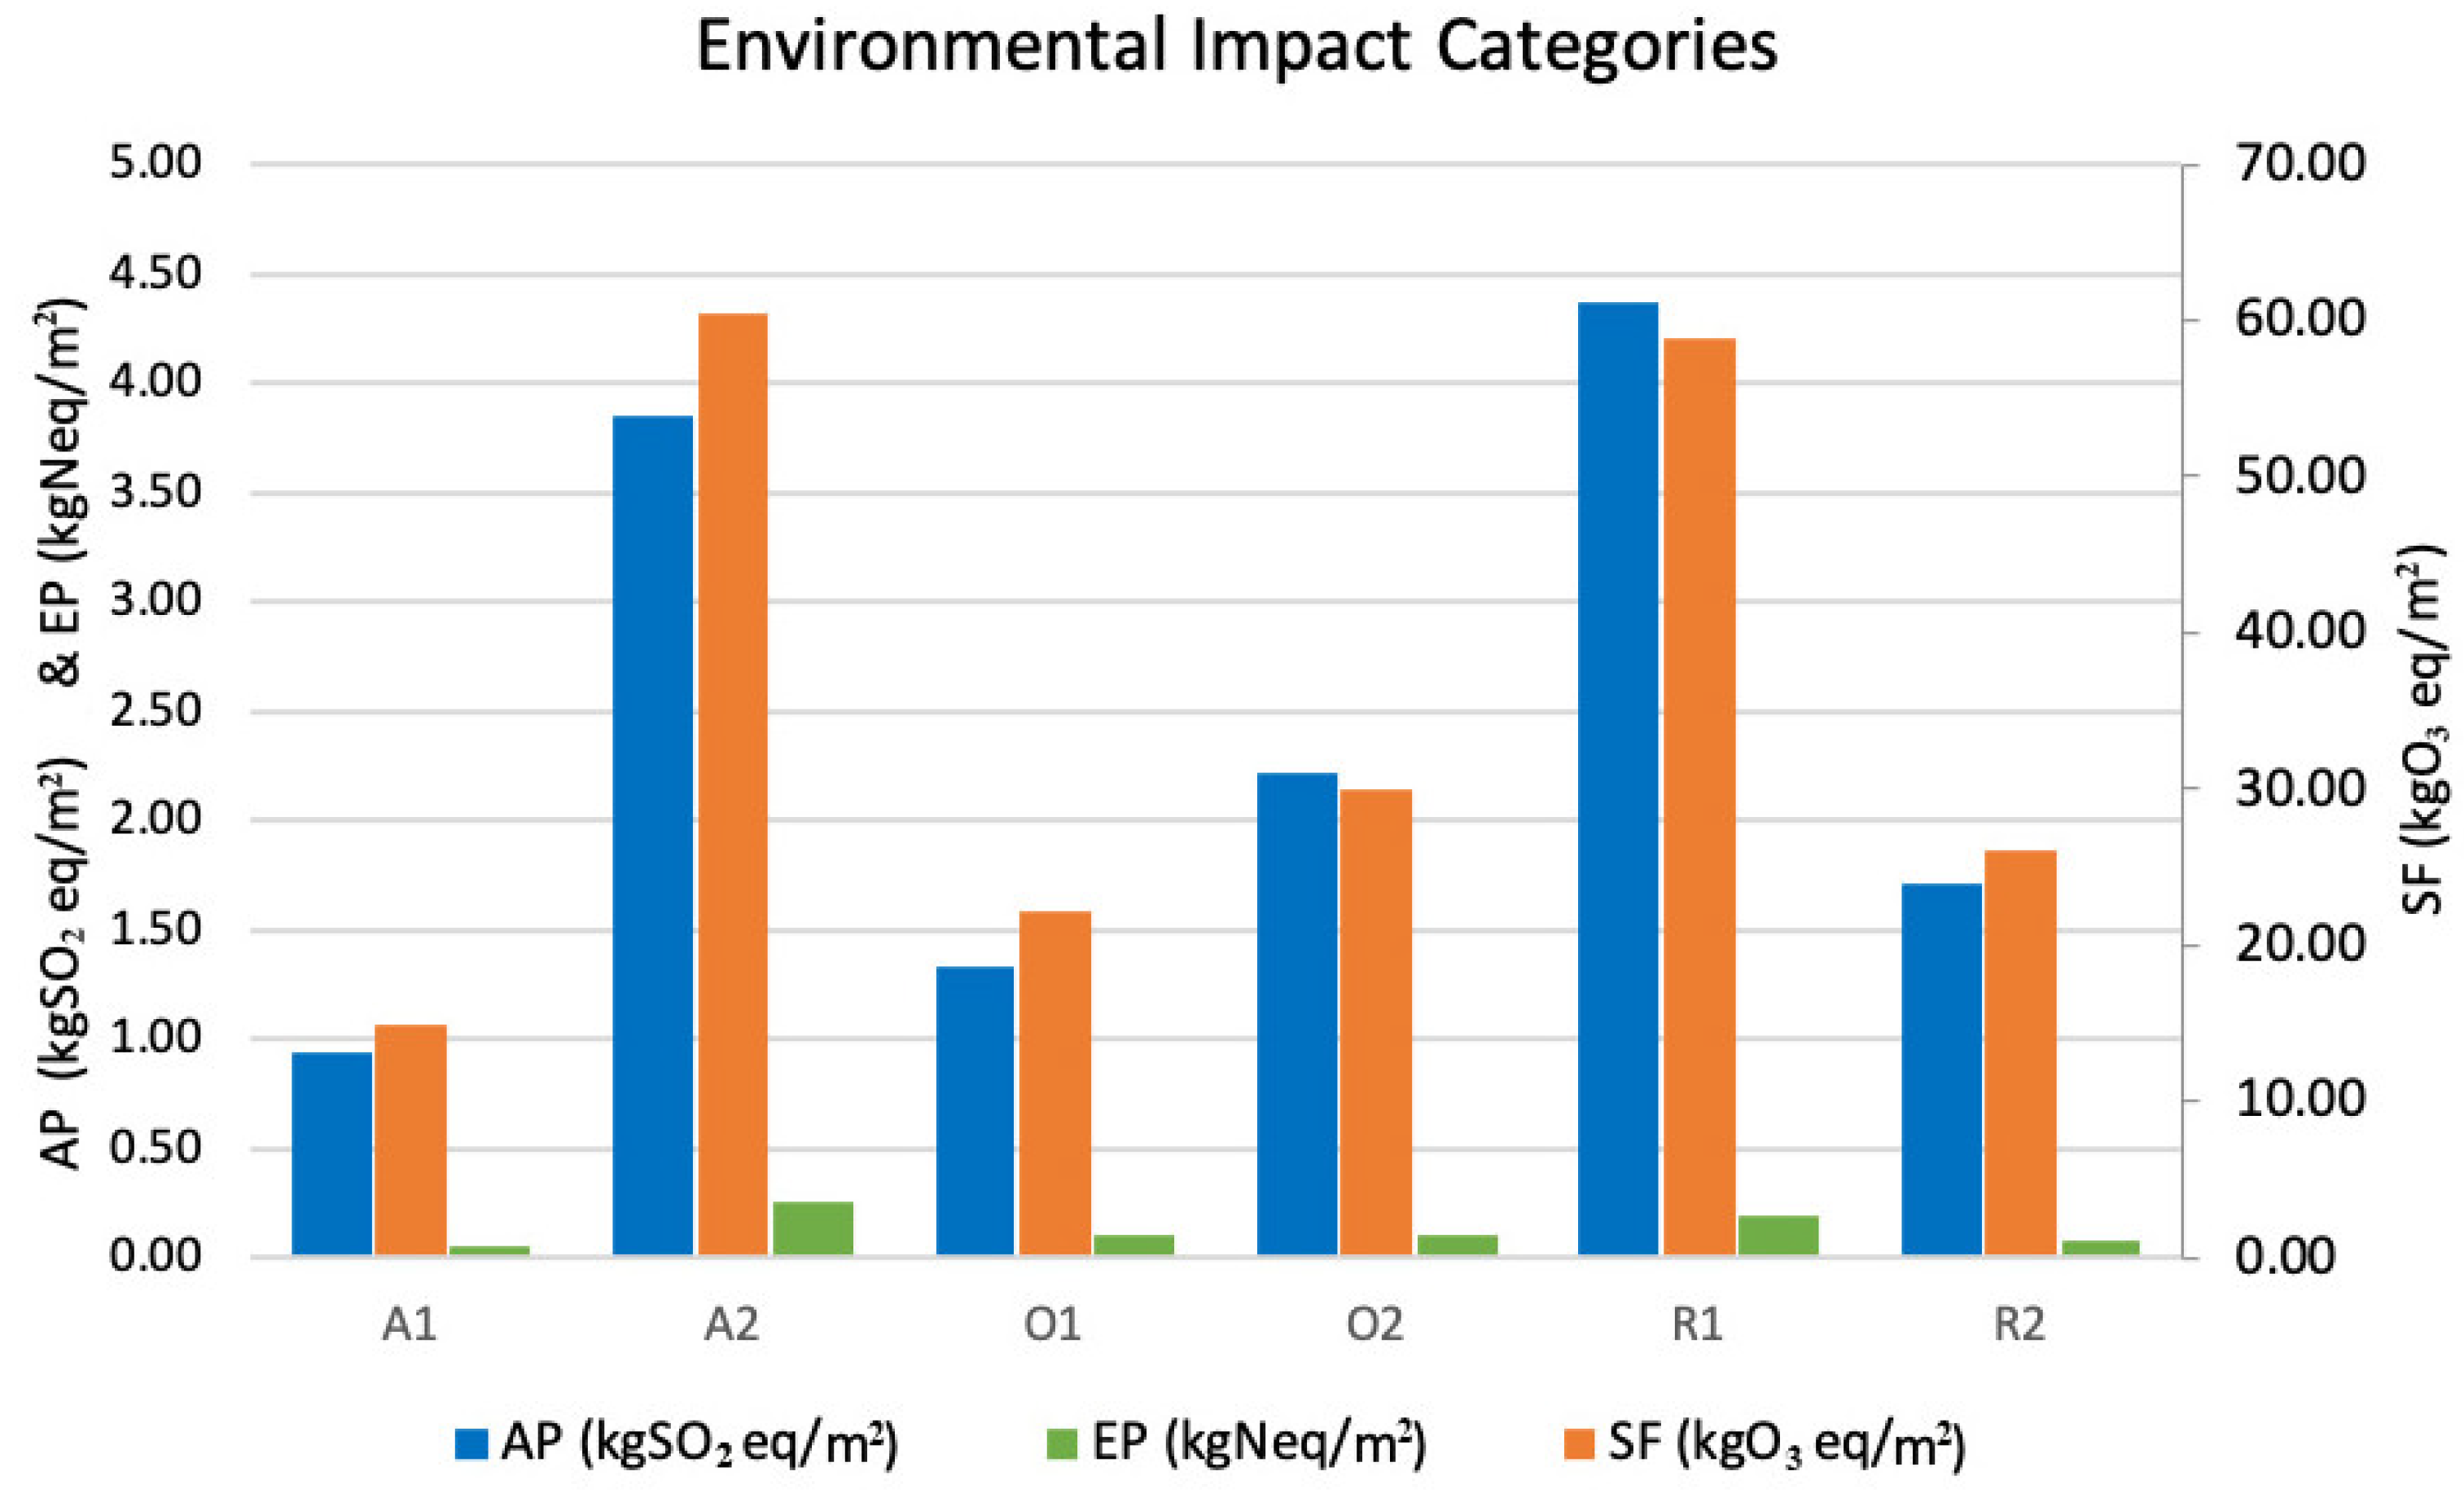
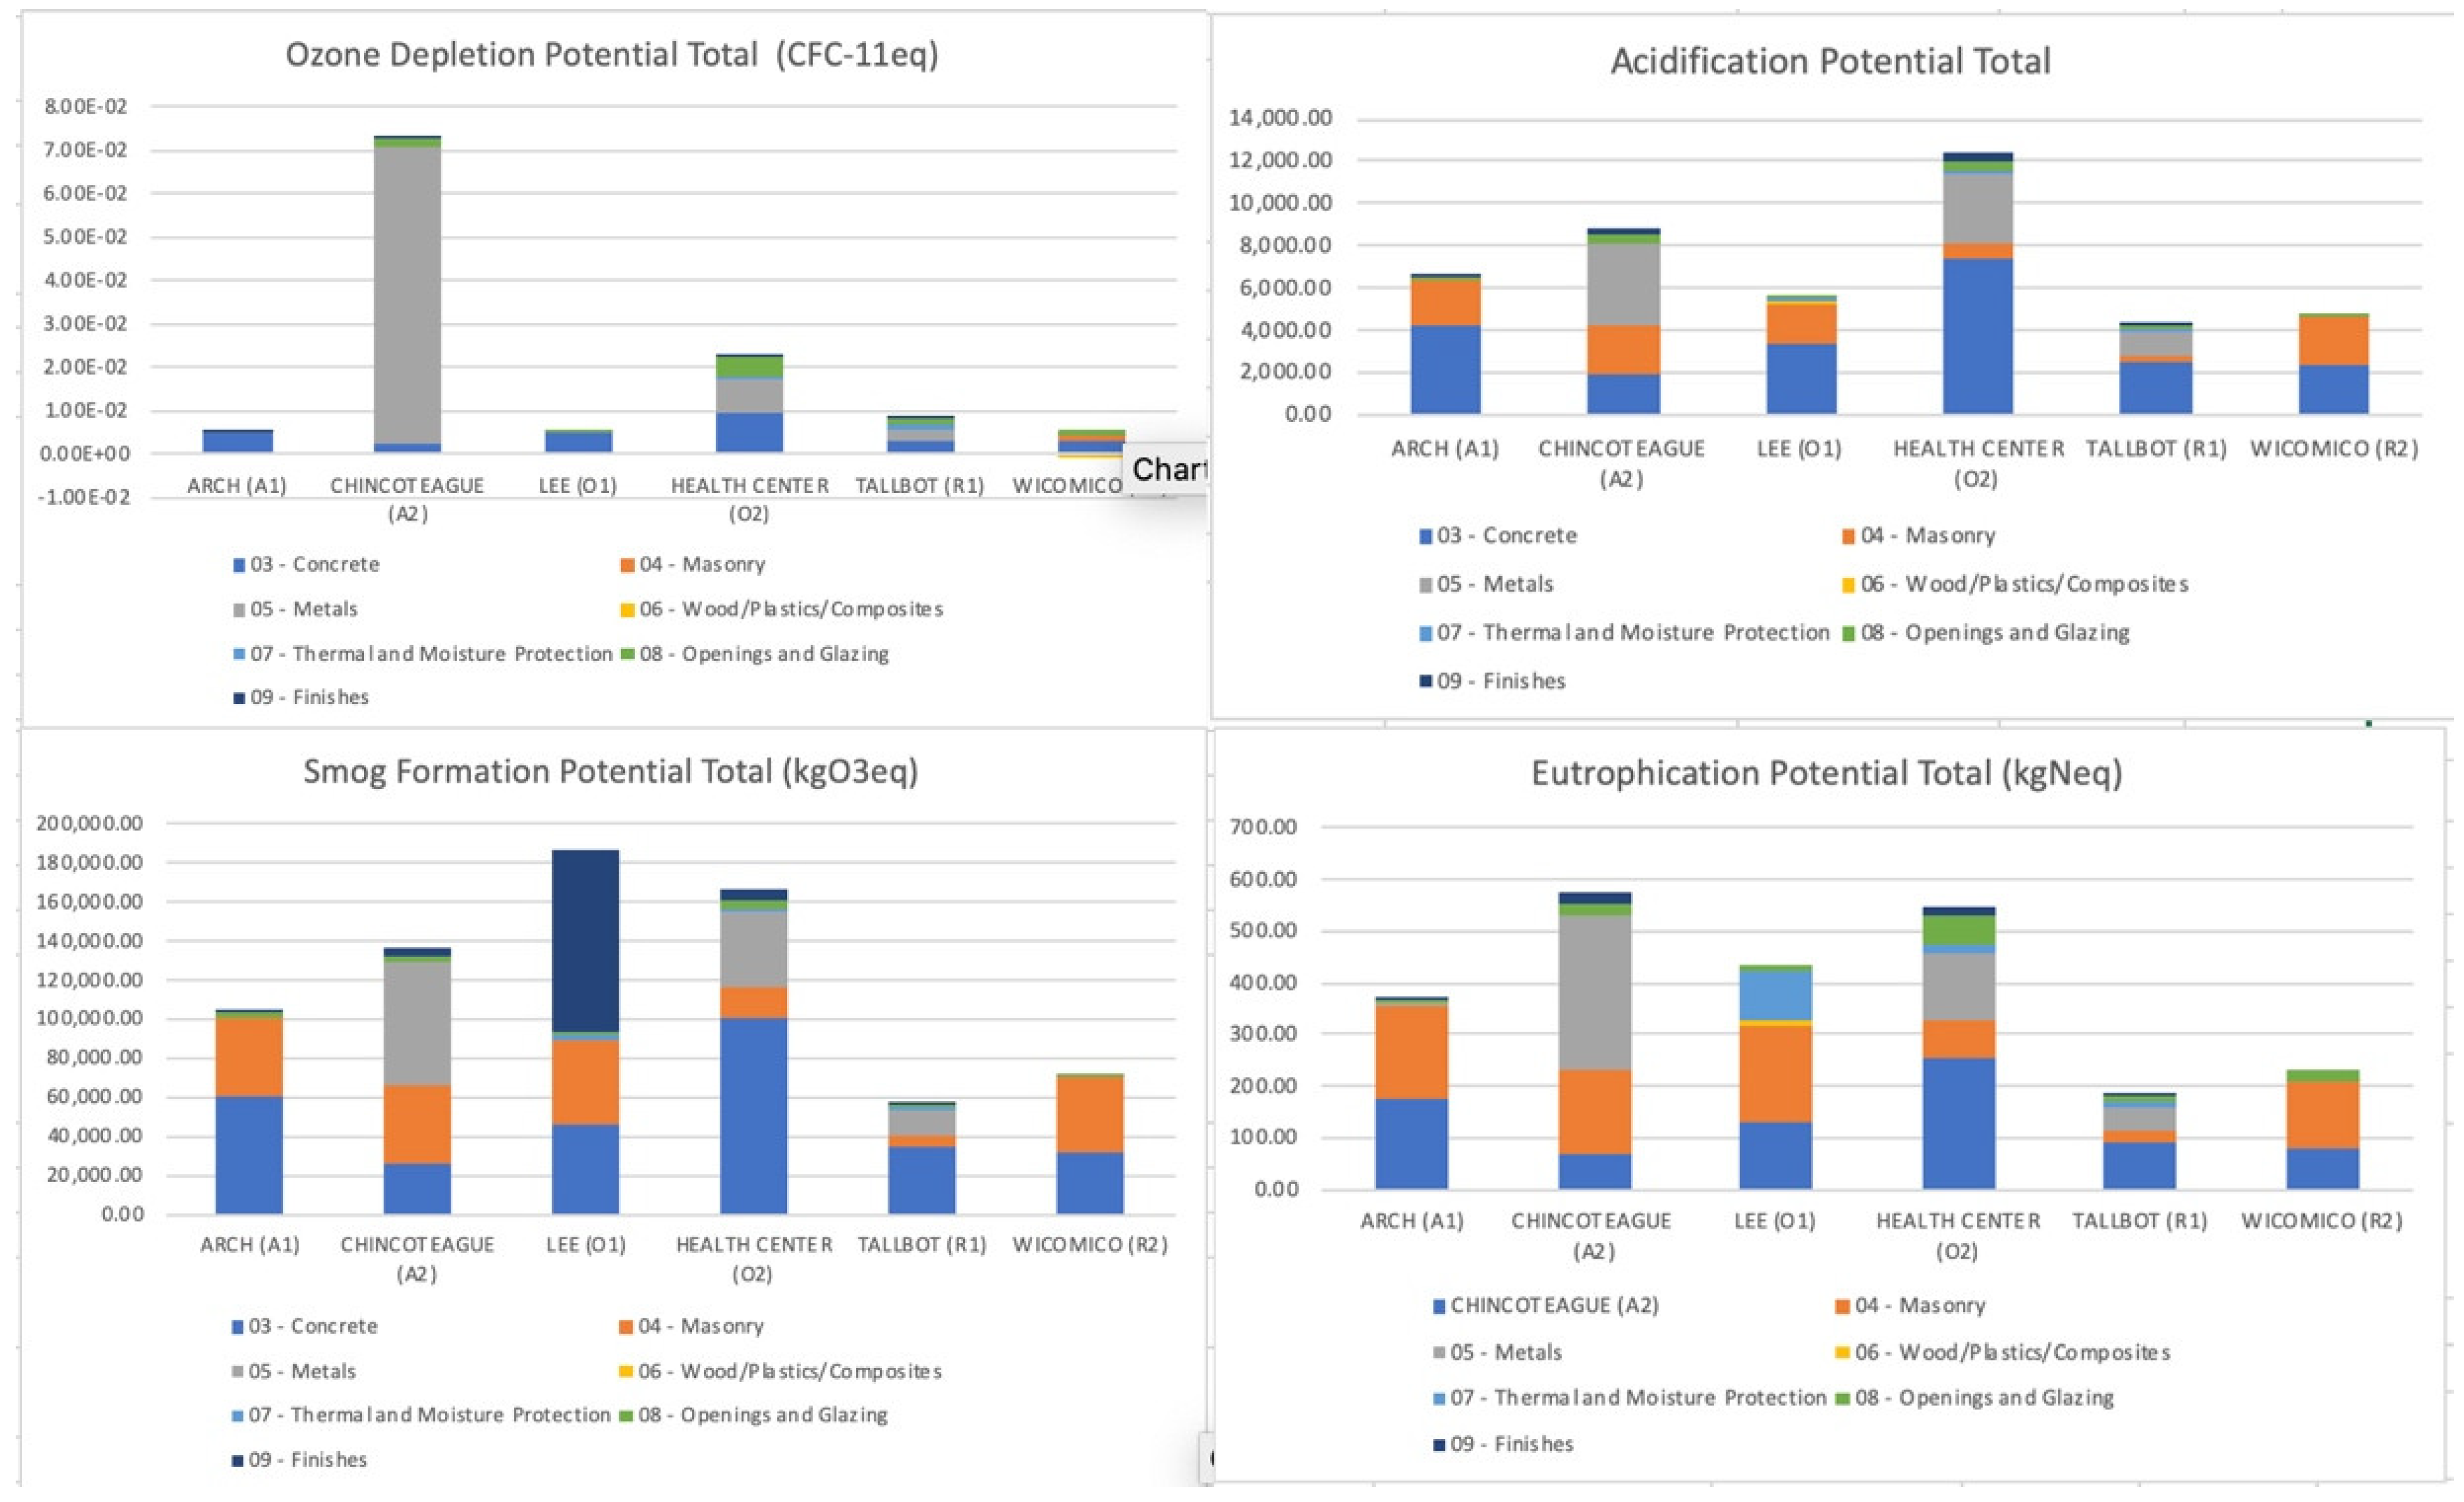
4.2. Correlation between Environmental Impact and LCEP

The results in Section 4.2 are derived from the four single- regression models (Equation (7)) using input from Equation (2)–(6). There are large variations in all four environmental categories; AP intensities range between 0.94 to 4.37 kgSO2eq/m2, EP Intensities range between 0.05 to 0.26 kgNeq/m2, SP intensities range between 14.85 to 58.87 kgO3eq/ m2/yr, and OD intensities range between 7.51 × 10⁻⁷ to 3.27 × 10⁻⁵ CFC-11eq/ m2/yr.
It is difficult to compare buildings’ embodied performance based on the total environmental impact through their entire life, so impact intensity (measured in floor area per year) was used. Figure 5 demonstrates the clear correlation between AP intensity and SF intensity: high AP couples with high SF, which indicates acidification potential as a causal factor for smog formation potential. Figure 5 also demonstrates that higher AP and SF do not always result in a higher EP. For example, office building 2 (O2) has higher AP and SF compared to office building 1 (O1), but lower EP than that of O1. This result indicates that causal factors differ between embodied EP, and AP and SF.
Ozone depletion (OD) potential intensity was looked separately from the other three categories due to its different unit of measurement. Figure 6 shows that building A2 has a substantially higher impact intensity than the other buildings. To investigate this further, we looked into the buildings’ materials and components, which contribute to high OD ratings.
Figure 7 shows that metals (steel and alumina) contribute the most to the ozone depletion potential across all of the buildings. A2 building has a higher metal use compared to other buildings; it uses metals primarily in the building roof, and a portion of the exterior wall is made of alumina panel. However, if we look closely at A2 building materials use (refer to Figure 8), calculated by weight (kg), metal only acounts for 19% of the total material use, but masonry counts for 56% and constitutes a much smaller percentage of the overall ozone depletion potential. Previous research has proven that the most significant factors responsible for ozone depletion are industrial production and disposal of halogenated hydrocarbons [38]. In A2, metal manufacturing and production processes are the hotspots that contribute to a high impact on ozone depletion.
The general finding from this study is demonstrate in Table 5, which shows the results from four linear regression models. Among the four environment categories, it shows statistical significance in Ozone Depletion potential, with a p-value of 0.006 (less than 0.05). The R-squared value of OD is 0.877, which means 87.7% LCEP value in the data set could be predicted or interpreted by the value of OD value. This result means Ozone Depletion potential could be used as an indicator to predict the value of LCEP, or, the building life cycle embodied performance is correlated with OD.

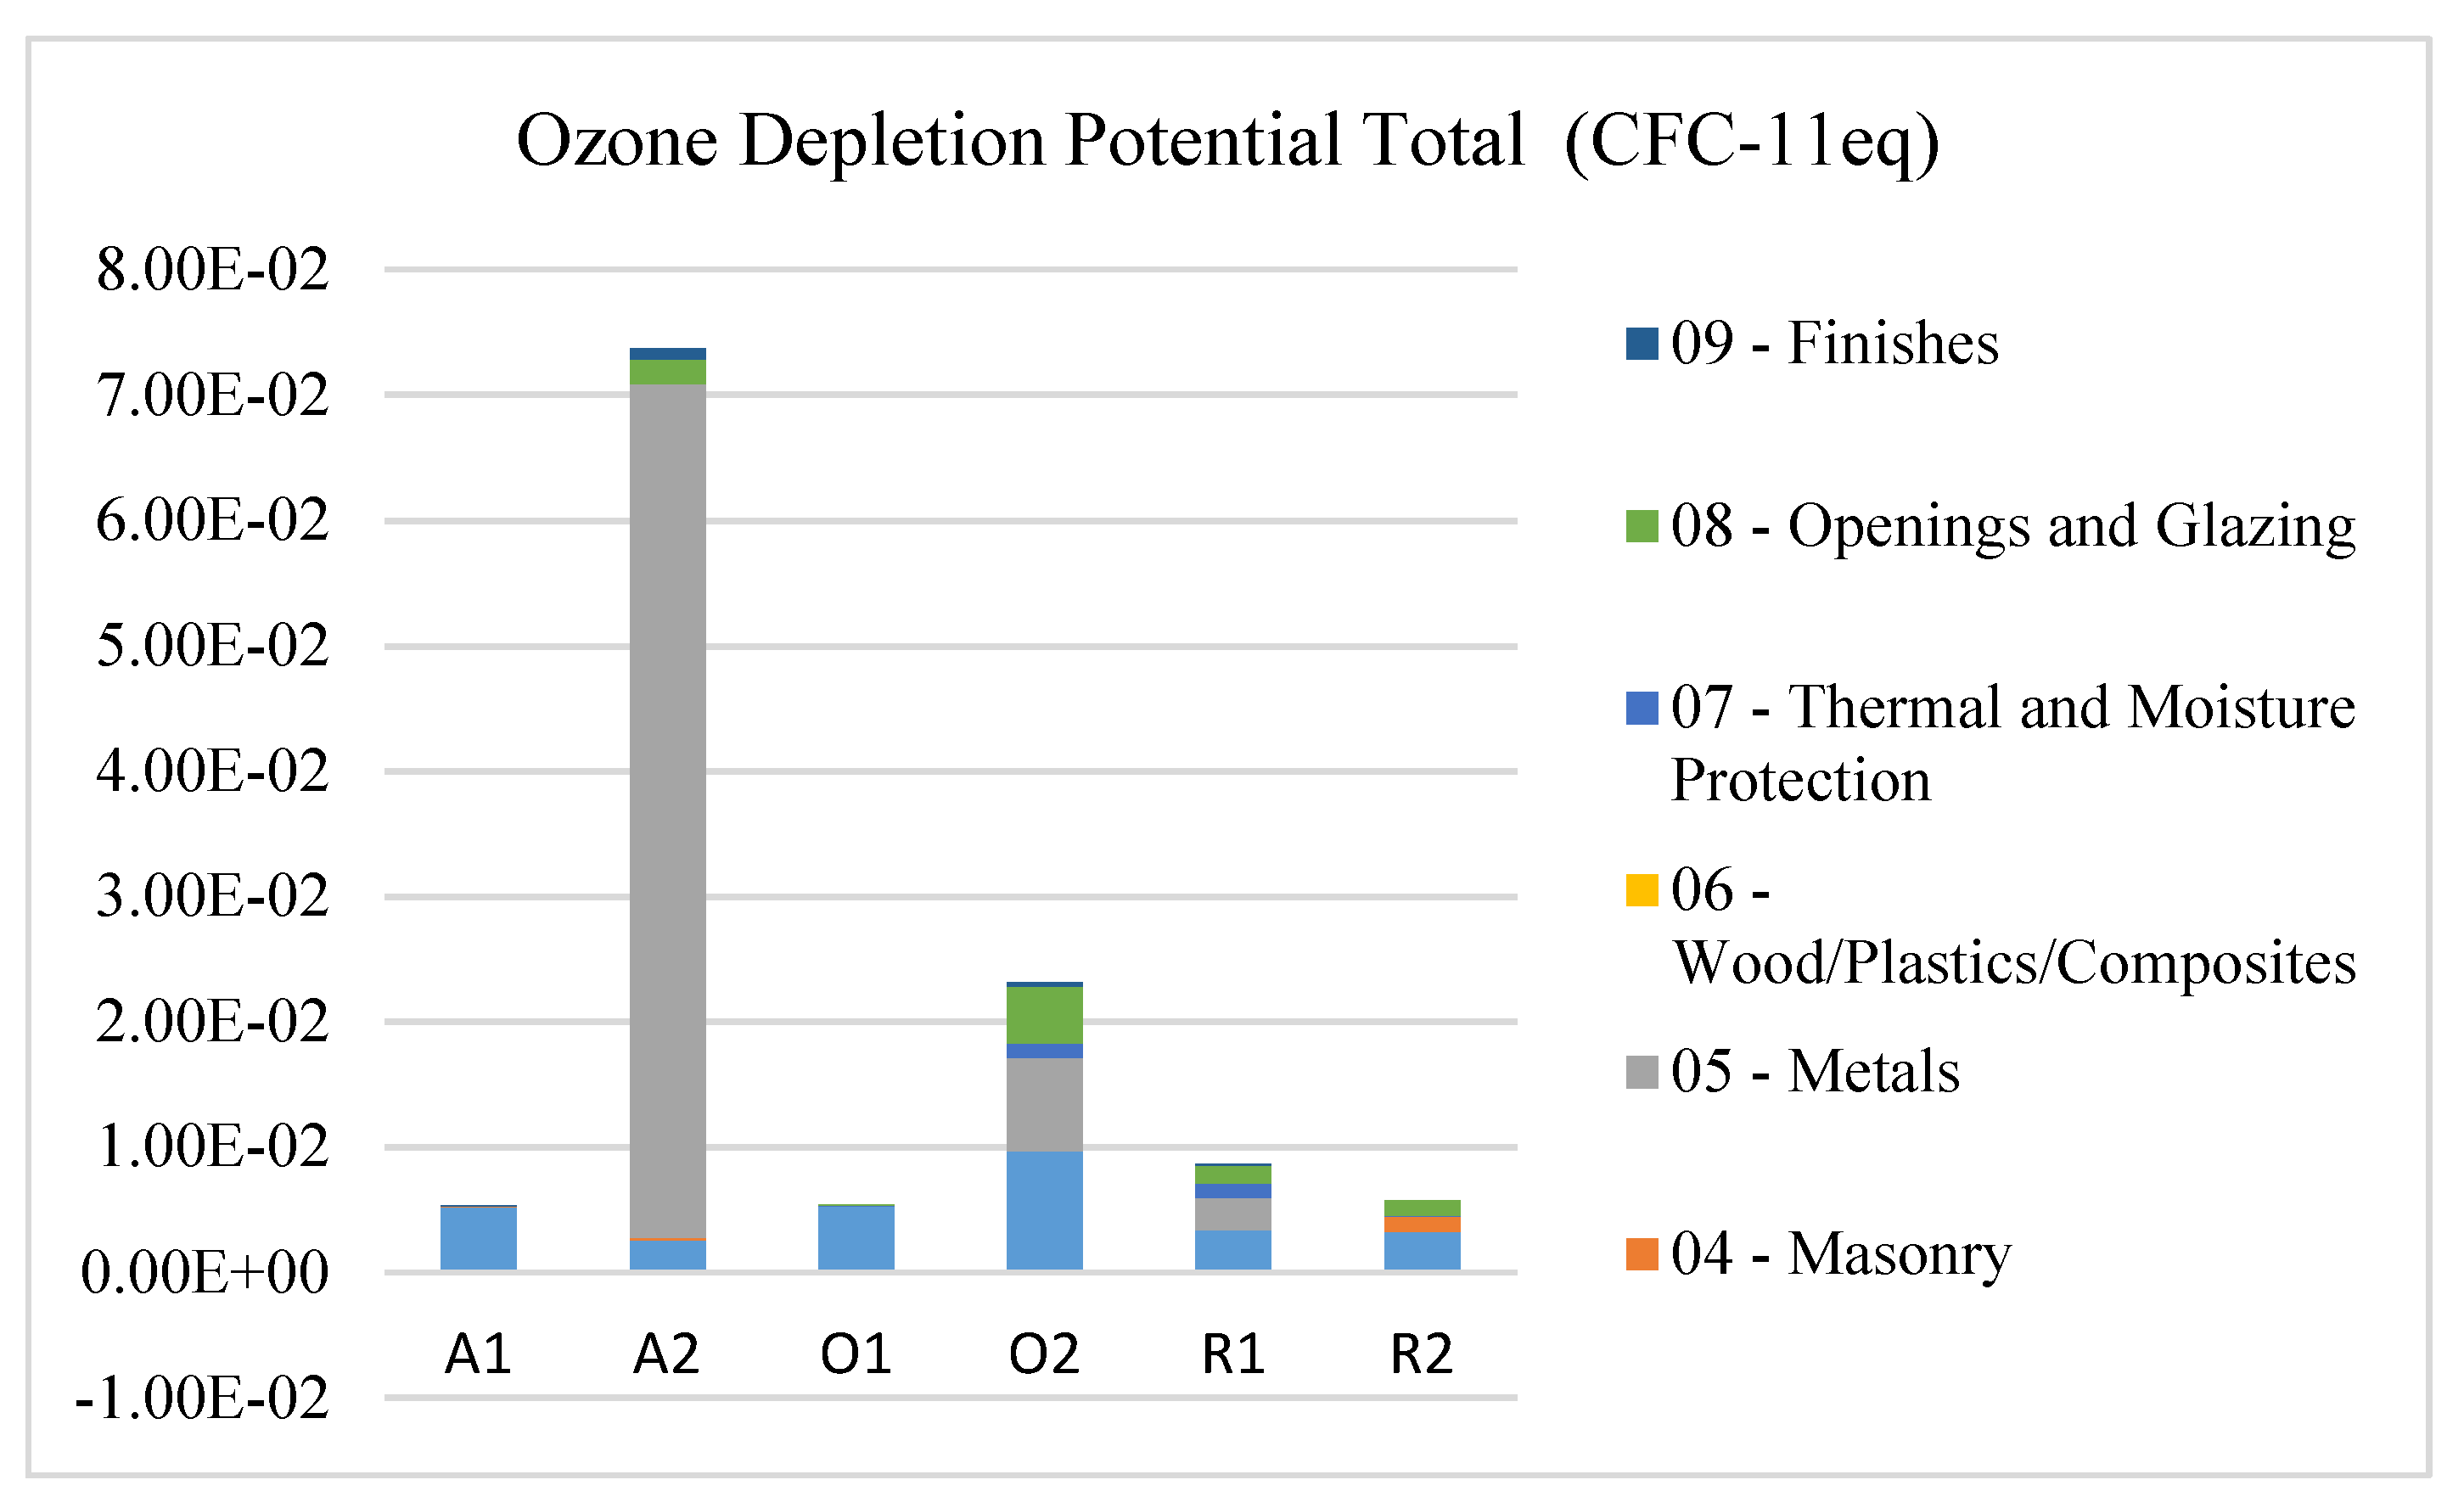
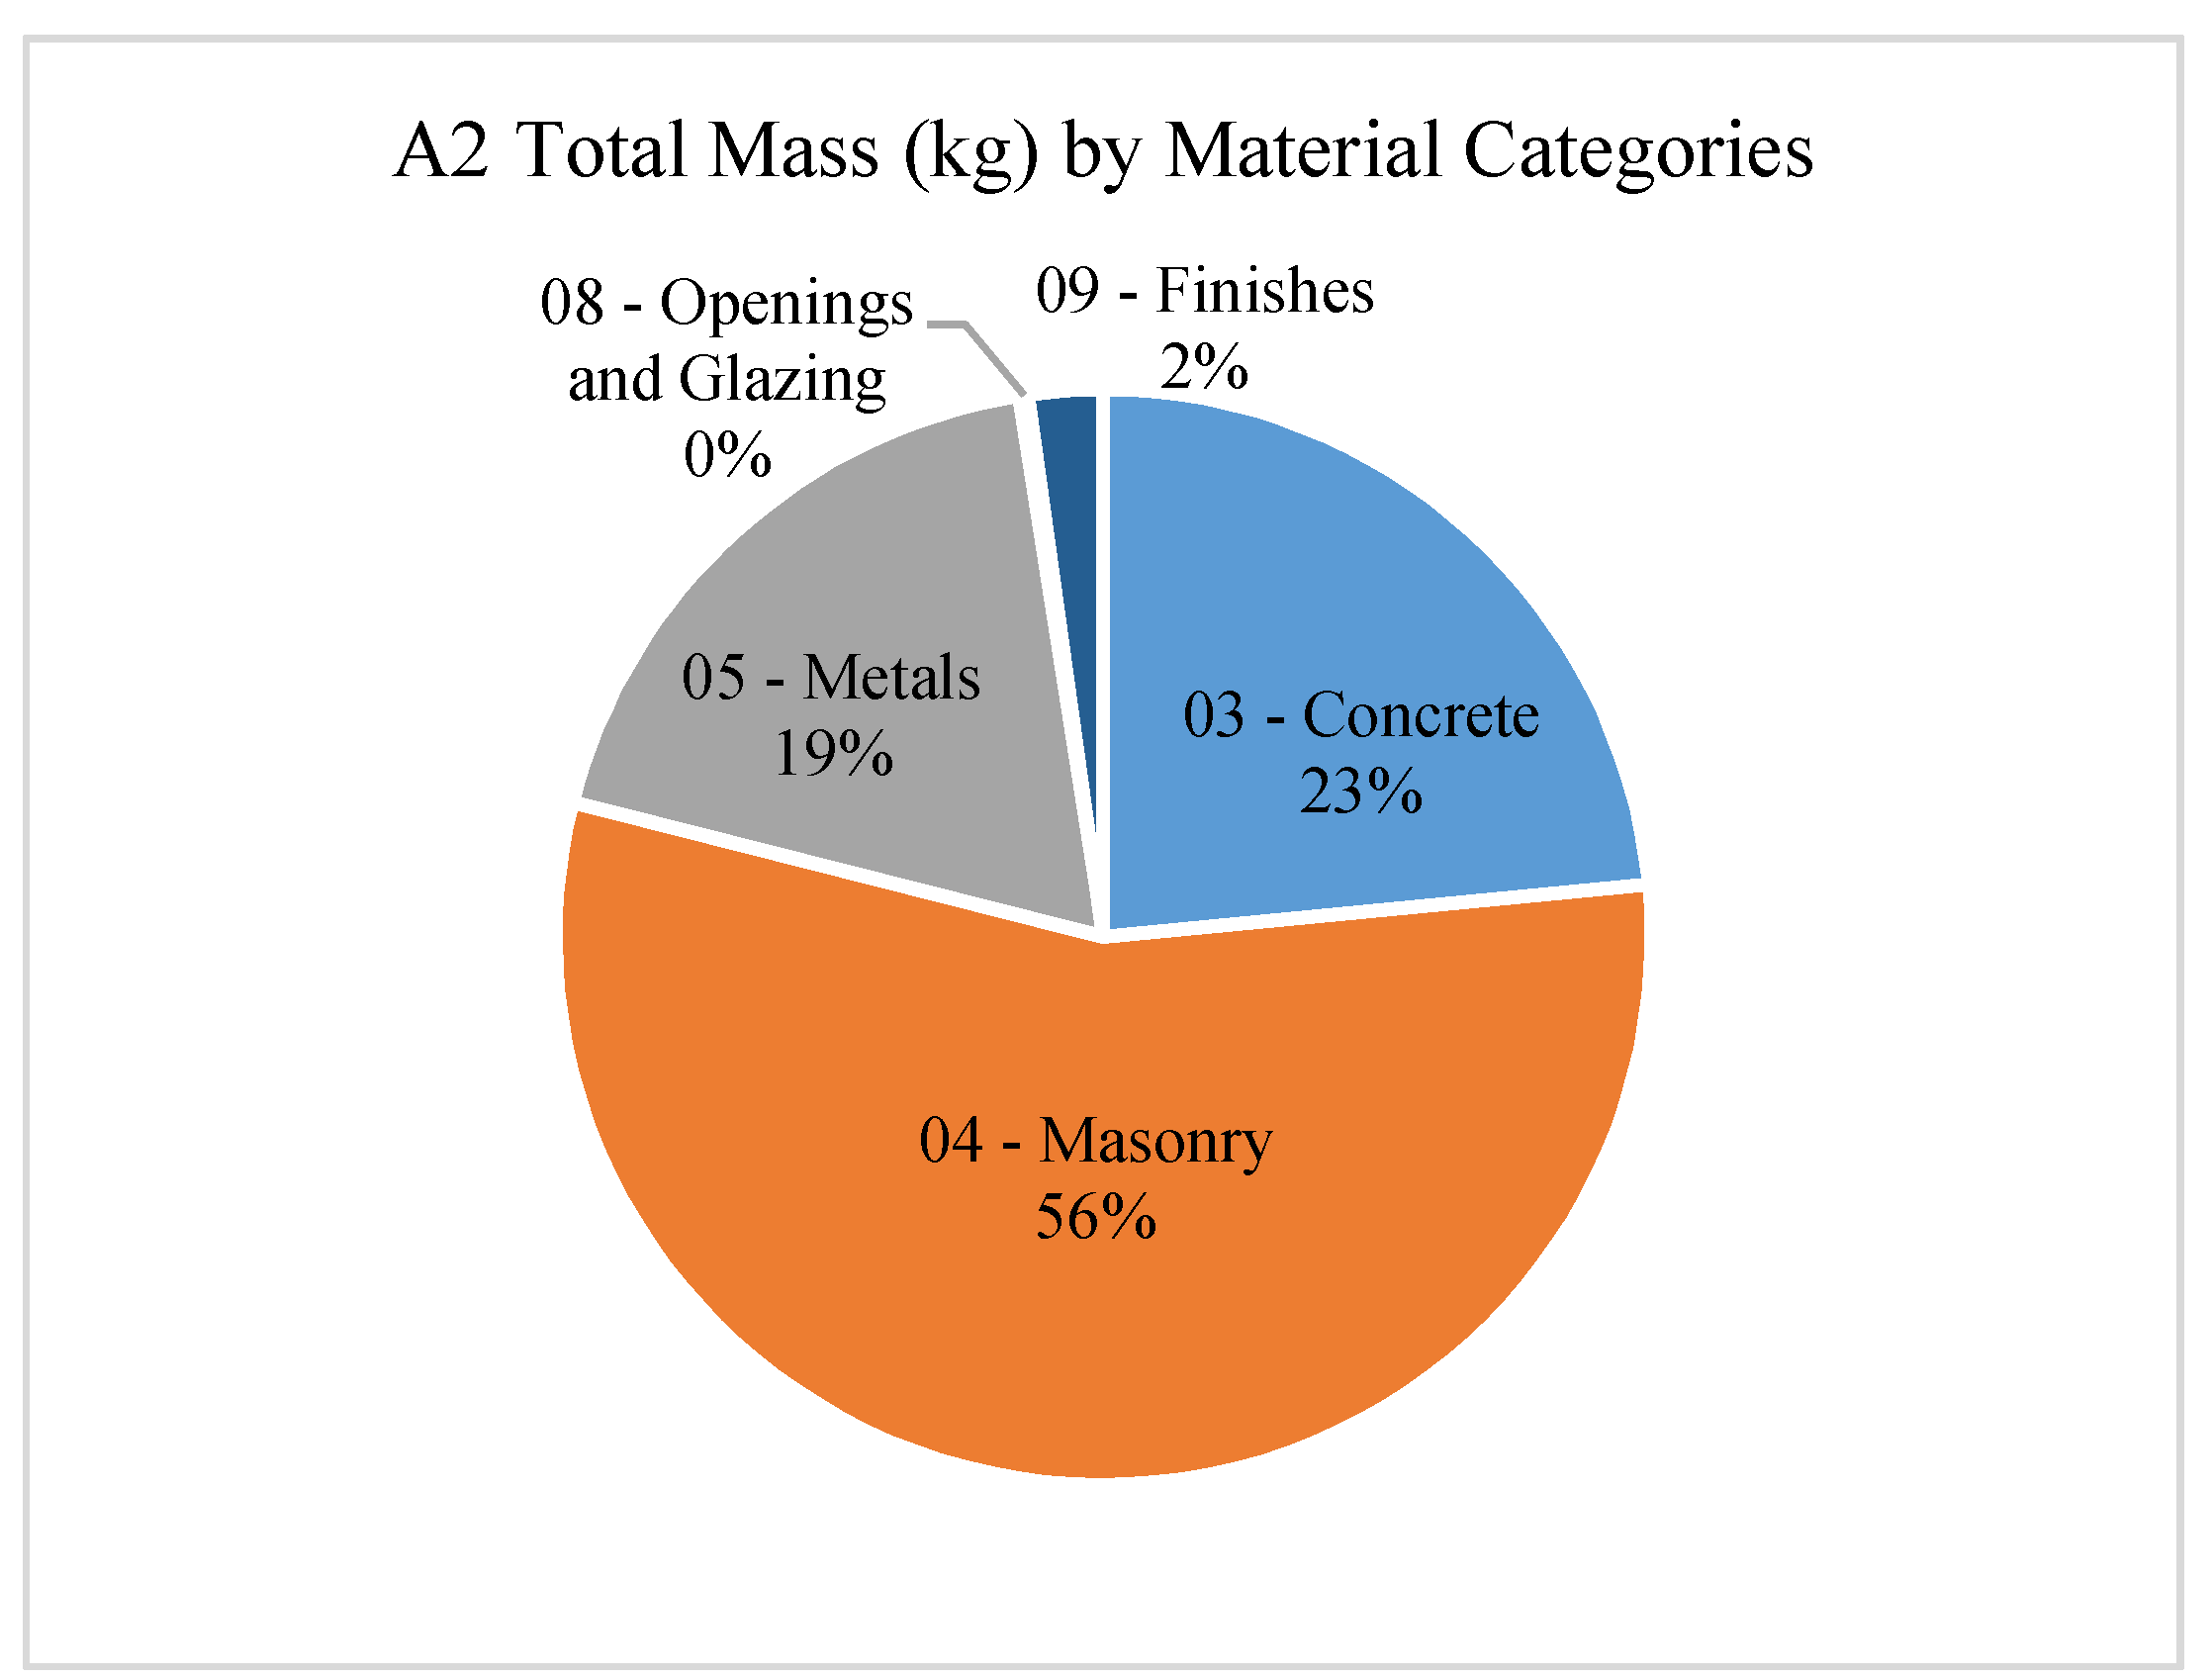
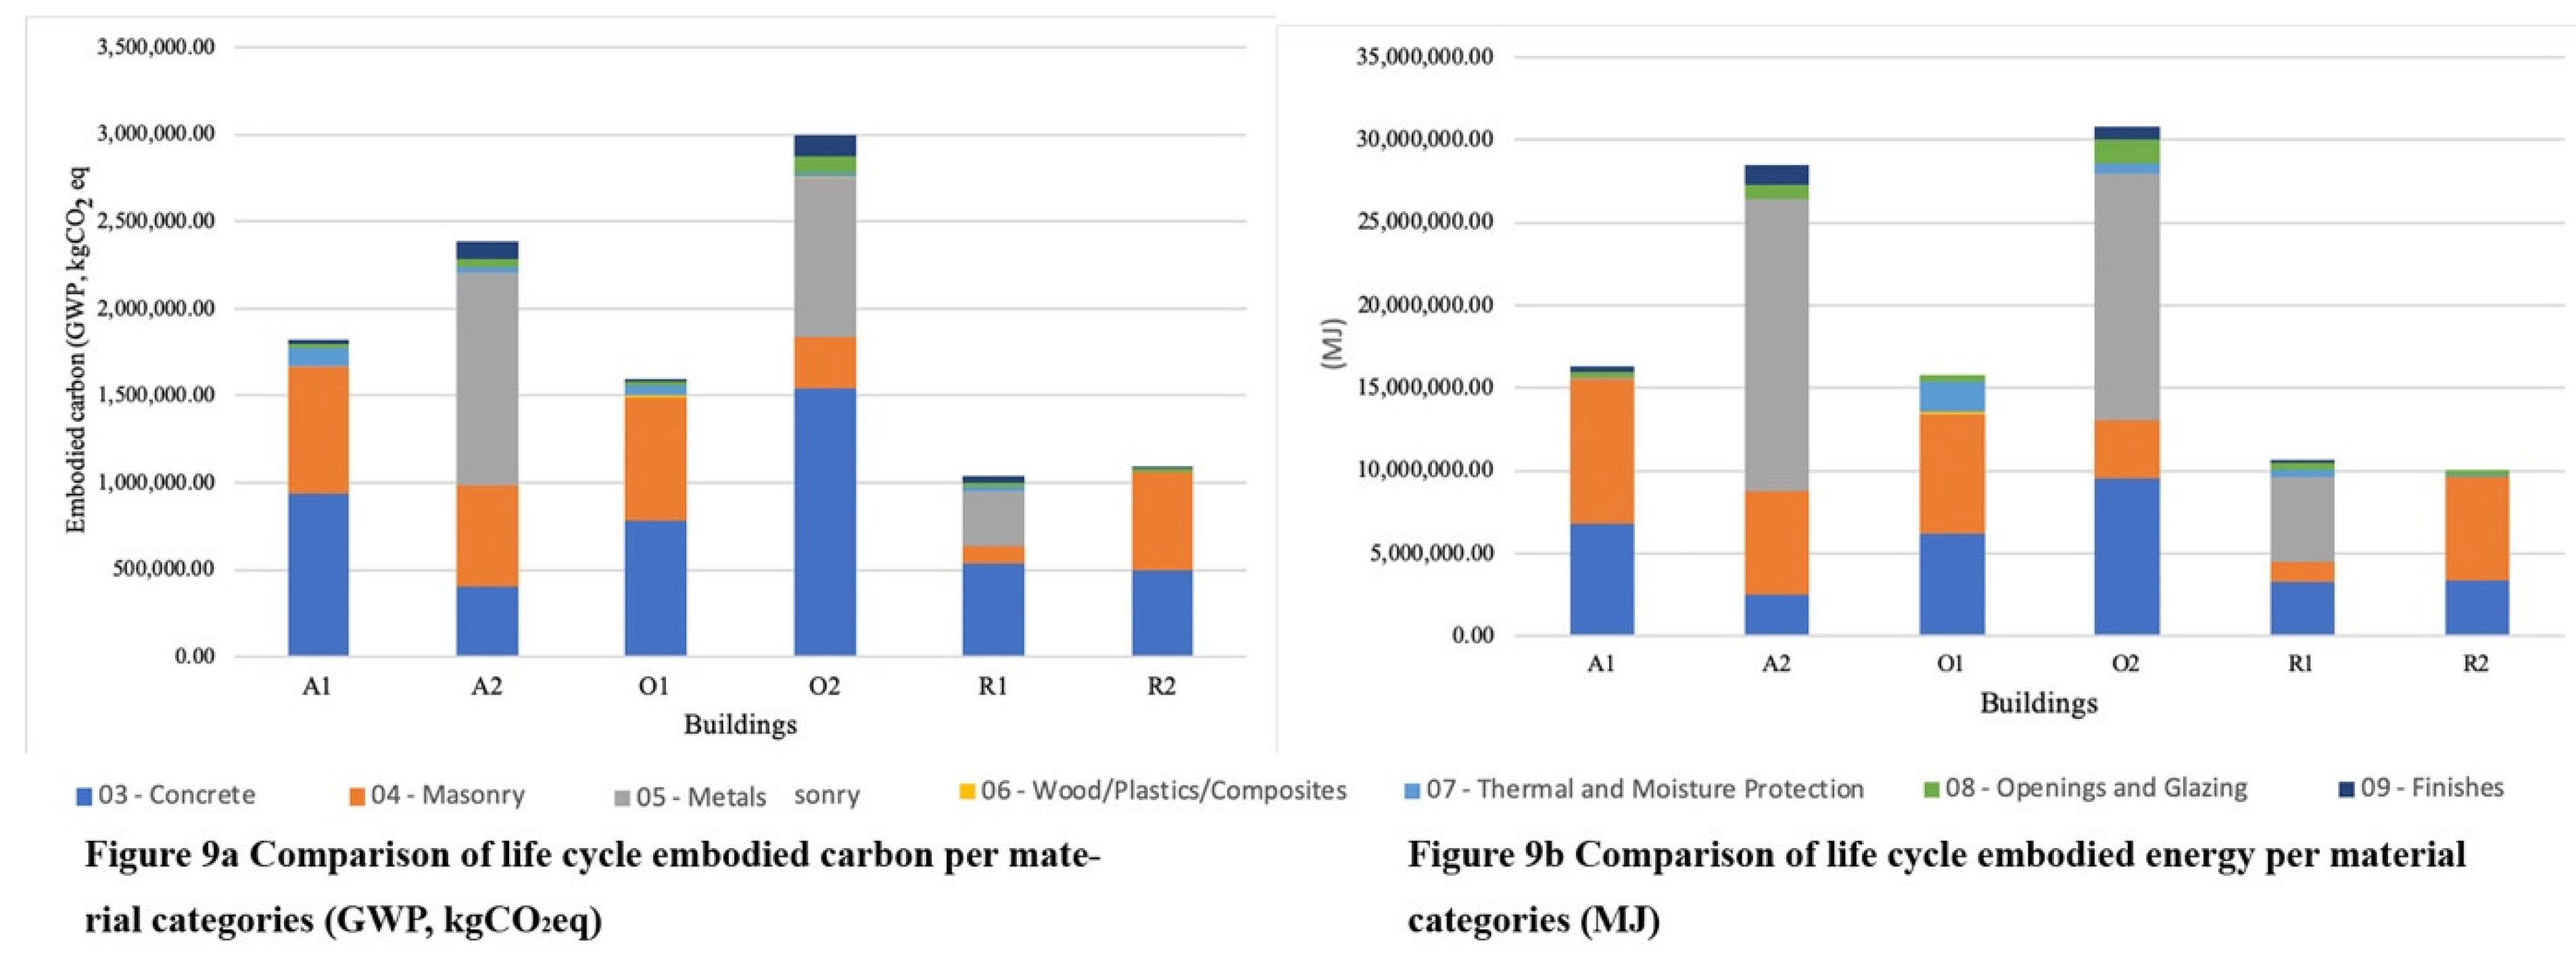
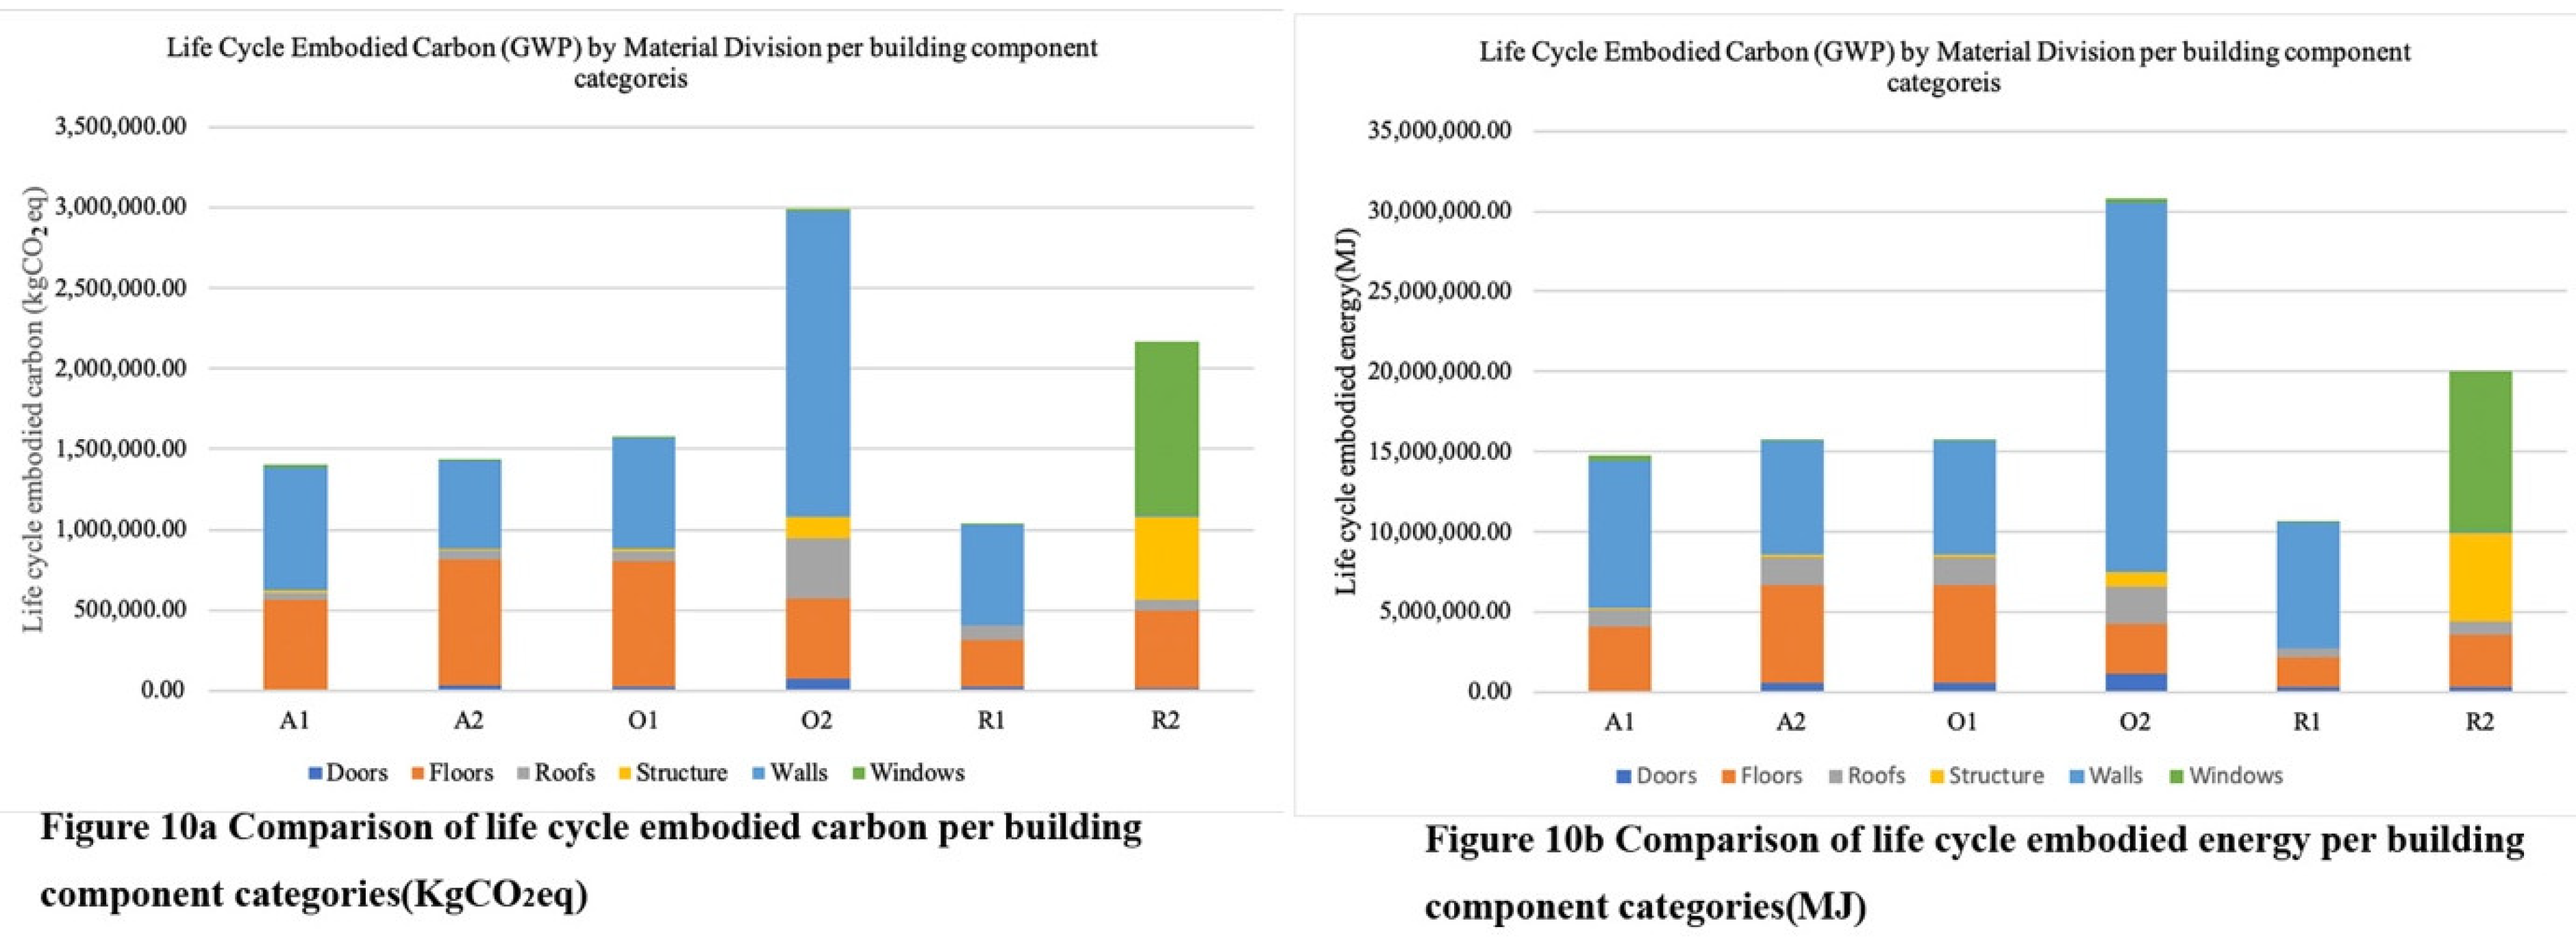
4.3. Building Components and Materials’ Contribution

The results in Section 4.3 are from environmental impact analysis conducted in Athena (refer to Section 3.4), using the input from data listed in Table 3. In order to gain a better understanding of what building components or materials contribute the most to embodied carbon, embodied energy, and environmental impact, detailed analyses are conducted for each building. For the embodied carbon, illustrated in Figure 9a, concrete accounts for 51%, and metal accounts for 31% in the O2 building. In the A2 building, the concrete contribution is 17%, and metal is 51%. In the A1 building, concrete is responsible for 51% of LCEC. Figure 9b reveals the top 3 buildings with highest LCEE are O2, A2 and A1 again. Among all the material categories, concrete and metal are the primary contributors to embodied energy. In the A2 building, concrete contributes to 17% of LCEE and metal accounts for 52% of LCEE; and in the O2 building, concrete contributes 51% of LCEE and metal accounts for 31% of LCEE. Overall, the two residential buildings have lower LCEC and LCEE than the other buildings. This is not because of the smaller building’s footprint, it is mostly determined by the building materials used.
As far as building assembly groups, shown in Figure 10a, the building floors contribute the most to embodied carbon in A1, A2 and O1. In O2 and R1, walls, including exterior walls and interior walls, are the largest contributor. In R2, windows contribute the most to embodied carbon. For embodied energy, walls are the largest contributor in A1, A2, O1, O2 and R1, shown in Figure 10b. R2 is the exception, where windows accounts for more than 50% of embodied energy. When examining the embodied energy and embodied carbon together, building walls, especially exterior walls, are a common significant factor. For future building renovations, replacing or upgrading existing exterior walls with low embodied energy and carbon components can effectively reduce the overall embodied energy and carbon.
For environmental impact, Figure 11 illustrates how residential buildings perform better in all four environmental categories, and commercial buildings and academic buildings’ performance varies quite a lot depending on the impact categories.

5. Discussion and Conclusions

From the results of this analysis, several conclusions can be drawn. First, the results illustrate a clear difference between embodied energy and embodied carbon. There are two different units of measurement, which do not always correlate to each other. In addition, building function, size, and construction year vary considerably. In order to get a better sense of the embodied performance of a building with a long life span, a more manageable and comparable measurement unit is needed. When embodied carbon and embodied energy are used separately, the results will not provide a comprehensive understanding of the building’s embodied performance. Instead, the ratio between embodied energy and embodied carbon can serve as a genuine indicator of embodied performance. This ratio appears to be correlated to ozone depletion potential, and not any of the other environmental impact categories measured in this study.
Second, environmental impact categories are not dependent on embodied energy, nor embodied carbon. Rather, they are proportional to LCEP. A2 and R1 have the highest environmental impact intensities in all four categories (AP, OD, EP, SF), however, LCEP indicates that A2 and R1 perform better (with lowest LCEP score) in terms of reducing their embodied emissions. The LCEP is proportionally inverse to environment impact potentials. Potentially, with more data, a statistical model could be created to predict the potential environmental impact in all four categories, using LCEP as an indicator when designing new buildings. This could reduce the complexity of current environmental impact assessments and could, therefore, help designers overcome the challenges of including environmental impact potentials as design criteria. Also, the results reveal hotspots that contributing to ozone depletion: metal manufacturing and production processes, which provide a direction for mitigation strategies.
Third, among the different building materials studies, metal and concrete express the highest contribution to embodied energy and embodied carbon. For building components, building exterior wall systems are the biggest embodied energy consumers and polluters, which indicates that building façade and wall systems could play significant roles in reducing embodied carbon and energy. This, in turn, would improve buildings’ embodied performance.
Three primary observations can be extrapolated from this study:
  • Ozone depletion potential may be usable as an indicator to predict the value of LCEP
  • Using LCEE and LCEC independently from each other can lead to incomplete assessments
  • Regardless of the large variation in the performance of different building types, building exterior assemblies, particularly exterior walls, are a common significant factor influencing embodied energy and embodied carbon.
The significance of this study can be explained in three areas. Firstly, the actual building data is recorded and analyzed: original construction documents and historical records are collected and used to perform embodied energy, embodied carbon, and environment impact analysis. Secondly, this study investigates the case buildings at a detailed level to identify the contribution from each building assemblies’ categories towards energy, carbon and environmental impact. Lastly, four environmental impact categories are assessed to gain a broad understanding of building’s impact in addition to its contribution to global warming.
This study also has limitations that must be taken into account. First, the limited number of case buildings is an important limiting factor; more buildings need to be included in these studies. Second, the results of the analysis are dependent on the reliability and accuracy of the data provided by facility management offices and manufacturers. In order to make a more accurate assessment, detailed data is required from actual buildings. There are multiple barriers to acquiring this actual data, especially for existing buildings. Most older existing buildings do not have archives with complete, original construction documents. Often these buildings have also undergone multiple renovations, which can make collecting real data very challenging. There is potential that an algorithm could overcome such uncertainty, and a sensitivity analysis could be used to verify the robustness of the analysis results The third limitation is related to the scalability of the proposed method. It is possible to generalize construction types and methods for buildings built around the same time period, in a similar climate zone and in a geographic location. We can then use one or two buildings as a prototype to represent a portfolio of similar buildings, and then apply the proposed method on a much larger scale, such as an entire campus [11,39], neighborhood [40], city [41], or industry [42]. However, overgeneralizing could distort the findings and undermine the reliability of the analysis results as well. In order to prevent this overgeneralization, it is critical in the next steps to look into climate, geographic location and construction types as key influencing factors on the results.

Author Contributions

The author has read and agreed to the published version of the manuscript.

Funding

This project was funded by the Office of Sustainability, University of Maryland.

Acknowledgments

I would like to acknowledge the support given from research assistant David Milner.

Conflicts of Interest

The authors declare no conflict of interest.

Nomenclature

LCEClife-cycle embodied carbon
LCECClife-cycle embodied carbon coefficient
LCECIlife-cycle embodied carbon intensity
LCEElife-cycle embodied energy
LCEEIlife-cycle embodied energy intensity
LCEEClife-cycle embodied energy coefficient
ECembodied carbon
IECinitial embodied carbon
RECrecurring embodied carbon
DECdemolition embodied carbon
RECrecycled embodied carbon
EECembodied energy coefficients
APacidification potential
ODozone depletion potential
SFsmog formation potential
EPeutrophication potential

References

  1. Gustavsson, L.; Joelsson, A.; Sathre, R. Life cycle primary energy use and carbon emission of an eight-storey wood-framed apartment building. Energy Build. 2010, 42, 230–242. [Google Scholar] [CrossRef]
  2. Chastas, P.; Theodosiou, T.; Bikas, D. Embodied energy in residential buildings-towards the nearly zero energy building: A literature review. Build. Environ. 2016, 105, 267–282. [Google Scholar] [CrossRef]
  3. Hu, M. The Embodied Impact of Existing Building Stock. In Toward Sustainability Through Digital Technologies and Practices in the Eurasian Region; IGI Global: Hershey, PA, USA, 2020; pp. 1–31. [Google Scholar]
  4. Dixit, M.; Fernandez-Solis, J.L.; Lavy, S.; Culp, C.H. Need for an embodied energy measurement protocol for buildings: A review paper. Renew. Sustain. Energy Rev. 2012, 16, 3730–3743. [Google Scholar] [CrossRef]
  5. Cabeza, L.F.; Barreneche, C.; Miró, L.; Morera, J.M.; Bartolí, E.; Fernandez, A.I. Low carbon and low embodied energy materials in buildings: A review. Renew. Sustain. Energy Rev. 2013, 23, 536–542. [Google Scholar] [CrossRef]
  6. Optis, M.; Wild, P. Inadequate documentation in published life cycle energy reports on buildings. Int. J. Life Cycle Assess. 2010, 15, 644–651. [Google Scholar] [CrossRef]
  7. Kneifel, J.; O’Rear, E.; Webb, D.; O’Fallon, C. An Exploration of the Relationship between Improvements in Energy Efficiency and Life-Cycle Energy and Carbon Emissions using the BIRDS Low-Energy Residential Database. Energy Build. 2017, 160, 19–33. [Google Scholar] [CrossRef]
  8. De Wolf, C.; Pomponi, F.; Moncaster, A.M. Measuring embodied carbon dioxide equivalent of buildings: A review and critique of current industry practice. Energy Build. 2017, 140, 68–80. [Google Scholar] [CrossRef]
  9. Hendriks, C.; Worrell, E.; Price, L.; Martin, N.; Meida, L.O.; De Jager, D.; Riemer, P. Emission reduction of greenhouse gases from the cement industry. In Greenhouse Gas Control Technologies 4; Elsevier: Amsterdam, The Netherlands, 1999; pp. 939–944. [Google Scholar]
  10. British Standard Institutions (BSI). BS EN 15978 Sustainability of Construction Works Assessment of Environmental Perforamnce of Buildings—Calculation Method; British Standards Institution: London, UK, 2011. [Google Scholar]
  11. Hu, M. Life-cycle environmental assessment of energy-retrofit strategies on a campus scale. Build. Res. Inf. 2019, 4, 1–22. [Google Scholar] [CrossRef]
  12. Athena Sustainable Materials Institute. About Whole-Building LCA and Embodied Carbon. Available online: http://www.athenasmi.org/resources/publications/ (accessed on 20 January 2020).
  13. Andrew, A. Embodied Energy Coefficients of Building Materials; Centre for Building Performance Research, Victoria University of Wellington: Kelburn, New Zealand, 1996. [Google Scholar]
  14. Dias, W.; Pooliyadda, S. Quality based energy contents and carbon coefficients for building materials: A systems approach. Energy 2004, 29, 561–580. [Google Scholar] [CrossRef]
  15. Zeebe, R.E.; Zachos, J.C.; Caldeira, K.; Tyrrell, T. OCEANS: Carbon Emissions and Acidification. Science 2008, 321, 51–52. [Google Scholar] [CrossRef]
  16. Azari, R.; Garshasbi, S.; Amini, P.; Rashed-Ali, H.; Mohammadi, Y.; Najafabadi, R.A. Multi-objective optimization of building envelope design for life cycle environmental performance. Energy Build. 2016, 126, 524–534. [Google Scholar] [CrossRef]
  17. Scheuer, C.; A Keoleian, G.; Reppe, P. Life cycle energy and environmental performance of a new university building: Modeling challenges and design implications. Energy Build. 2003, 35, 1049–1064. [Google Scholar] [CrossRef]
  18. Bina, R.; Upma, S.; Chuhan, A.K.; Diwakar, S.; Raaz, M. Photochemical Smog Pollution and Its Mitigation Measures. J. Adv. Sci. Res. 2011, 2, 28–33. [Google Scholar]
  19. Energy Education. Smog. Available online: https://energyeducation.ca/encyclopedia/Smog (accessed on 6 April 2020).
  20. Kim, T.-H.; Chae, C.U. Environmental Impact Analysis of Acidification and Eutrophication Due to Emissions from the Production of Concrete. Sustainability 2016, 8, 578. [Google Scholar] [CrossRef] [Green Version]
  21. Hill, C.A.S.; Dibdiaková, J. The environmental impact of wood compared to other building materials. Int. Wood Prod. J. 2016, 7, 215–219. [Google Scholar] [CrossRef]
  22. Buchanan, A.H.; Honey, B.G. Energy and carbon dioxide implications of building construction. Energy Build. 1994, 20, 205–217. [Google Scholar] [CrossRef]
  23. Debnath, A.; Singh, S.; Singh, Y. Comparative assessment of energy requirements for different types of residential buildings in India. Energy Build. 1995, 23, 141–146. [Google Scholar] [CrossRef]
  24. Suzuki, M.; Oka, T.; Okada, K. The estimation of energy consumption and CO2 emission due to housing construction in Japan. Energy Build. 1995, 22, 165–169. [Google Scholar] [CrossRef]
  25. Winther, B.; Hestnes, A. Solar Versus Green: The Analysis of a Norwegian Row House. Sol. Energy 1999, 66, 387–393. [Google Scholar] [CrossRef]
  26. Keoleian, G.A.; Blanchard, S.; Reppe, P. Life-Cycle Energy, Costs, and Strategies for Improving a Single-Family House. J. Ind. Ecol. 2000, 4, 135–156. [Google Scholar] [CrossRef]
  27. Mithraratne, N.; Vale, B. Life cycle analysis model for New Zealand houses. Build. Environ. 2004, 39, 483–492. [Google Scholar] [CrossRef]
  28. Ralph, H.; Opray, L.; Grant, T. Integrating Life Cycle Assessment into housing environmental performance assessment. In Proceedings of the 5th Australian Conference on Life Cycle Assessment: Achieving Business Benefits from Managing Life Cycle Impacts, Melbourne, Australia, 22–24 November 2006. [Google Scholar]
  29. Casals, X.G. Analysis of building energy regulation and certification in Europe: Their role, limitations and differences. Energy Build. 2006, 38, 381–392. [Google Scholar] [CrossRef]
  30. Thormark, C. The effect of material choice on the total energy need and recycling potential of a building. Build. Environ. 2006, 41, 1019–1026. [Google Scholar] [CrossRef]
  31. Szalay, Z. What is missing from the concept of the new European Building Directive? Build. Environ. 2007, 42, 1761–1769. [Google Scholar] [CrossRef]
  32. Citherlet, S.; Defaux, T. Energy and environmental comparison of three variants of a family house during its whole life span. Build. Environ. 2007, 42, 591–598. [Google Scholar] [CrossRef]
  33. Lucchi, E.; Tabak, M.; Troi, A. The “Cost Optimality” Approach for the Internal Insulation of Historic Buildings. Energy Procedia 2017, 133, 412–423. [Google Scholar] [CrossRef]
  34. Bogdan, A.; Kouloumpi, I.; Thomsen, K.E.; Aggerholm, S.; Enseling, A.; Loga, T.; Witczak, K. Implementing the cost-optimal methodology in EU countries: Lessons learned from three case studies. Energy Procedia 2015, 78, 2022–2027. [Google Scholar]
  35. Andra, B.; Kašs, K.; Edīte, K.; Gatis, Ž.; Agris, K.; Dagnija, B.; Armands, G.; Reinis, P.; Marika, R.; Lelde, T.; et al. Robust Internal Thermal Insulation of Historic Buildings-State of the art on historic building insulation materials and retrofit strategies. Lirias 2019, 21, 1–87. [Google Scholar]
  36. Akkurt, G.; Aste, N.; Borderon, J.; Buda, A.; Calzolari, M.; Chung, D.; Costanzo, V.; Del Pero, C.; Evola, G.; Huerto-Cardenas, H.; et al. Dynamic thermal and hygrometric simulation of historical buildings: Critical factors and possible solutions. Renew. Sustain. Energy Rev. 2020, 118, 109509. [Google Scholar] [CrossRef]
  37. Pomponi, F.; Moncaster, A.M. Scrutinising embodied carbon in buildings: The next performance gap made manifest. Renew. Sustain. Energy Rev. 2018, 81, 2431–2442. [Google Scholar] [CrossRef] [Green Version]
  38. Pielke, R.A., Sr. Climate Vulnerability: Understanding and Addressing Threats to Essential Resources; Elsevier: Amsterdam, The Netherlands, 2013. [Google Scholar]
  39. Stephan, A.; Muñoz, S.; Healey, G.; Alcorn, J. Analysing material and embodied environmental flows of an Australian university—Towards a more circular economy. Resour. Conserv. Recycl. 2020, 155, 104632. [Google Scholar] [CrossRef]
  40. Stephan, A.; Crawford, R.H.; De Myttenaere, K. Multi-scale life cycle energy analysis of a low-density suburban neighbourhood in Melbourne, Australia. Build. Environ. 2013, 68, 35–49. [Google Scholar] [CrossRef] [Green Version]
  41. Ripa, M.; Fiorentino, G.; Vacca, V.; Ulgiati, S. The relevance of site-specific data in Life Cycle Assessment (LCA). The case of the municipal solid waste management in the metropolitan city of Naples (Italy). J. Clean. Prod. 2017, 142, 445–460. [Google Scholar] [CrossRef]
  42. Crawford, R.H.; Stephan, A.; Prideaux, F. A comprehensive database of environmental flow coefficients for construction materials: Closing the loop in environmental design. In Proceedings of the 53rd International Conference of the Architectural Science Association 2019: Revisiting the Role of Architecture for ’Surviving’ Development, Roorkee, India, 28–30 November 2019. [Google Scholar]
Figure 1. Embodied energy and embodied emission (by authors).
Energies 13 01905 g001
Figure 2. Case buildings.
Energies 13 01905 g002
Figure 3. Embodied energy intensity and embodied carbon coefficient.
Energies 13 01905 g003
Figure 4. Life-cycle embodied energy intensity and life-cycle embodied carbon coefficient and life-cycle embodied performance.
Energies 13 01905 g004
Figure 5. Environmental impact categories: AP, EP and SF.
Energies 13 01905 g005
Figure 6. Environmental impact categories: ozone depletion (OD).
Energies 13 01905 g006
Figure 7. Building materials contribution to ozone depletion.
Energies 13 01905 g007
Figure 8. A2 building total mass (kg) by material categories.
Energies 13 01905 g008
Figure 9. (a) Comparison of life cycle embodied carbon per material categories (GWP, kgCO2eq); (b) Comparison of life cycle embodied energy per material categories (MJ).
Energies 13 01905 g009
Figure 10. (a) comparison of life cycle embodied carbon per building component categories (KgCO2 eq); (b) comparison of life cycle embodied energy per building component categories (MJ).
Energies 13 01905 g010
Figure 11. Contribution to total environmental impact per building.
Energies 13 01905 g011
Table 1. Literature review: state of art studies on embodied energy and embodied carbon.
StudyBuilding TypeCountryYr LCEEI (MJ/m2/yr)Construction TypesLCECI (kgCO2e/m2/yr)Life Span of BuildingLCEP (kgCO2eq)/MJ
1Buchananand Honey [22]CORNew Zealand199476–1300Wood100–1000250.7–1.32
2Debnath et al [23]CORIndia199582–100 Load bearing – Reinforced ConcreteN/A*50 **N/A
COR74–84
COR62–86
3Suzuki et al [24]COR (multi-family)Japan1995216–270 Steel Reinforced Concrete850*37 ***3.15–3.94
COR (single-family)100 Wood250*302.5
COR (single-family)122Lightweight Steel400*373.28
4Winther and Hestnes [25]CORNorway199936–40.1 TimberN/A 50N/A
LER49.450
Super insulated 88.4850
5Keoleian et al (2000) [26]CORUSA 2000126 N/A32500.25
LER145 89500.61
6Mithraratene and Vale [27]LERNew Zealand200444.25 Light timberN/A100N/A
Super insulated 50.41 100
7Horne et al. [28]LERAustralia200641–57 N/AN/A50N/A
8Casals [29] CORSpain2006 N/AN/A30N/A
LER 30
9Thormark [30]LERSweden 200660.3–96.2TimberN/A50N/A
10Szalay [31]CORHungary200771 N/AN/A50N/A
LER227–243 50
11Citherlet and Defaux [32]CORSwitzerland 2007108 N/A50
LER 105–113 50
LER: Low energy residential. COR: Conventional residential. NZER: Net zero-energy residential. PH: Passive house. *50: assumed life span of building based on national average data. **. Based on national building code (NCB) by Indian government, life span for concrete structure is 75–100 years, the average life span of apartment building is 50–60 years and house is 40 years. https://medium.com/@marsmount.com/what-is-the-lifespan-of-an-apartment-in-india-c2db01928a82. ***. According to the Ministry of Land, Infrastructure, Transport and Tourism (MLIT), the average life span for wooden house is 27–30 years, for reinforced-concrete building is 37 years. https://japanpropertycentral.com/2014/02/understanding-the-lifespan-of-a-japanese-home-or-apartment/.
Table 2. Case project information.
Building #Building FunctionFloor Area (Sq.m)Floor #Yr of Construction Yr of Renovations
A1 (A)Academic7,01521972-
A2 (C)Academic2,256419572011
O1 (L)Officea4,21841969-
O2 (H)Office5,585419642004
R1 (W)Residential982419481984
R2 ()Residential2768419552010
Table 3. Building assemblies and materials included in the studies.
Building ComponentsA1 A2
FoundationConcrete spread footingConcrete spread footing
Exterior wall10 cm brick masonry supported by 20 cm concrete masonry block10 cm brick masonry supported by 20 cm concrete masonry block
Exterior window Steel window frames with single paned glass, no coating.
PVC window frame double-glazed no coating air
Wood window frames with single paned glass, no coating.
Exterior door Aluminum frame, single pane, sliding and swing door Wood frame, single panel, swing door
Interior wallConcrete masonry block and brick masonry wall10 cm concrete masonry block
Partition wall3 5/8” metal stud wall with 1 layer of 5/8” gypsum board on either exterior side 10 cm mtl stud wall with with 1 layer of 5/8” gypsum board on either exterior side, 8cm batt insulation inside
FloorConcreteAsphalt tile on concrete floor
Columns ConcreteConcrete
RoofConcrete roof support, built up roofing and reflecting aggregate surface with 1” rigid insulationFlat seam metal roof on 3” gypsum roof tile
Slate roof on 3” gypsum roof tile
BeamsConcreteConcrete
O1 (L)O1 (H)
FoundationConcrete spread footing @ 2500 psi supporting a 12 cm (5 inch) concrete slabConcrete spread footing
Exterior wall10 cm (4 inch) Brick masonry, supported by 20 cm (8 inch) concrete masonry block, with 5cm (2 inch) rigid insulation 10 cm (4 inch) brick masonry supported by 25 cm (10 inch) concrete masonry block, no insulation
Exterior window Wood window frames with single paned glass, no coating Wood window frames with double-glazed glass
Interior wall10 cm (4 inch) Brick masonry wall with 1 cm (1/2 inch) gypsum wall board 10 cm (4 inch) metal stud with gypsum board on both sides
Partition wall10 cm (4 inch) concrete masonry block, painted20 cm (8 inch) concrete masonry block, with gypsum board on one side;
10 cm (4 inch) Wood stud with plywood boards on both side
Floor15 cm (6 inch) concrete one-way joists floor with #4 continuous steel rebar, pan width of 36 cm (14 inch)15 cm (6 inch) concrete one-way joists floor over reinforced concrete slab
Columns 20 cm (8 inch) concrete column @ 3000 psi20 cm (8 inch) concrete column @ 3000 psi
Roof(2 × 4 inch) wood rafters supported by (1/4 inch) slate tile with (3/4 inch) plywood underneath, 10 cm (4 inch) batt insulation inbetween rafters 5 × 10 cm (2 × 4 inch) wood rafters supported by (1/4 inch) slate tile with (3/4 inch) plywood underneath, 10 cm (4 inch) batt insulation inbetween rafters
Beams Concrete joist beam @ 3000 psiconcrete joist beam @ 3000 psi
R1R1
Foundation30 × 76 cm Concrete spread footingConcrete spread footing
Exterior wall10 cm (4 inch) brick masonry supported by 20 cm (8 inch) concrete masonry block, no insulation10 cm (4 inch) Brick masonry supported by 10 cm (4 inch) concrete masonry block, without air gap, without insulation
Exterior window Metal window frames with single paned glass, no coating
Interior wall10 cm (4 inch) metal stud with gypsum board on both sides10 cm (4 inch) concrete block
Partition wall20 cm (8 inch) concrete masonry block, with Gypsum board one side10 cm (4 inch) Wood stud with plywood board on both side
Floor--
Columns 20 × 20 cm (8 inch) concrete columns @ 3000 psi35 × 35 cm (14 inch) concrete columns @ 3000 psi
Roof(2 × 4 inch) Wood rafters supported (1/4 inch) slate tile with (3/4 inch) plywood underneath, 10 cm (4 inch) batt insulation in-between raftersBuilt-up light weight concrete roof over reinforced concrete slab
BeamsConcrete @ 3000 psiConcrete @ 3000 psi
Table 4. Embodied energy and embodied carbon analysis of case projects.
Building NumberLCEEC (MJ/kg/yr)LCEEI (kgCO2eq/kg/yr)LCECC (MJ/m2/yr)LCECI (kgCO2eq /m2 /yr)LCEP(/kgCO2eq /MJ /yr)
A11.842324.870.19245.070.105
A24.5312,614.200.371042.970.083
O12.153746.880.22374.390.100
O23.875518.850.38535.420.097
R13.9010,876.950.381053.810.097
R22.493619.270.27392.080.108
A1: academic building 1; O1: office building; R1: residential building 1.
Table 5. Linear regression model of correlation between environment impact and LCEP.
CategoryR-SquaredAdjusted R-SquaredSignificance Fp-ValueSignificance
AP0.161−0.0490.4310.431No
OD0.8770.8460.0060.006Yes
SF0.2140.0170.3560.356No
EP0.3870.2340.1870.187No

