Abstract
PV waste management will gain relevance proportionally to the amounts of waste that are expected to arise with the phasing-out of old installations in the upcoming years and decades. The Life Cycle Assessment (LCA) methodology is used here to analyze the environmental performance of photovoltaic systems and the waste management methods that have been developed recently. Several LCA studies have already been performed for PV technologies, but in most cases these do not include the end of life stage, thus there is still uncertainty about the impacts of recycling on the environmental footprint of PV electricity. The present study offers a more detailed analysis of different end-of-life approaches for the main photovoltaic technologies that are found on the market. The results from the analysis demonstrate that recycling has the potential to improve the environmental profile of PV electricity but at the same time there is room for further improvements in developing dedicated recycling technologies.
1. Introduction
1.1. Motivation
Energy transition towards cleaner electricity grids has led to a large deployment of photovoltaic (PV) installations on a global scale. However, until now only small flows of PV waste have had to be handled. This has restrained the consolidation of a specialized waste processing industry due to a lack of profitability. As a consequence, little is known regarding the performance of waste management schemes and the potential ecological benefits that could come along with them. Appropriate waste management is required to mitigate potential ecological impacts of the waste material. If not handled in a proper manner, critical and valuable resources might be lost and toxic materials such as lead or cadmium contained within the modules could leak into the soil and groundwater, representing a threat for biodiversity and human health. While the risk of leakage is low under neutral atmospheric conditions, it rises when the module is exposed to acidic environments as those produced by rainfall in certain locations. Furthermore, PV systems represent a potential source of valuable materials. However, the small flow of End-of-Life (EoL) modules has restrained the profitability of recycling, since dedicated recycling processes demand high volumes of input material to make this activity economically viable [1,2,3]. The study of waste management will gain increasing relevance in the long term when dealing with big amounts of photovoltaic waste that are already emerging. It is nevertheless difficult to accurately predict these flows of waste since the real lifetime of PV modules still remains uncertain. Most installations have not yet met their expected lifespans, which have been indicated to be around 25–30 years by most manufacturers. Little is known about the modules’ performance after this timespan, but a couple of studies indicate that an economically viable operation of PV plants is realistic even after 30–35 years [4,5,6].
Several environmental assessment studies have proved the environmental benefits of PV technologies, but in most cases the end-of-life stage has been neglected. Likewise, a couple of approaches to processing waste material have been proposed, but their impact on the environmental profile of PV electricity remains uncertain. This study intends to reduce this gap through a comprehensive analysis of different waste management approaches based on recycling. The main objective is to quantify the impacts of EoL management approaches and assess their contribution to the overall environmental footprint of electricity produced by different PV technologies with a special focus on Germany.
1.2. LCA of Waste Management for PV Systems
The most recent Life Cycle Inventories (LCIs) have been published by Wambach et al. [7]. For crystalline Silicon (c-Si) modules, the inventories were built alongside plants designed for the processing of laminated glass, metals or electronic and electric waste. For the specific case of Cadmium-Telluride (CdTe) modules, the inventories included were based on the recycling activities of the company First Solar in Germany. The study concluded that the benefits of recycling were higher than the impacts caused by processing the waste material in all the categories under study with an exception for CdTe in the category ‘human toxicity (cancer effects)’. Another study [8] found a reduction of about 4–11% of the modules’ environmental burdens and highlighted the influence of transports and electricity use in the burdens of the recycling process. The authors also presented a preliminary study on a new approach for EoL management of thin film modules, which was mostly based on mechanical processes eliminating the need for thermal treatments and reducing the use of chemical agents [9]. The technical feasibility of a new c-Si module recycling technique was studied by Duflou et al. [10] by means of a selective mechanical delamination, performing a comparative LCA with two other existing methods. Others have illustrated and analyzed an innovative process that enables the recovery of other valuable materials present in the modules such as silicon, silver and other metals that cannot be retrieved by traditional means [11,12]. Those studies applied the LCA methodology to a pilot process developed within the project called ‘Full Recovery End of Life Photovoltaic’ (FRELP), which is composed of a series of mechanical, thermal and chemical treatments. A more detailed analysis on the environmental impact categories according to the different processes involved was given recently [13]. This study shows net benefits from recycling in all the impact categories of analysis, as well as the identification of transportation and thermal treatments as the main burdens within the entire recycling process. A specific analysis focused on waste backsheets in order to evaluate the effects of fluorinated layers on the EoL processing found that fluorine-free backsheets performed better than fluorinated ones for both incineration and pyrolysis; thus, the use of fluoropolymers should be avoided [14]. Other studies evaluating existing waste management techniques and new alternative methods for recycling PV panels have been performed, but without offering the disclosure of inventories or a deep analysis of the ecological footprint of such techniques [15,16,17,18].
2. Materials and Methods
The evaluation of the environmental profile of a product or service is the characterization of its ecological footprint; a description of the interactions with its environment, and thus the associated impacts. Several tools have been developed to perform such an evaluation. One of these is the so-called Life Cycle Assessment (LCA), a systematic methodology which determines indicators related to impact categories that quantify the environmental burden of each phase in the lifecycle of the product. Within this paper, a total of six waste management approaches proposed by industry and research programs are evaluated under this methodology. Following the recommendations from [19,20] the impact assessment method for the analysis is the ILCD-2011 and the following impact categories were chosen: (1) Climate change; (2) Human toxicity (non-carcinogenic); (3) Human toxicity (carcinogenic); (4) Particulate matter; (5) Acidification; (6) Freshwater ecotoxicity; (7) Resource depletion.
2.1. Product Systems Description
The system under study comprises the generation of AC electricity produced with a slanted-roof photovoltaic plant installed in Germany and manufactured under the approximated market and technological conditions of 2010–2013, which can be seen in Table 1. This specific period was chosen due to the great increase in deployment of PV installations at the time, also describing the gross composition of the waste to be processed in the future:

Table 1.
Module modeling parameters [21].
As proposed by [22], the following lifetimes and parameters will be used in this study:
- Life expectancyModules: 30 years (for any type)Inverters: 15 yearsMounting structure: 30 years (for any type of module)Cabling: 30 yearsManufacturing plant: 30 years (for any type of module)Recycling plant: 30 years (for any type of module)
- Performance Ratio: Standard value of 0.75
- Degradation rate: Standard linear degradation rate of 0.7% per year
- Conversion efficiency from primary energy to electricity: ηG = 30%
- Irradiation: Conditions in Germany: 1.055 kWh/m2 [23]
Figure 1 shows the system boundaries defined for the assessment of electricity production, which include raw materials and energy supply in processing at the initial manufacturing plant. The EoL stage includes burdens from transportation, waste processing and final disposal of the modules. In addition, environmental credits gained from energy and material recovery are given. However, the burdens from the post-recycling refining processes of these materials needed before reintroducing them in the production lines have been left out. The manufacturing of the balance-of-system components (BOS), e.g., mounting structure and the electric installation required for PV systems, is included in the analysis; however, recycling of these has not been considered, since they are treated separately from the PV modules, and thus no credits have been accounted for.
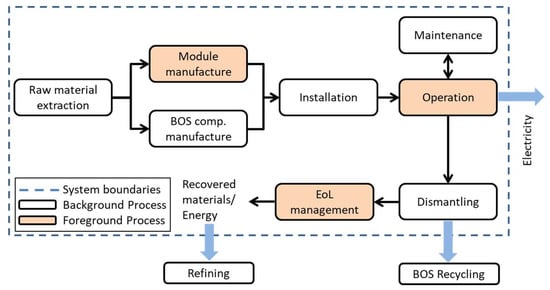
Figure 1.
System boundaries of the current study.
The functional unit (FU) is 1 kWh of electricity produced with a PV system installed in Germany, which allows consistent comparability of the different technologies under study. This FU shall describe the purpose of the system studied and will serve as a reference measure to which the impacts in the different categories will be expressed. The reference flow refers to the size of the system that quantifies the functional unit, which in this case is the 3 kWp plant.
2.2. Characterization of Modules and Input Waste
For practical purposes, the mass composition of c-Si input waste was taken from [11]. However, in real life, recycling plants will receive a wide variety of modules, each one with a specific environmental profile. This is because the technological development has diversified the market making it difficult to define a standard composition. The mass fractions assumed for a c-Si module can be found in Table 2.
Table 2.
Mass composition of c-Si module input waste.
2.3. Description of the EoL Approaches
The waste management approaches under study are either state-of-the art basic recycling as described, basic recycling with additional benefits from backsheet recovery, or more dedicated recycling strategies as proposed by other research programs (Table 3). These approaches have been subject to research and testing for a long time and are thus likely to define the future scenario. Their main differences consist in the recovered material, the involved processes and the final disposal mechanism that the unrecovered materials undergo.
Table 3.
Modelled approaches and respective features.
Basic material recovery refers to those approaches limited to recovering only bulk materials such as aluminum and glass by simple processes in order to comply with the European legal requirements of mass recovery. These approaches leave behind other valuable materials such as wafers and silver due to the added complexity of these processes. Currently, this type of approach is performed mostly in laminated glass, metal and electronic waste recycling plants where PV modules can also be processed. Figure 2 presents a diagram flow chart of one of the recycling approaches studied as well as how the boundary conditions have been defined.
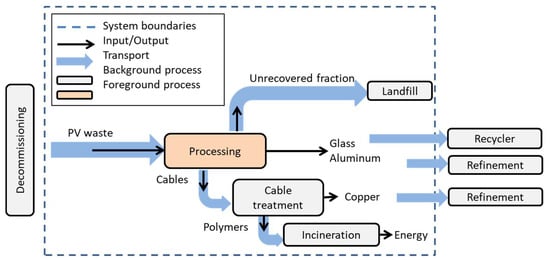
Figure 2.
Exemplary process flow chart of a recycling approach (appr. n°1).
Approaches n°1 and n°2 correspond to the most common methods performed nowadays as described by Wambach et al. [7].
Approaches n°3 and n°4 are more specified processes described by Aryan et al. [14] which seek to determine the impacts of (A) fluorine-free and (B) fluorinated backsheets. These approaches consist essentially of the following processes: The initial preprocessing in which the frame, junction box and cables are removed. The cables are used for copper extraction while the plastic cover is sent to an incineration plant. The next stage comprises a series of mechanical steps such as shredding, crushing, sieving and separation of the different fractions. The recovered materials are glass and aluminum, while the unrecovered fraction is sent to a landfill and in some cases is partially incinerated.
In addition to basic bulk recovery, the approaches described as ‘dedicated recovery’ will be based on the work from Latunussa et al. [11] and correspond to approaches n°5 and n°6, presented in Table 3. The first step of these approaches consists in the dismantling of the modules; this includes removal of frame and wires, which later on receive the same subsequent treatments as described before. The following step is the glass separation by means of heat and mechanical detachment. The recovered glass is later refined, and the clean fraction is reused in other industrial processes, while the contaminated fraction is sent to a landfill. The remaining ‘sandwich laminate’ is cut into small pieces and sent to an incineration plant. Alternatively, depending on the backsheet composition, pyrolysis could be performed (appr. n°6). The outputs of this process are heat and fly ashes which are sent to a landfill and bottom ashes rich in silicon and other metals that are returned to the recycling plant for further processing. The final processing stage consists in a series of mechanical and chemical treatments such as sieving, leaching, filtration and electrolysis which aim to separate silicon, silver and copper scrap, as well as the remaining fractions of aluminum connectors. These usable fractions are sent to third party processors for further refinement while the sludge and liquid waste also produced within these processes are sent to a landfill.
2.4. Sensitivity Analysis
The initial analysis was performed assuming that recycling was done within the same time frame as the manufacturing of the modules (2010–2013, due to data availability). To determine how changing industrial parameters would affect the environmental performance of recycling technologies, a sensitivity analysis based on technology forecasts and the author’s understanding is performed until the year 2040, in order to evaluate the impact of recycling modules produced over the last decade:
- Scenario n°1: Changing electricity mix with higher penetration of renewables. Figure 3 shows the variation in the energy mix as expected in the year 2040 based on actual conditions (Figure 3a) [24] and predictions (Figure 3b) [25].
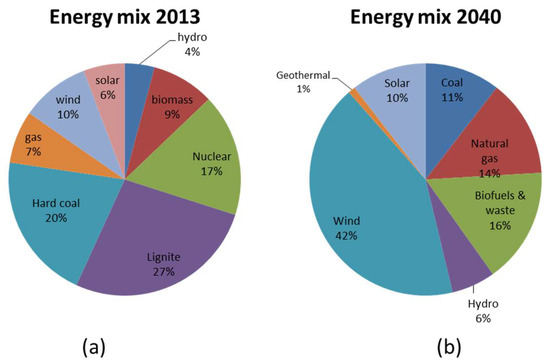 Figure 3. (a) Electricity mix for the 2013 baseline conditions [24], (b) Electricity mix for 2040 according to predictions from [25].
 - Scenario n°2: Changing recycling efficiency due to enhanced processes or bigger flows of material. An energy demand of 60% of the value in the baseline scenario is assumed.
- Scenario n°3: Changing primary material content due to increased recycled fraction. Usually, environmental credits are given for the primary material content existing in the market at the moment the recycling is performed. However, since recycling is assumed to take place after 30 years of installment of the modules, its environmental performance would be better described if the calculations contained estimates of the primary material content in 2040. For the baseline scenario, these values are 48%, 56% and 77%, while for 2040, these are assumed to be 41%, 48% and 65% for aluminum, copper and silver respectively [26,27].
- Scenario n°4: Reduced transportation due to an efficient collection network. It will be assumed that the waste management network is optimized in a way that transportation demands are reduced 50% of the initial estimate.
- Scenario n°5: Year 2040, combined conditions. It is fair to assume that future conditions would be better represented by the combination of the previously described scenarios. To obtain a more accurate perspective of the overall impact in the future the assumptions in the previous scenarios have been taken into account in one single analysis. This scenario is shown for illustrative purposes and entails a high level of uncertainty.
3. Results
3.1. Electricity Production
Figure 4 and Figure 5 show the impact of the different EoL approaches analyzed relative to the impacts of the production of 1 kWh of electricity. For mono-Si and multi-Si the same recycling approaches with the same impacts per kg of waste have been used. Due to different conversion efficiencies, different amounts of waste have to be recycled per kWh of electricity produced. The results are displayed in the negative axis as this describes reductions of the original profile.
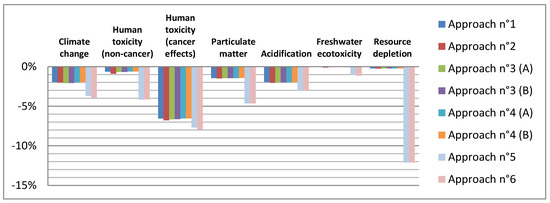
Figure 4.
Potential contribution of waste management to the environmental profile of electricity production with mono-Si modules (for numerical values see Appendix A, Table A1).
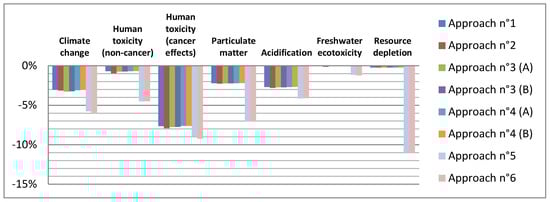
Figure 5.
Potential contribution of waste management to the environmental profile of electricity production with multi-Si modules (for numerical values see Appendix A, Table A2).
● Mono-Si modules
Figure 4 shows that the recycling of mono-Si modules has a high capacity of reducing the impacts within the impact category ‘human toxicity_(cancer effects)’ for every approach, with potential reductions ranging from −6.6% to −7.9% of the total. ‘Resource depletion’ could be reduced by about 12% when dedicated recovery is considered, but it is negligible for any other approach. The lowest effect can be seen for ‘freshwater ecotoxicity’, ranging from 0% to −1.1%. It can be seen that for the basic recycling approaches (n°1 to n°4) the environmental benefits are comparable in all the categories. Approaches n°5 and n°6 (dedicated recycling) also perform in a similar way in all impact categories.
● Multi-Si modules
The relative contribution of Multi-Si recycling in every impact category, with an exception of ‘resource depletion’, entails greater potential than the ones from Mono-Si recycling, as presented in Figure 5. For ‘climate change’ and ‘particulate matter’, potential reductions of about 3% arise from approaches n°1 to n°4, and of about 6–7% from approaches n°5 or n°6. With potential reductions of up to 1.2%, effects from any approach on ‘freshwater toxicity’ are negligible. Within ‘resource depletion’, impacts from approaches n°1 to n°4 are negligible while those from approaches n°5 and n°6 are 11% respectively.
3.2. Sensitivity Analysis
The results of the sensitivity analysis displayed in Figure 6 are presented in the following way: The 0% line defines the respective baseline approach; values on the positive side represent improvements with regard to the baseline while values on the negative side reflect detriments of performance or lesser benefits obtained.
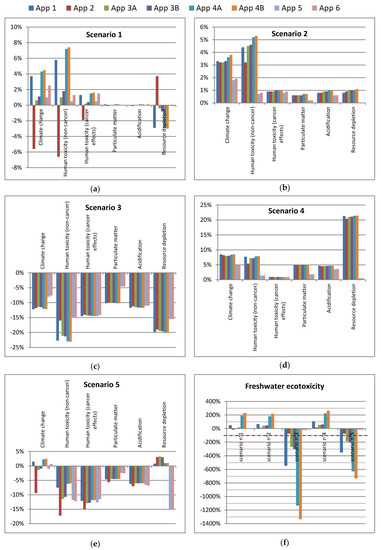
Figure 6.
Results from the different scenarios considered in the sensitivity analysis: (a) high penetration of renewables, (b) increased processing efficiency, (c) lower primary material content, (d) Optimized collection network, (e) combined conditions in 2040, and (f) specific plot for ‘freshwater ecotoxicity’.
The values displayed here are proportions of the results presented in Figure 4 and Figure 5. Due to the drastic effects observed in the sensitivity analysis for the impact category ‘freshwater ecotoxicity’, the category has been plotted in an independent graph (Figure 6f). Given that the order of magnitude differs drastically from the other impact categories, a separate display has been chosen. In the baseline impact assessment for approaches n°1 to n°4B, net benefits in this category have been close to zero (Figure 4 and Figure 5). Therefore, small parameter variations as disposed by the sensitivity analysis will easily translate into a large percentage of difference from the baseline. For example, in approach n°4B (Figure 6f) a decline of 1336% of the 0.007% environmental benefits for multi-Si modules (Figure 4) translate into absolute numbers of only 0.1% additional burdens with respect to PV electricity production without EoL management.
From scenario n°1, it can be seen that a higher penetration of renewables lowers the benefits obtained from incineration (appr. n°2) where the recovered energy is assumedly substituting generation in a cleaner grid. This is, however, subject to whether the substituted energy is effectively electricity or just heat. For all other approaches, mostly net environmental benefits can be observed, except for the category ‘resource depletion’, since the input electricity required to run the processes will come from sources with high criticality in this category, e.g., increased silver demand for a greater share of PV. A changing recycling efficiency as analyzed in scenario n°2 entails improvements of between 0.2% and 5.3% for most categories, whereas ‘human toxicity (non-cancer)’ benefits the most. A variation in primary material content in PV modules (scenario n°3) leads to fewer environmental benefits from recycling in every category, due to there being less primary material content to be replaced. For the special case of ‘freshwater ecotoxicity’; however (Figure 6f), the horizontal −100% line indicates that the original benefits from recycling face a reduction of 100%. In other words, benefits went down to zero. Values above this line mean that recycling will still lead to environmental benefits, fewer than in the baseline (Figure 4 and Figure 5). Values below this, as is the case in this category, mean that recycling is now leading to additional burdens on the environment. Reducing transport distances as assumed in scenario n°4 has on average the greatest influence, especially in the category ‘resource depletion’, with improvements up to 20%. What can be seen from scenario n°5 is that when combining all the above assumptions, recycling has smaller relative environmental benefits as it would have under current conditions (Figure 4 and Figure 5). Still, recycling would lead to overall environmental benefits of up to 17.2% for ‘human toxicity (non-cancer)’, with an exception for ‘freshwater toxicity’, where the burdens overlay the benefits.
3.3. Greenhouse Gas Emissions
Potentially avoided greenhouse gas emissions are calculated for each approach as a measure of the global warming potential. For practical purposes, these are displayed as kg CO2-eq per kilogram of recycled waste, since these units make the calculation of cumulated greenhouse gas over a time period more comprehensible. It can be seen in Figure 7 that the potential to avoid CO2 emissions is highest for approaches n°5 and n°6, almost twice as high as the CO2 savings from the basic recycling approaches.
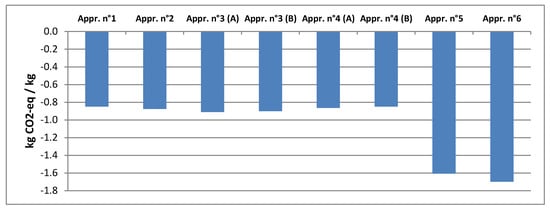
Figure 7.
Potentially avoided greenhouse gas production of each approach.
3.4. Energy Payback Time
Table 4 shows the cumulative energy demand (CED) and Energy Payback Time (EPBT) of a 3 kWp plant without the EoL phase as a reference to evaluate the contribution of EoL management. The table further shows the potential reduction in CED and EPBT that arises from the energy savings obtained through the different recycling scenarios. For mono-Si systems the EPBT reduction potential lies between 2.4% and 4.7%. In the case of multi-Si, reductions of about 3.6% up to 7.1% are plausible. This equals an improvement of about one to three months for the EPBT.
Table 4.
Energy metrics with and without effects from EoL management.
4. Discussion
The analysis performed within this study shows that dedicated material recovery has a significant influence on reducing the global warming potential of PV electricity. It can be seen that implementing dedicated recovery approaches could contribute, to a great extent, to the reduction of greenhouse gas emissions inherent in module production. The high savings of CO2 emissions come from the reduced need for primary materials which are now being substituted by those recovered through recycling. Table 5 shows the potentially avoided greenhouse gas emissions in tons of CO2-eq when combining the results obtained from the analysis with the average amounts of cumulative PV waste as predicted by IRENA [28] until the year 2040 and 2050. Minimum and maximum values are given in consideration of the approaches with the lowest and highest potentials:
Table 5.
Potentially avoided greenhouse gas emissions.
By 2040, the avoided greenhouse gas emissions from recycled PV material in Germany could add up to two to four million tons, which equals around 10% of the possibly avoided average global emissions. By 2050, the same analysis results in possible emissions avoided of around three to seven million tons in Germany, accounting for 6% of the global greenhouse gas emissions that could be avoided by PV recycling. These estimations represent an ideal scenario under the assumption that all the PV waste produced until then will be recycled using any of the studied approaches. To put this in perspective, the average global CO2 emissions in 2014 were about 5 tons per capita [29].
The results show that current module recycling has moderate to low influence on the EPBT of PV systems. The maximum potential EPBT reduction is found for multi-Si and is of about three months. It is worth mentioning again that the CED used to calculate the EPBT takes into account the energy demand of the whole plant while the energy savings obtained through recycling were calculated only for the treatment of the modules. Additional energy savings and thus higher improvements in the EPBT will be obtained if the whole system undergoes recycling.
This study was conducted for the specific conditions in Germany, which differ greatly from those considered in other studies. The same applies for the boundary conditions, as is the case for some transportation steps and final disposal processes, which were often not taken into account. Additionally, different initial module compositions were used in all of the studies analyzed. For example, the study from [12], where dedicated recovery was initially studied, assumes a module mass of 22 kg, which is 37.5% heavier than the model studied here. These facts make direct comparability impossible. Clarity and transparency when describing the system boundaries become of high relevance for the correct understanding of these differences.
Cost-effectiveness of investments in recycling infrastructure will be heavily influenced by the waste composition and volumes of material to process. Accurate estimation of these parameters is therefore necessary when assessing technical and economic viability for a proper settlement of a recycling industry. Miscalculations, in a business where profits are already low, will most likely lead to economic loss. This can be exemplified with the silver content present in the modules. Reasonably, and due to scarcity and the environmental burden of its mining, research efforts are already aiming at reducing the amount of metal used. However, if the silver content reaches a certain minimum, dedicated recycling could lose economic appeal and, if no other recovery technique has been developed, silver will probably, at a slow rate, end up in landfills.
From the sensitivity analysis it can be seen that the benefits of energy recovery are lower when the production energy comes from renewable sources. Scenario n°1 shows that energy recovery (as in approach n°2) does not have the same impacts in a system based on a cleaner grid as when substituting electricity coming from a more fossil-based grid (as in approach n°1). Additionally, it can be seen that the primary material content is the parameter with the highest influence on the environmental benefits from waste management. It was demonstrated that reducing the primary material content in the modules (scenario n°3) lowers the potential benefits of recycling to a great extent. In other words, the more recycled material is used, the lower the impacts are from module recycling, as can especially be observed in the impact category ‘Freshwater ecotoxicity’. With the assumed primary material content of the sensitivity analysis, this effect overcomes the estimated increased benefits obtained from recycling (as observed in scenario 5); however, it is also expected that the impacts of module manufacturing will lower considerably under the same consideration thus improving the overall footprint of electricity.
PV waste management will gain relevance when the impacts of electricity generation become smaller. PV recycling benefits will be more significant for low-impact optimized PV electricity production, for which the benefits of recycling will be found in a similar order of magnitude as the quantified environmental impacts of electricity generation. This can be achieved with better and more efficient industrial manufacturing processes both energy- and material wise.
5. Conclusions
Within this contribution, six different approaches of recycling of PV modules have been compared with respect to their impact on the environmental footprint of electricity production from a standard PV system. As has been shown, dedicated recycling as presented in approach n°5 and n°6 carries the best potential to improve the environmental footprint of PV electricity production. Future analysis should take into account the benefits of recycling of the whole system, including inverter and other BOS components, to further highlight the potential of environmental benefits through recycling. The overall balance shows that the benefits overlay the burdens in all the approaches and for all the impact categories studied, improving the environmental profile of PV and lowering its EPBT. The specific treatment of the backsheet layer, as seen in approaches n°3 and n°4, does not have a major impact on the environmental profile of recycling the modules under study due to their low mass fraction. It should, however, be taken into consideration that certain materials contained, like the fluorine in the backsheet, can become problematic when taking into account the forecasted increase in waste material flow. Efforts in research should focus on reducing the unrecovered fraction that is being landfilled containing polymers, silicon and metals. The ITRPV technology roadmap [30] already contemplates the content reduction for some of these as a countermeasure. While the processing of PV waste until 2040, as studied here, will be characterized by high silver and silicon content, the roadmap estimates significant material content reductions that could make recycling activities unfeasible from the economic point of view driving more material into landfills. Research is thus required into that subject.
The development of an appropriate recycling network will not only bring benefits in environmental aspects but will also have a great impact on the economics and financial balances of the logistic schemes. Such an assessment must also take into account a policy and legislative framework so that the outcomes meet realistic conditions. Additionally, it is very likely that trade of waste between neighboring countries will arise, given the small amount of installed capacity of certain regions which might be more conveniently managed by imports and exports, adding complexity to the analysis.
There is still plenty of room for improvement in PV waste management. Even when the results from the current approaches seem to entail moderate contributions to the ecological footprint of electricity, further development of these and new other techniques will turn recycling into a relevant tool to make photovoltaics an exemplary technology for the energy transition. Additionally, recycling should still be studied as a whole, including the processing of the BOS components as well as the environmental credits that come with it. This will most likely lead to a greater reduction of the electricity production’s footprint.
Author Contributions
Conceptualization, S.H. and S.P.B.; methodology, S.H. and S.P.B.; software, S.P.B.; validation, S.H.; formal analysis, S.P.B.; investigation, S.H. and S.P.B.; resources, S.H. and S.P.B.; data curation, S.H.; writing—original draft preparation, S.H. and S.P.B.; writing—review and editing, K.-A.W.; visualization, S.P.B.; supervision, S.H.; project administration, K.-A.W.; funding acquisition, K.-A.W. All authors have read and agreed to the published version of the manuscript.
Funding
This research received no external funding.
Conflicts of Interest
The authors declare no conflict of interest.
Appendix A
Table A1.
Potential contribution of waste management to the environmental profile of electricity production with mono-Si modules.
Table A1.
Potential contribution of waste management to the environmental profile of electricity production with mono-Si modules.
| Climate Change | Human Toxicity (Non-Cancer) | Human Toxicity (Cancer Effects) | Particulate Matter | Acidification | Freshwater Ecotoxicity | Resource Depletion | |
|---|---|---|---|---|---|---|---|
| Appr. n°1 | −2.0% | −0.6% | −6.6% | −1.4% | −2.0% | 0.0% | −0.2% |
| Appr. n°2 | −2.0% | −0.9% | −6.8% | −1.5% | −2.0% | −0.1% | −0.2% |
| Appr. n°3 (A) | −2.1% | −0.7% | −6.7% | −1.5% | −2.0% | 0.0% | −0.2% |
| Appr. n°3 (B) | −2.1% | −0.7% | −6.6% | −1.5% | −2.0% | 0.0% | −0.2% |
| Appr. n°4 (A) | −2.0% | −0.6% | −6.5% | −1.4% | −2.0% | 0.0% | −0.2% |
| Appr. n°4 (B) | −2.0% | −0.6% | −6.5% | −1.4% | −2.0% | 0.0% | −0.2% |
| Appr. n°5 | −3.7% | −4.2% | −7.7% | −4.6% | −3.0% | −1.1% | −12.1% |
| Appr. n°6 | −3.9% | −4.1% | −7.9% | −4.6% | −3.0% | −1.1% | −12.1% |
Table A2.
Potential contribution of waste management to the environmental profile of electricity production with multi-Si modules.
Table A2.
Potential contribution of waste management to the environmental profile of electricity production with multi-Si modules.
| Climate Change | Human Toxicity (Non-Cancer) | Human Toxicity (Cancer Effects) | Particulate Matter | Acidification | Freshwater Ecotoxicity | Resource Depletion | |
|---|---|---|---|---|---|---|---|
| Appr. n°1 | −3.0% | −0.7% | −7.6% | −2.2% | −2.7% | 0.0% | −0.2% |
| Appr. n°2 | −3.1% | −1.0% | −7.9% | −2.3% | −2.8% | −0.1% | −0.2% |
| Appr. n°3 (A) | −3.3% | −0.7% | −7.8% | −2.2% | −2.7% | 0.0% | −0.2% |
| Appr. n°3 (B) | −3.2% | −0.7% | −7.7% | −2.2% | −2.7% | 0.0% | −0.2% |
| Appr. n°4 (A) | −3.1% | −0.7% | −7.6% | −2.2% | −2.7% | 0.0% | −0.2% |
| Appr. n°4 (B) | −3.0% | −0.7% | −7.6% | −2.2% | −2.7% | 0.0% | −0.2% |
| Appr. n°5 | −5.8% | −4.5% | −9.0% | −7.1% | −4.1% | −1.2% | −11.0% |
| Appr. n°6 | −6.1% | −4.5% | −9.2% | −7.1% | −4.1% | −1.2% | −11.0% |
References
- Choi, J.-K.; Fthenakis, V. Crystalline silicon photovoltaic recycling planning. Macro and micro perspectives. J. Clean. Prod. 2014, 66, 443–449. [Google Scholar] [CrossRef]
- McDonald, N.C.; Pearce, J.M. Producer responsibility and recycling solar photovoltaic modules. Energy Policy 2010, 38, 7041–7047. [Google Scholar] [CrossRef]
- D’Adamo, I.; Miliacca, M. Rosa, Paolo Economic Feasibility for Recycling of Waste Crystalline Silicon Photovoltaic Modules. Int. J. Photoenergy 2017, 2017, 1–6. [Google Scholar] [CrossRef]
- Heinemann, D.; Jürgens, W.; Knecht, R.; Parisi, J. A historical module: The TSG MQ 36/0 solar panel. Einblicke 2011, 54, 6–11. [Google Scholar]
- Jordan, D.C.; Kurtz, S.R. Photovoltaic Degradation Rates—An Analytical Review. Prog. Photovolt. Res. Appl. 2013, 21. [Google Scholar] [CrossRef]
- Virtuani, A.; Caccivio, M.; Annigoni, E.; Friesen, G.; Chianese, D.; Ballif, C.; Sample, T. 35 years of photovoltaics: Analysis of the TISO-10-kW solar plant, lessons learnt in safety and performance—Part 1. Prog. Photovolt. Res. Appl. 2019, 328–339. [Google Scholar] [CrossRef]
- Wambach, K. Life Cycle Inventory of Current Photovoltaic Module Recycling Processes in Europe; IEA PVPS Task12, Subtask 2, LCA Report IEA-PVPS T12-12:2017; National Renewable Energy Lab. (NREL): Golden, CO, USA, 2017. [Google Scholar]
- Held, M. LCA screening of a recycling process for silicon based PV modules. In Proceedings of the Symposium conducted at PV Cycle Conference, Rome, Italy, 12–13 February 2018. [Google Scholar]
- Giacchetta, G.; Leporini, M.; Marchetti, B. Evaluation of the environmental benefits of new high value process for the management of the end of life of thin film photovoltaic modules. J. Clean. Prod. 2013, 51, 214–224. [Google Scholar] [CrossRef]
- Duflou, J.; Peeters, J.; Altamirano, D.; Bracquene, E.; Dewulf, W. Demanufacturing photovoltaic panels: Comparison of end-of-life treatment strategies for improved resource recovery. CIRP Ann. Manuf. Technol. 2018, 67, 29–32. [Google Scholar] [CrossRef]
- Latunussa, C.E.L.; Ardente, F.; Blengini, G.A.; Mancini, L. Life Cycle Assessment of an innovative recycling process for crystalline silicon photovoltaic panels. Sol. Energy Mater. Sol. Cells 2016, 156, 101–111. [Google Scholar] [CrossRef]
- Latunussa, C.; Mancini, L.; Blengini, G.; Ardente, F.; Pennington, D. Analysis of Material Recovery from Photovoltaic Panels; EUR 27797; Publications Office of the European Union: Luxembourg, 2016. [Google Scholar] [CrossRef]
- Ardente, F.; Latunussa, C.; Blengini, G. Resource efficient recovery of critical and precious metals from waste silicon PV panel recycling. Waste Manag. 2019, 91, 156–167. [Google Scholar] [CrossRef] [PubMed]
- Aryan, V.; Danz, P.; Maga, D.; Brucart, M.F. End-of-Life Pathways for PV Backsheets; Final Report; Fraunhofer UMSICHT: Oberhausen, Germany, 2017. [Google Scholar]
- Komoto, K.; Lee, J.-S. End-of-Life Management of Photovoltaic Panels: Trends in PV Module Recycling Technologies; IEA PVPS Task12, Subtask 1, Recycling Report IEA-PVPS T12-10:2018; National Renewable Energy Lab. (NREL): Golden, CO, USA, 2018. [Google Scholar]
- Dias, P.; Javimczik, S.; Benevit, M.; Veit, H. Recycling WEEE. Polymer characterization and pyrolysis study for waste of crystalline silicon photovoltaic modules. Waste Manag. 2017, 60, 716–722. [Google Scholar] [CrossRef] [PubMed]
- Dias, P.; Javimczik, S.; Benevit, M.; Veit, H.; Bernardes, A.M. Recycling WEEE. Extraction and concentration of silver from waste crystalline silicon photovoltaic modules. Waste Manag. 2016, 57, 220–225. [Google Scholar] [CrossRef] [PubMed]
- Huang, W.-H.; Shin, W.J.; Wang, L.; Sun, W.-C.; Tao, M. Strategy and technology to recycle wafer-silicon solar modules. Sol. Energy 2017, 144, 22–31. [Google Scholar] [CrossRef]
- Wade, A.; Stolz, P.; Frischknecht, R.; Heath, G.; Sinha, P. The Product Environmental Footprint (PEF) of photovoltaic modules-Lessons learned from the environmental footprint pilot phase on the way to a single market for green products in the European Union. Prog. Photovolt. Res. Appl. 2018, 26, 553–564. [Google Scholar] [CrossRef]
- JRC European Commission. Recommendations Fir Life Cycle Impact Assessment in the European Context. ILCD Handbook; JRC European Commission: Ispra, Italy, 2011; ISBN 978-92-79-17451-3. [Google Scholar]
- Jungbluth, N.; Stucki, M.; Büsser, S.; Flury, K.; Frischknecht, R. Life Cycle Inventories of Photovoltaics; ESU-Services Ltd.: Uster, Switzerland, 2012. [Google Scholar]
- Frischknecht, R.; Heath, G.; Raugei, M.; Sinha, P.; de Wild-Scholten, M.; Fthenakis, V.; Kim, H.C.; Alsema, E.; Held, M. Methodology Guidelines on Life Cycle Assessment of Photovoltaic Electricity, 3rd ed.; IEA PVPS Task 12, International Energy Agency Photovoltaic Power Systems Programme; Report IEA-PVPS T12-06:2016; IEA: Paris, France, 2016; ISBN 978-3-906042-38-1. [Google Scholar]
- Philipps, S.; Warmuth, W. Photovoltaics Report. Fraunhofer Institute for Solar Energy Systems ISE. Available online: https://www.ise.fraunhofer.de/en/publications/studies/photovoltaics-report.html (accessed on 9 March 2020).
- Fraunhofer ISE Energy Charts. Fraunhofer Institute for Solar Energy Systems ISE. Available online: https://www.energy-charts.de (accessed on 9 March 2020).
- International Energy Agency. Energy Policies of IEA Countries; 2013 Review: OECD; IEA: Paris, France, 2013; ISBN 978-92-64-19076-4. [Google Scholar]
- Stolz, P.; Frischknecht, R.; Wambach, K.; Sinha, P.; Heath, G. Life Cycle Assessment of Current Photovoltaic Module Recycling; IEA PVPS Task 12; International Energy Agency Power Systems Programme; Report IEA-PVPS T12-13:2018; IEA: Paris, France, 2017. [Google Scholar]
- O’Connell, R.; Alexander, C.; Alway, B.; Litosh, S.; Nambiath, S.; Wiebe, J.; Yao, W.; Norton, K.; Li, S.; Aranda, D.; et al. World Silver Survey 2018; Produced for The Silver Institute by the GFMS team at Thomson Reuters; The Silver Institute: Washington, DC, USA, 2018; ISBN 978-1-880936-31-3. [Google Scholar]
- IRENA and IEA-PVPS. End-of-Life Management: Solar Photovoltaic Panels; International Renewable Energy Agency and International Energy Agency Photovoltaic Power Systems; IEA: Paris, France, 2016; ISBN 978-92-95111-99-8. [Google Scholar]
- The World Bank. CO2 Emissions (Metric Tons Per Capita) 2018. Available online: https://data.worldbank.org/indicator/EN.ATM.CO2E.PC?end=2014&start=1960 (accessed on 9 March 2020).
- VDMA Photovoltaic Equipment. International Technology Roadmap for Photovoltaic (ITRPV), 8th ed.; Results including Maturity Report; VDMA Photovoltaic Equipment: Frankfurt, Germany, 2017. [Google Scholar]


© 2020 by the authors. Licensee MDPI, Basel, Switzerland. This article is an open access article distributed under the terms and conditions of the Creative Commons Attribution (CC BY) license (http://creativecommons.org/licenses/by/4.0/).