Uplift Bearing Capacity of Cone-Cylinder Foundation for Transmission Line in Frozen Soil Regions, Using Reduced-Scale Model Tests and Numerical Simulations


Abstract
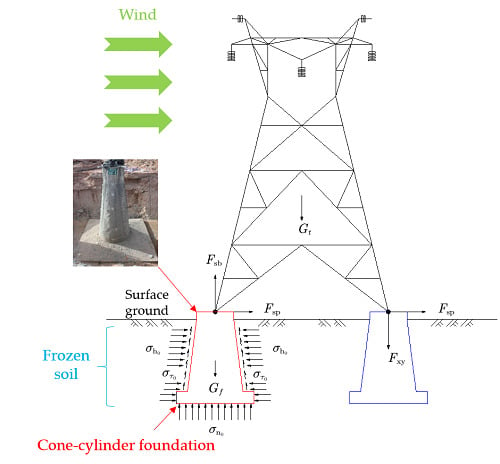
1. Introduction
2. Reduced-Scale Modeling Test
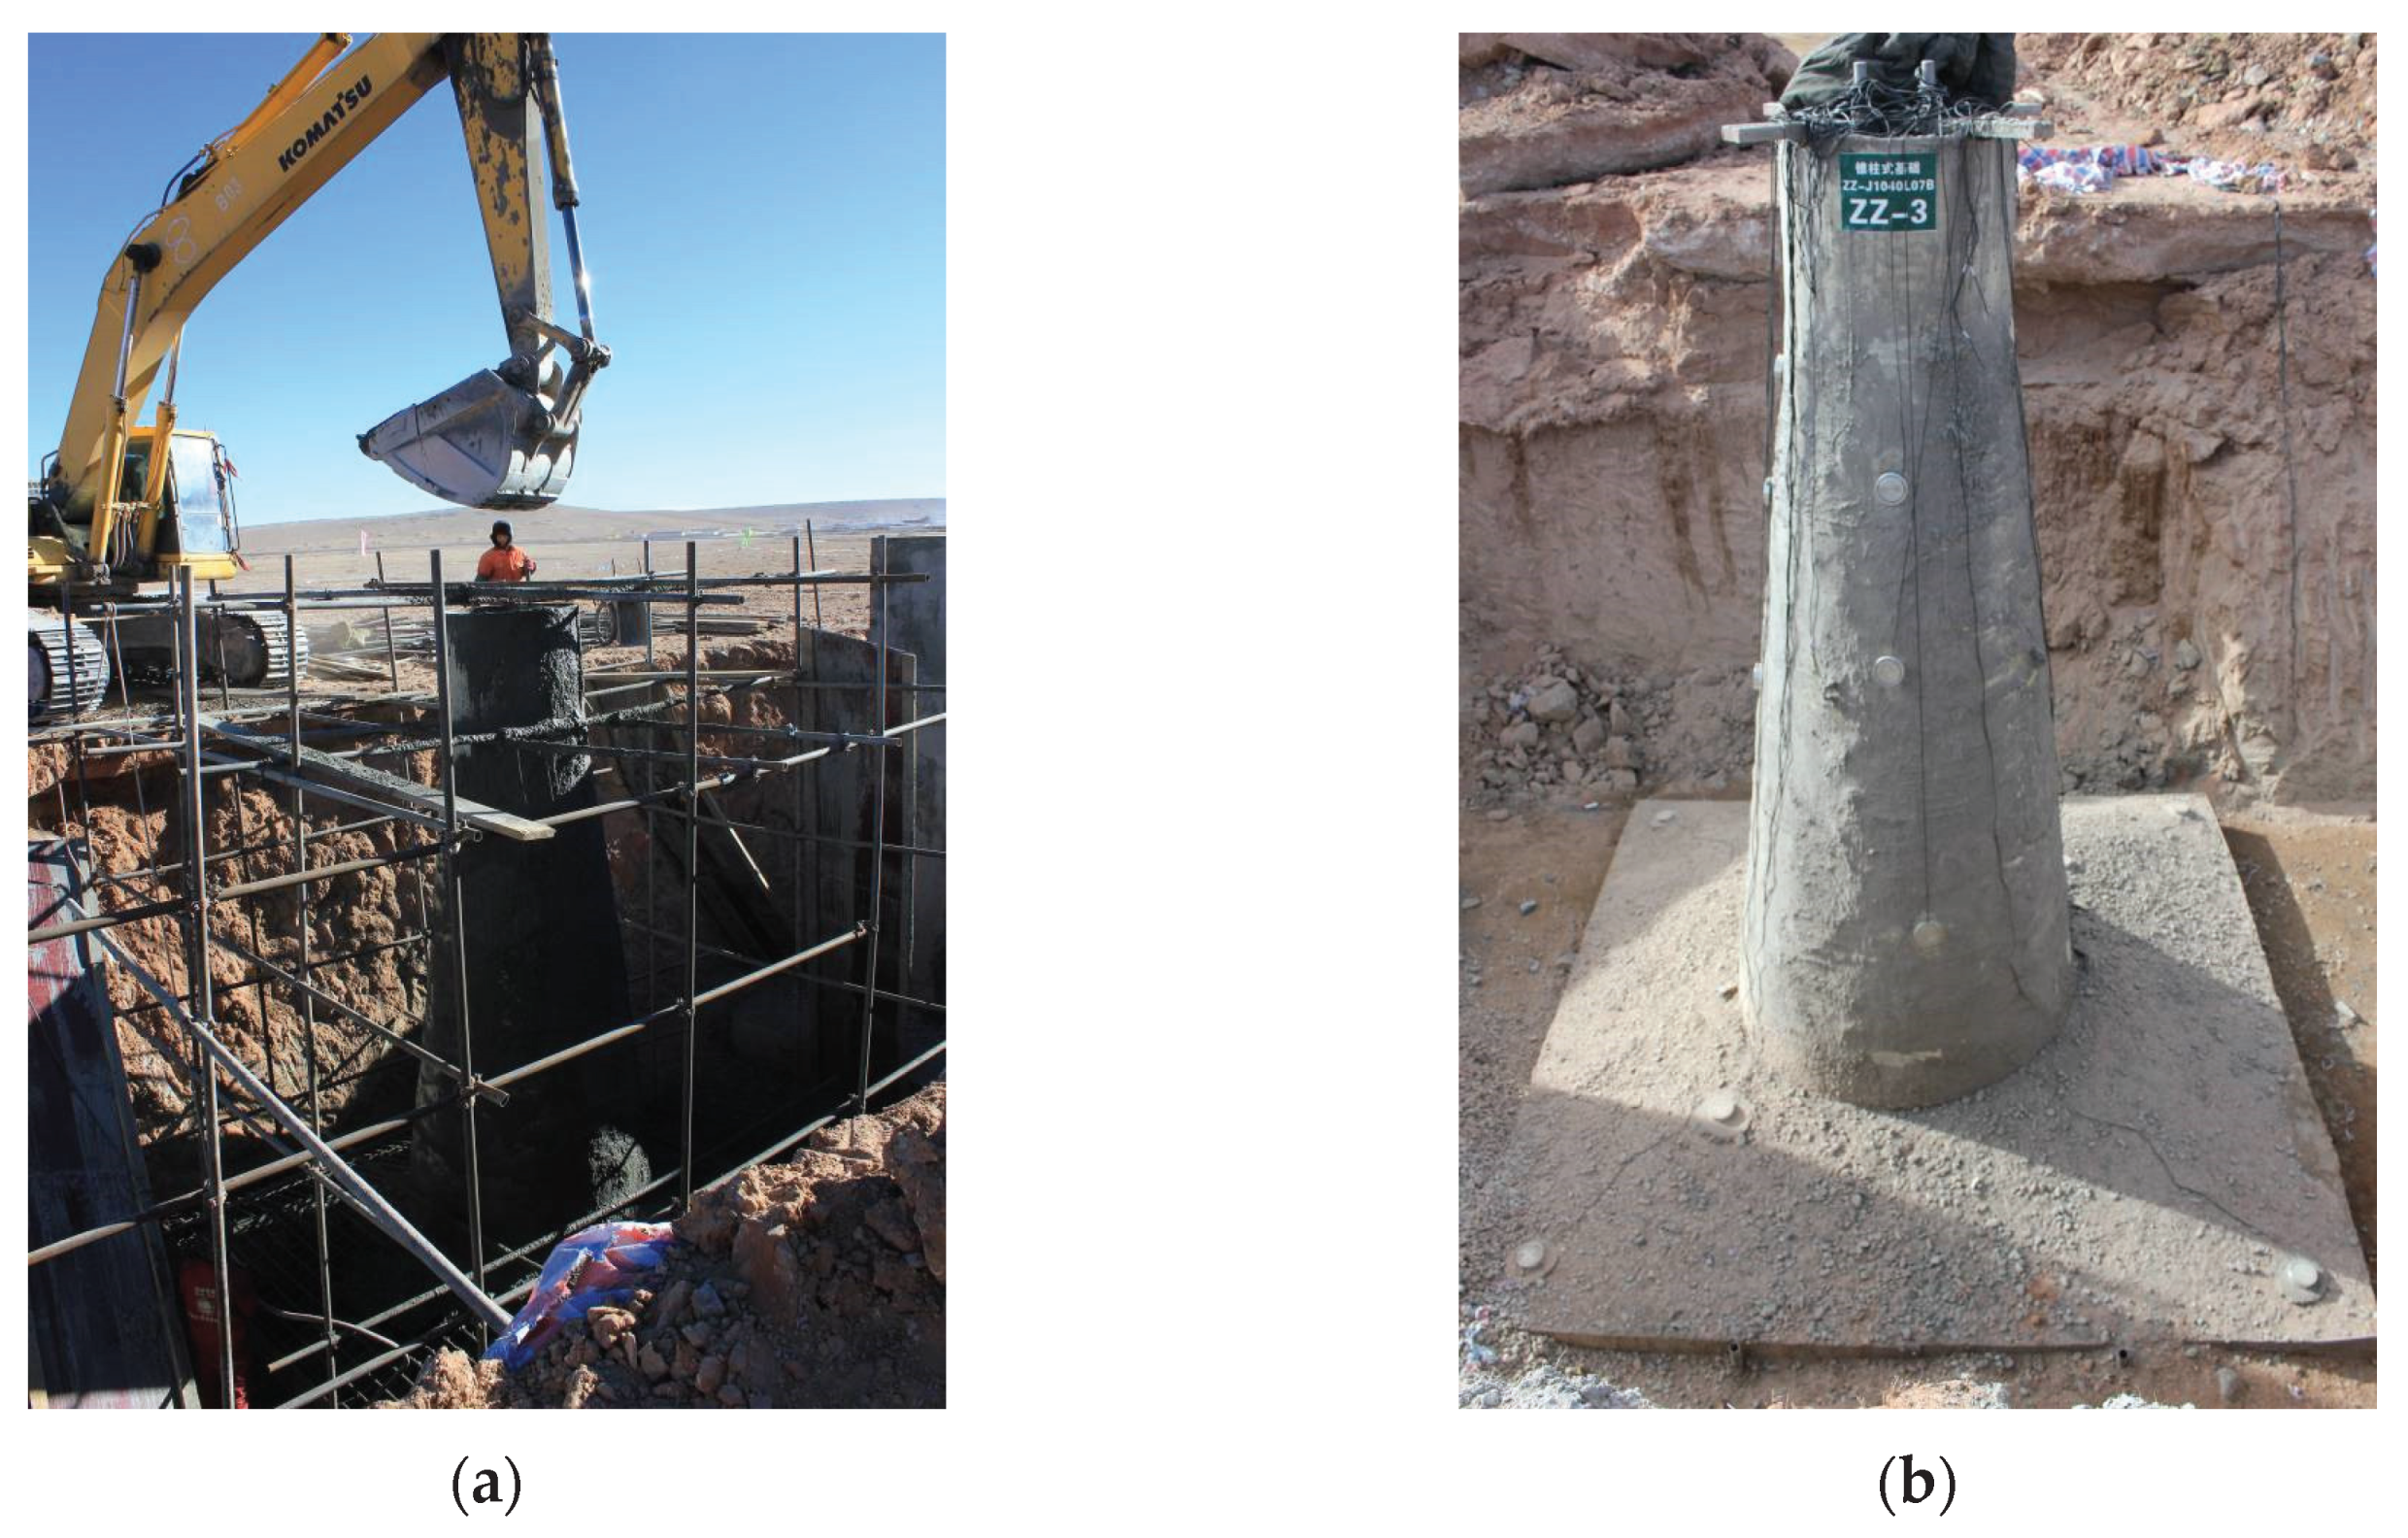
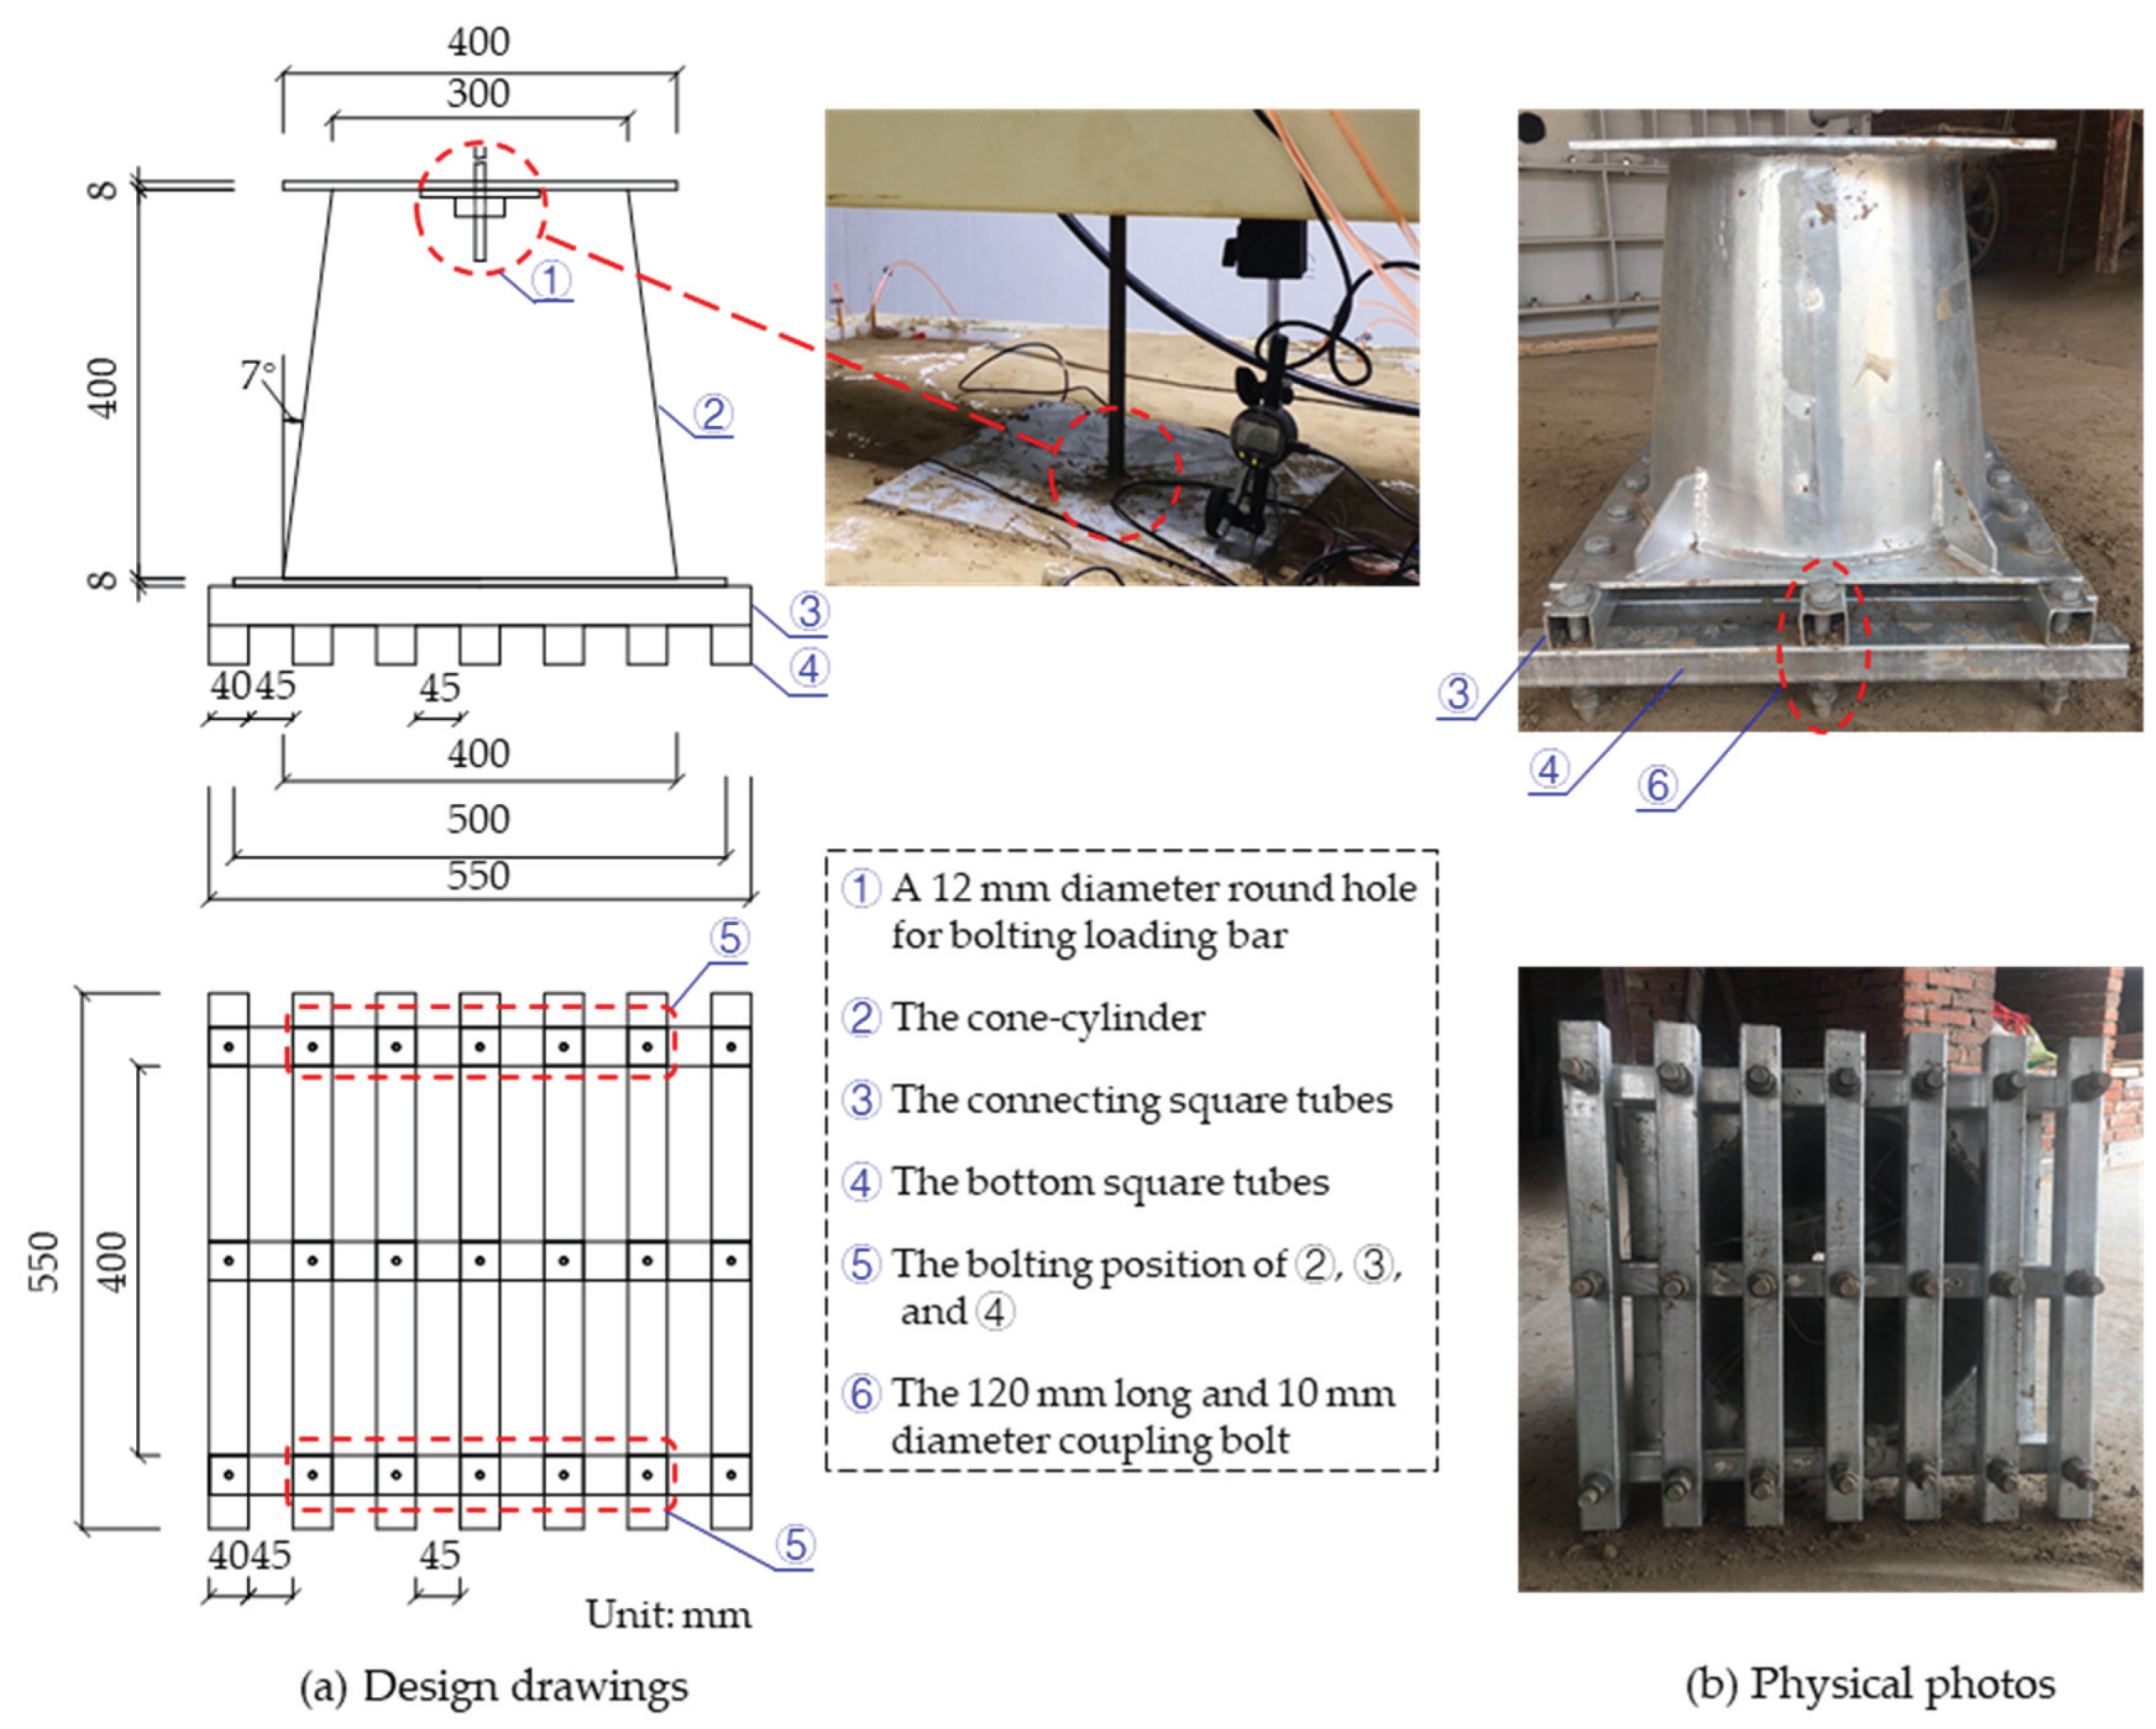
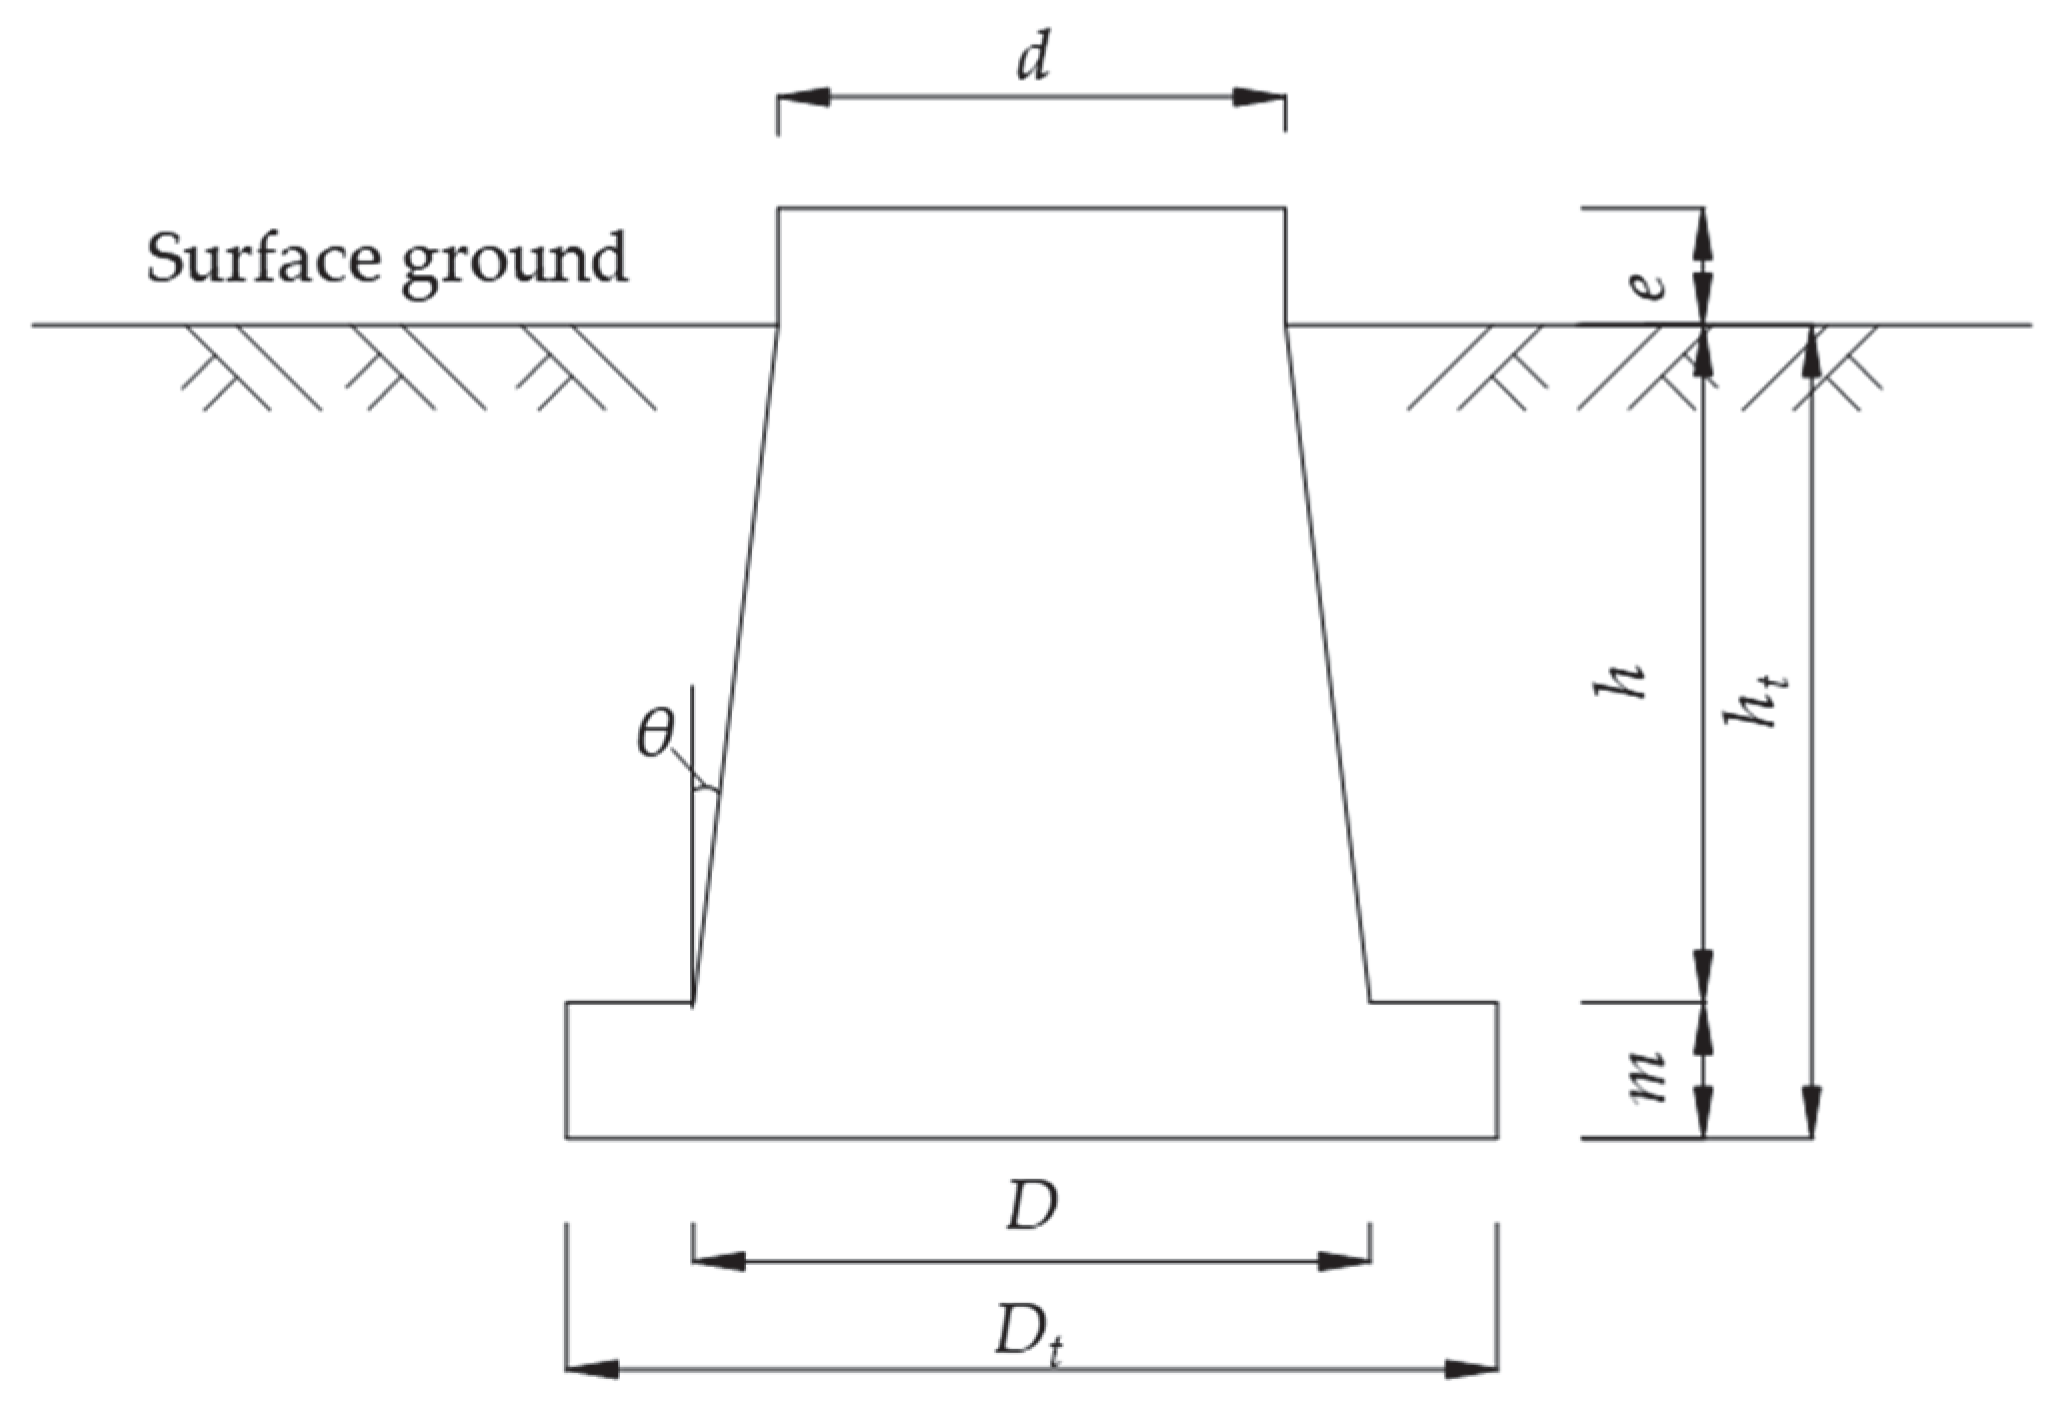
2.1. Pier Design and Soil Properties
2.2. Test Devices and Monitoring Apparatuses
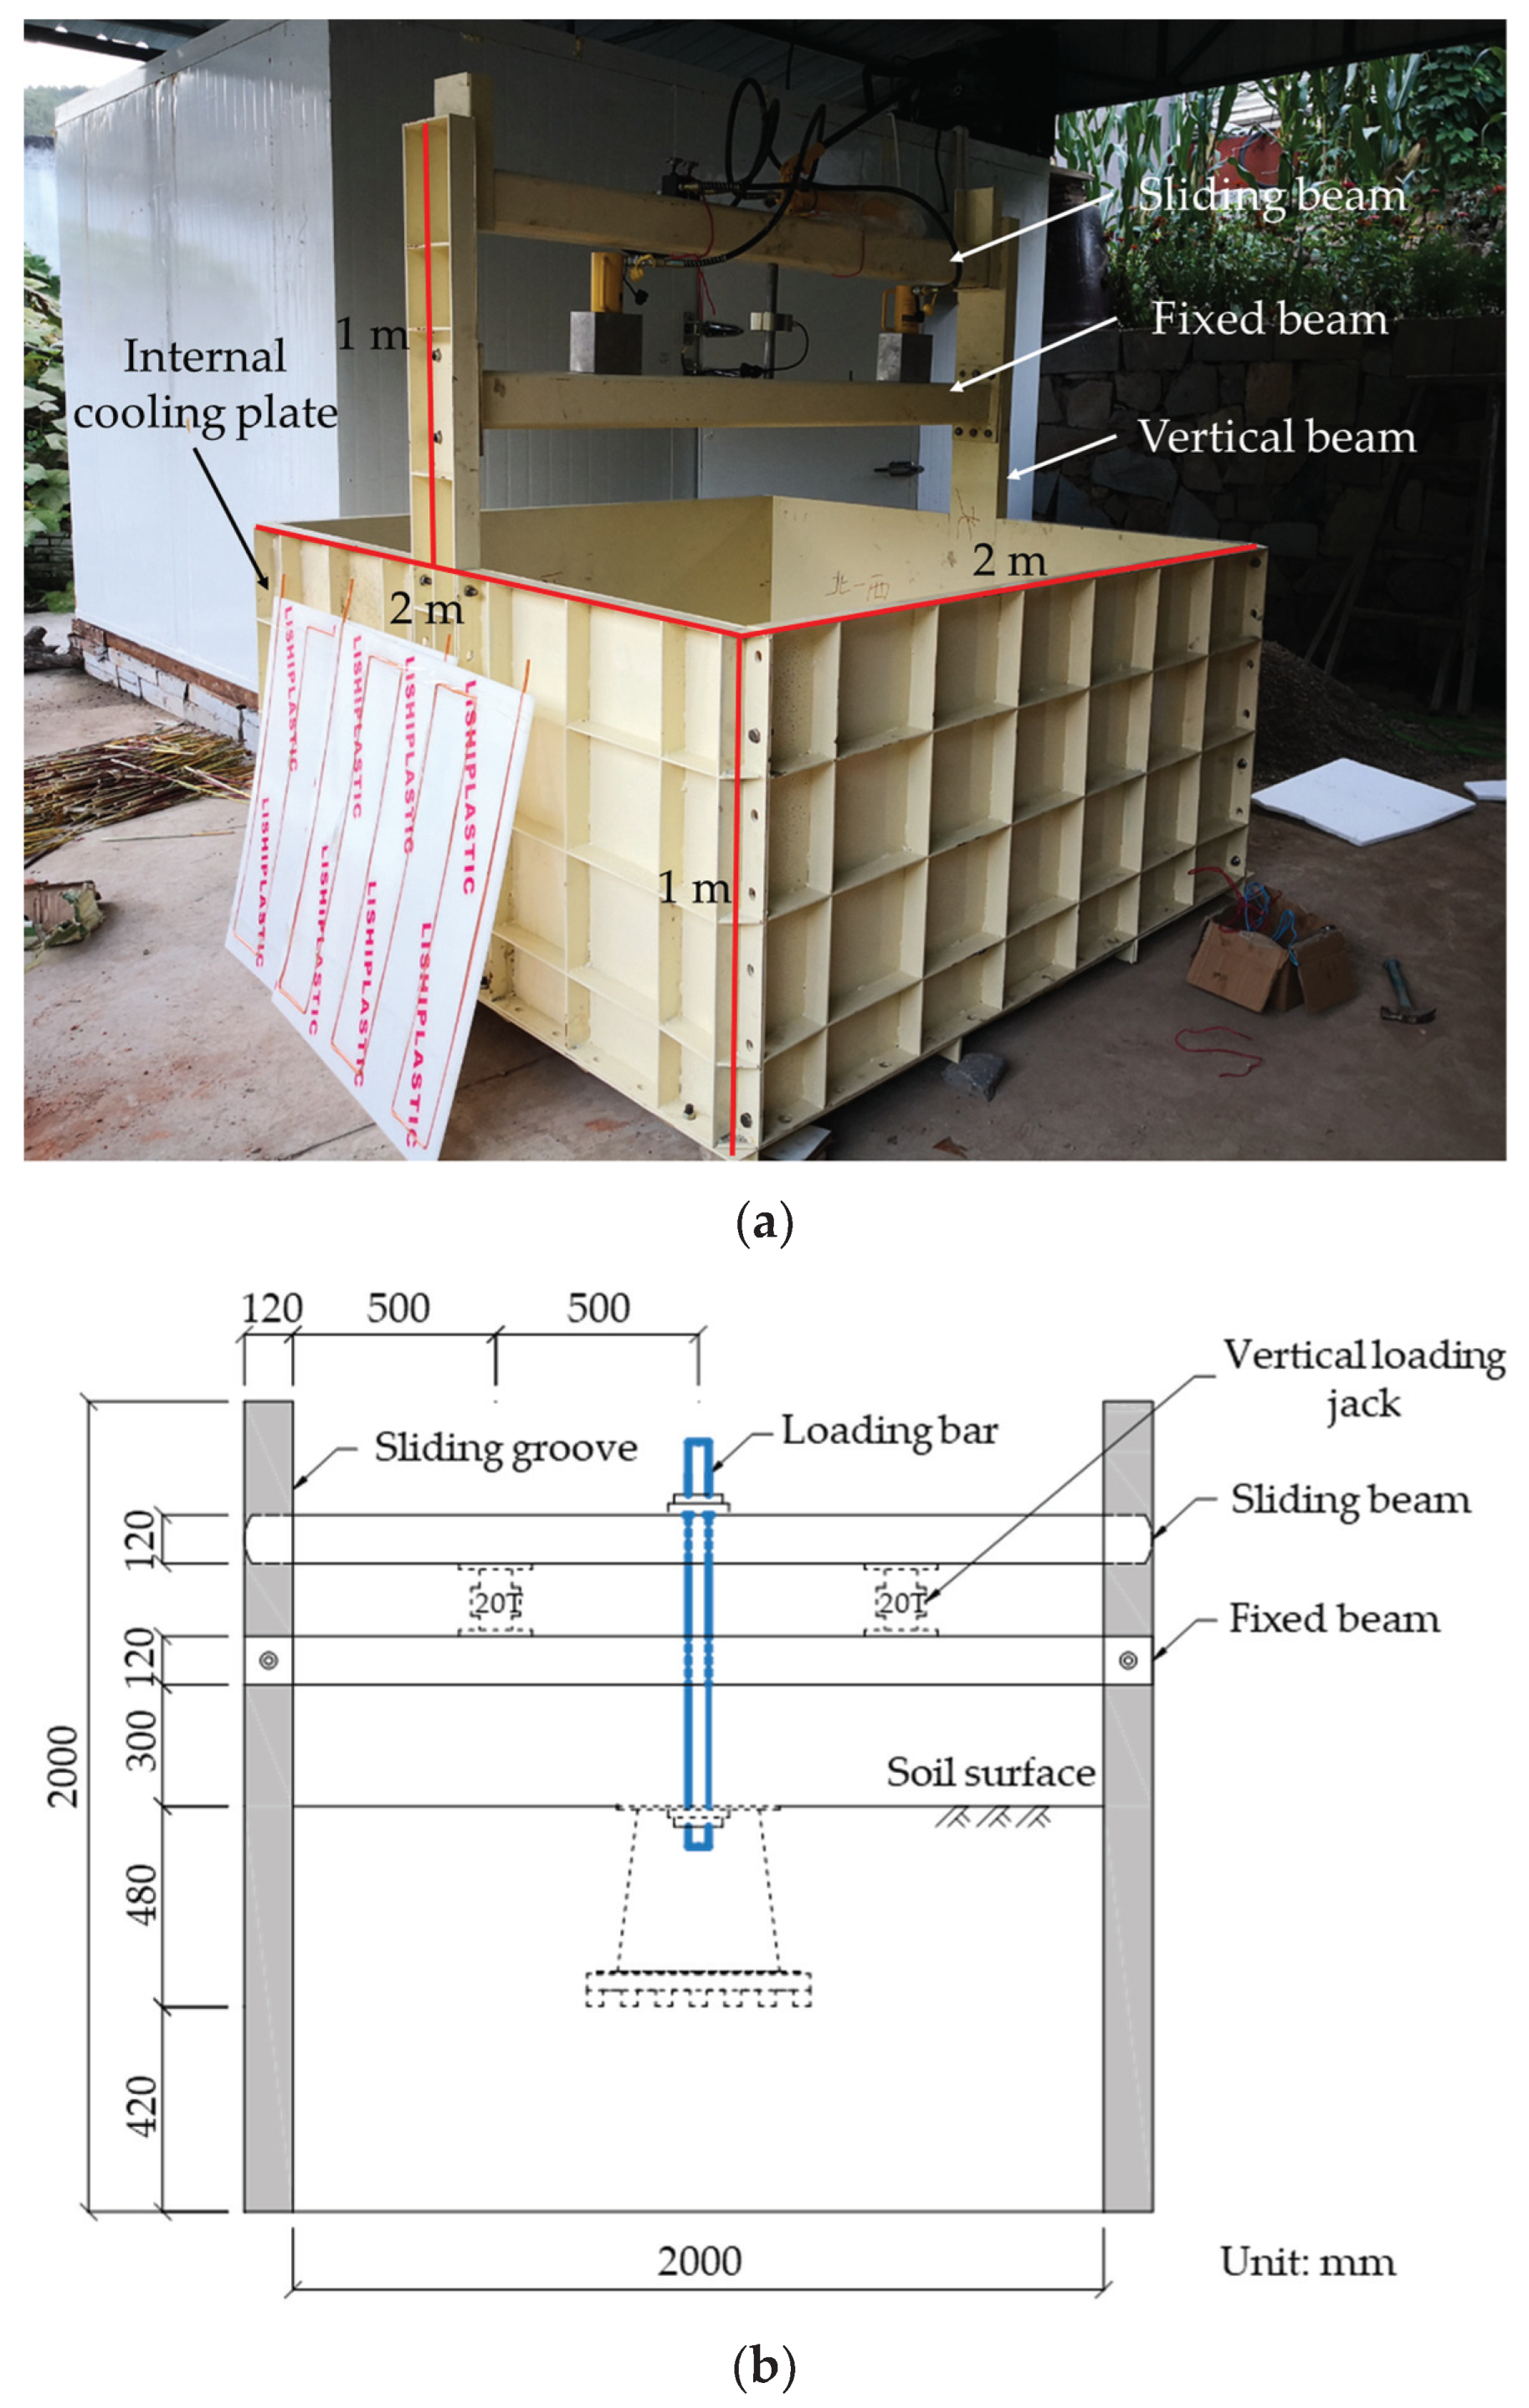
2.2.1. Test Box and Loading System
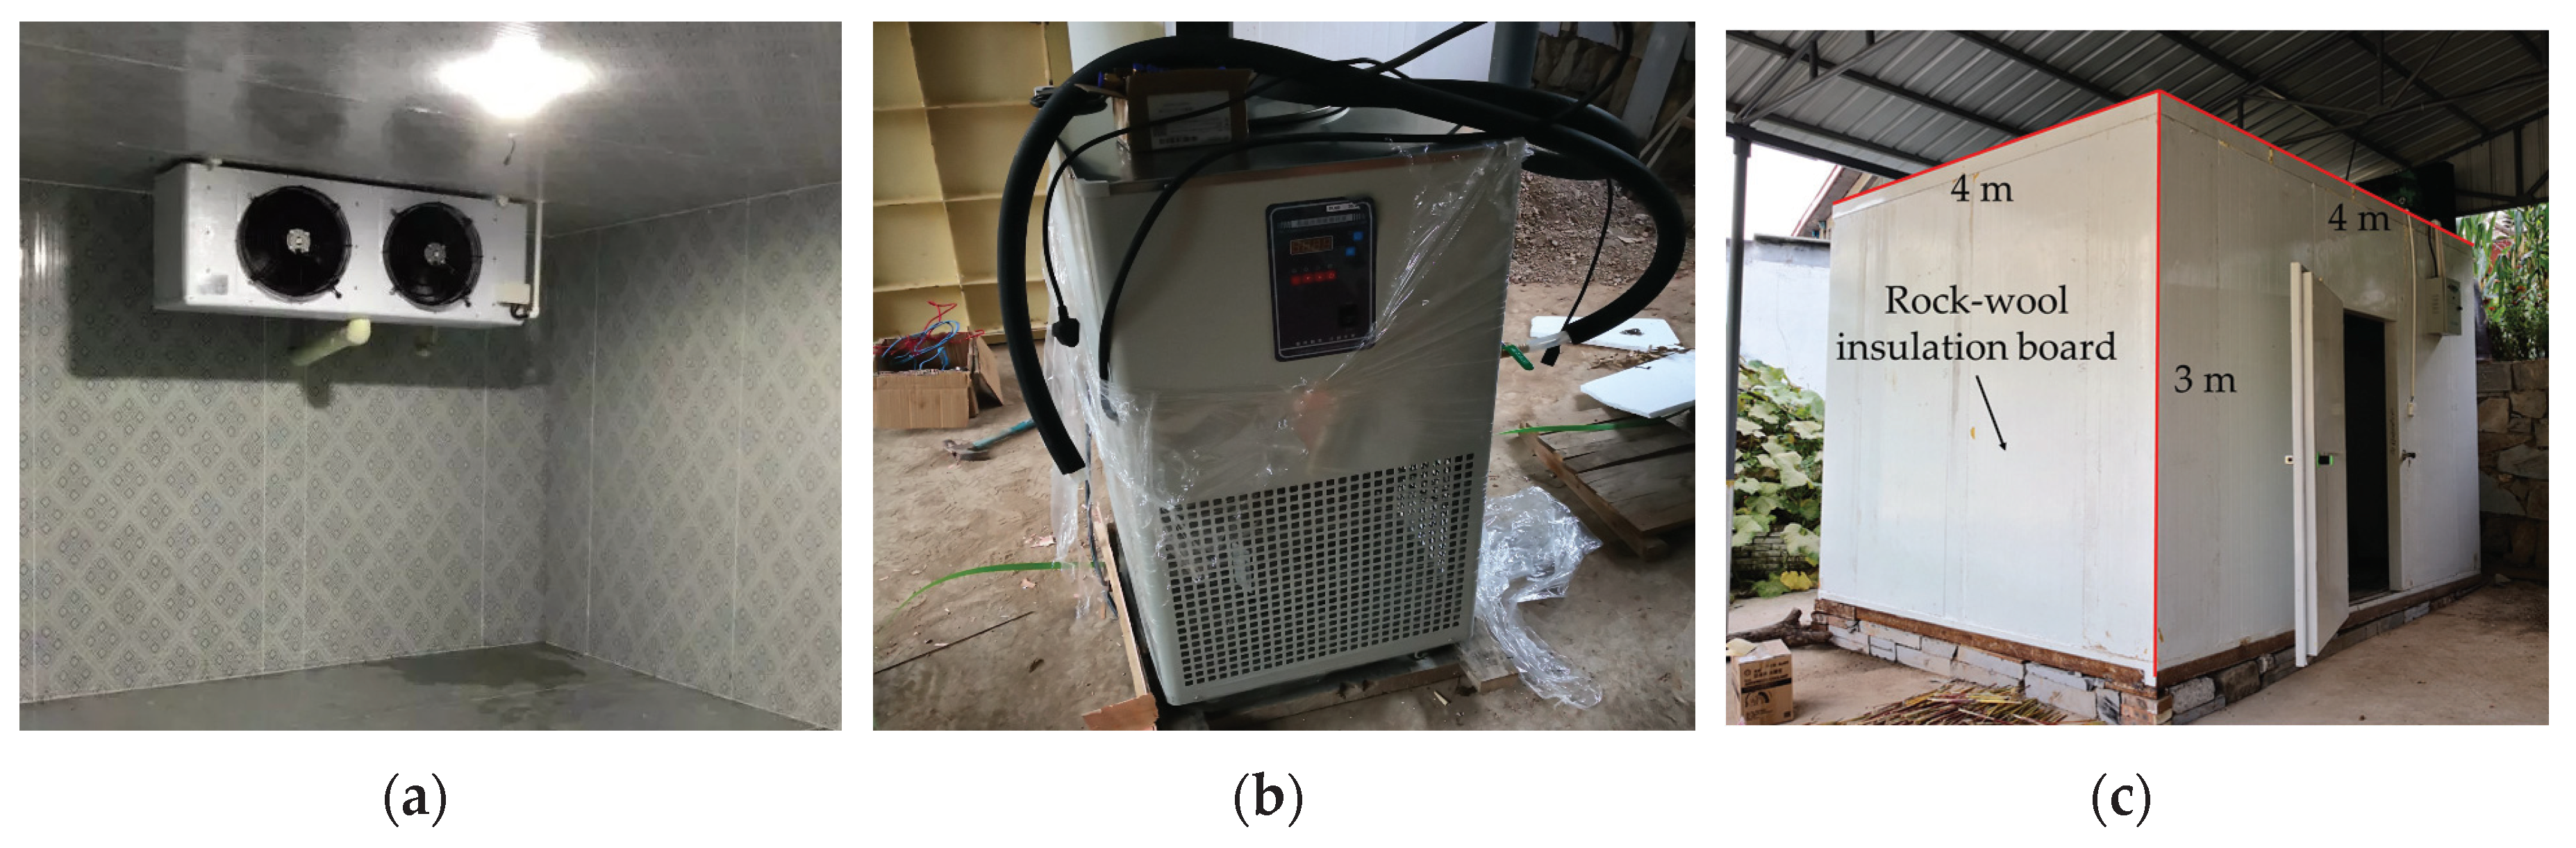
2.2.2. Refrigeration and Insulation Facilities
- (1)
- (2)
- An internal cycle refrigerator (Figure 4b), whose corresponding parameters are 3.5 kW and −50 °C, serves for controlling the temperature of the box walls. This machine can cool and drive the coolant to circulate in 22 mm diameter U-shaped copper tubes, which are placed on the internal cooling plate (Figure 3a). A total of four plates are embedded on the vertical walls of the test box.
- (3)
- The constant temperature chamber (Figure 4c) is composed of five rock-wool boards which are 10 cm thick. The length, width and height of the chamber are 4 m, 4 m, and 3 m, respectively.
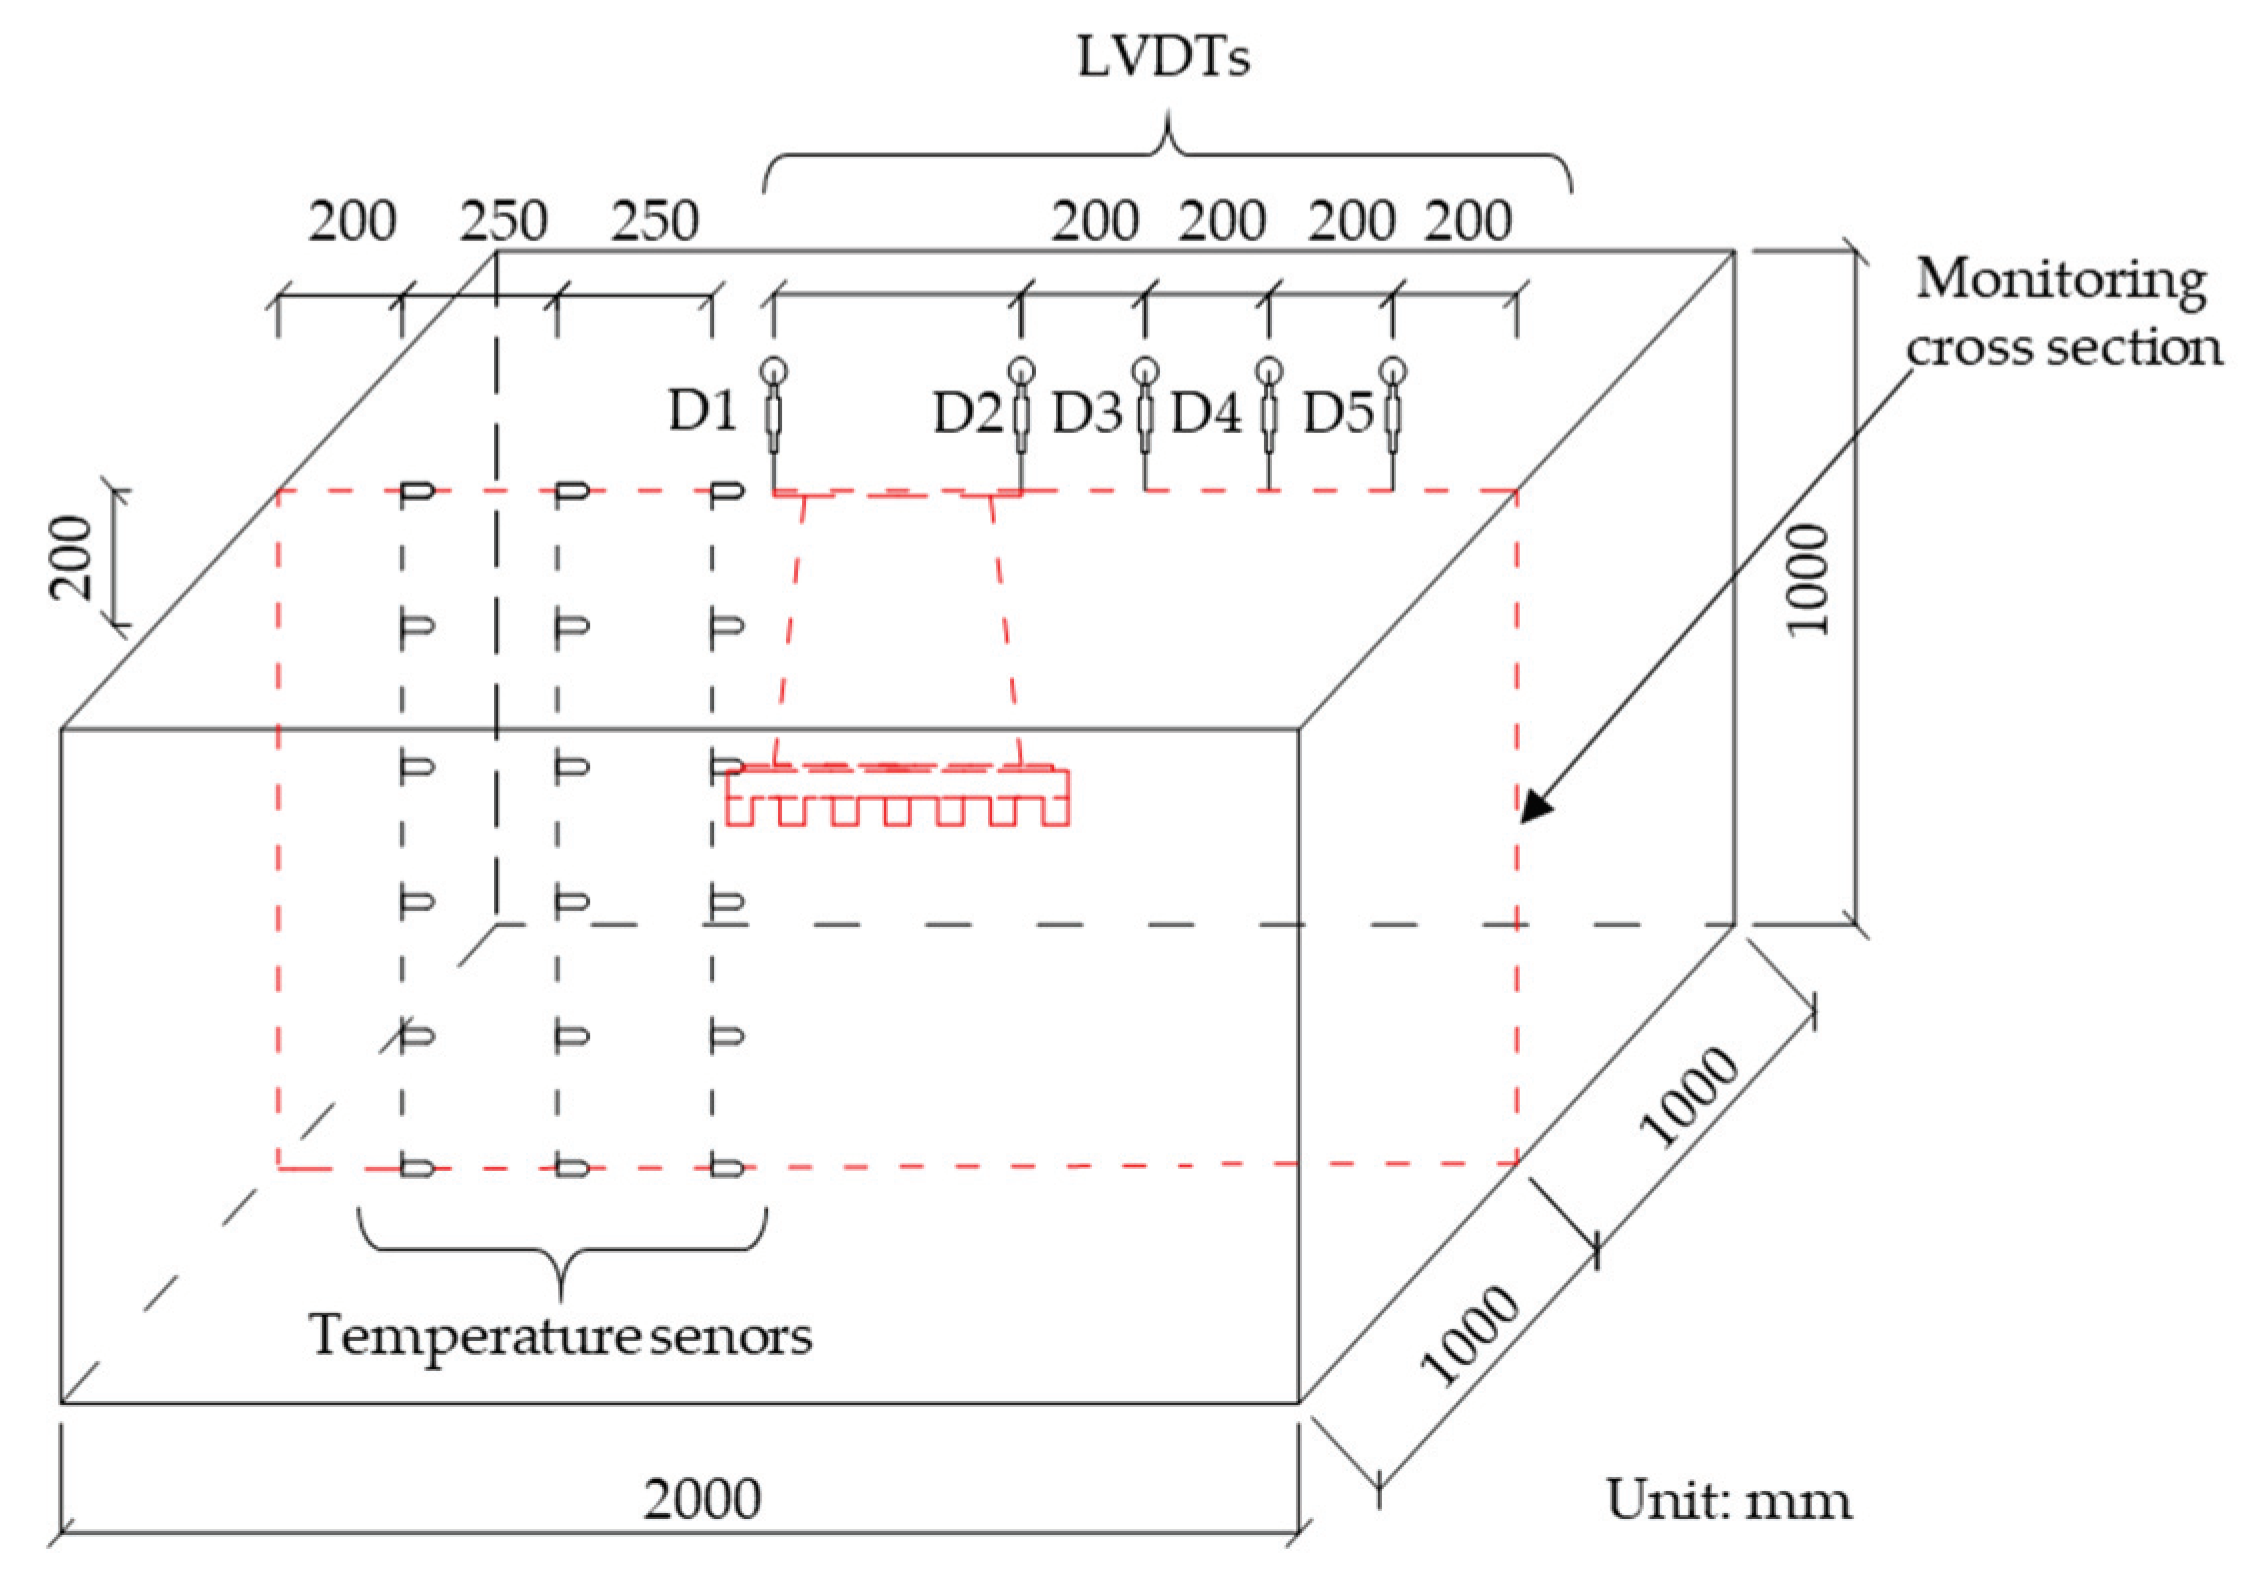
2.2.3. Monitoring Apparatuses
2.3. Test Procedure: Freezing and Loading Process
- (1)
- According to the data of Table 1 and the volume of the test box, about 6 kg test soil with moisture content of 10.4% are prepared and then sealed with plastic film for 24 hours, to make the moisture distribution uniform.
- (2)
- Lay the soil into the test box layer by layer. Each layer is filled with 100 mm and then compacted to 80 mm to ensure the compactness is 80% and the distributions is uniform. When the buried thickness reaches 420 mm, the foundation will be placed in the center of the test box, and then the soil is filled again until it reaches 1000 mm. Overall, 18 temperature sensors are buried at this stage.
- (3)
- Install the surface monitoring instruments and prepare for freezing.
2.4. Test Results and Analysis
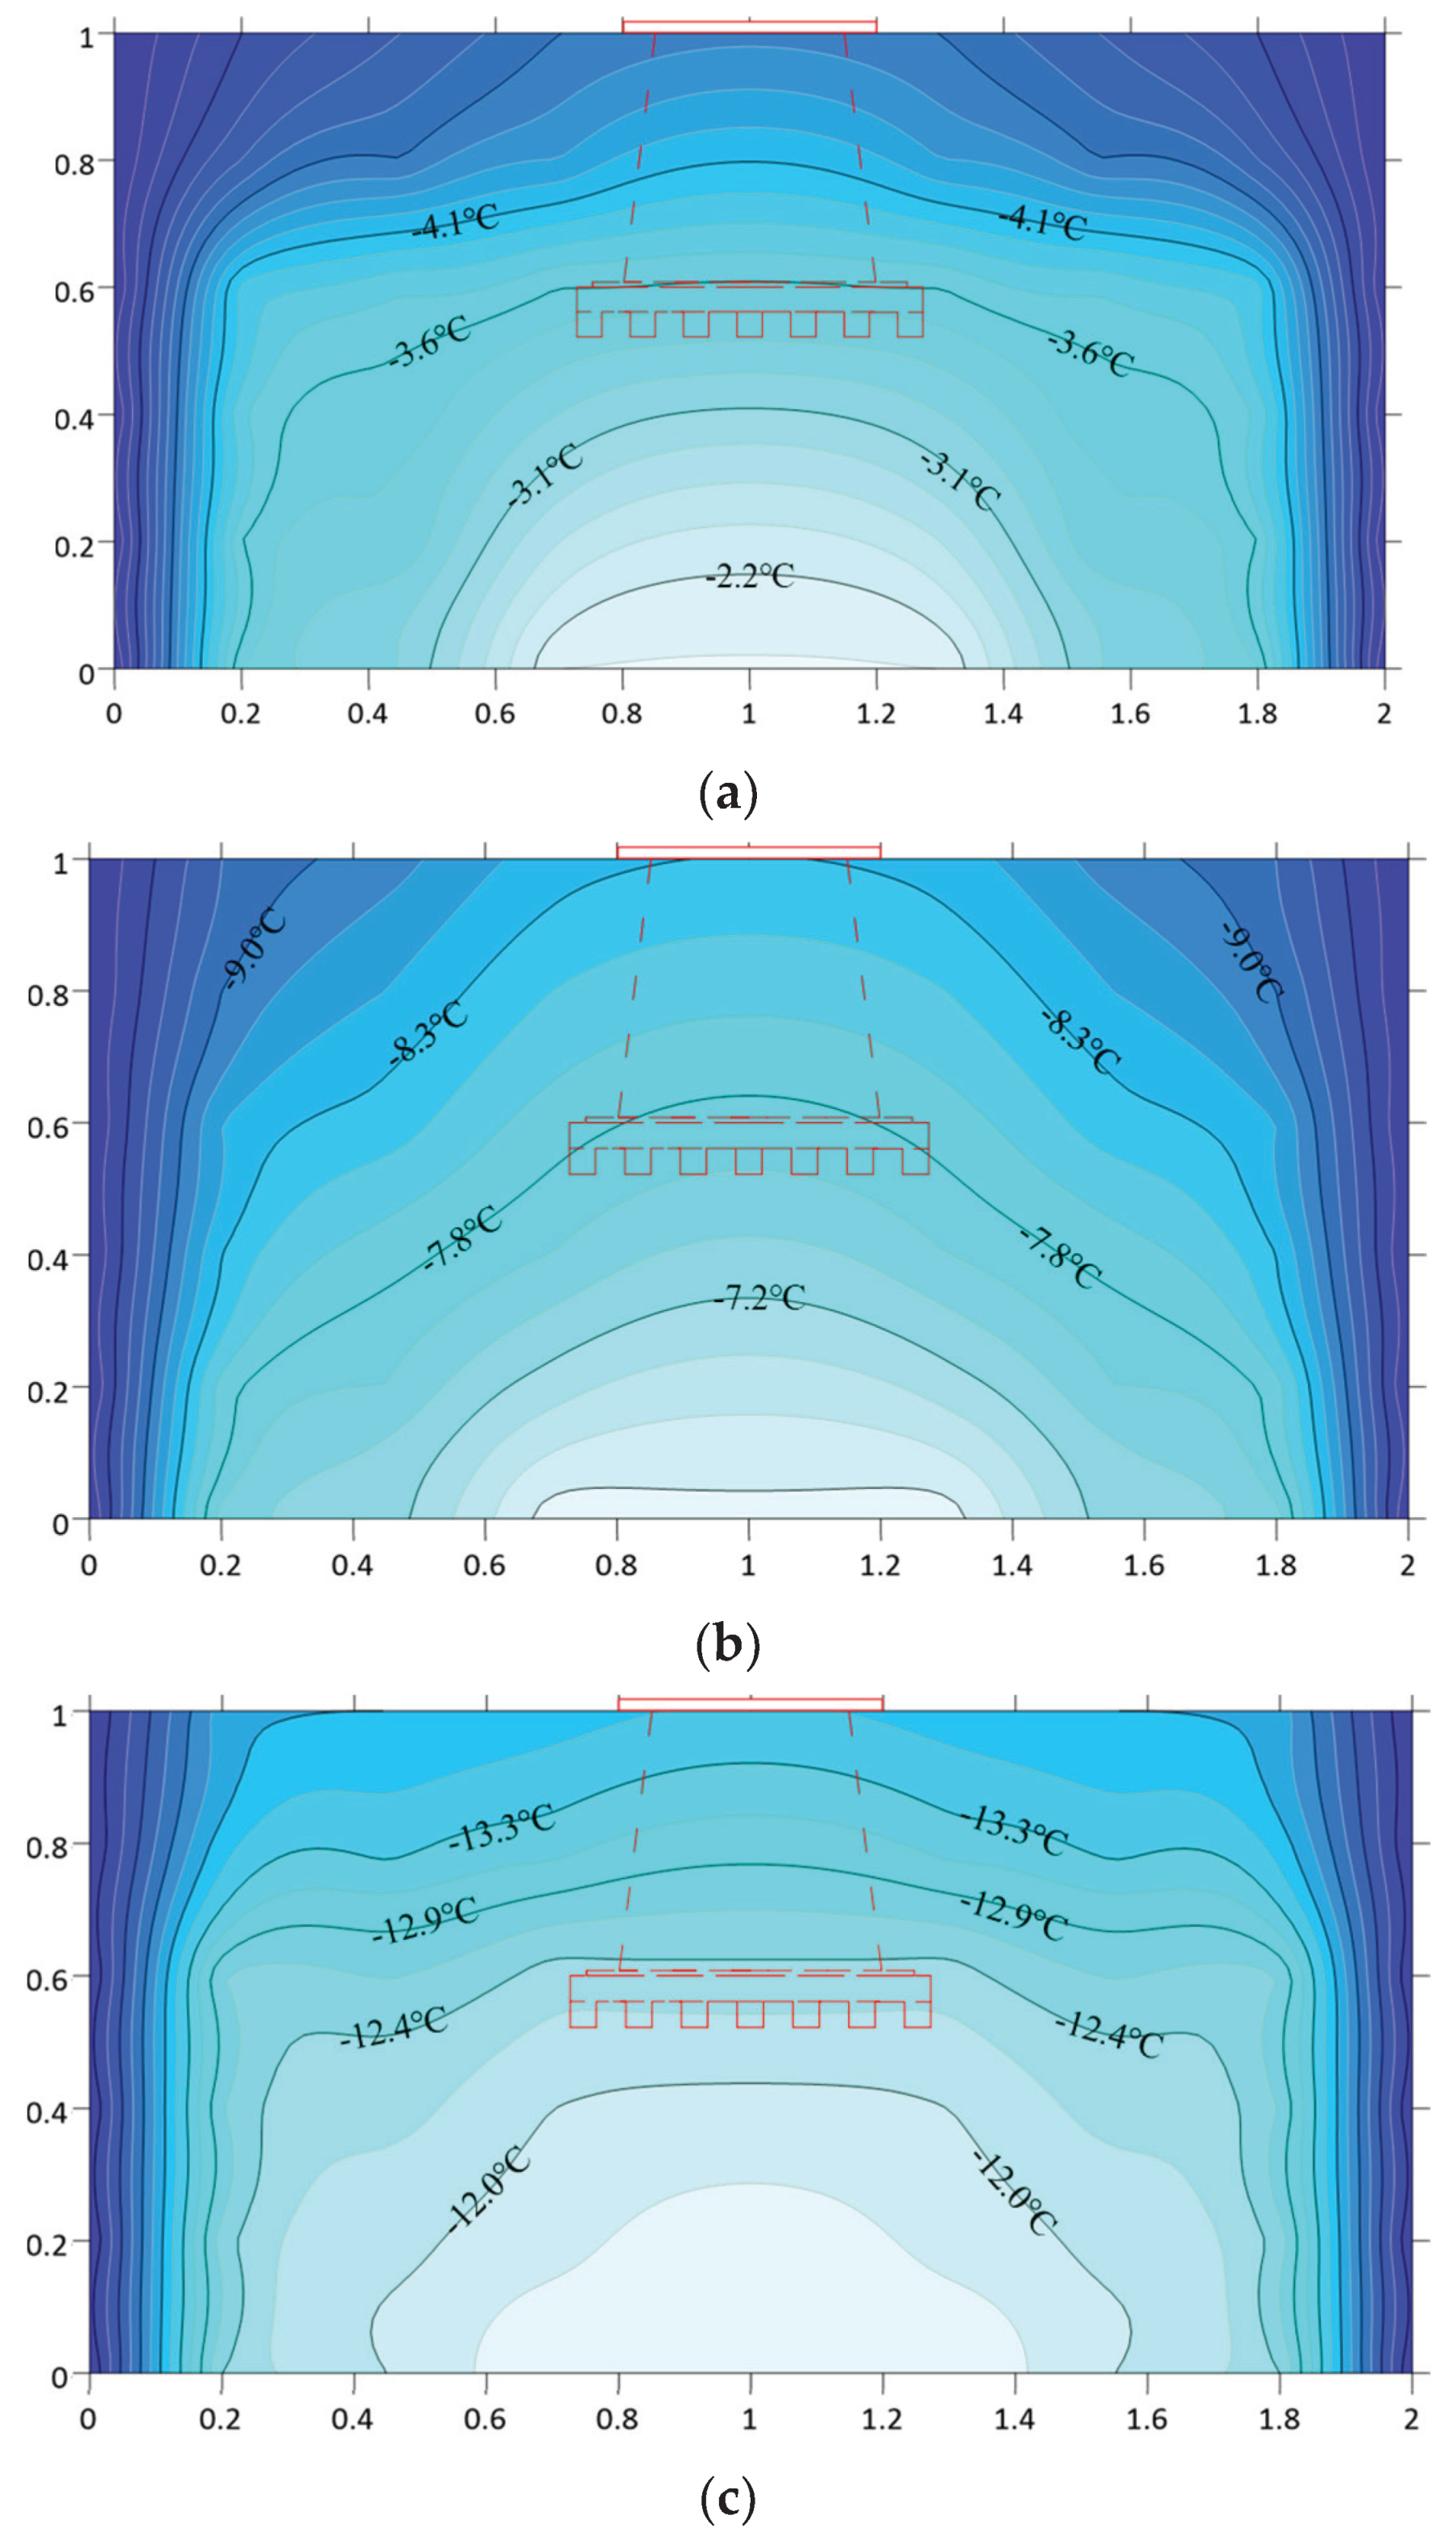
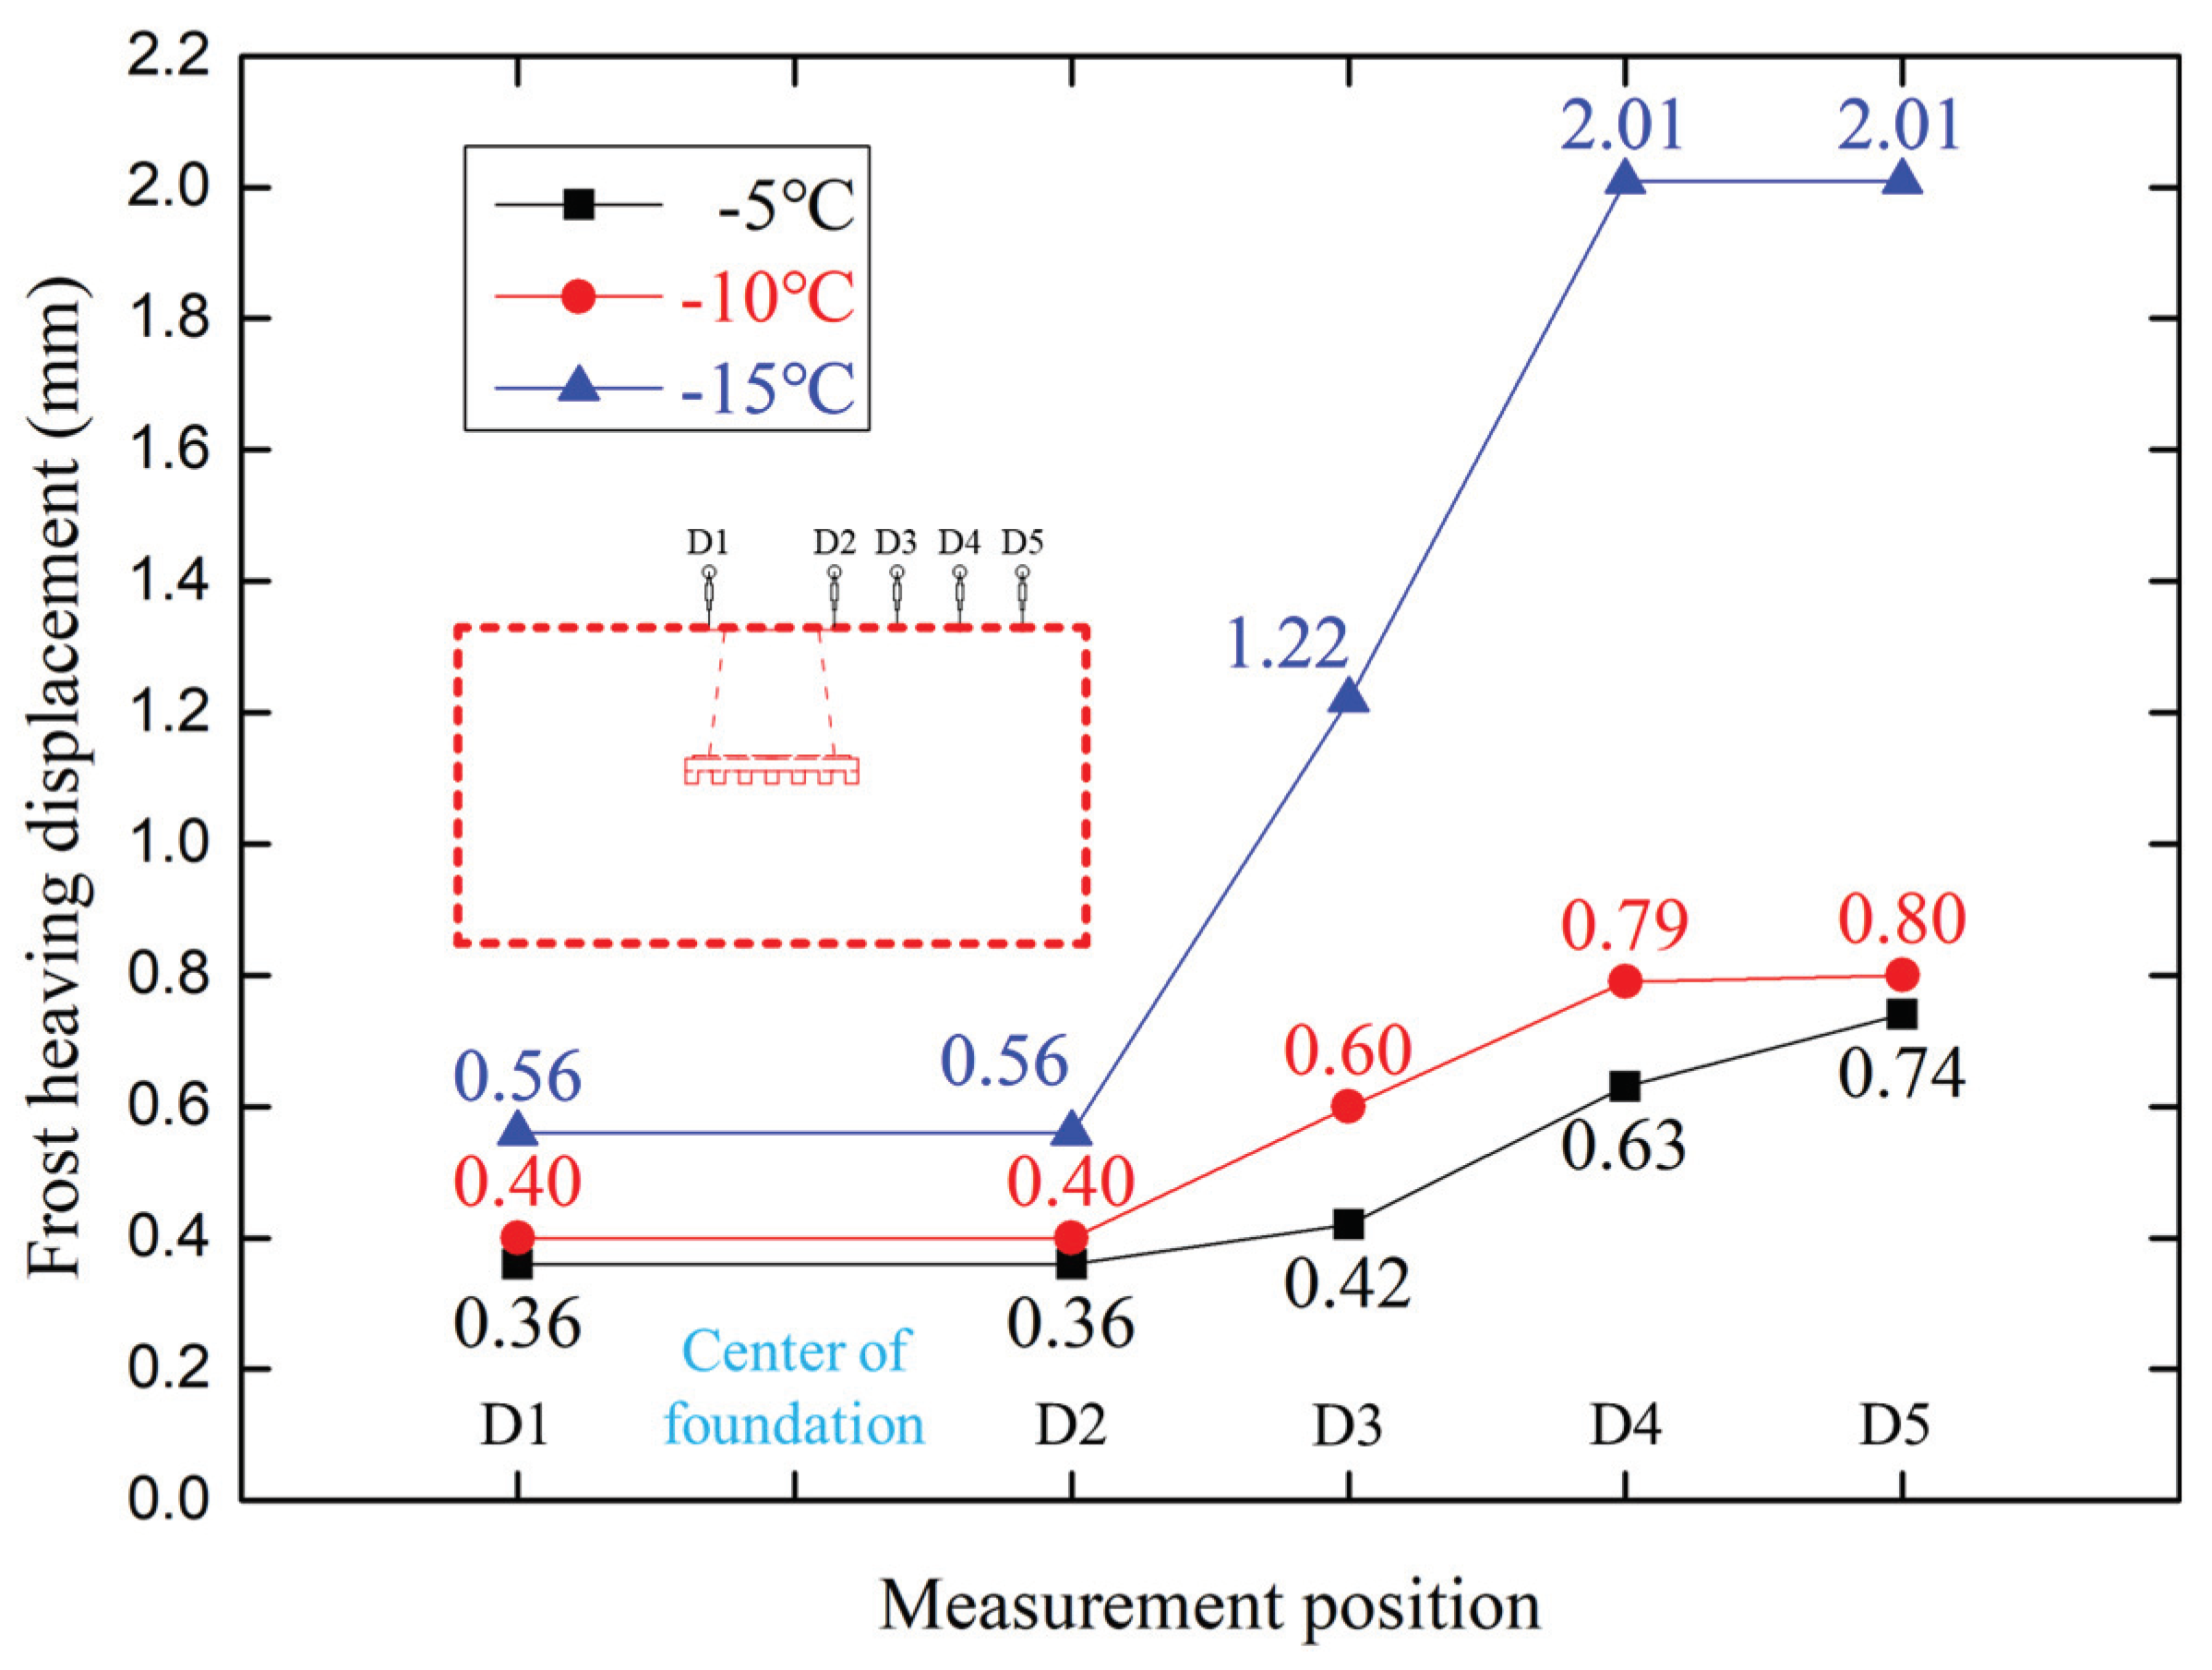
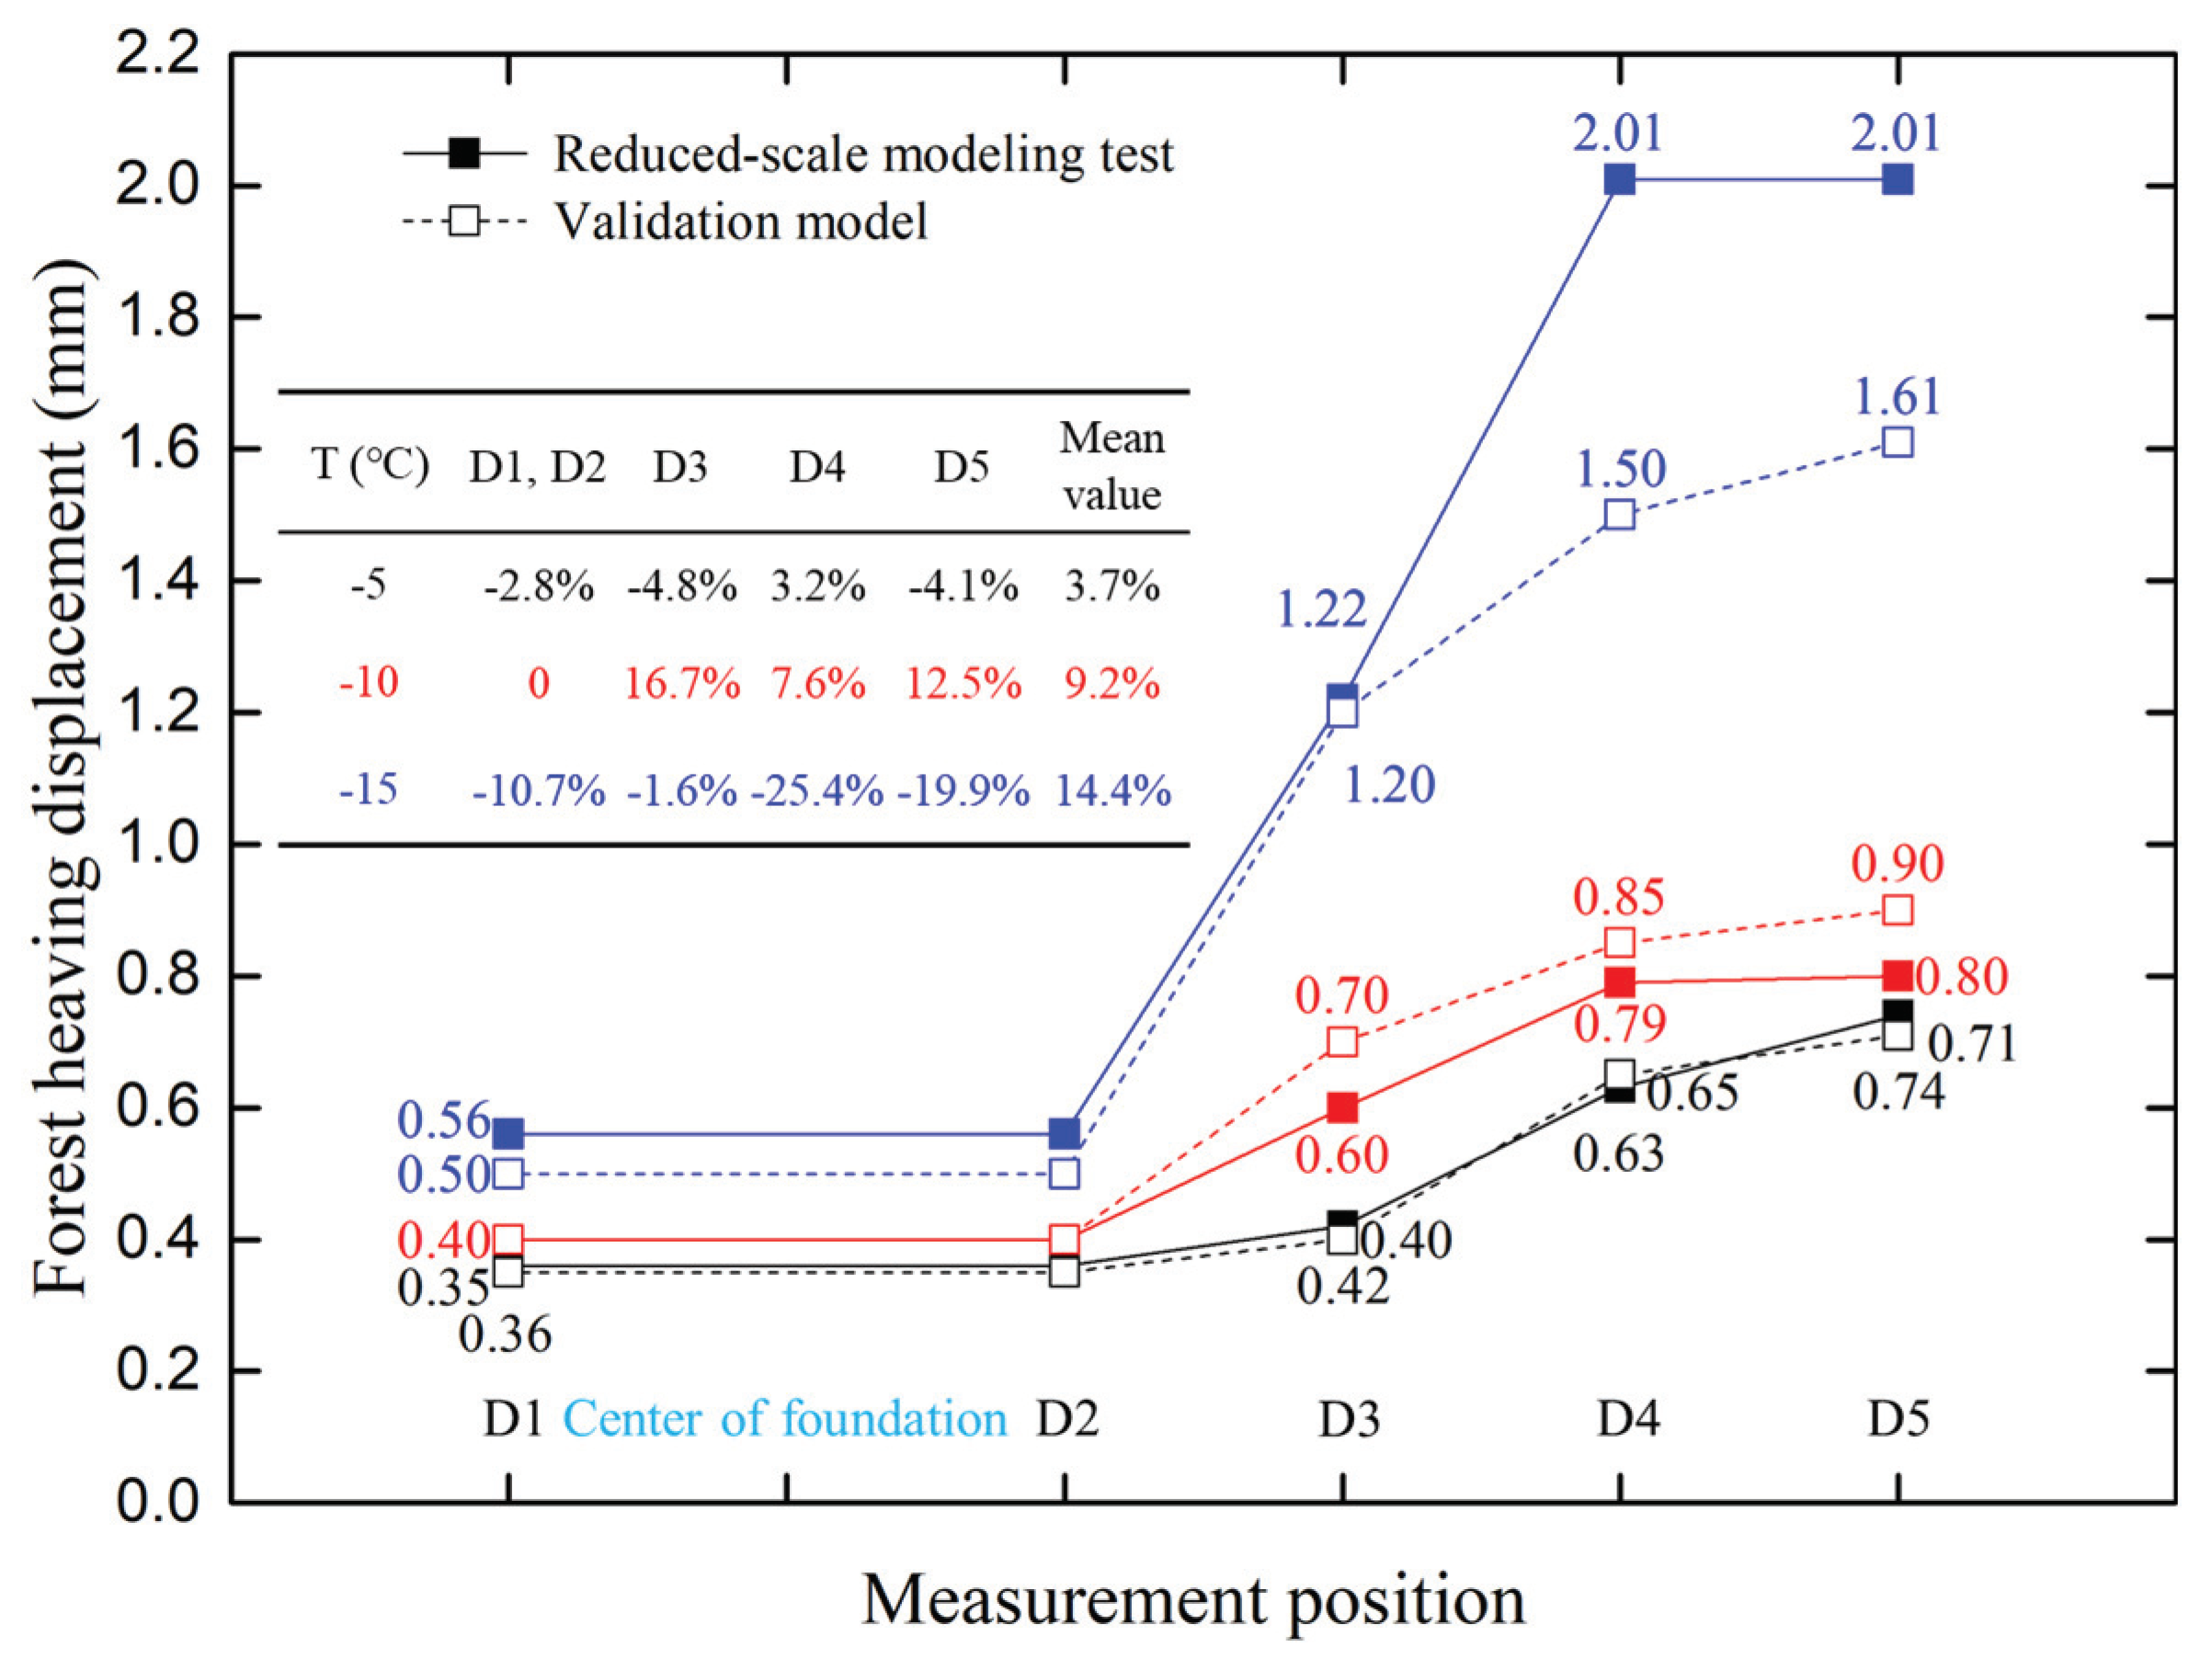
2.4.1. Results of Freezing Test: Temperature Field and Soil Frost Heave
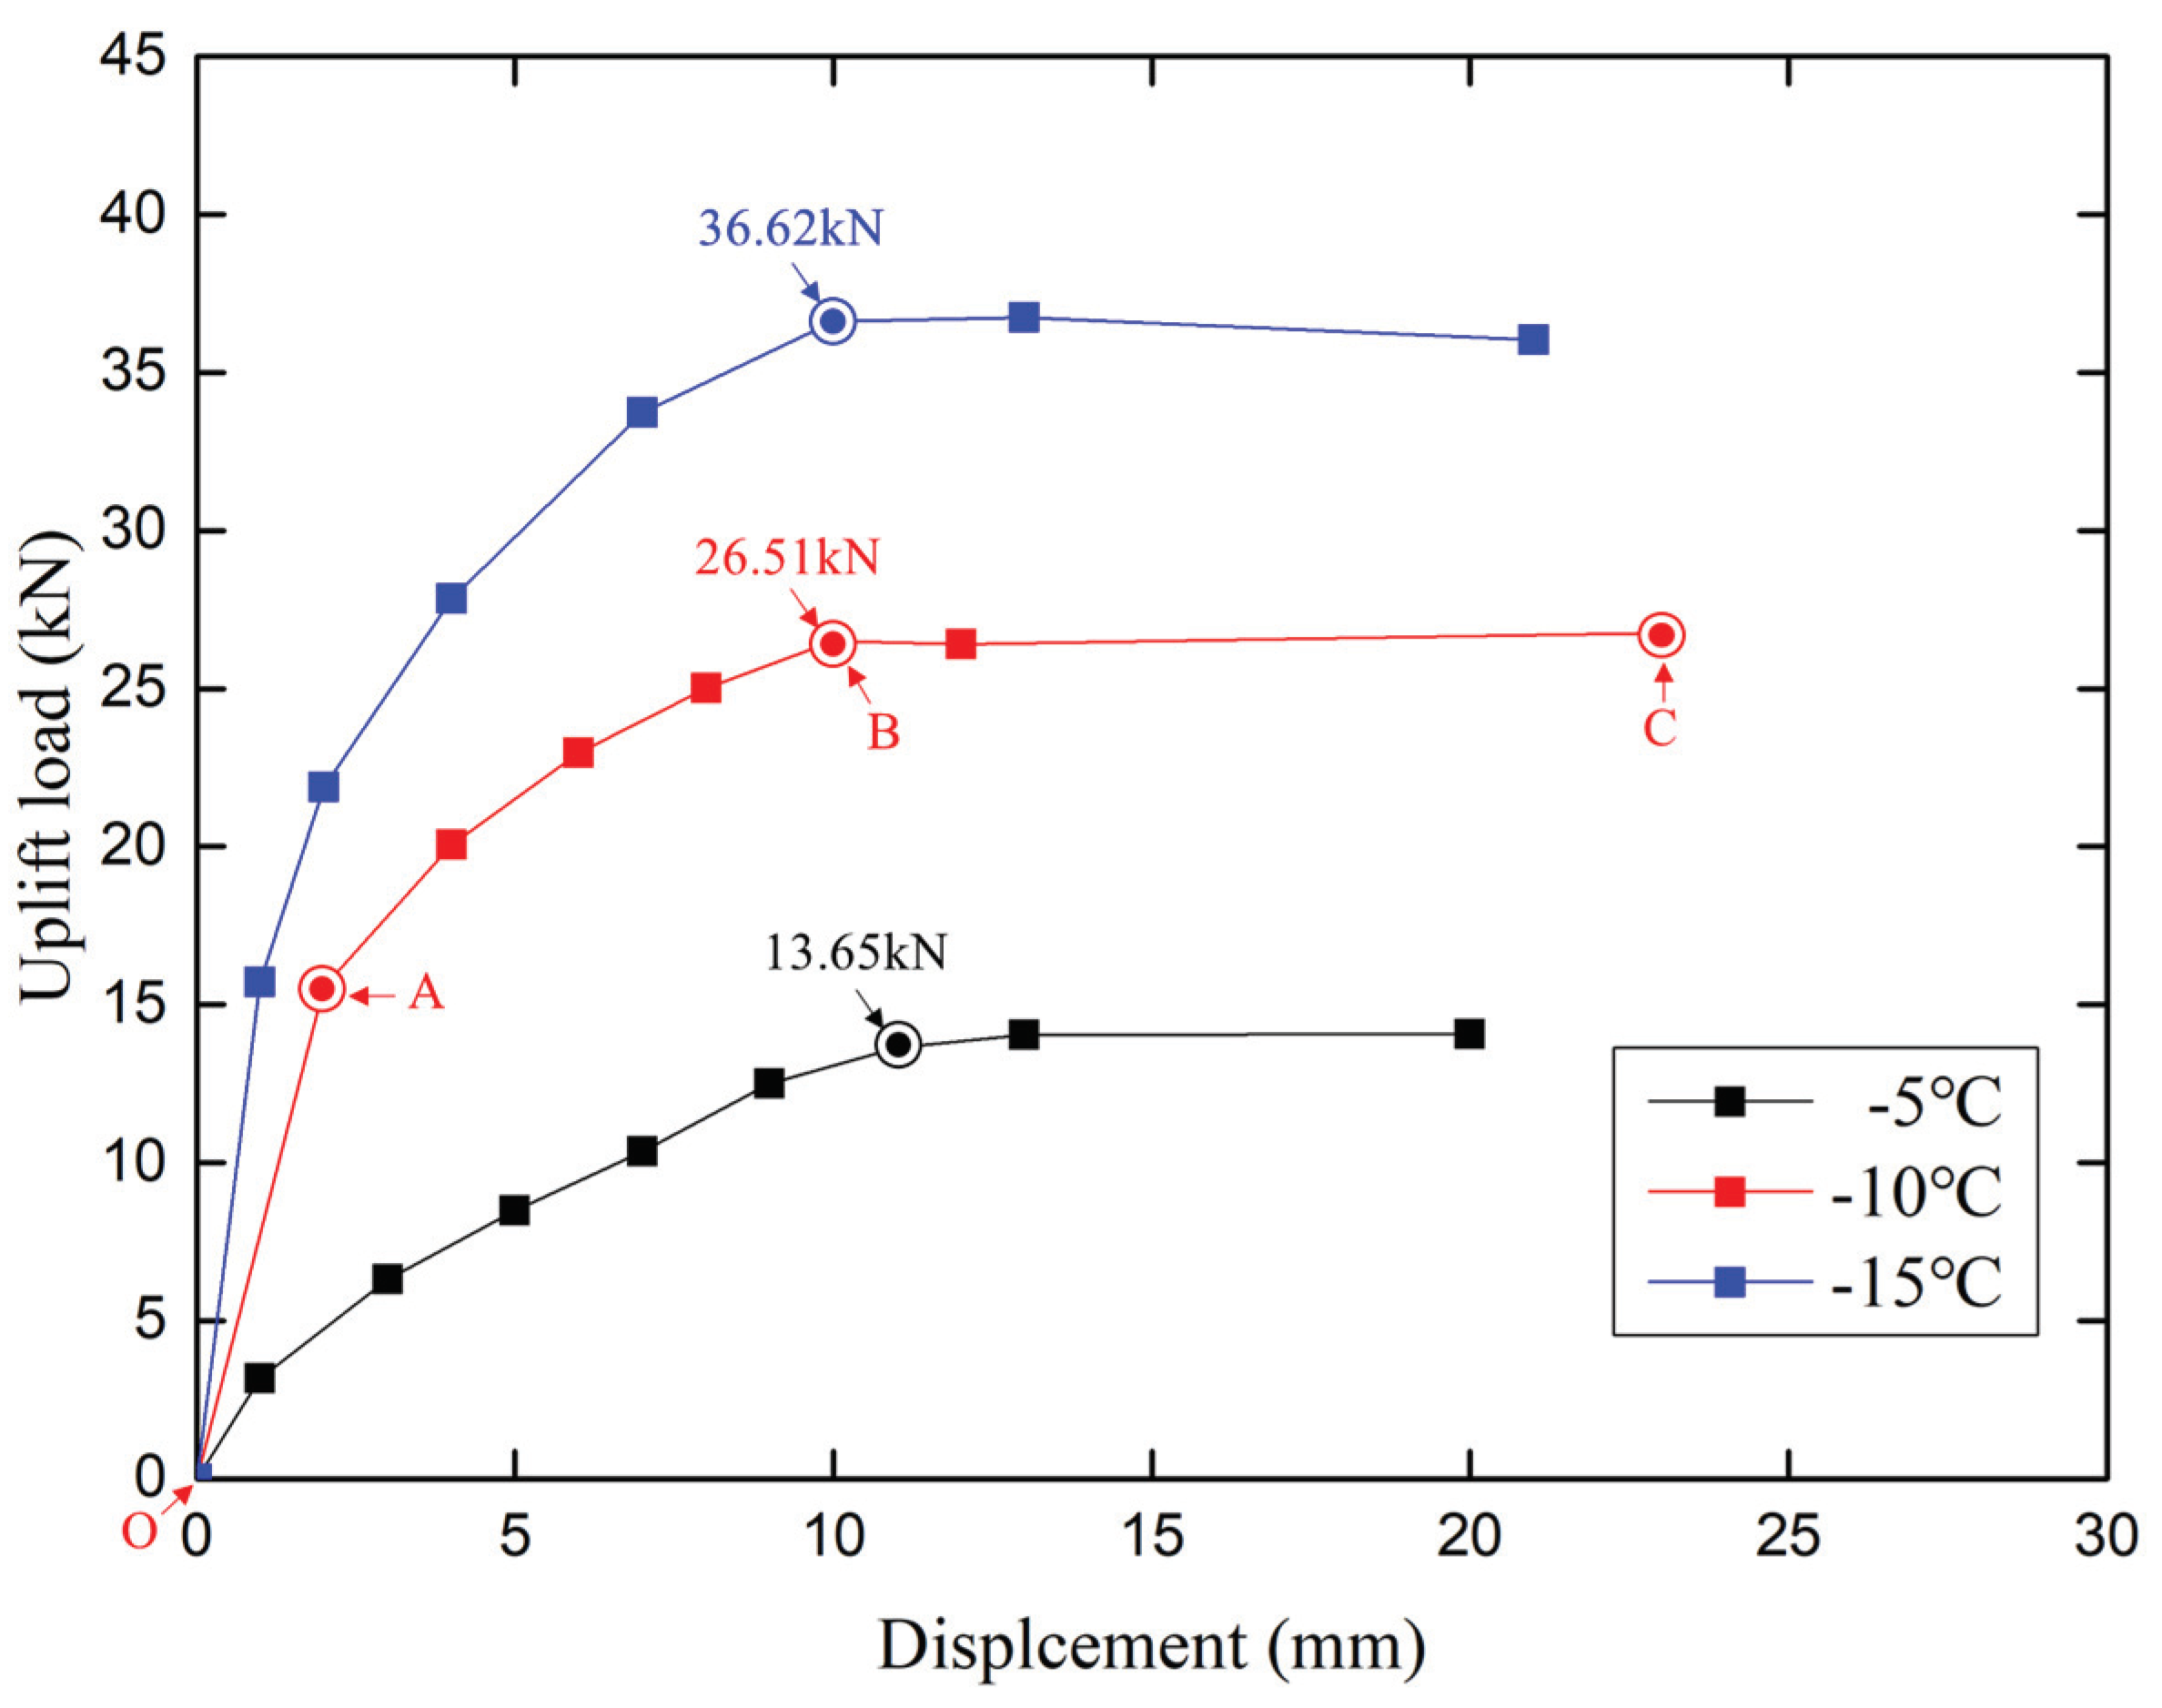
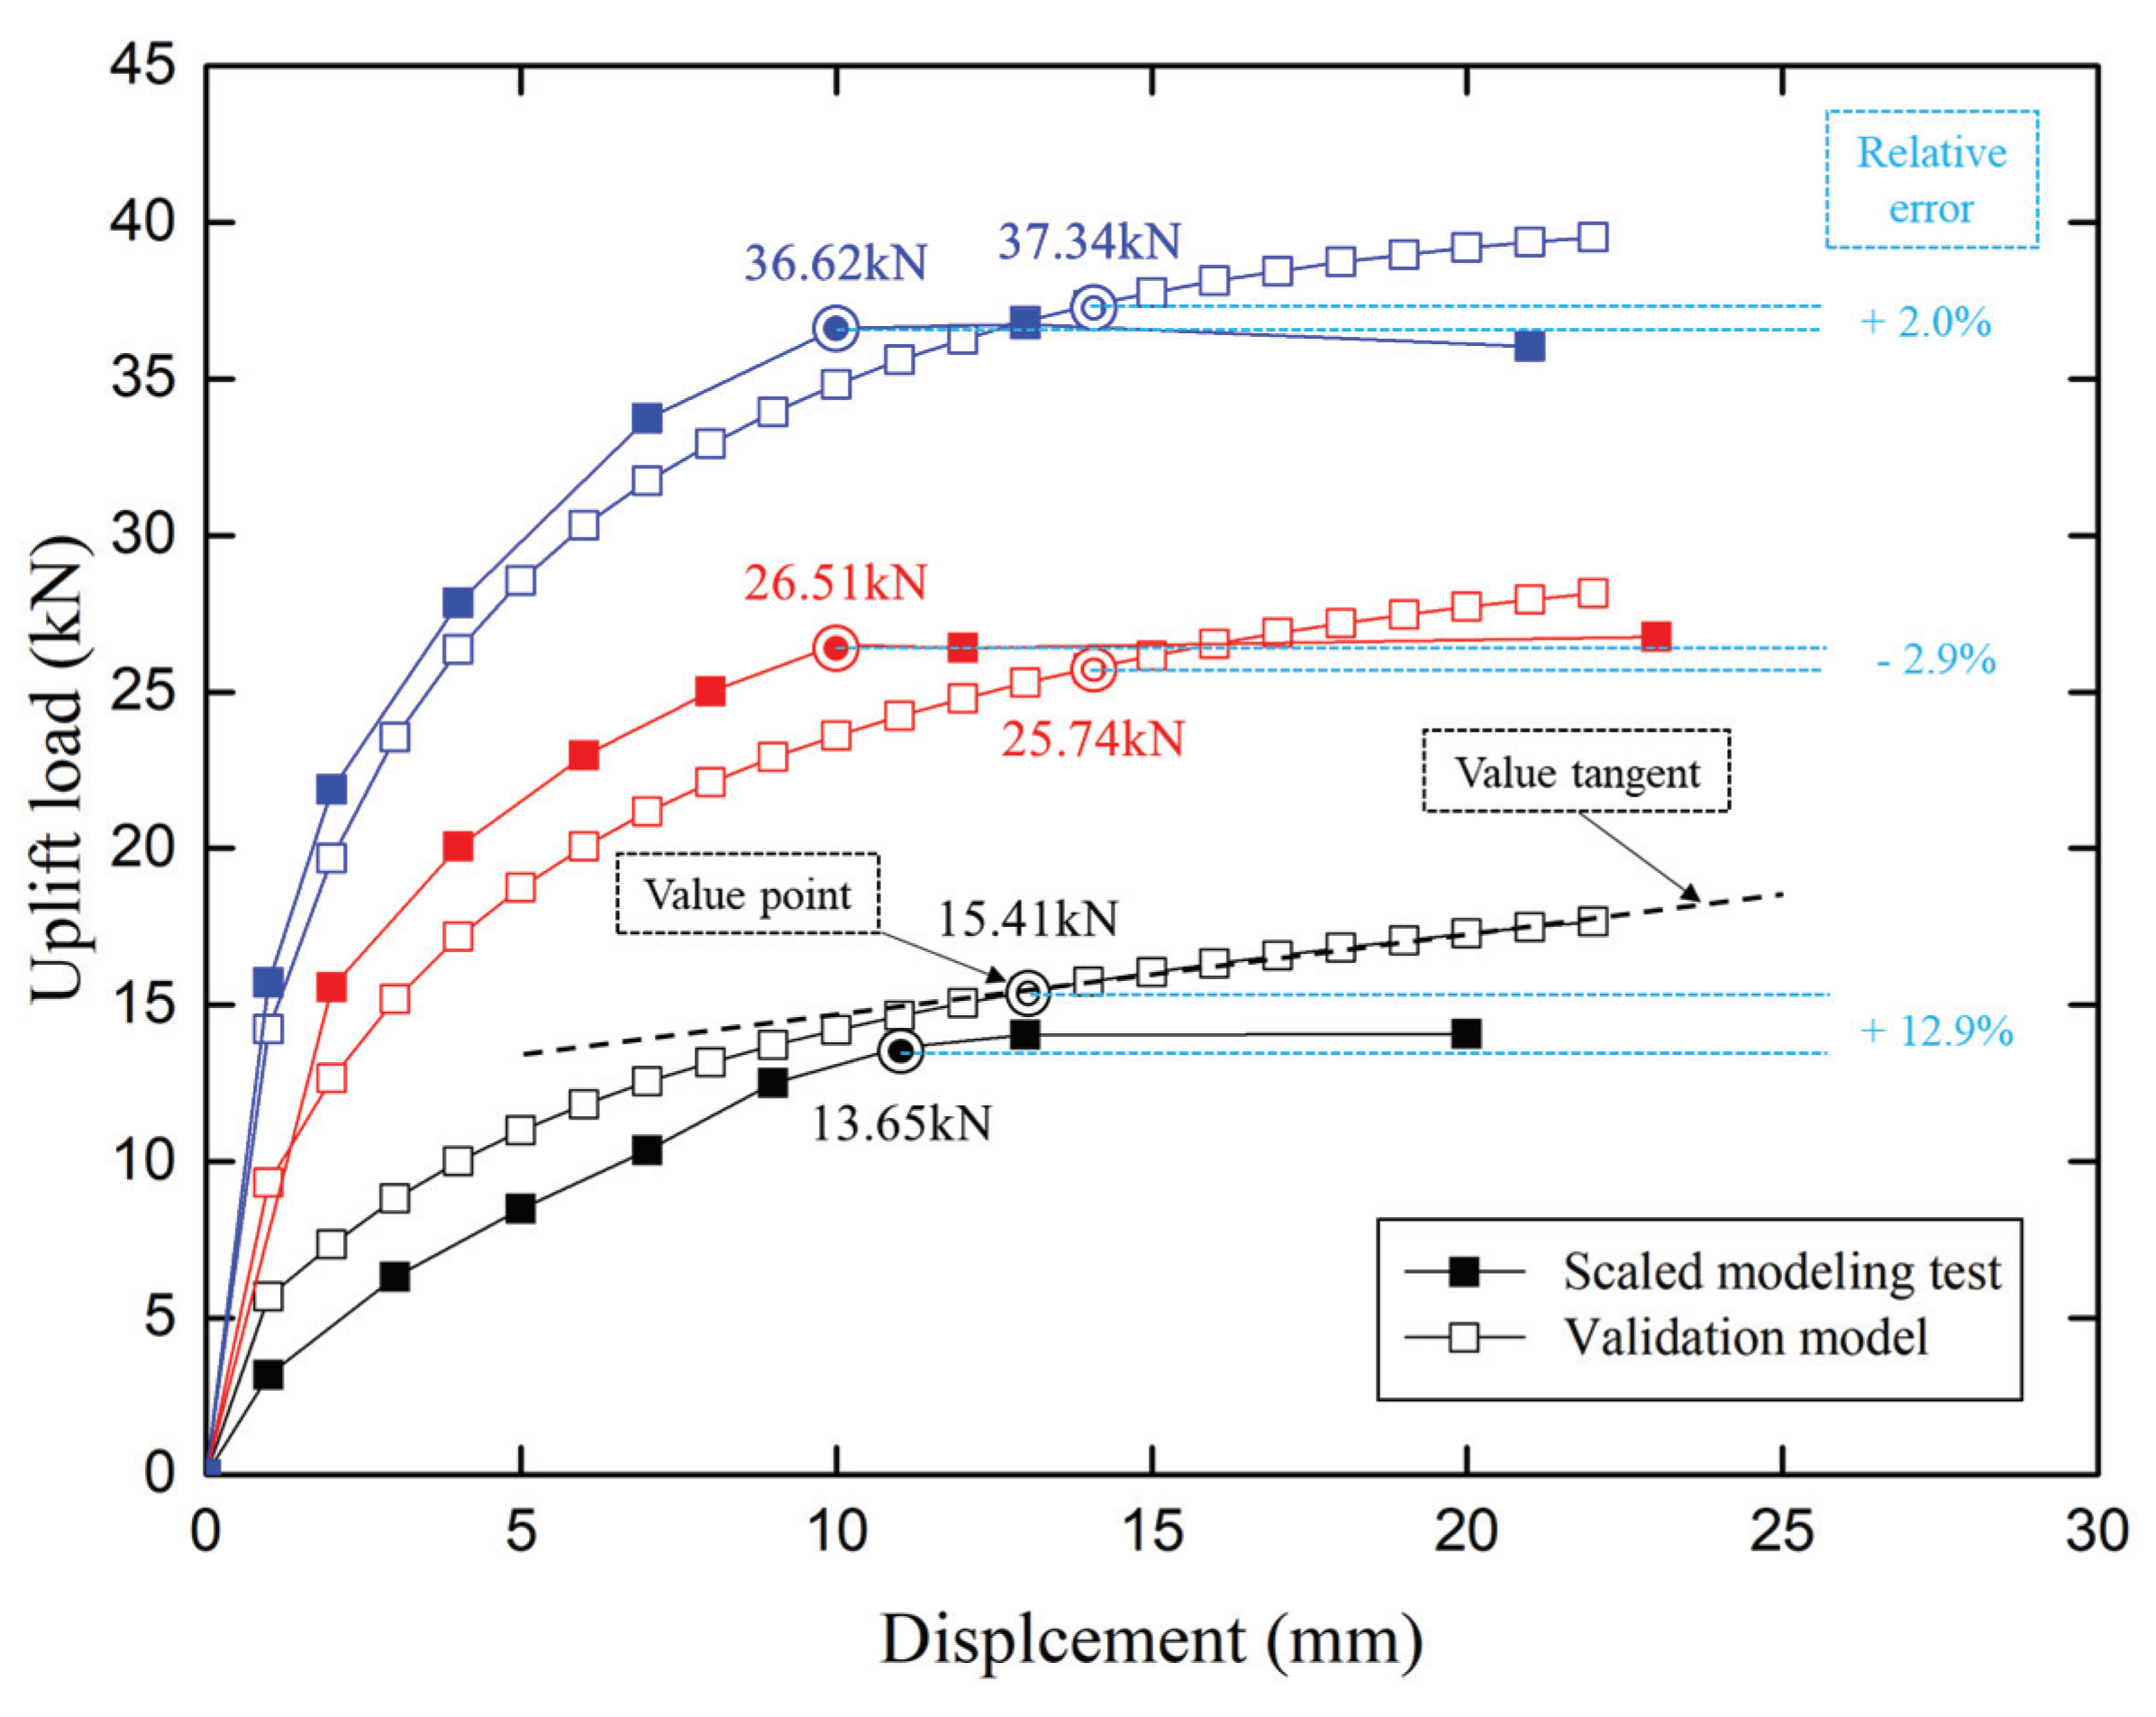
2.4.2. Results of Loading Test: Uplift Load Versus Displacement Curves
3. Numerical Modeling
3.1. Modeling Scheme
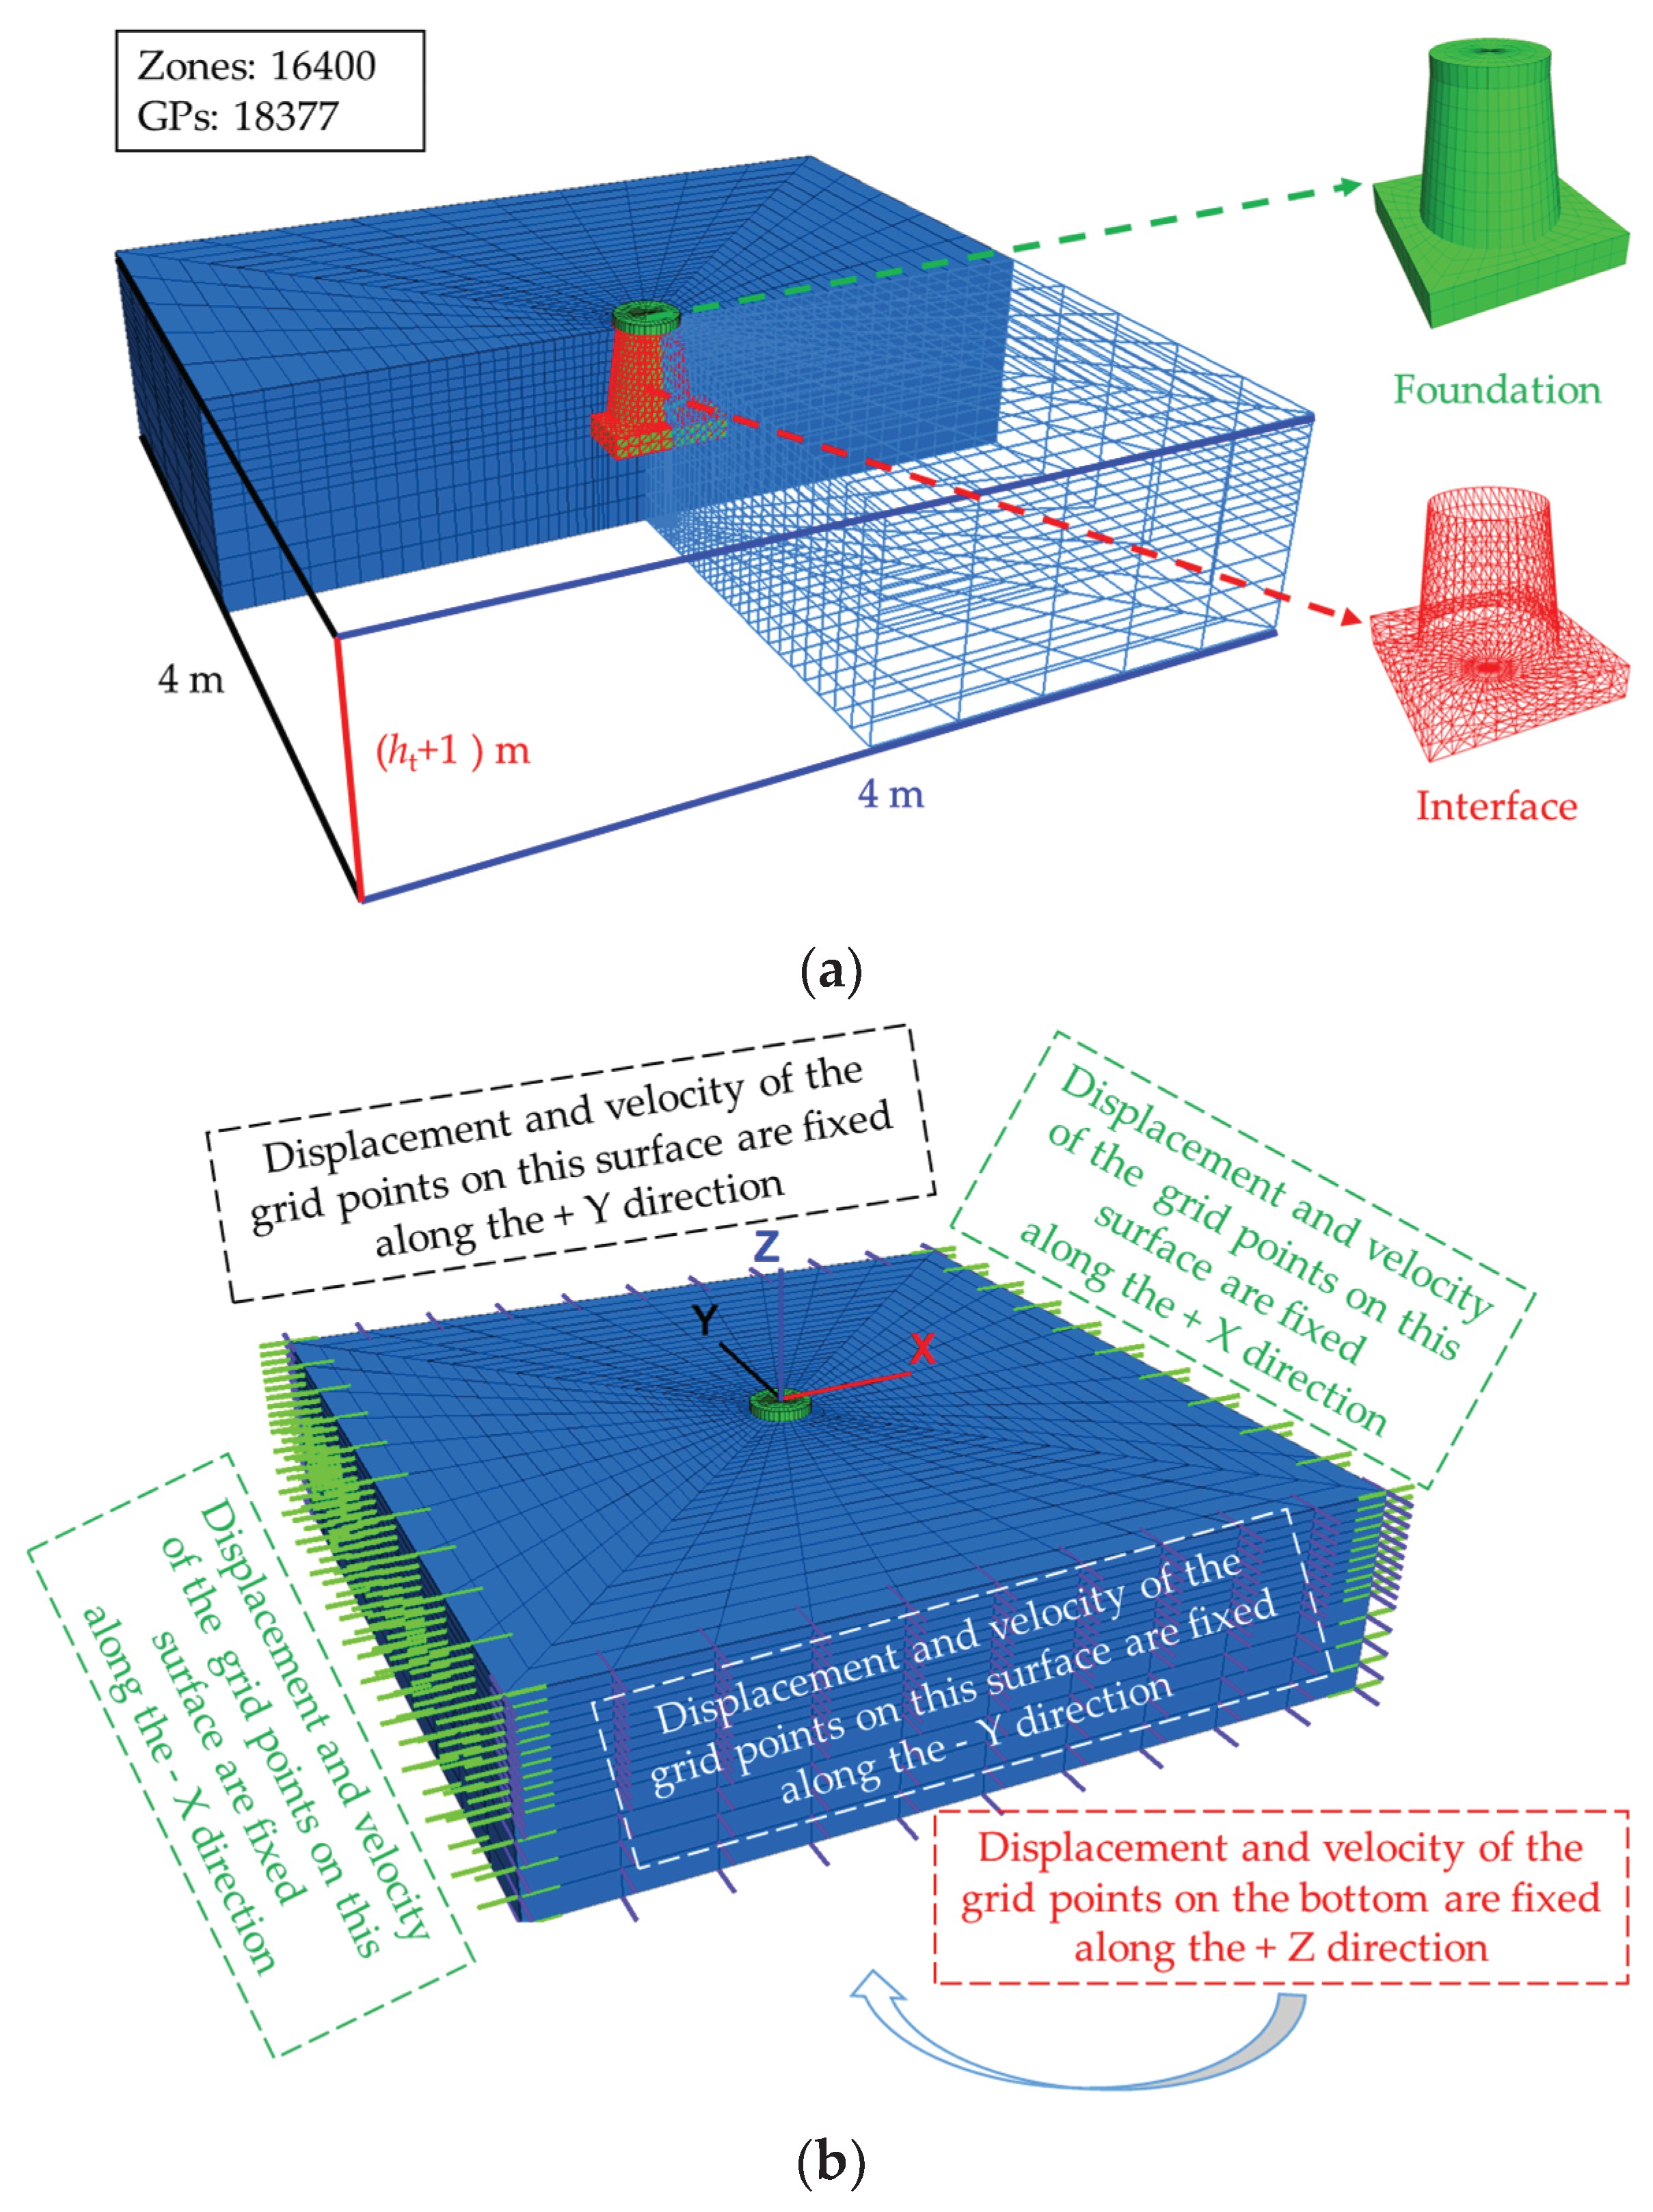
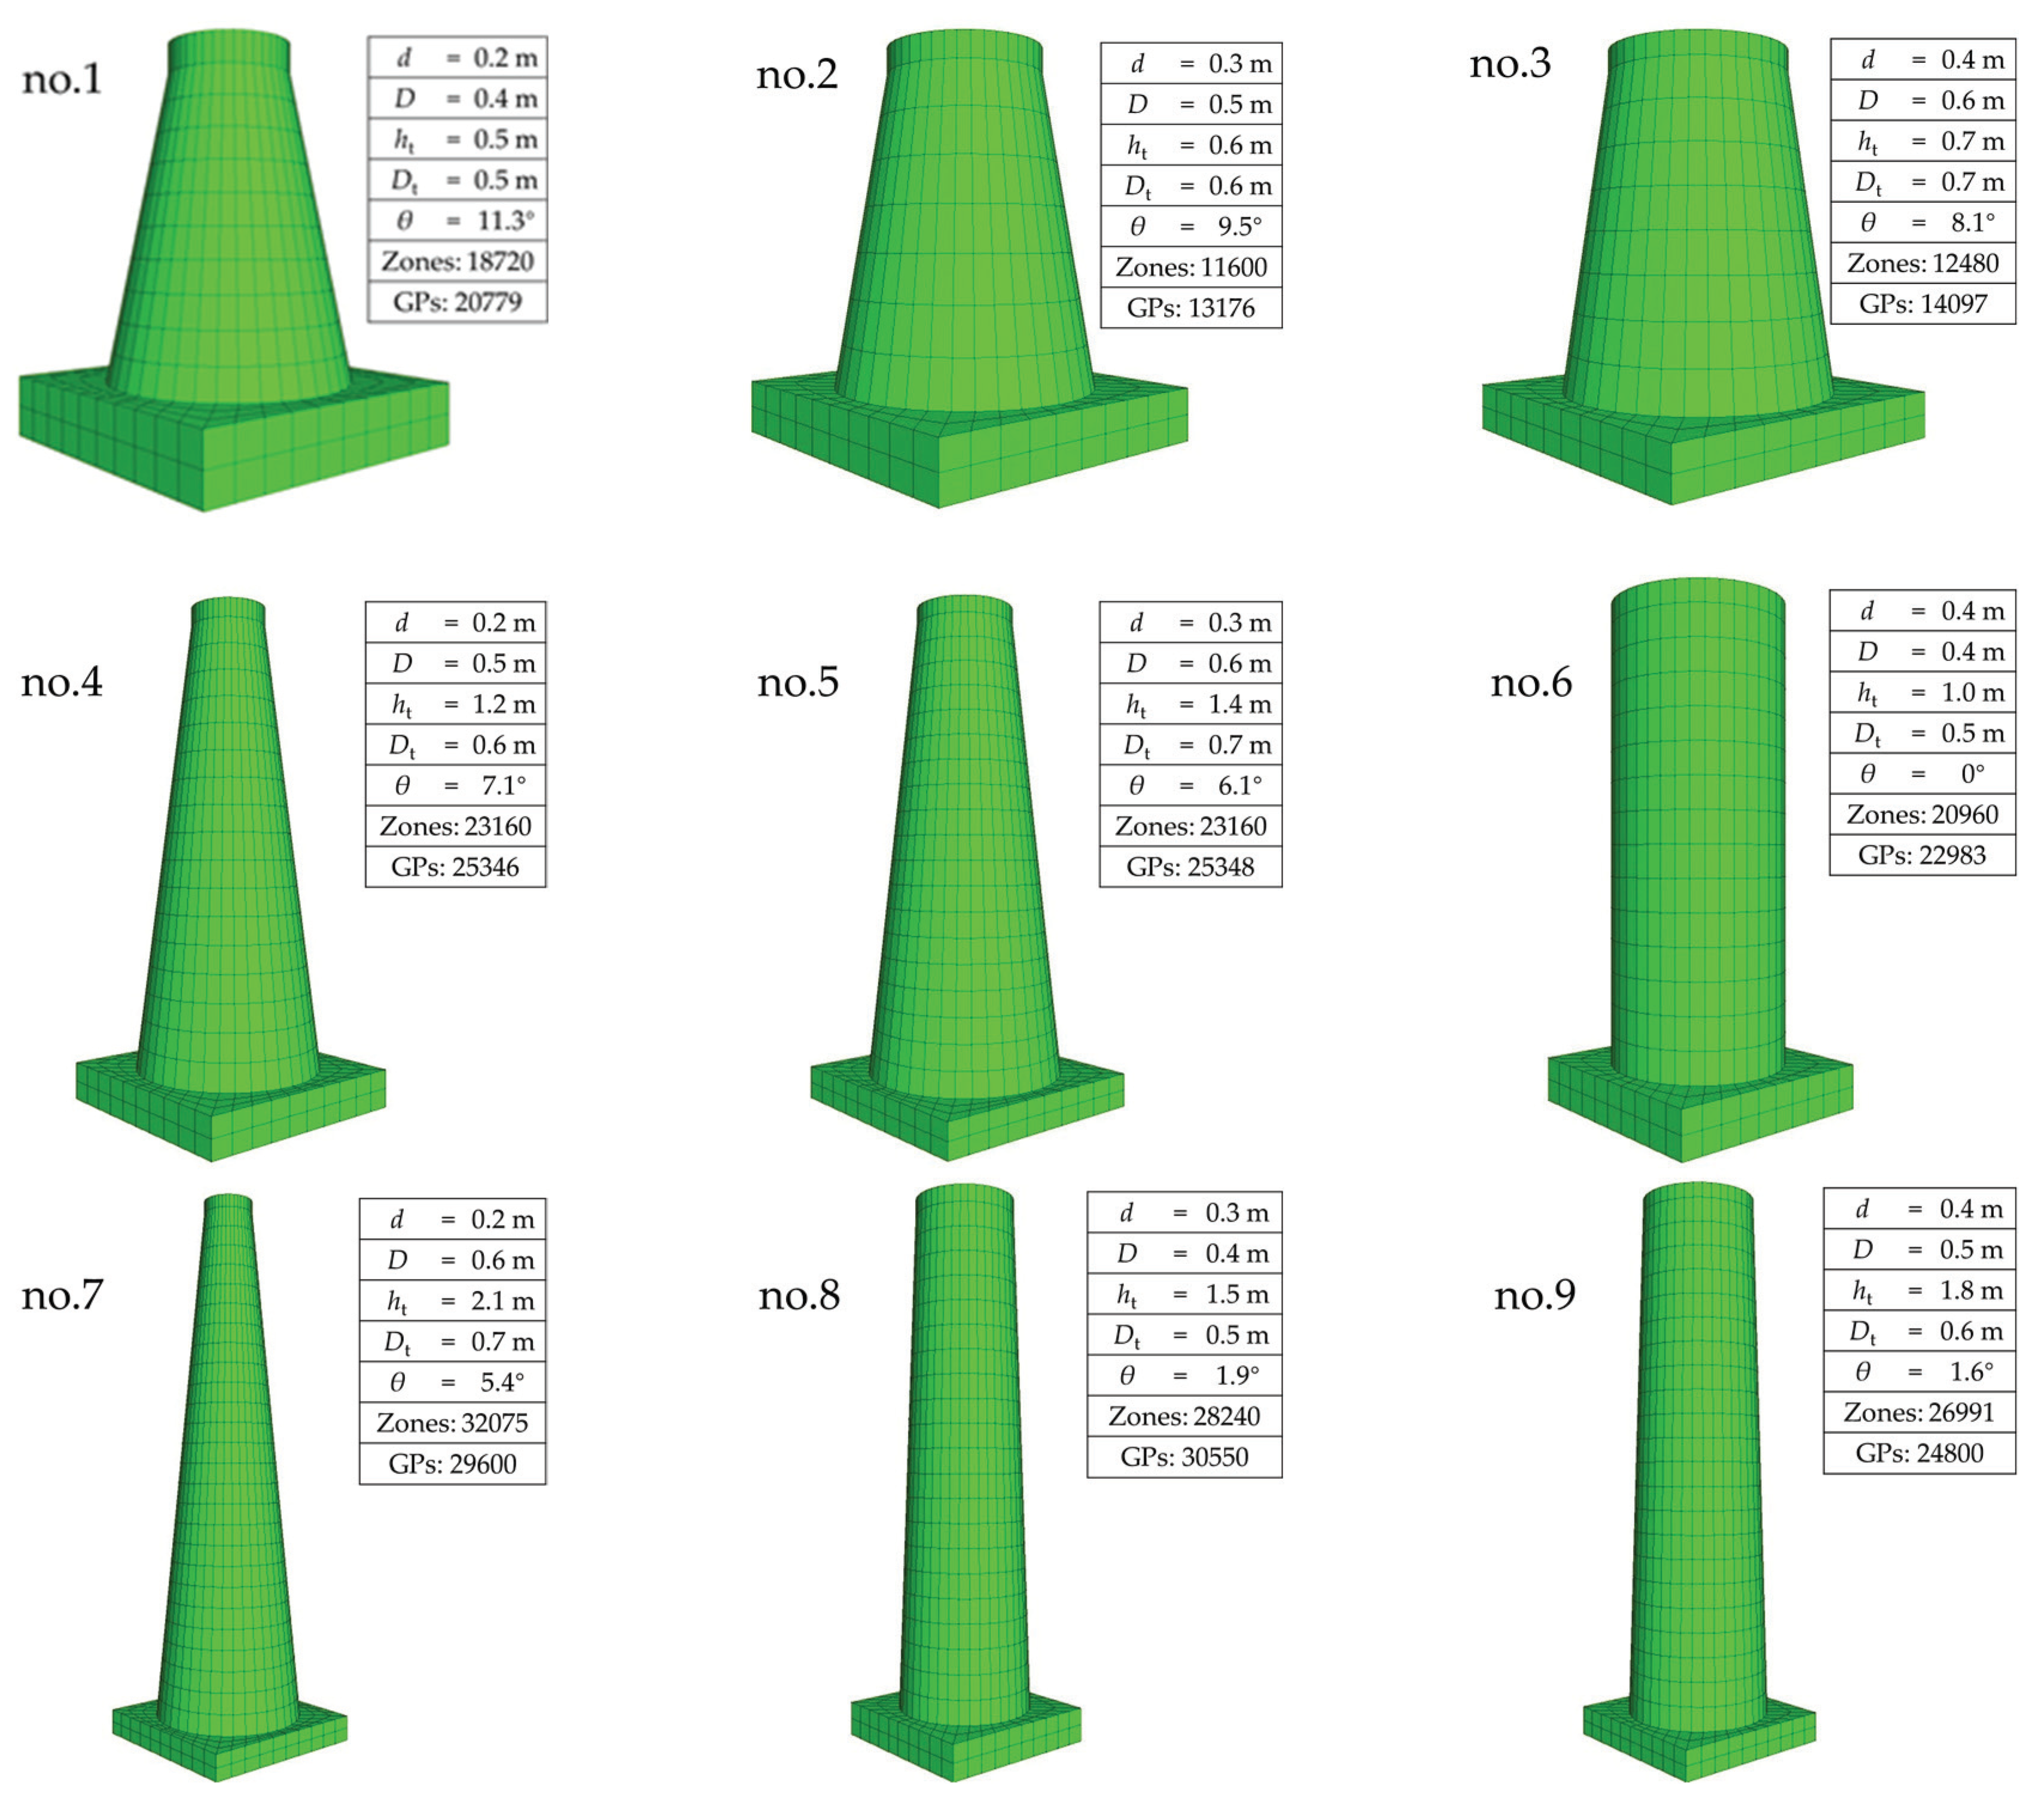
3.2. Geometric Modeling
3.3. Material Modeling
3.3.1. Physical and Mechanical Parameters
3.3.2. Thermodynamic Parameters
3.4. Validation for Simulation Model
3.5. Simulation Results and Analysis
3.5.1. Ultimate Uplift Load
3.5.2. Failure Mechanisms for Frozen Soil
- (1)
- The T-mode with the T-shaped plastic zones is illustrated in Figure 17a. The shear failure occurs from the bottom to the top along the cone-cylinder surface, and forming a cylinder plastic region. Then, the lifting effect occurs on the upper soil and causing the tensile failure. Finally, the T-shaped plastic zones are formed.
- (2)
- The V-mode is indicated in Figure 17b. The failure law of this mode is similar to that of the T-mode, except that the ratio of shear failure zones to tensile failure zones is reduced. The number of tensile failure zones is obviously increased.
- (3)
- The U-mode is shown in Figure 17c. The plastic zones of this mode are larger than the former two modes. Most of the zones are tensile failure, while shear failure zones only account for a small part.
4. Comprehensive Analysis
5. Conclusions
- (1)
- Firstly, the uplift bearing capacity of the cone-cylinder foundation increases with the decrease of temperature, but this trend will slow down with the decrease of unfrozen water in soil. The influence of temperature is mainly reflected in three aspects: the cementation force between the ice crystal and the foundation surface; the friction between the soil and foundation surface; and the mechanical strength of soil. These three factors will participate in the bearing process one by one and ultimately work together.
- (2)
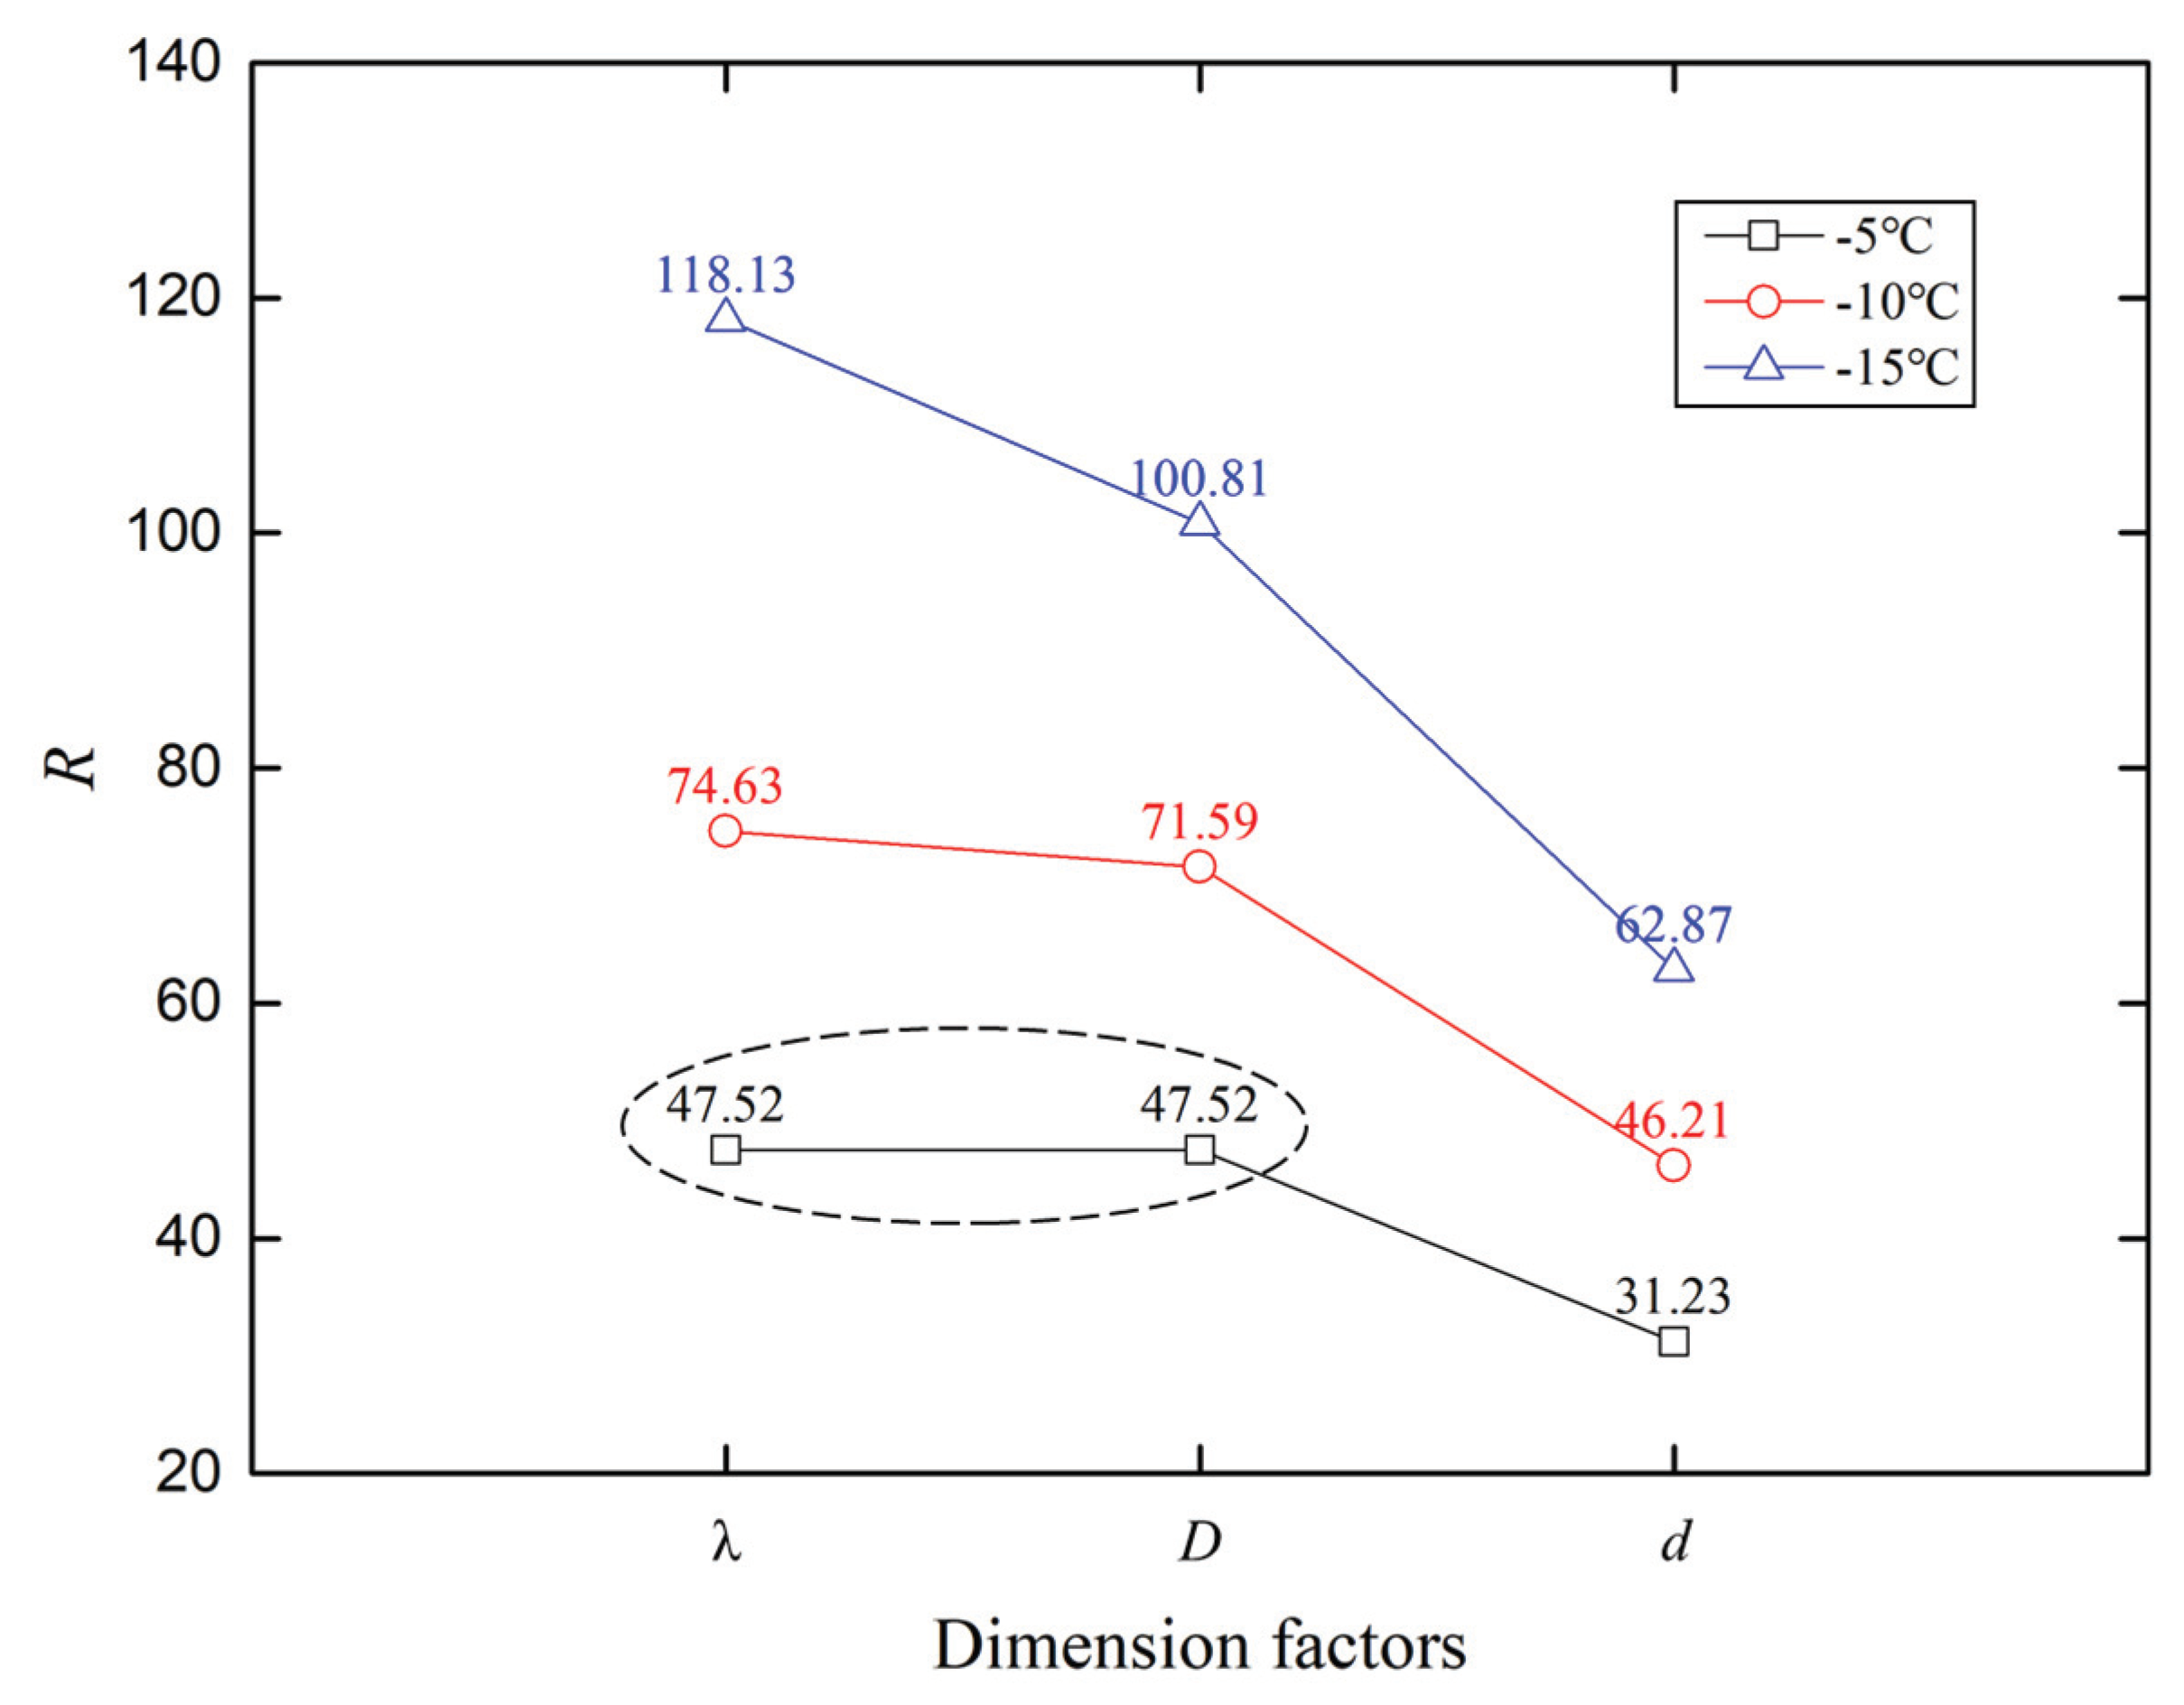
- Secondly, the uplift bearing capacity of the cone-cylinder foundation is positively correlated with the dimension factors, and the correlation ranks as follows: the ratio of depth to bottom width (), the bottom diameter of the cone-cylinder (D), and the top diameter of the cone-cylinder (d), but none of the above three factors are significant, according to the results of the F-test.
- (3)
- Additionally, the frozen soil failure mechanisms of cone-cylinder foundation can be divided into three categories: T-mode, V-mode, and U-mode. There are two rules in the evolution of these three modes. One is that the bearing proportion of the force of cementation and friction decreases gradually, while the phenomenon is that the range of shear zones decreases whereas that of tension zones increases. The other is that the bearing proportion of the soil strength increases gradually, while the failure range of frozen soil increases significantly. Furthermore, the distribution of these three modes is affected by the temperatures and dimension factors at the same time, and the influence of the latter gradually weakens with the decrease of the former.
- (4)
- Lastly, in future work, more factors will be considered, including more freezing temperatures, more loading directions, and more dimensions of foundations. At the same time, the method of the indoor model test will be improved: the tangential frost heave will be measured, and the failure sliding profile of the frozen soil will be observed.
Author Contributions
Funding
Acknowledgments
Conflicts of Interest
References
- Wei, M.; Guodong, C.; Qingbai, W. Construction on permafrost foundations: Lessons learned from the Qinghai–Tibet railroad. Cold Reg. Sci. Technol. 2009, 59, 3–11. [Google Scholar] [CrossRef]
- Wu, Q.; Niu, F. Permafrost changes and engineering stability in Qinghai-Xizang Plateau. Chin. Sci. Bull. 2013, 58, 1079–1094. [Google Scholar] [CrossRef]
- Wei, X.; Huang, C.; Wei, N.; Zhao, H.; He, Y.; Wu, X. The impact of freeze–thaw cycles and soil moisture content at freezing on runoff and soil loss. Land Degrad. Dev. 2019, 30, 515–523. [Google Scholar] [CrossRef]
- Li, P.; Yu, Q.H.; Yan, F.Z.; Huang, Y.S.; Cheng, D.X. Main Problems and Solutions on Design and Construction of Qinghai-Tibet DC Transmission Project in Permafrost Region. In Advances in Civil and Industrial Engineering, Pts 1–4; Tian, L., Hou, H., Eds.; Trans Tech Publications Ltd.: Bäch SZ, Switzerland, 2013; Volume 353–356, pp. 515–523. [Google Scholar]
- Zhang, J.; Ruan, G.; Su, K.; Zhang, H. Estimation on settlement of precast tower footings along the Qinghai-Tibet Power Transmission Line in warm permafrost regions. Cold Reg. Sci. Technol. 2016, 121, 275–281. [Google Scholar] [CrossRef]
- Li, G.; Yu, Q.; Ma, W.; Chen, Z.; Mu, Y.; Guo, L.; Wang, F. Freeze-thaw properties and long-term thermal stability of the unprotected tower foundation soils in permafrost regions along the Qinghai-Tibet Power Transmission Line. Cold Reg. Sci. Technol. 2016, 121, 258–274. [Google Scholar] [CrossRef]
- Yu, Q.; Zhang, Z.; Wang, G.; Guo, L.; Wang, X.; Wang, P.; Bao, Z. Analysis of tower foundation stability along the Qinghai–Tibet Power Transmission Line and impact of the route on the permafrost. Cold Reg. Sci. Technol. 2016, 121, 205–213. [Google Scholar] [CrossRef]
- Guo, L.; Xie, Y.; Yu, Q.; You, Y.; Wang, X.; Li, X. Displacements of tower foundations in permafrost regions along the Qinghai–Tibet Power Transmission Line. Cold Reg. Sci. Technol. 2016, 121, 187–195. [Google Scholar] [CrossRef]
- Wen, Z.; Yu, Q.; Zhang, M.; Xue, K.; Chen, L.; Li, D. Stress and deformation characteristics of transmission tower foundations in permafrost regions along the Qinghai-Tibet Power Transmission Line. Cold Reg. Sci. Technol. 2016, 121, 214–225. [Google Scholar] [CrossRef]
- Gu, Q.; Yang, Z.; Peng, Y. Parameters affecting laterally loaded piles in frozen soils by an efficient sensitivity analysis method. Cold Reg. Sci. Technol. 2016, 121, 42–51. [Google Scholar] [CrossRef]
- Qi, J.; Vermeer, P.A.; Cheng, G. A review of the influence of freeze-thaw cycles on soil geotechnical properties. Permafr. Periglac. Process. 2006, 17, 245–252. [Google Scholar] [CrossRef]
- Lu, J.-F.; Yin, J.; Shuai, J. A model for predicting the frost-heave effect of a pile embedded in the frozen soil. Cold Reg. Sci. Technol. 2018, 146, 214–222. [Google Scholar] [CrossRef]
- Wang, T.; Liu, J.; Tian, Y.; Lv, P. Frost jacking characteristics of screw piles by model testing. Cold Reg. Sci. Technol. 2017, 138, 98–107. [Google Scholar] [CrossRef]
- Liu, J.; Lv, P.; Cui, Y.; Liu, J. Experimental study on direct shear behavior of frozen soil-concrete interface. Cold Reg. Sci. Technol. 2014, 104, 1–6. [Google Scholar] [CrossRef]
- Wen, Z.; Yu, Q.; Ma, W.; Dong, S.; Wang, D.; Niu, F.; Zhang, M. Experimental investigation on the effect of fiberglass reinforced plastic cover on adfreeze bond strength. Cold Reg. Sci. Technol. 2016, 131, 108–115. [Google Scholar] [CrossRef]
- Fei, W.; Yang, Z.J.; Sun, T. Ground freezing impact on laterally loaded pile foundations considering strain rate effect. Cold Reg. Sci. Technol. 2019, 157, 53–63. [Google Scholar]
- Yang, Z.J.; Li, Q.; Horazdovsky, J.; Hulsey, J.L.; Marx, E.E. Performance and Design of Laterally Loaded Piles in Frozen Ground. J. Geotech. Geoenviron. Eng. 2017, 143, 06016031. [Google Scholar] [CrossRef]
- Kulhawy, F.H.; Trautmann, C.H.; Beech, J.F.; O’Rourke, T.D.; McGuire, W. Transmission Line Structure Foundation for Uplift-Compression Loading; Rep. No. EPRI-EL-2870; Electric Power Research Institute: Palo Alto, CA, USA, 1983. [Google Scholar]
- Reddy, K.M.; Ayothiraman, R. Experimental Studies on Behavior of Single Pile under Combined Uplift and Lateral Loading. J. Geotech. Geoenviron. Eng. 2015, 141, 04015030. [Google Scholar] [CrossRef]
- Huang, G.; Yan, B.; Wen, N.; Wu, C.; Li, Q. Study on jump height of transmission lines after ice-shedding by reduced-scale modeling test. Cold Reg. Sci. Technol. 2019, 165, 102781. [Google Scholar] [CrossRef]
- ASTM. Standard Test Method for Direct Shear Test of Soils under Consolidated Drained Conditions; ASTM D3080/D3080M-11; ASTM: West Conshohocken, PA, USA, 2011b. [Google Scholar]
- ASTM. Standard Test Methods for Specific Gravity of Soil Solids by Water Pycnometer; ASTM D854-14; ASTM: West Conshohocken, PA, USA, 2014. [Google Scholar]
- ASTM. Standard Test Method for Laboratory Determination of Creep Properties of Frozen Soil Samples by Uniaxial Compression; D5520-18; ASTM: West Conshohocken, PA, USA, 2018. [Google Scholar]
- ASTM. Standard Terminology Relating to Frozen Soil and Rock; ASTM D7099-04; ASTM: West Conshohocken, PA, USA, 2018. [Google Scholar]
- ASTM. Standard Test Method for Laboratory Determination of Strength Properties of Frozen Soil at a Constant Rate of Strain; ASTM D7300-18; ASTM: West Conshohocken, PA, USA, 2018. [Google Scholar]
- ASTM. Standard Test Methods for Laboratory Determination of Water (Moisture) Content of Soil and Rock by Mass; ASTM D2216-19; ASTM: West Conshohocken, PA, USA, 2019. [Google Scholar]
- Harris, D.E.; Madabhushi, G.S. Uplift capacity of an under-reamed pile foundation. Proc. Inst. Civ. Eng. Geotech. Eng. 2015, 168, 526–538. [Google Scholar] [CrossRef]
- Lu, X.L.; Qian, Z.Z.; Yang, W.Z. Axial Uplift Behavior of Belled Piers in Sloping Ground. Geotech. Test. J. 2017, 40, 20150202. [Google Scholar] [CrossRef]
- Lu, X.-L.; Qian, Z.-Z.; Zheng, W.-F.; Yang, W.-Z.Y. Characterization and uncertainty of uplift load-displacement behaviour of belled piers. Geomech. Eng. 2016, 11, 211–234. [Google Scholar] [CrossRef]
- Qian, Z.-Z.; Lu, X.-L.; Yang, W.-Z.; Engineering, G. Comparative Field Tests on Straight-Sided and Belled Piers on Sloping Ground under Combined Uplift and Lateral Loads. J. Geotech. Geoenviron. Eng. 2019, 145, 04018099. [Google Scholar] [CrossRef]
- Mu, Y.; Li, G.; Yu, Q.; Ma, W.; Wang, D.; Wang, F. Numerical study of long-term cooling effects of thermosyphons around tower footings in permafrost regions along the Qinghai-Tibet Power Transmission Line. Cold Reg. Sci. Technol. 2016, 121, 237–249. [Google Scholar] [CrossRef]
- Li, G.Y.; Yu, Q.H.; Ma, W.; Mu, Y.H.; Li, X.B.; Chen, Z.Y. Laboratory testing on heat transfer of frozen soil blocks used as backfills of pile foundation in permafrost along Qinghai-Tibet electrical transmission line. Arab. J. Geosci. 2015, 8, 2527–2535. [Google Scholar] [CrossRef]
- Chin, F.K. Estimation of the ultimate load of piles not carried to failure. In Proc. 2nd Southeast Asian Conf. on Soil Engineering; Southeast Asian Society of Soil Engineering: Singapore, 1970; Volume 81–92. [Google Scholar]
- O’rourke, T.D.; Kulhawy, F.H. Observations on load tests for drilled shafts. In Drilled Piers and Caissons II; ASCE: Reston, VA, USA, 1985; pp. 113–128. [Google Scholar]
- Fuller, F.M.; Hoy, H.E. Pile load tests including quick load test method, conventional methods, and interpretations. In Vol. 333 of Proc. 49th Annual Meeting of the Highway Research Board; Highway Research Board: Washington, DC, USA, 1970; pp. 74–86. [Google Scholar]
- Lian, J.; Jiang, Q.; Dong, X.; Zhao, Y.; Zhao, H. Dynamic Impedance of the Wide-Shallow Bucket Foundation for Offshore Wind Turbine Using Coupled Finite-Infinite Element Method. Energies 2019, 12, 4370. [Google Scholar] [CrossRef]
- Zhang, P.; Li, Y.E.; Lv, Y.; Ding, H.; Le, C. Bearing Capacity Characteristics of Composite Bucket Foundation Under Torque Loading. Energies 2019, 12, 2487. [Google Scholar] [CrossRef]
- Zhou, L.; Ding, S.; Song, M.; Gao, J.; Shi, W. A Simulation of Non-Simultaneous Ice Crushing Force for Wind Turbine Towers with Large Slopes. Energies 2019, 12, 2608. [Google Scholar] [CrossRef]
- Zekavati, A.-A.; Khodaverdian, A.; Jafari, M.-A.; Hosseini, A. Investigating performance of micropiled raft in foundation of power transmission line towers in cohesive soil: Experimental and numerical study. Can. Geotech. J. 2018, 55, 312–328. [Google Scholar] [CrossRef]
- Nazir, R.; Moayedi, H.; Pratikso, A.; Mosallanezhad, M. The uplift load capacity of an enlarged base pier embedded in dry sand. Arab. J. Geosci. 2015, 8, 7285–7296. [Google Scholar] [CrossRef]
- Pacheco, M.P.; Danziger, F.A.B.; Pinto, C.P. Design of shallow foundations under tensile loading for transmission line towers: An overview. Eng. Geol. 2008, 101, 226–235. [Google Scholar] [CrossRef]


| Category | No. | Test Items | Number of Tests | Test Results |
|---|---|---|---|---|
| Physical parameters tests | 1 | Particle size analysis | 5 | Fine-grained silt and well graded |
| 2 | Nature density (g/cm3) | 3 | 1.42, 1.58, 1.49 | |
| 3 | Moisture content (%) | 5 | 5.5, 14.7, 5.8, 19.4, 6.53 | |
| 4 | Specific gravity of soil particle | 3 | 2.55, 2.54, 2.61 | |
| 5 | Salt content test | 2 | Low salinity and no salt heaving | |
| 6 | Compressibility coefficient (Mpa−1) | 1 | 0.17, medium compressibility | |
| Mechanical parameters tests | 7 | Direct shear tests | 3 | As shown in Table 2 |
| 8 | Unconsolidated-undrained triaxial compression tests | 3 | As shown in Table 3 | |
| Thermodynamic parameters tests | 9 | Frost heave rate (%) | 3 | 6, strong frost heaving |
| 10 | Thermal conductivity (W/(m·K)) | 3 | 1.07 | |
| 11 | Freezing temperature (°C) | 2 | −0.097 |
| Sampling Location | c (kPa) | φ (°) |
|---|---|---|
| Underground 1 m | 3.78 | 10.70 |
| Underground 2 m | 5.88 | 10.37 |
| Underground 3 m | 9.86 | 11.97 |
| Compactness-Moisture Content | 50/100/150 kPa | 100/200/300 kPa | ||
|---|---|---|---|---|
| c (kPa) | φ (°) | c (kPa) | φ (°) | |
| 80–8% | 22.8 | 33.4 | 30.2 | 30.5 |
| 85–8% | 38.1 | 30.3 | 30.4 | 32.1 |
| 80–11% | 28.0 | 30.6 | 19.3 | 29.6 |
| 85–11% | 10.1 | 33.3 | 17.5 | 30.4 |
| 80–14% | 13.2 | 23.9 | 9.4 | 26.1 |
| 85–14% | 17.6 | 28.1 | 8.8 | 28.9 |
| Mean value | 21.6 | 29.9 | 19.2 | 29.6 |
| Levels | Factors | ||
|---|---|---|---|
| λ | d (m) | D (m) | |
| 1 | 1.0 | 0.2 | 0.4 |
| 2 | 2.0 | 0.3 | 0.5 |
| 3 | 3.0 | 0.4 | 0.6 |
| No. | λ | d (m) | D (m) | ht (m) | Dt (m) | θ (°) | V (m3) |
|---|---|---|---|---|---|---|---|
| no.1 | 1.0 | 0.2 | 0.4 | 0.5 | 0.5 | 11.3 | 0.050 |
| no.2 | 1.0 | 0.3 | 0.5 | 0.6 | 0.6 | 9.5 | 0.098 |
| no.3 | 1.0 | 0.4 | 0.6 | 0.7 | 0.7 | 8.1 | 0.170 |
| no.4 | 2.0 | 0.2 | 0.5 | 1.2 | 0.6 | 7.1 | 0.143 |
| no.5 | 2.0 | 0.3 | 0.6 | 1.4 | 0.7 | 6.1 | 0.260 |
| no.6 | 2.0 | 0.4 | 0.4 | 1.0 | 0.5 | 0.0 | 0.141 |
| no.7 | 3.0 | 0.2 | 0.6 | 2.1 | 0.7 | 5.4 | 0.315 |
| no.8 | 3.0 | 0.3 | 0.4 | 1.5 | 0.5 | 1.9 | 0.159 |
| no.9 | 3.0 | 0.4 | 0.5 | 1.8 | 0.6 | 1.6 | 0.309 |
| Temperature (°C) | γ (kN/m3) | E (MPa) | Poisson’s Ratio | c (kPa) | φ (°) |
|---|---|---|---|---|---|
| −5 | 17.5 | 8.4 | 0.19 | 130.0 126.4 | 21.0 20.2 |
| 7.1 | 0.24 | ||||
| 7.3 | 0.24 | ||||
| Mean value | 7.6 | 0.22 | 128.2 | 20.6 | |
| −10 | 17.1 | 15.7 | 0.18 | 140.5 134.7 | 23.7 20.9 |
| 15.3 | 0.19 | ||||
| 14.6 | 0.22 | ||||
| Mean value | 15.2 | 0.20 | 137.6 | 22.3 | |
| −15 | 16.3 | 22.3 | 0.19 | 148.7 164.1 | 23.1 30.7 |
| 22.8 | 0.18 | ||||
| 23.2 | 0.17 | ||||
| Mean value | 22.8 | 0.18 | 156.4 | 26.9 | |
| MateRial | Temperature (°C) | Normal Stiffness (MPa/m) | Tangential Stiffness (MPa/m) | c (kPa) | φ (°) |
|---|---|---|---|---|---|
| Interface | -5 | 76 | 76 | 89.7 | 14.4 |
| -10 | 152 | 152 | 96.3 | 15.6 | |
| -15 | 228 | 228 | 109.5 | 18.8 |
| Temperature (°C) | Source of Variance | Standard Deviation | F-Test | ||
|---|---|---|---|---|---|
| Degree of Freedom | F Calculated Value | F Critical Value | |||
| −5 | λ | 1702.2 | 2 | 3.56 | F0.01 (2,2) = 99.0 F0.05 (2,2) = 19.0 F0.1(2,2) = 9.0 |
| d | 752.1 | 1.49 | |||
| D | 1796.1 | 3.37 | |||
| −10 | λ | 4178.5 | 2 | 4.22 | |
| d | 1634.8 | 1.65 | |||
| D | 4113.9 | 4.15 | |||
| −15 | λ | 10465.9 | 2 | 5.14 | |
| d | 3024.1 | 1.49 | |||
| D | 8206.0 | 4.03 | |||
© 2020 by the authors. Licensee MDPI, Basel, Switzerland. This article is an open access article distributed under the terms and conditions of the Creative Commons Attribution (CC BY) license (http://creativecommons.org/licenses/by/4.0/).
Share and Cite
Han, Y.; Cheng, J.; Cui, Q.; Dong, Q.; Song, W. Uplift Bearing Capacity of Cone-Cylinder Foundation for Transmission Line in Frozen Soil Regions, Using Reduced-Scale Model Tests and Numerical Simulations. Energies 2020, 13, 2066. https://doi.org/10.3390/en13082066
Han Y, Cheng J, Cui Q, Dong Q, Song W. Uplift Bearing Capacity of Cone-Cylinder Foundation for Transmission Line in Frozen Soil Regions, Using Reduced-Scale Model Tests and Numerical Simulations. Energies. 2020; 13(8):2066. https://doi.org/10.3390/en13082066
Chicago/Turabian StyleHan, Yangchun, Jiulong Cheng, Qiang Cui, Qianyun Dong, and Wanting Song. 2020. "Uplift Bearing Capacity of Cone-Cylinder Foundation for Transmission Line in Frozen Soil Regions, Using Reduced-Scale Model Tests and Numerical Simulations" Energies 13, no. 8: 2066. https://doi.org/10.3390/en13082066
APA StyleHan, Y., Cheng, J., Cui, Q., Dong, Q., & Song, W. (2020). Uplift Bearing Capacity of Cone-Cylinder Foundation for Transmission Line in Frozen Soil Regions, Using Reduced-Scale Model Tests and Numerical Simulations. Energies, 13(8), 2066. https://doi.org/10.3390/en13082066