1. Introduction
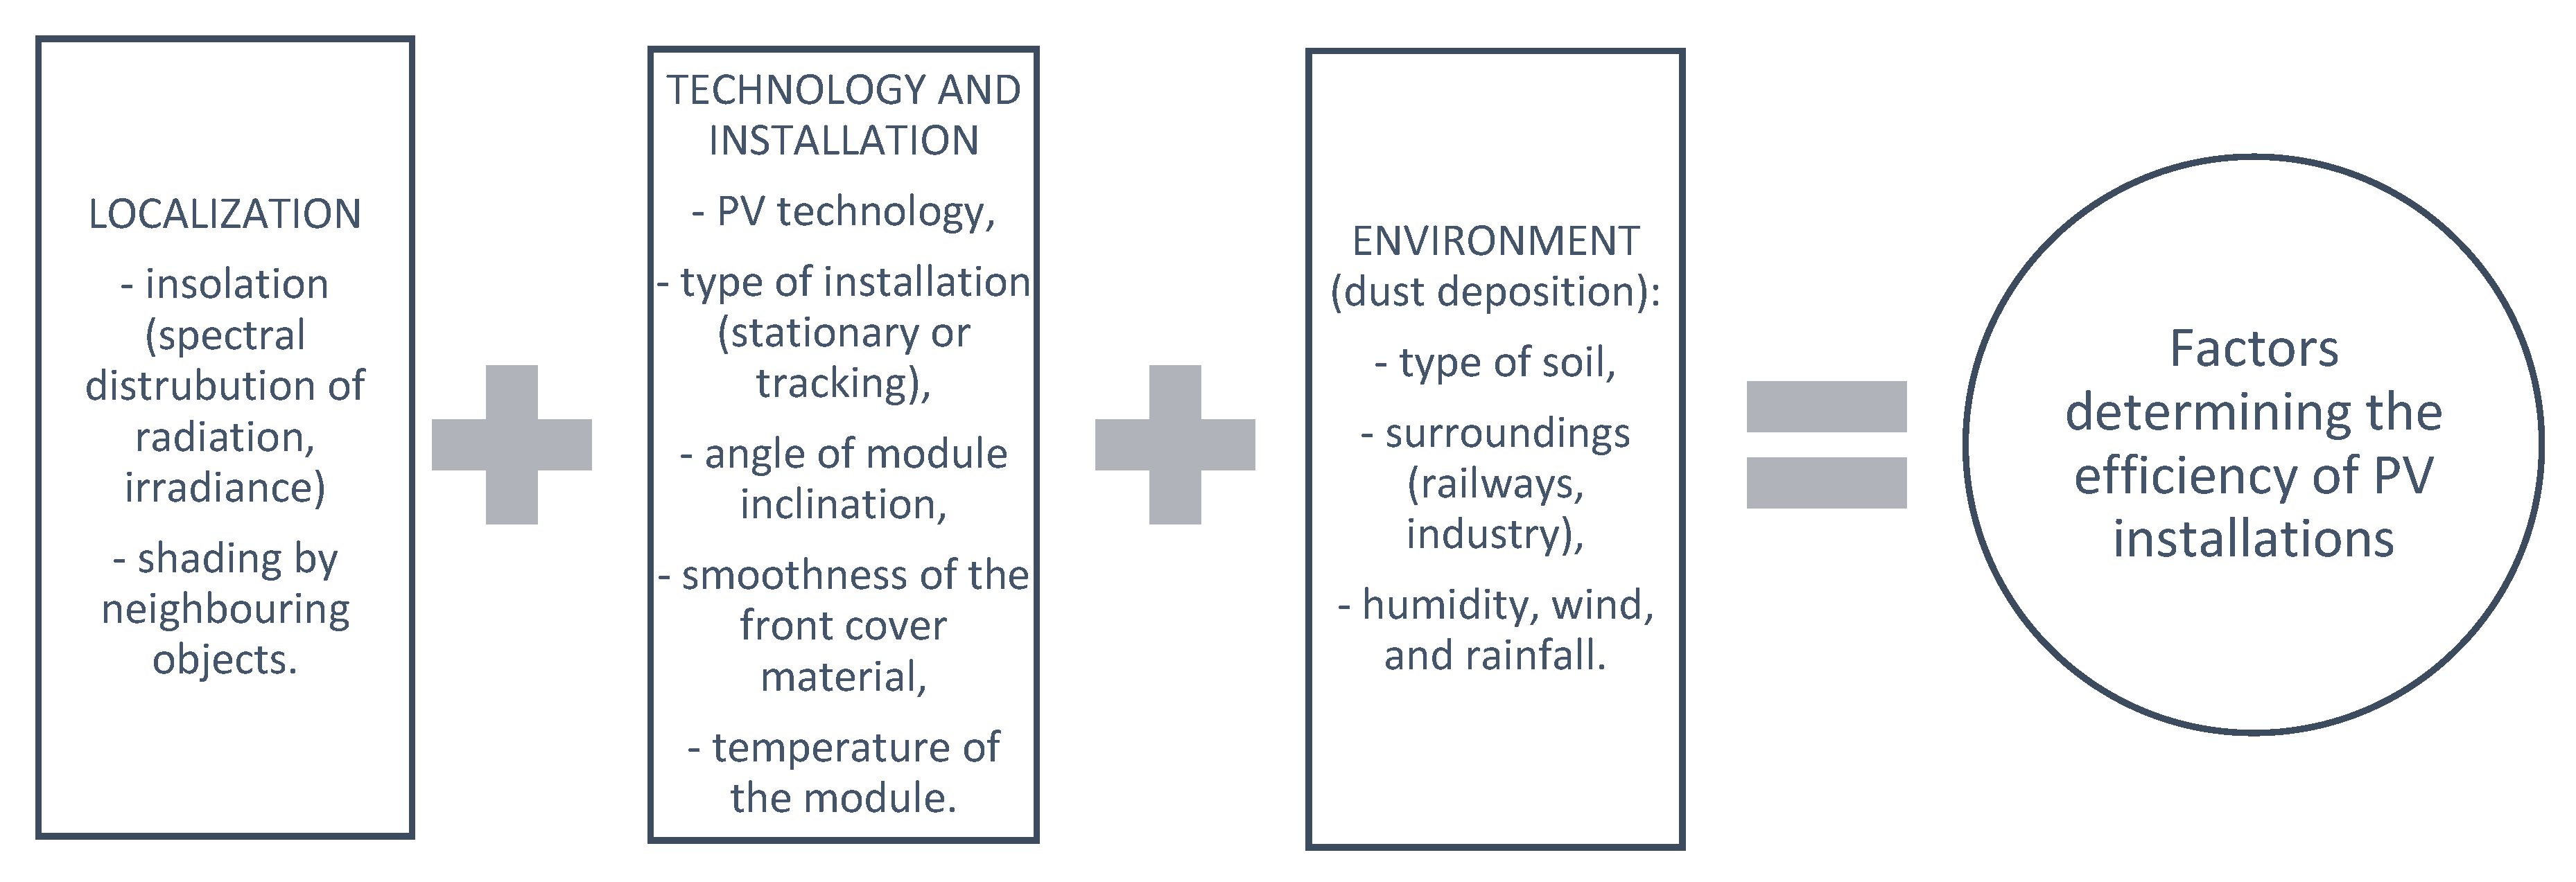
Various factors that affect the performance of photovoltaic (PV) modules, such as: type of material of the front cover, position relative to the sun, type of installation (tracking or stationary), location, temperature of the cells included in the modules, existing shading, and deposition of dirt on the front side modules, can occur simultaneously or individually (
Figure 1).
Many researchers have conducted experiments to determine the magnitude of the effect of the above factors on performance of PV modules, independently. Meanwhile, under natural conditions, one should take into account situations in which all these factors (e.g. dusting, shading, and non-optimal orientation of the modules) occur simultaneously.
The purpose of this publication is to determine how much dust, shading, and non-optimal alignment of the module with respect to the sun affects the efficiency of PV installations.
2. Effect of Dust on Photovoltaic Modules
Dust has a significant impact on reducing the produced electricity from a photovoltaic module by blocking solar radiation absorbed by the solar module. An important factor limiting the amount of energy produced is the reduction of output power due to dust deposition on the surface of the photovoltaic (PV) module. Deposition of airborne dust on PV modules may decrease the transmittance of solar cell glazing and cause a significant degradation in the solar conversion efficiency of PV modules. The effect of the dust layer on the efficiency of solar modules is significant; the sediment reduces the short-circuit current and hence the power generated by the PV module, and its efficiency.
Depending on the location of the solar installation, the composition of dust and its gradation can vary significantly. These differences affect the degree of reduction of photovoltaic module performance [
1].
The amount of accumulated dust is strongly dependent on the angle of the surface and is fundamentally different in different locations. Elminir et al. [
2] studied the effect of the slope of an absorbent surface on the dust deposition density. The linear decrease in glass transparency as a function of the surface inclination angle proves that the amount of dust accumulated is closely related to the angle of inclination [
3].
2.1. Dust Composition
Many studies published the results of studies on the composition and gradation of dust grains from various regions of the world.
Fujiwara et al. [
4] stated that the composition of dust depends on the place of its formation, the existence of desert and urbanized areas, in particular industrial or expressways. In large cities, surface pollution is the result of the coexistence of liquid, solid, and gas particles from various sources in the air. Airborne heavy metal particles and organic compounds mainly come from road transport. In turn, particles of sulfur, cadmium, and antimony were found in dust samples collected near highways, originating from abrasion of automotive brake shoes. By contrast, in a dry climate, in a desert or semi-arid area, the main source of dust is soil.
Bi et al. [
5] found that the trace metal content of various dust samples, originating both directly from soil and roads, increases with decreasing particle diameter. The authors showed that trace metals are evenly distributed in the soil, regardless of their particle size. About 40% of the trace metals were particles with a diameter of no more than 100 µm. An increased lead content was found in soil samples collected near industrial plants.
Also, Kazmerski et al. [
6] found that dusts have different physical properties and composition, depending on the location. Samples of the dust taken from industrialized and densely populated areas in the northern hemisphere contain characteristic impurities, for example particles floating in the air, originating from coal-fired power plants or from emissions related to road transport in urban areas. Similarly, in the villages, there are characteristic pollution resulting from the use of fertilizers and resulting from the cultivation of plants.
Cabanillas and Munguia [
7] studied dust samples deposited in Mexico. In addition to sand and clay, they also found soot, mushrooms and their spores, and plant fibers. At the same time, they identified organic substances as material binding these impurities to the front surface of the module.
2.2. Gradation of Dust Particles
Mani and Pillai [
8] conducted an experiment that fully used artificial contaminants such as limestone, cement, and carbon particles. The tests were carried out in laboratory conditions with artificial halogen lamps. They found that small particles had the most adverse effect on PV performance, compared to those with a larger diameter.
Research conducted by McTainsh et al. [
9] led to the conclusion that the size of dust grains deposited on the surface of photovoltaic modules is correlated with the distance from which the wind moved the pollution. Due to the size of the dust grains, three groups of impurities have been classified: the smallest particles with a diameter of up to 5 µm can arrive from distant areas, particles with a diameter in the range of 20 to 40 µm are produced locally, while larger particles with a diameter of 50 to 70 µm come from the immediate area, and most often their sources are local human activity, vehicles, machines, and farm animals. The authors proved that pollution from the immediate environment is of greatest importance for the dust module deposition on the surface.
Beattie [
10] proposed a grain size classification that allows for the identification of the origin of particles: particles with a diameter of 60 to 2000 µm are mainly wind-carried sand, while particles with a size of 4 to 60 µm come from soils resulting from river, lake, or marine species, and particles smaller than 4 µm come from different types of clay soils.
Biryukov [
11] conducted an analysis of impurities using an optical microscope and an electron scanning microscope (SEM) and showed that the particle size of impurities can vary significantly. His samples were taken in the Negev Highlands, in the south of Israel. About 55% of the front surface of the module was covered with particles with a diameter of 20 to 40 µm. In turn, taking into account the parameters determining the number of deposited particles per unit area of the module, dust particles with a diameter of 5 to 35 µm had the largest share.
Bouaouadja et al. [
12] studied dust samples collected in the desert. They showed that the particle size distribution can be homogeneous or two-component, which means that the diameters of dust particles in the sample can be similar, or completely different. Also, the morphology of the particles can be different, in the samples both grains of spherical shape with a smooth surface, and at the same time elongated, and grains with a rough surface were found.
Zhang et al. [
13] studied dust samples collected in Wuhu, a city in eastern China, on the Yangtze River. They analyzed the grain size in 76 samples taken.
Most particles, about 34%, had a diameter of 120 to 370 μm, and 25% were in the range of 20 to 55 μm.
Igathinathane et al. [
14] analyzed pollution deposited near sawmills dealing with the production of wood pellets. The impurity diameters turned out to be quite large, the average particle length was 113.8 μm, and the width was 73.6 μm, which did not differ from the size of the produced granulate.
2.3. Amount of Deposited Dust
Garg [
15] and Hassan [
16] emphasize the fact that the majority of impurities accumulate on the module’s surface during the first month. These conclusions result both from measurements of the change in glass transmittance, and from measurements of the mass of deposited impurities.
Gupta [
17] presented the results of research on natural dirt carried out in different parts of the world. He collected results from various periods of research: from several days to several years, carried out in different locations around the world, in both external and laboratory conditions. The average values of the decrease in efficiency differ significantly: the decrease in efficiency was about 1% per month for measurements carried out in the USA, 9.33% per month in dry climate, and 6.5% in Europe.
Ta et al. [
18] conducted research in the Gansu region of northwestern China for over 15 years. They compared the amount of dirt deposited on the front plate of solar modules near the Gobi Desert and loess areas. More dust settled near the Gobi Desert. In addition, they showed a relationship with the season of the year, in particular the amount of winds: 30% of the annual amount of pollution is accumulated in spring, while in winter—below 20%.
In the Gobi Desert area, the density of deposited dust was 36.48 g/m2, and in loess areas, around 25.17 g/m2.
3. Shading
Objects that cause soft shading, such as tree branches, significantly reduce the amount of radiation reaching the mud as a result of scattering and refraction of light. In turn, hard shading, occurring directly on the front cover of the module, e.g., caused by bird droppings or snow, completely blocks solar radiation.
Bimenyimana et al. [
19] conducted research on the impact of shading on the current–voltage characteristics of photovoltaic modules, and indicated that the decrease in their efficiency also depends on the structure of the material from which the module’s front cover was made, and the mutual position of the bypass diode and shading on the module.
For a module made of amorphous silicon, the maximum power drop was 26.90%. Tsafarakis et al. [
20] have developed a new method of shading identification in PV systems. The proposed algorithm analyzes the graph of energy production efficiency of the PV module compared to the reference module. If the dispersion of results is reproducible in the following days, the cause is identified as shading. Teo et al. [
21] published research results on the effect of partial shading and a critical point that reduces the effect of shading. Tests of current–voltage characteristics of shaded modules, and the different degree of shading, have shown that the PV installation becomes insensitive to shading when the radiation intensity of the shaded modules reaches a certain critical point, which may vary depending on the number of shaded modules.
Sarniak et al. [
22] used numerical simulations for the study of impact of solar module shading on current–voltage characteristics using Matlab software, using a two-diode model. They obtained good compliance of the developed model with measurements, in particular for slight shading.
Also, Bouali et al. [
23] have developed a new algorithm to optimize the parameters of solar cells and modules, based on the interrelationships between organisms in the ecosystem, recognizing the solar system as a dynamic non-linear multimodal system. The proposed algorithm has been verified by comparing with field measurements of the modules in real conditions.
Guo et al. [
24] found that bypass diode configuration is important for the operation of a partially shaded solar module; modules with a larger number of bypass diodes have higher efficiency if only the module string is shaded.
4. Deviation from Optimal Module Position
The absorber can receive the most energy if the surface is perpendicular to the sun’s rays. However, since the angle of incidence of sunlight depends on the time of day and season, the plane should be directed to the position of the sun during the phase of the greatest radiation.
Solar tracking systems are used to increase the amount of incoming solar radiation. Use of these systems is associated with increased system costs, due to energy consumption. Maximum performance of photovoltaic modules is ensured—in the case of stationary installation—by positioning them such that the angle of inclination of the module is equal to the optimal for the given location, and that the modules face south. If we consider a block whose walls have different angles of inclination, each of these surfaces will be illuminated with light of a different radiation intensity value; for example, walls facing south and inclined at the optimal angle (surfaces on which radiation falls perpendicularly) will receive the largest amount of radiation (100%), while vertical walls facing south receive 70% of this.
Any deviation from this position results in a decrease in the power obtained in relation to the maximum achievable by the module.
In practice, the angles of inclination of a plane between 30 and 45° turn out to be optimal. Depending on the period of use (all year round or seasonal), tilt angles between 25 and 70° apply, depending on the localization.
Kasssem et al. [
25] recognized solar radiation as the most important meteorological parameter. Therefore, they decided that choosing the best location for installing a solar system requires an assessment of the solar energy potential in a specific region, determining the correct slope and azimuth for a given location.
Toledo et al. [
26] analyzed models for estimating solar radiation intensity, also at non-optimal orientations and inclination angles of solar modules.
Optimization of the tilt angle has been performed for various locations in European countries, Middle Eastern countries, Asian countries, and Canada, as described by Berisha [
27], who studied the optimal angle of inclination for modules facing south in Pristina.
5. Experimental Studies—The Influence of Accumulation of Dust on PV Module Efficiency
Studies of natural module pollution were carried out using a module exposed to atmospheric agents for two years. After determining the current–voltage characteristic, the module was cleaned for comparative measurement. There are no working industrial facilities near the laboratory or the roof on which we conducted the research, but the area is surrounded by roads with significant traffic.
During the study using the dust prepared in the laboratory, three monocrystalline PV modules from different manufactures were tested: the first module was exposed outside the building for 2 years, then tested and cleaned, and then, together with the other two modules, covered with dust in laboratory conditions. After determining the current-voltage (I-V) characteristics of the pure module, the tested PV module was then covered with a layer of dust created on the basis of natural sediments. To produce dust similar to natural dust, sand was collected from roads located at the Gdansk University of Technology. The place where this fraction was obtained was located a short distance from the place in which dust had accumulated in a natural way on the surface of module 1 during two years. This was to obtain dust with similar properties. In order to eliminate possible clumping and fragmentation of the granular fraction, the collected sample was sieved and ground in a mortar. Then, the energy generator was covered, which was done by spreading the prepared dust with simultaneous blowing, ensuring the most even coverage of the module surface. By generating artificial wind, the most volatile fractions were blown away, and the unevenness of sand deposition was reduced. These operations were repeated twice until an even layer of contamination was obtained. The thickness of the coverage was random and was different at each measurement. The last step was to collect dust from areas that are not photoactive parts, such as the edges of the module, using a brush and moist material. In this way, the error associated with excess dust in places not relevant to the experiment was reduced. A second measurement was taken in exactly the same way as shown for the clean module. The thickness of the dust layer was calculated by dividing the mass of dust removed by the module surface. The annual sum of radiation energy reaching the optimally inclined surface facing south in Poland is 1100 kWh/m2. The angle of optimal inclination was assumed to be 37° for the period in which the tests were conducted. An SP Lite2 (Kipp & Zonen) solar radiation sensor was used to measure the intensity of the incident solar and artificial radiation.
A Hitachi S-3400 N scanning electron microscope (SEM) was used to perform the dust analysis. The dust was covered with a gold layer 19.4 nm thick using a Cressington 108 Auto Sputter Coater. An Analysette 22 MicroTec Plus laser particle size meter was used to determine the distribution of dust grain diameters. Computer software coupled with the device enables quick wet measurements of particles with dimensions from 0.08 to 2000 μm. To prepare the average laboratory sample of dust for testing by means of a scanning electron microscope and a laser particle analyzer, all the obtained samples of impurities obtained from the modules during the tests were collected and mixed to obtain a homogeneous mixture. Then, by quartering, the average laboratory sample was separated from the general sample and placed in a tube.
The laboratory sample was analyzed using a scanning electron microscope by placing a small amount of dust on a carbon tape and coating the sample with gold with a thickness of 19.4 nm using a sprayer. The sample prepared in this way was placed in the microscope chamber, the lid was closed, and the vacuum pump was turned on.
The main components of dust turned out to be silicon and aluminum. Traces of calcium, potassium, magnesium and iron have also been detected.
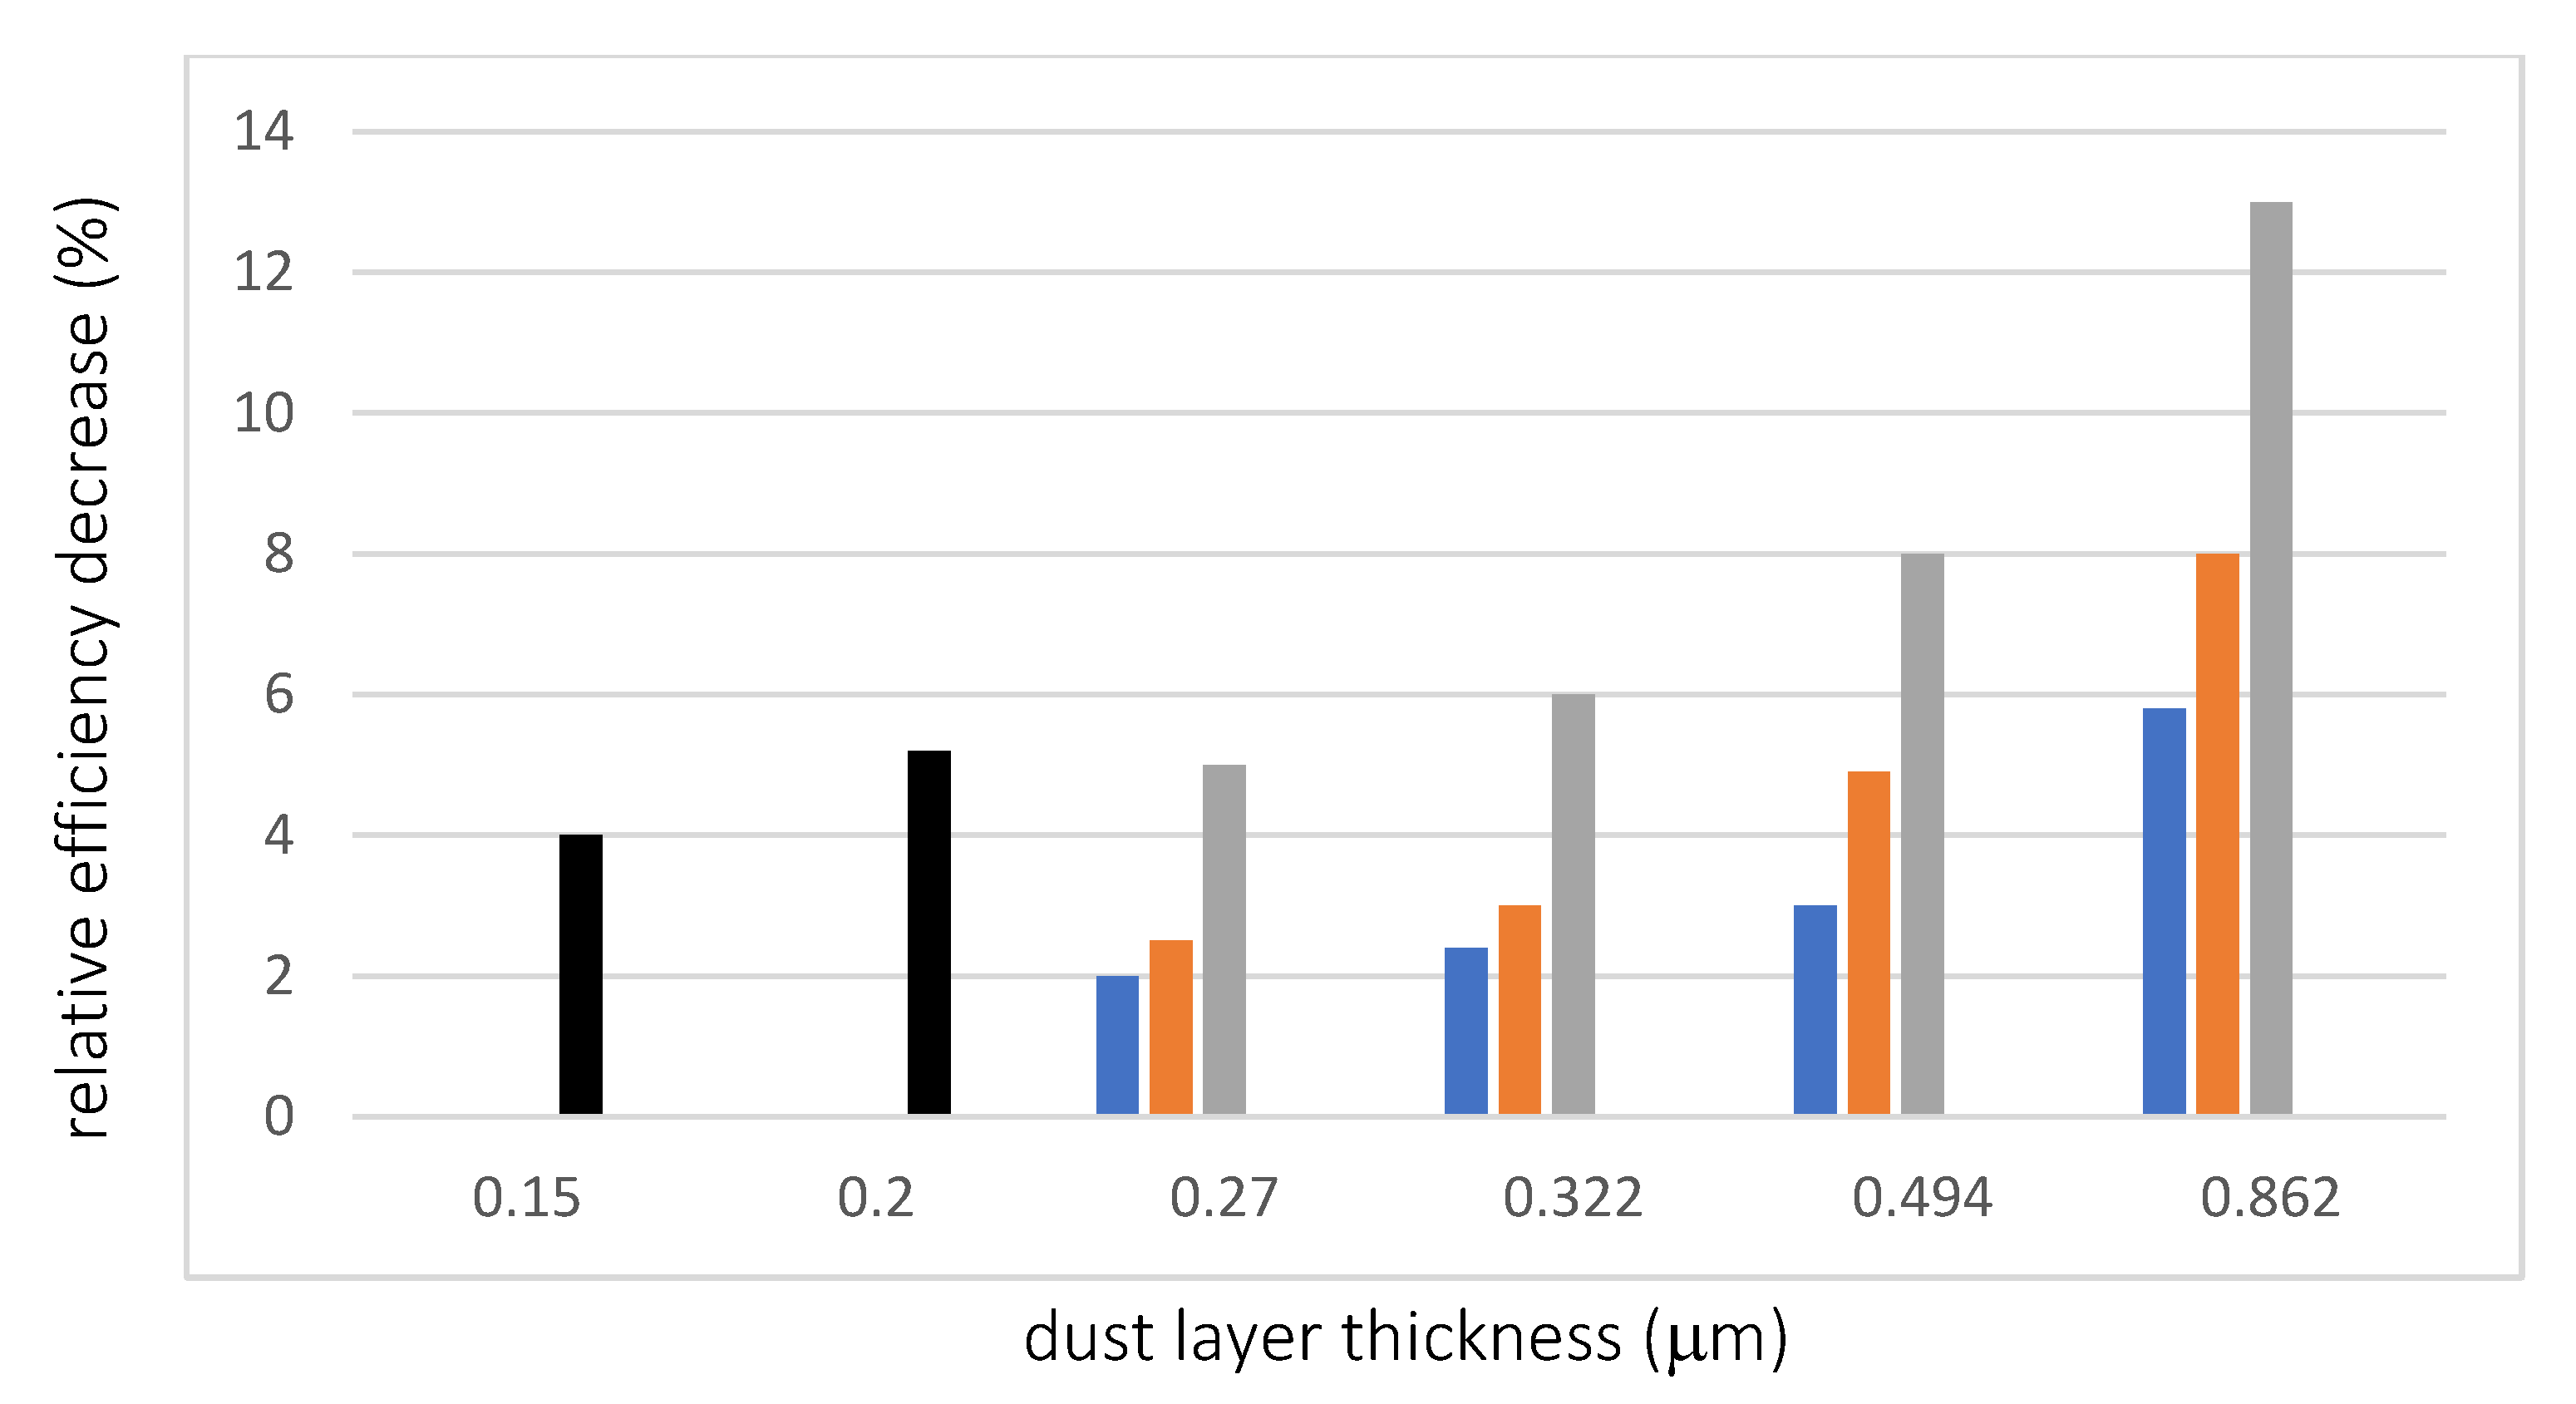
The relative decrease in efficiency for various thicknesses of the deposited dust layer was calculated as a result of the analysis of the current–voltage characteristics obtained for the examined modules, determined for a constant value of radiation intensity of about 1000 W/m2.
Figure 2 presents the relative decrease in efficiency as a function of dust layer thickness for naturally accumulated dust layers (black bars) and dust layers prepared in the laboratory.
The results obtained are consistent with those presented by other researchers, such as Elminir [
2] and Gupta [
17]. The reason for differences between results for analyzed modules is most likely the type of module front cover, its material and structure. This conclusion is confirmed by the analysis of the results obtained by the research group headed by Cabanillas [
7].
The results of dust analysis showed that the number of grains with large diameters ranging from 30 to 50 μm and small grains with a size below 10 μm is small. In the analyzed sample, the share of grains with sizes from about 15 to 25 μm is the largest.
The chemical composition of dust deposited on the surface of the module in natural conditions and generated on the basis of surrounding soils was compared. Silicon is a basic component of natural dust; aluminum and magnesium were present in smaller amounts.
It should be remembered, however, that the dust deposition is strongly dependent on the environment in which the photovoltaic module is located; therefore in areas with higher air pollution or different geological specificity, wind strength, or precipitation frequency, the pollution morphology may fluctuate significantly.
6. The Impact of Partial Shading of a Photovoltaic Module Performance—Experimental Results
We have studied the influence of partial shading of a PV module on the generated electrical power [
28].
The effect of partial shading of the surface of photovoltaic modules on the generated electric power was tested using monocrystalline modules with parameters shown in
Table 1.
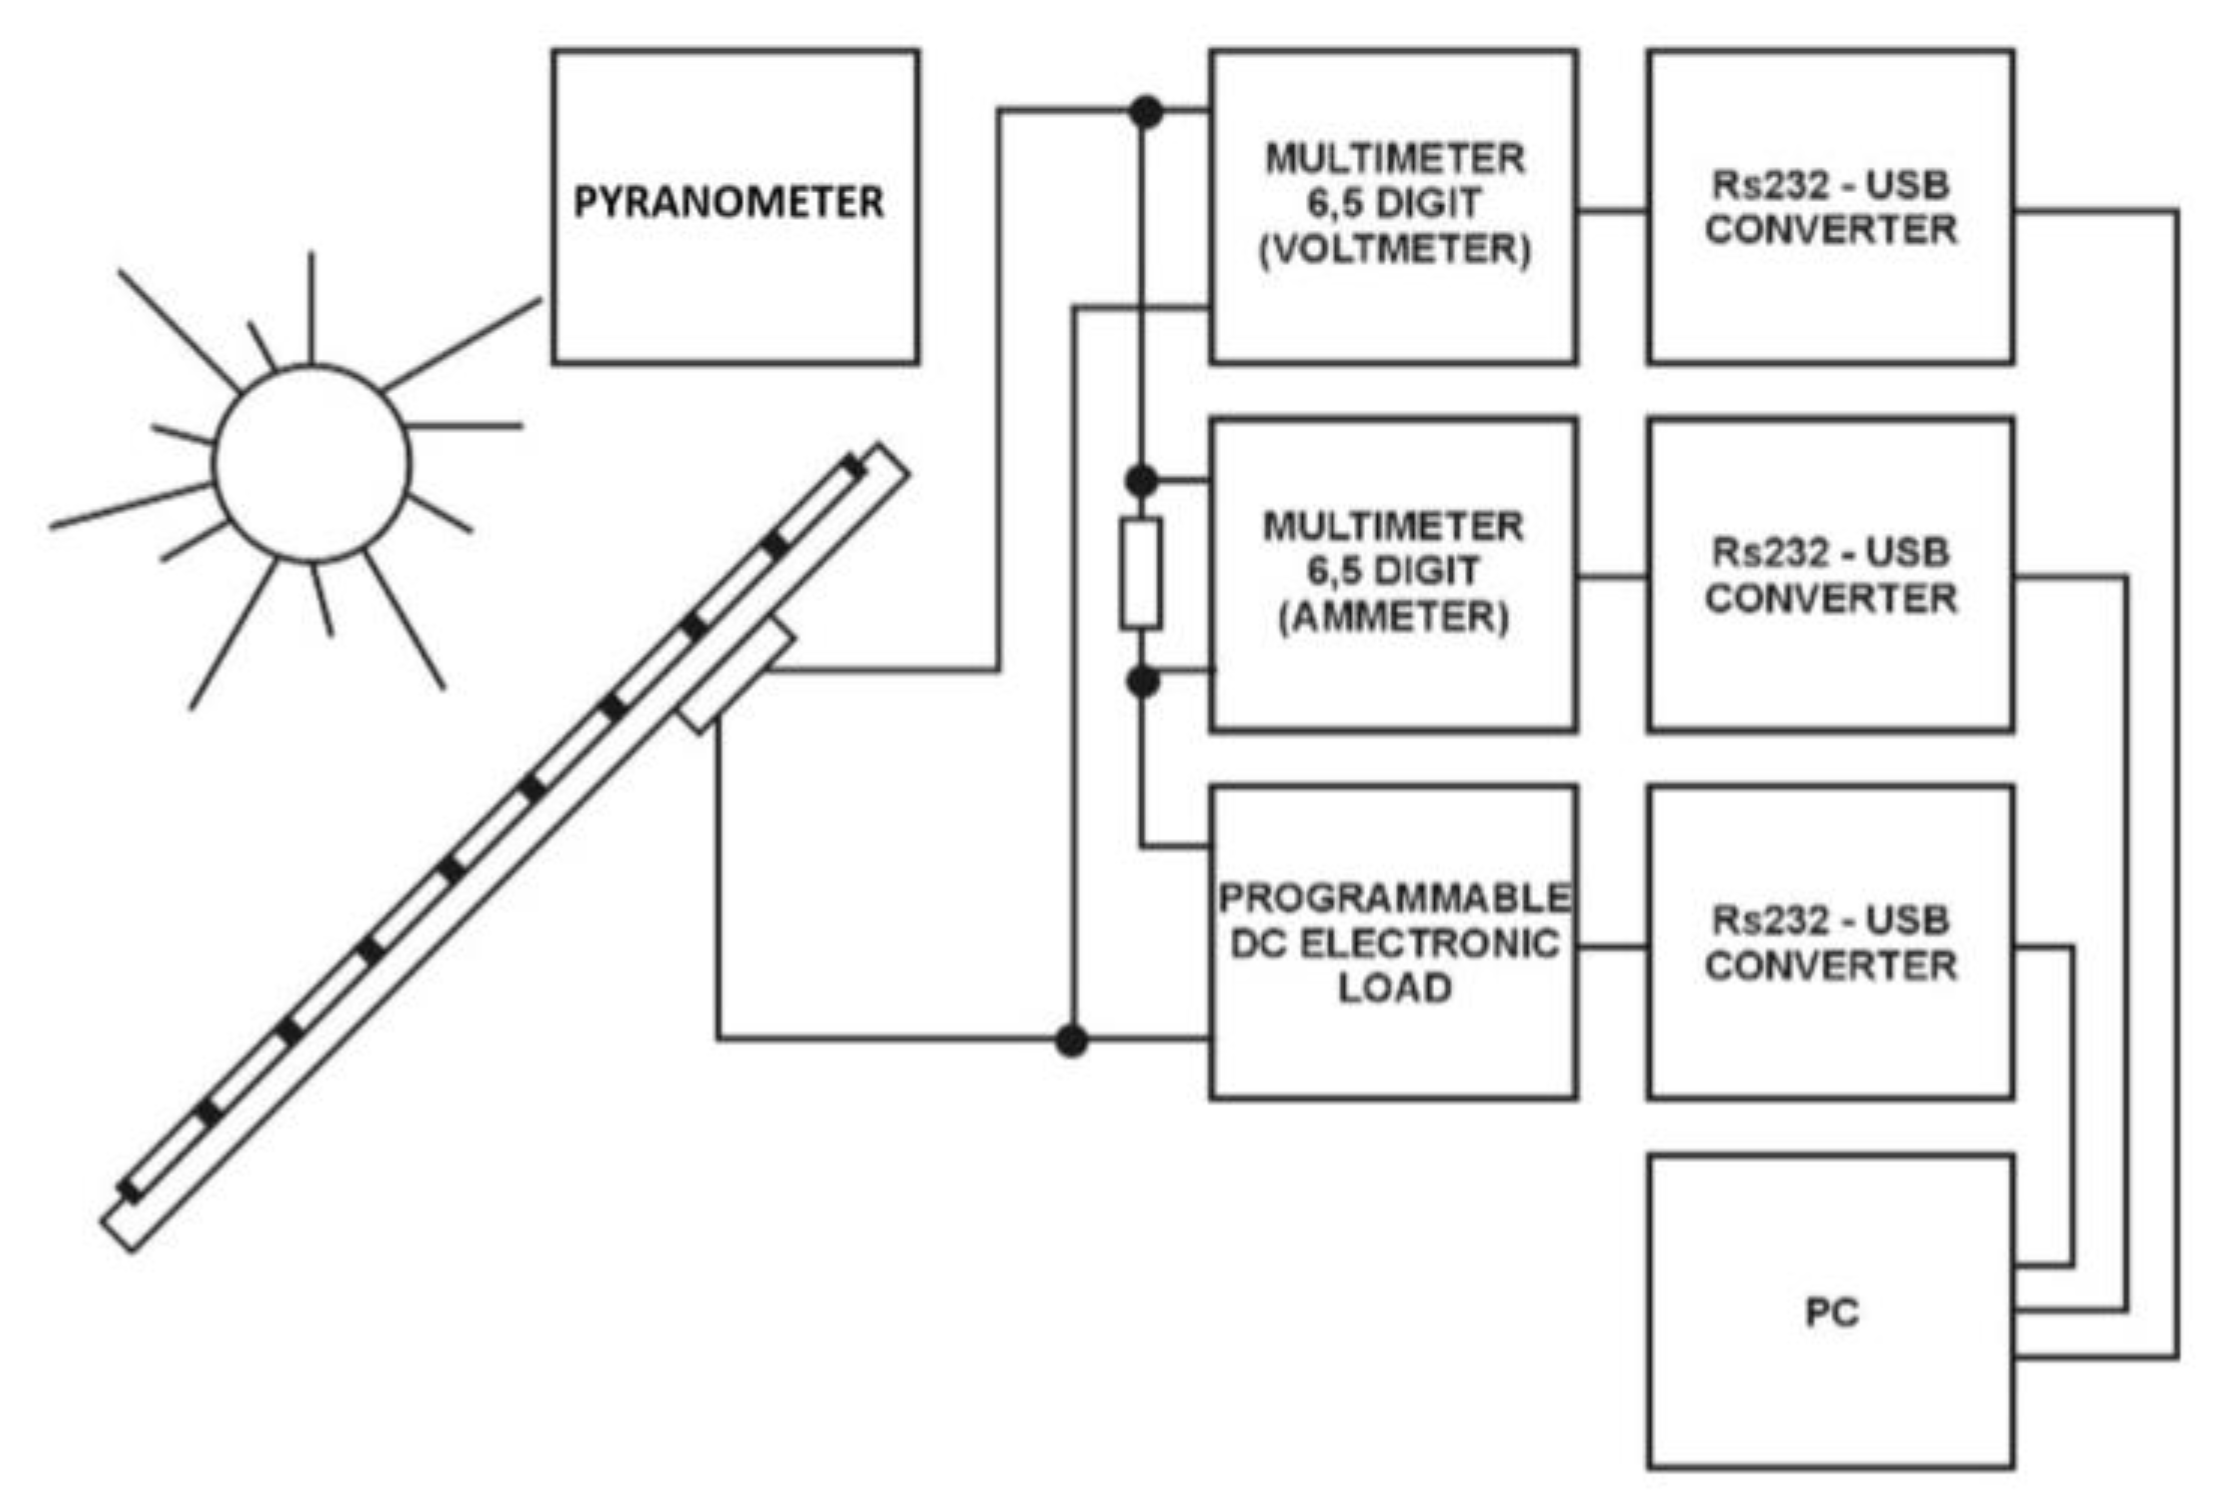
For the purpose of the experiment, a research station was designed and for measuring the current–voltage characteristics of photovoltaic modules and is presented in
Figure 3.
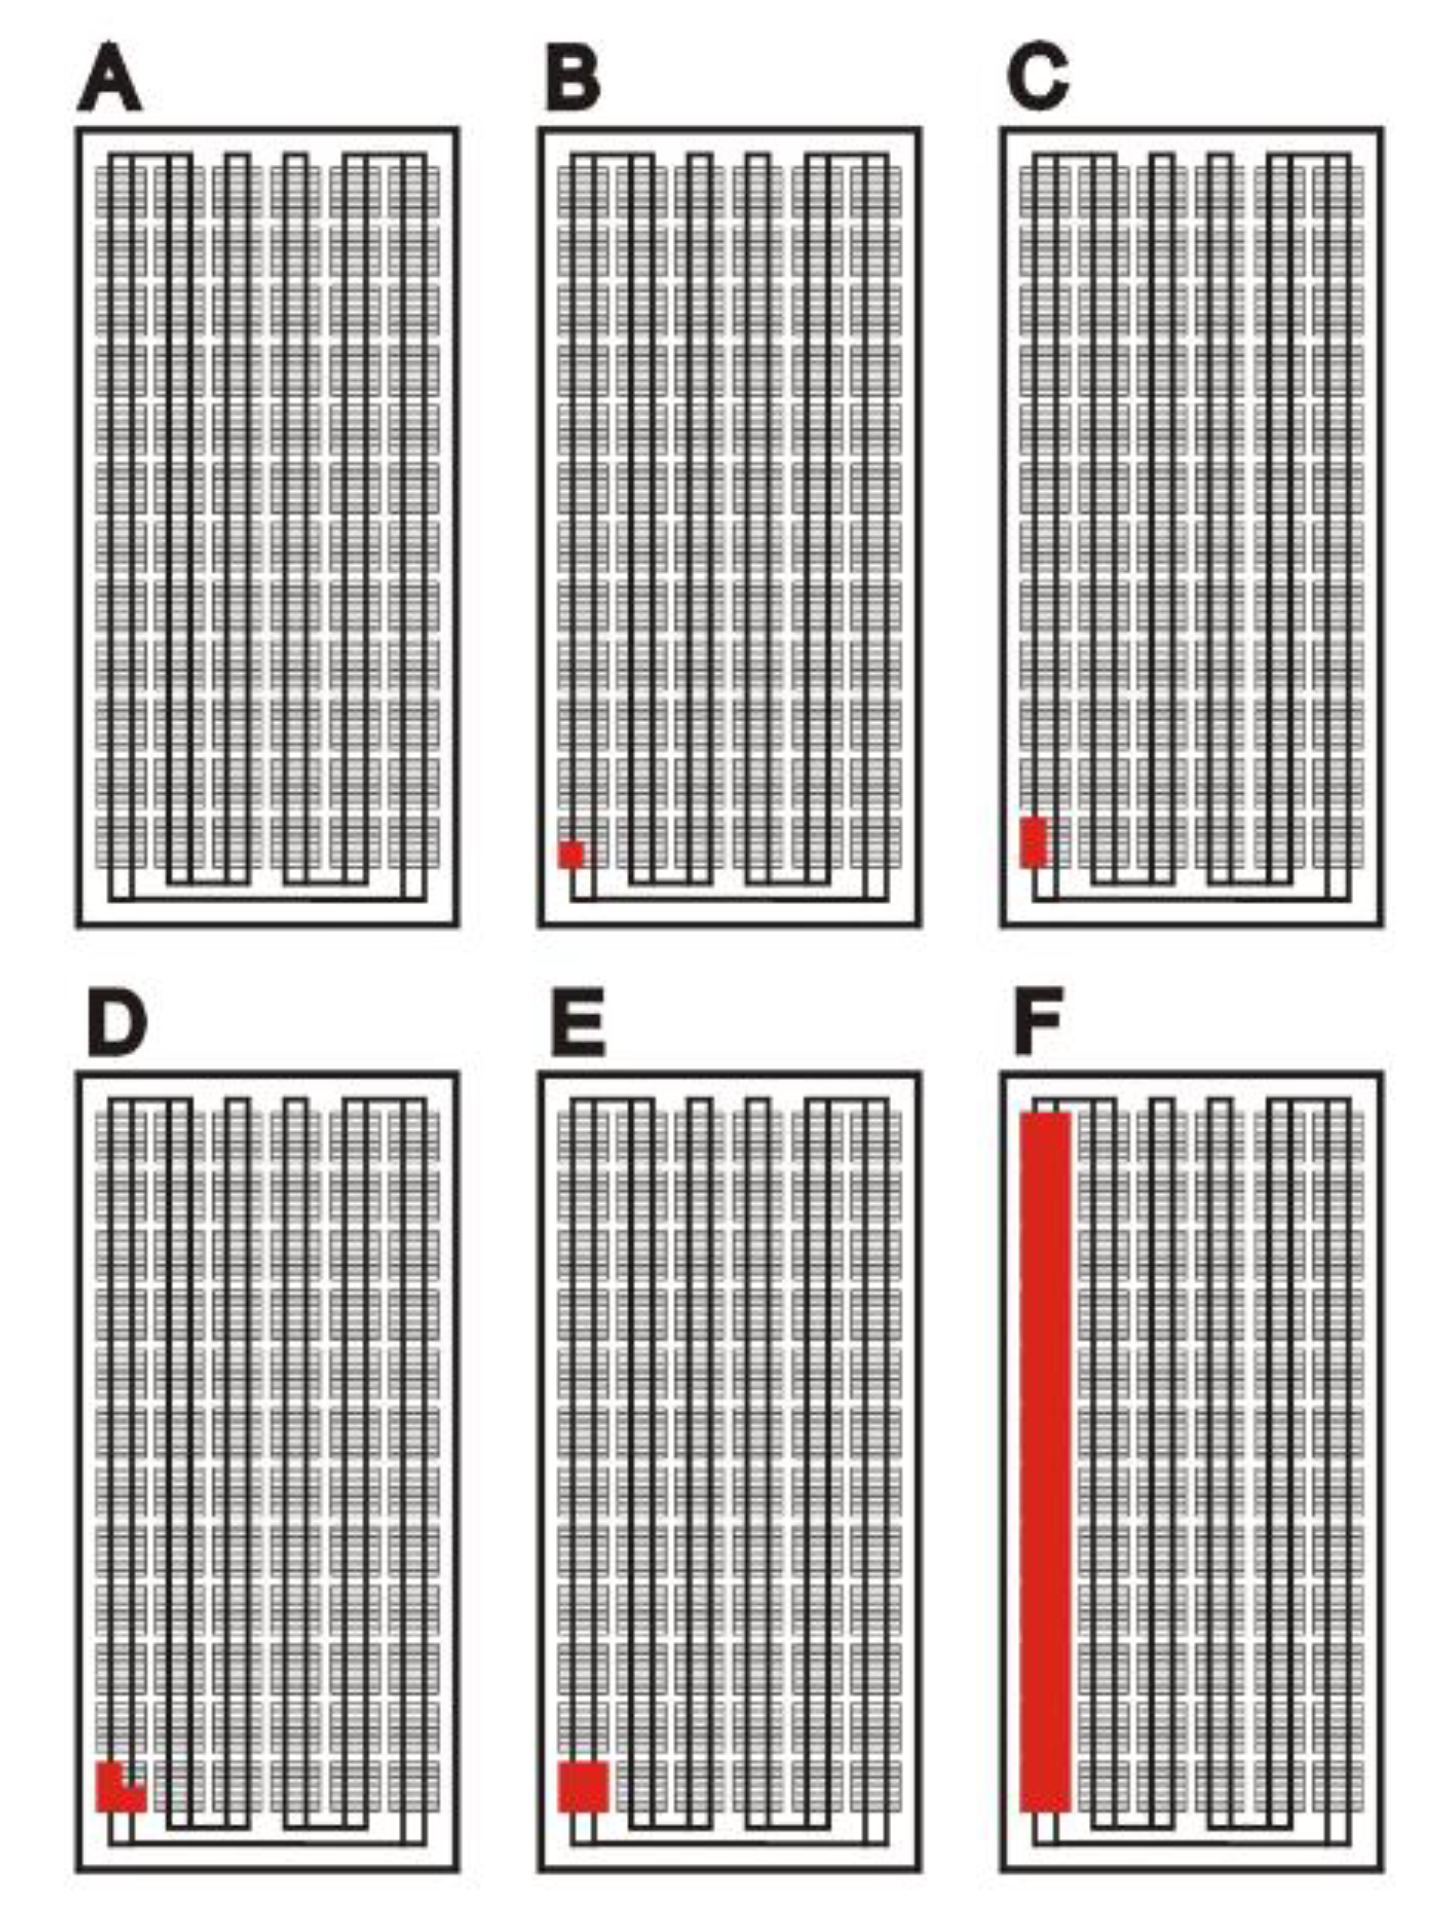
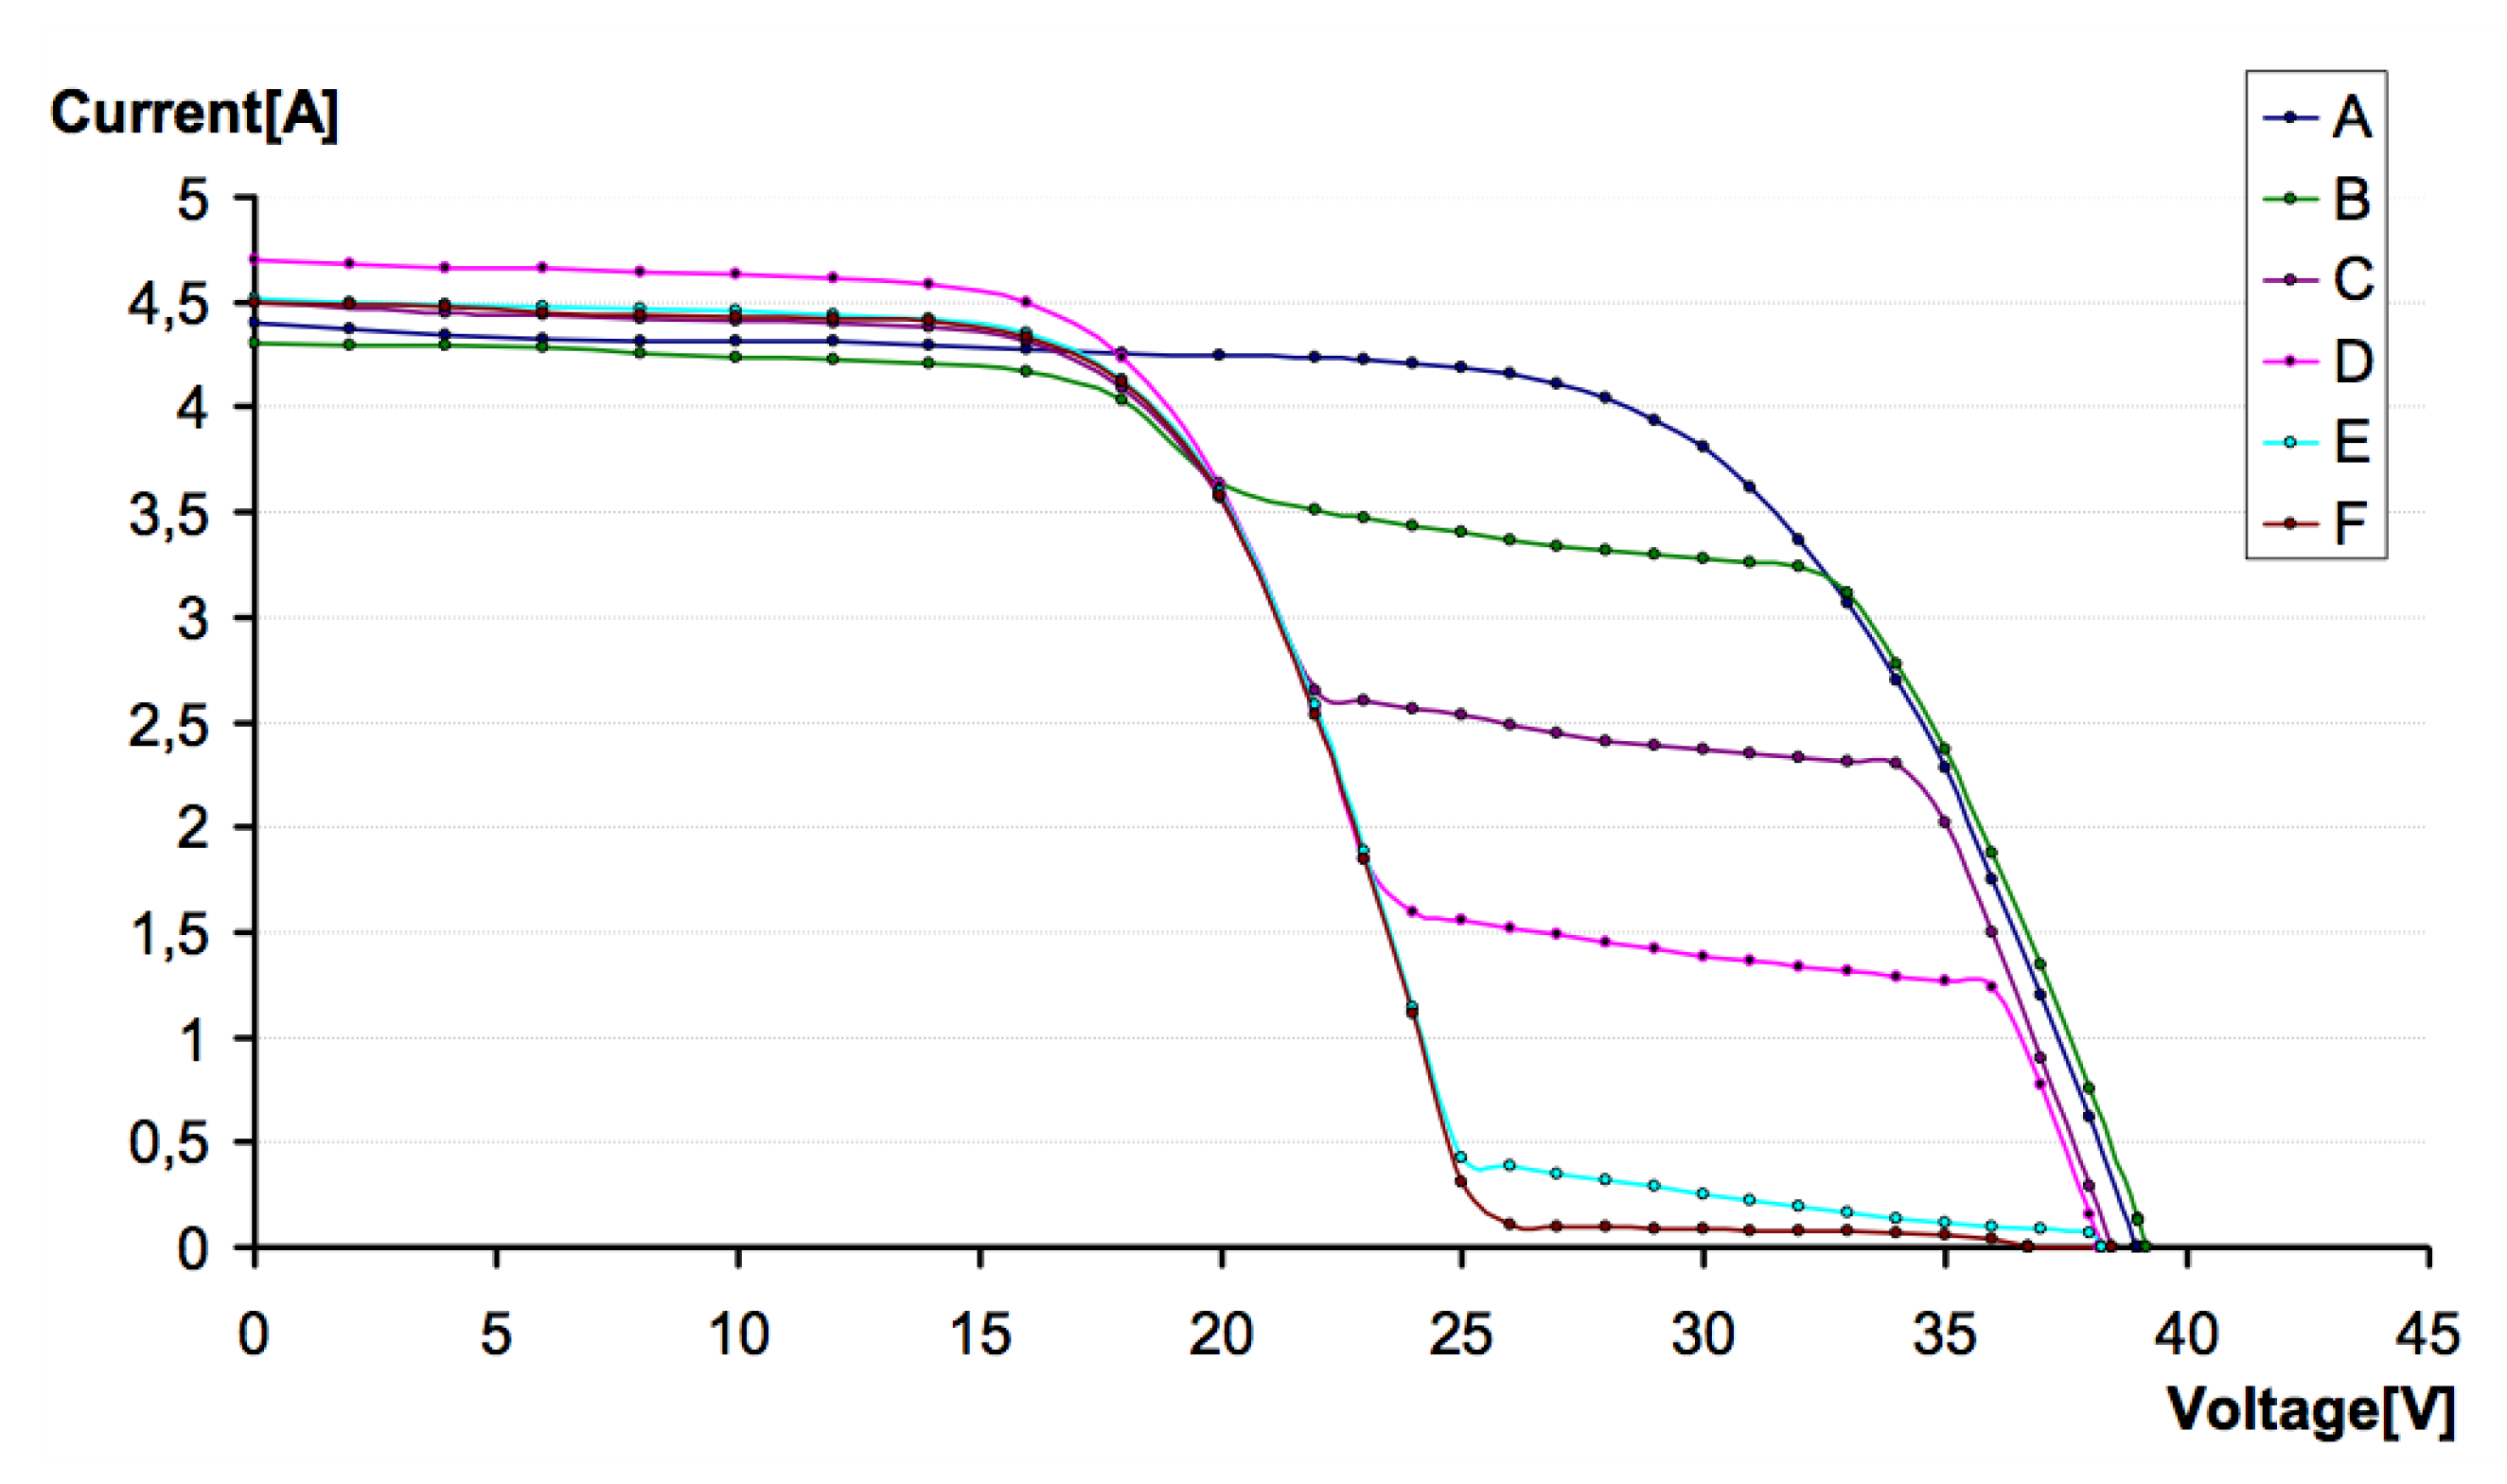
All three modules were shaded according to the diagram in
Figure 4, and current–voltage characteristics were measured for each.
To measure the voltage–current characteristics, digital multimeters (Keithley 2700) were used. The computer program for data acquisition was written in the Delphi programming language for computers with the Windows system.
To measure the sunlight, a type LI-250A light meter equipped with a type LI-200 pyranometer sensor was used.
PV module SF 150/10A-155 was chosen to conduct the research. All measurements were obtained for solar irradiation of 900 W/m
2.
Figure 5 shows the current–voltage characteristics for different configurations of the module shading.
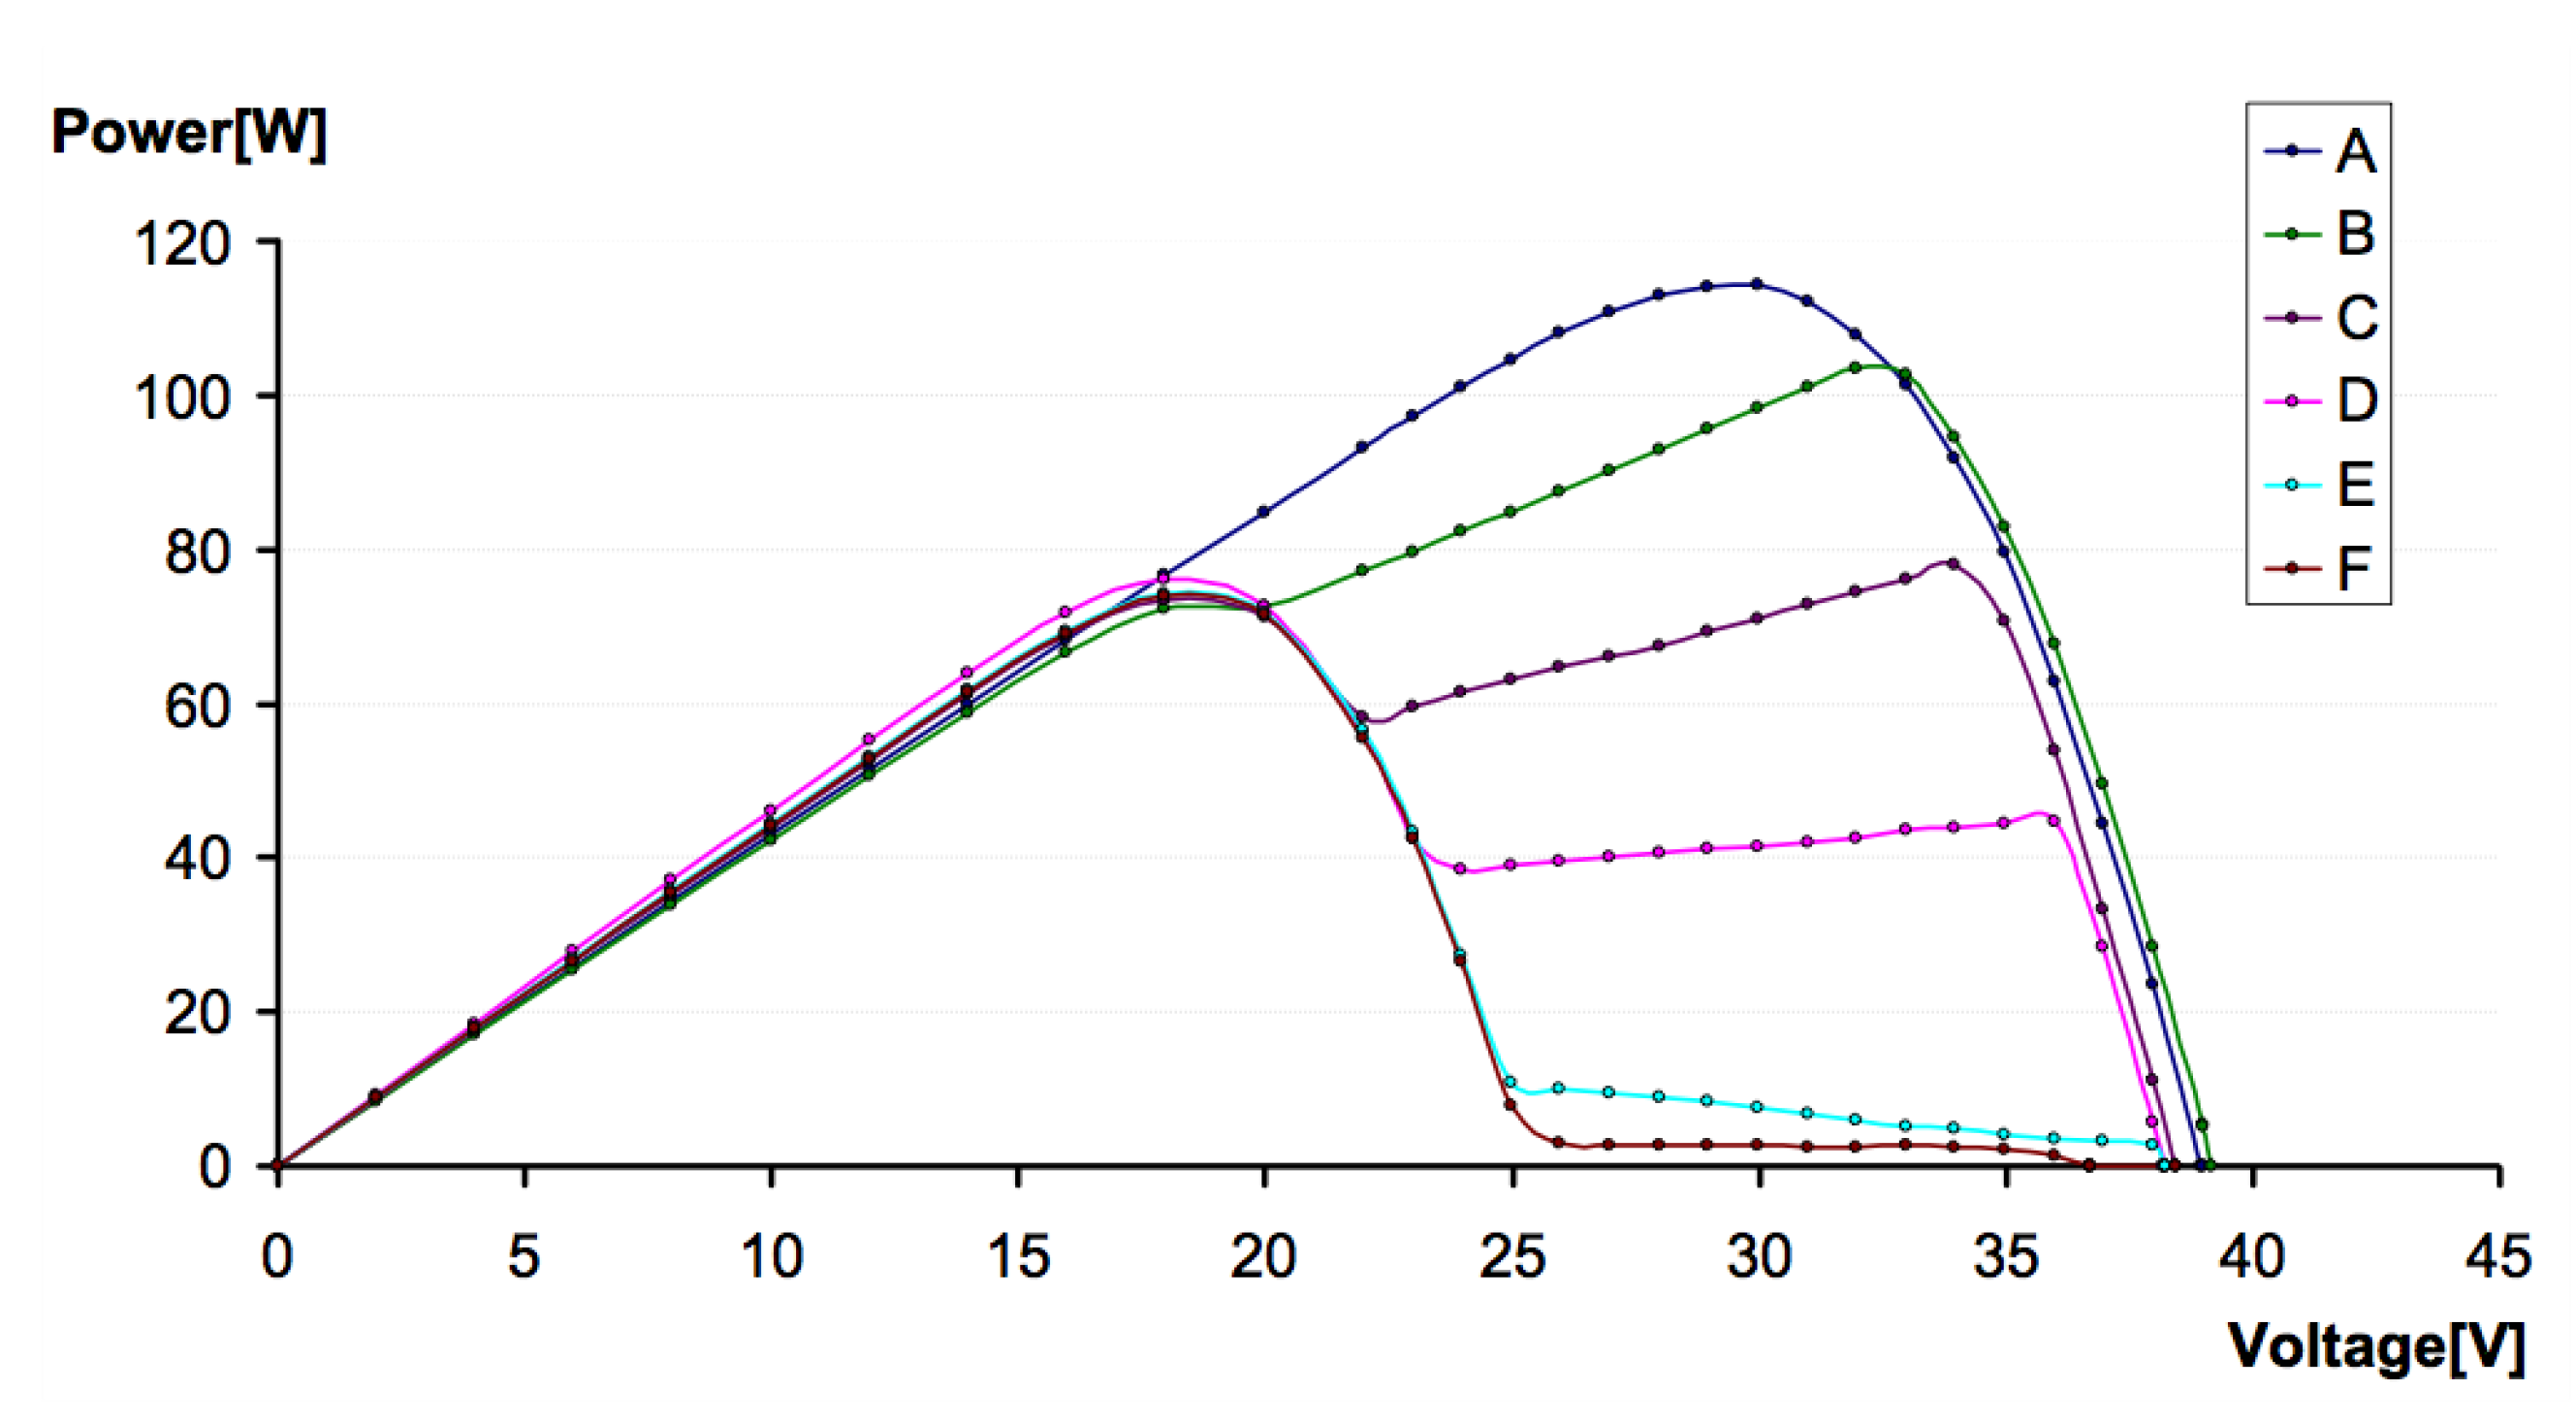
The dependency of power generated by the module as a function of voltage is shown in
Figure 6.
Analysis of the graph shown in
Figure 6 shows that in the case of obscuring the quarter of the cell, the point Maximum Power Point (MPP) is usually located in a similar way as when the module is shaded, i.e., around 0.8–0.9 V
OC, and in the case of a larger cover—around 0.5 V
OC.
7. Experimental Studies—Deviation of Module Position from Optimal
The position of the sun from the perspective of a viewer standing on Earth can be described by two angles called the solar altitude (
α) and the solar azimuth (
z). Solar altitude, α, is the angle between the direction of the incident radiation and the horizontal plane. The second,
z, is defined as the angle between a line due south and the shadow cast by a vertical rod on Earth. This convention states the angle is positive if the line is east of south, and negative if it is west of south [
29]. It will be very important in further analysis to determine the angles in cosines, as this makes it possible to plot 3D graphs, when the numerical value of the sun’s position is negative (east) or positive (west).
For the measurements under laboratory conditions, the angles were determined so the zero angle was set perpendicular to the rays coming from the sun simulator. The PV modules were installed on a rotating frame. The support allowed the angle to be changed from 0 to 90°. The inclinometer was placed at the back of the module to precisely define the angle.
The equipment used for the measurements provided displays for all relevant variables: current and voltage. Two power resistors in the measuring amplifier were used to expand the measuring range for measurements at low irradiance. Sensors on the solar module detected irradiance and temperature. The temperature was controlled such that the surface temperature of solar panels was in the range of 28–32 °C. At every measurement, the module was placed at different slope angles from 0 to 90° (every 15°), and the azimuth angle was changed at each angle of 0°, 15°, 30°, 45°, 60°, 75°, and 90°, respectively.
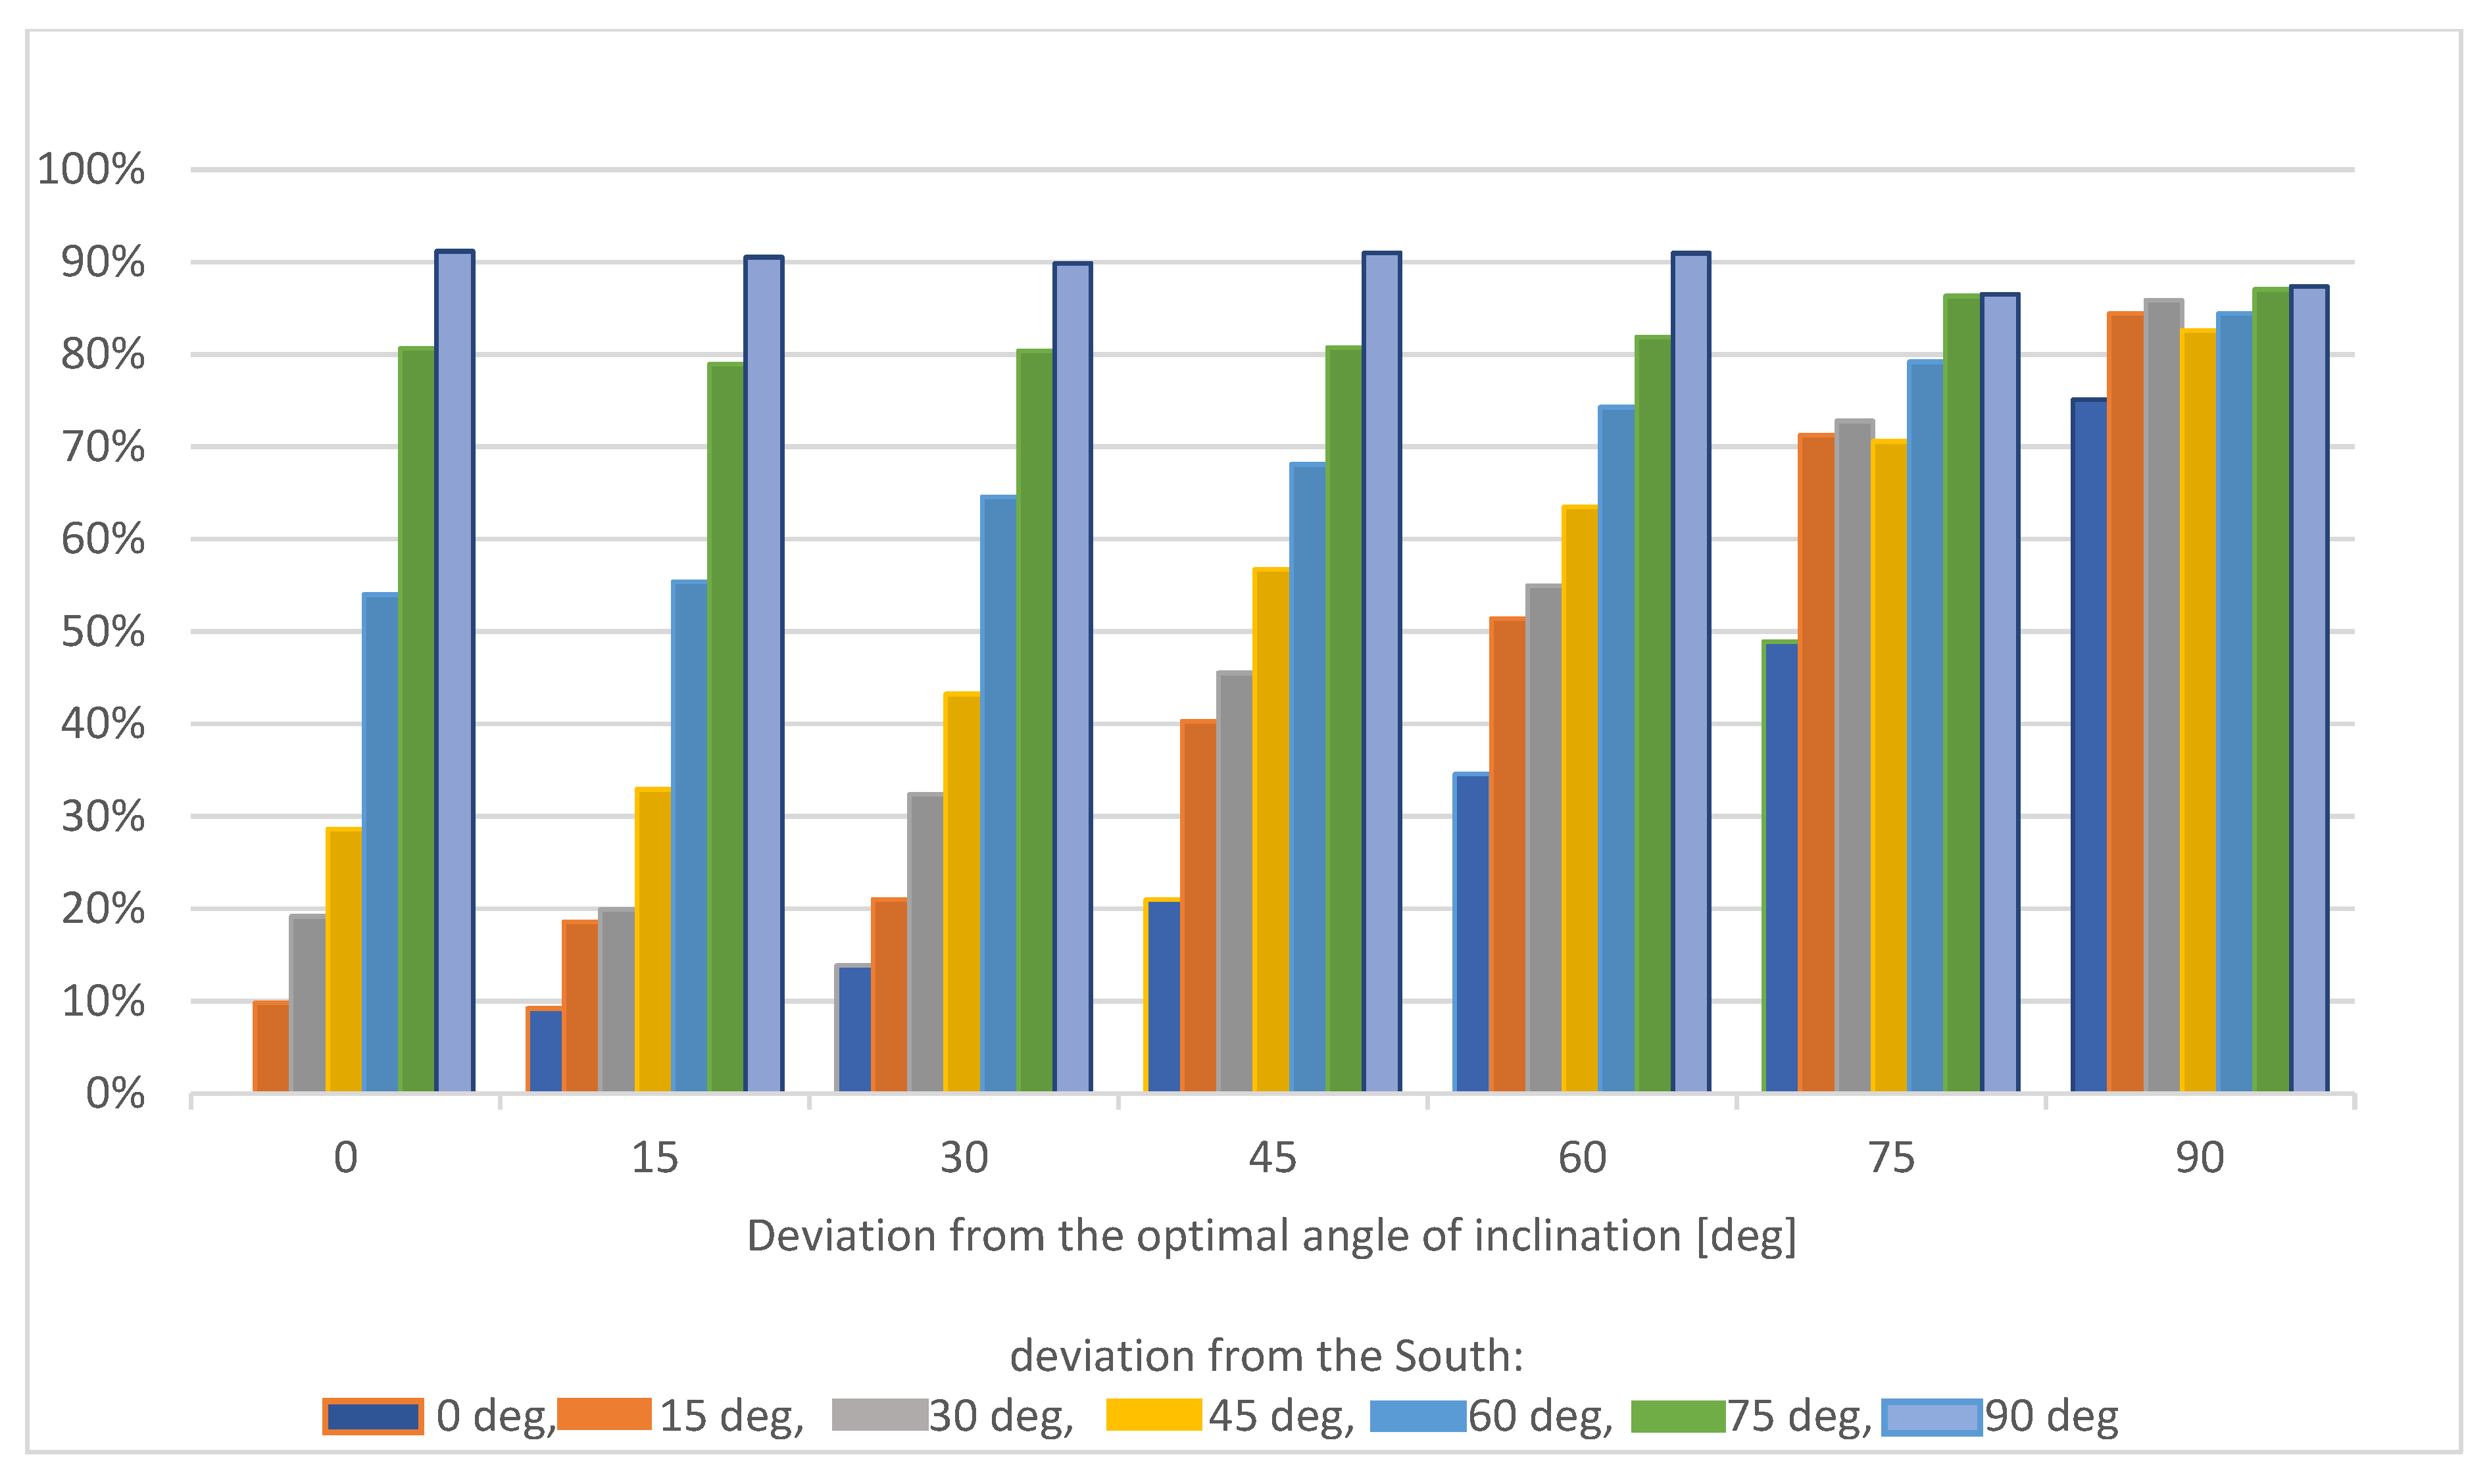
The intensity of radiation incident on the module and maximum power were determined for each configuration. Based on this data, losses related to the non-optimal location of the module were calculated in relation to the position in which the rays of solar radiation fell on the module perpendicular to its surface.
Figure 7 presents the percentage loss of energy obtained by the installation for selected deviation values in relation to the optimal location of the modules.
For an on-grid solar installation, the sum of incident on the module surface solar radiation energy during the day, month, and year is important. Daily sums of solar radiation for the user-indicated constant angle of inclination of the modules with deviation of the modules from the south were calculated by:
where:
α—angle of inclination of modules relative to the level in degrees, defined by the user;
β—angle of deviation from south direction (not more than 90°).
A gradual decrease in the intensity of the incident radiation and proportional decreases in the generated energy were observed, along with an increase in the angle of deviation from the optimal module slope and south direction.
8. Conclusions
This article presents the results of experimental research pointing to quantitative losses of energy produced by PV modules, associated with incorrect location of modules, dusty or shaded. When designing and operating solar module installations, everyone must be aware of the effects of external conditions, such as pollution or shading of the module and the non-optimal location of the modules.
This article discusses the impact of these factors on the amount of electricity produced. In any case, the user should strive to minimize losses that have an economic effect.
It is indicated what actions the user can take to improve the efficiency of the installation.
The impact of solar module shading depending on the location and climate, and thus the composition and gradation of pollutants, as well as their deposition period, were studied. Regular modules need to be cleaned regularly.
Care should also be taken to remove any shadows that can be removed, such as tree branches and bird droppings.
Already at the stage of building the installation, the user should be aware of its location in relation to the direction of incidence of sunlight, and the designer should ensure the most favorable location.
Particular attention should be paid to the last factor: during the installation, design to the location of the modules relative to the sun, because the errors made at this stage are difficult to fix.


