Article

The Effect of the NaCl Bulk Concentration on the Resistance of Ion Exchange Membranes—Measuring and Modeling

REDstack bv, Graaf Adolfstraat 35-G, 8606 BT Sneek, The Netherlands
Energies 2020, 13(8), 1946; https://doi.org/10.3390/en13081946
Submission received: 2 March 2020 / Revised: 10 April 2020 / Accepted: 12 April 2020 / Published: 15 April 2020
(This article belongs to the Special Issue Blue Energy)

Abstract

:
Ion exchange membranes are used in different fields of energy and separation technology such as electrodialysis, reverse electrodialysis, and fuel cells. Important aspects are permselectivity, resistance, and water transport. In this paper, we focus on the effect of the bulk NaCl concentration on the membrane resistance. Data from 36 publications containing 145 datasets using 6 different methods for measuring membrane resistance were compared. This study showed that the membrane resistance is dependent on the method of measuring. Two probable causes are identified: the application of reference electrodes and the presence of direct electrode–membrane contact. In addition, three physical and three phenomenological membrane models were tested by fitting these to the datasets. First, fits in the resistance domain were compared with fits in the conductivity domain. Resistance fits are sensitive to fluctuations in low concentrations, whereas fits in the conductivity domain are subject to nonlinear responses at high concentration. Resistance fits resulted in higher coefficients of determination (R2). Then, the six models were compared. The 1-thread model with two fit parameters was in almost all cases a good start. More improvements were difficult to test due to the restricted number of data points in most of the used publications, although this study shows that the so-called Gierke model (with 4 parameters) fits better than the 3-thread model. Phenomenological models were also tested, but they did not lead to much better fits.

Graphical Abstract

1. Introduction

For this paper, we searched for concentration-dependent resistance data of ion exchange membranes. We restricted our search to NaCl solutions and found 145 usable (i.e., with sufficient data at concentrations below 0.1 M) plots in 36 publications [1,2,3,4,5,6,7,8,9,10,11,12,13,14,15,16,17,18,19,20,21,22,23,24,25,26,27,28,29,30,31,32,33,34,35,36]. Some publications were not or only partially used because they list only resistance at higher concentrations (>0.1 M) [37,38], are missing detailed information about the method of resistance measurement [39,40], or describe the effect of extreme pretreatment methods [34].
Ion exchange membranes (IEM) are applied in different fields of separation technology and power generation [41,42,43]. Examples are electrodialysis, fuel cells, Donnan dialysis, capacitive mixing, and reverse electrodialysis. In most cases, low resistance, high permselectivity, and low water transport is needed. Other important aspects are mechanical strength, resistance to chemicals and high temperatures, selectivity for monovalent ions, and proton conductance. This paper is focused on one of these aspects: namely, membrane resistance. The term resistance is usually used in the field of electrodialysis and reverse electrodialysis, whereas the inverse term conductivity is more common in the energy world where ion-exchange membranes are used in fuel cells.
Ion exchange membranes are divided into different classes: (i) anion exchange membranes (AEM) are permeable to negative ions (anions) and the common fixed charge carriers are quaternary ammonium groups (approximately NR3+); cation exchange membranes (CEM) are permeable to positive ions (cations) and the fixed charges are commonly sulfonate groups (approximately SO3); (ii) homogeneous membranes (HoM) contain a polymer (in most membranes cross-linked, except in Nafion type membranes) with covalent bonded fixed charges, whereas heterogeneous membranes (HeM) are solid mixtures of an uncharged thermoplastic polymer and a charge-containing compound (an ion exchange resin); (iii) monovalent selective membranes are mainly permeable for monovalent ions in contrast to ‘normal’ IEMs, which are also permeable to ions of higher valencies; (iv) moreover, there are special membranes for proton transport, for use at extreme pH conditions, for the chloralkali process, for desalination, and so on. A special class is formed by inorganic pseudo ion exchange membranes [44].
The production of ion exchange membranes is performed via very different routes, depending on the desired properties and the available skills of the manufacturer. The principle of the ion transfer mechanism is globally understood and is mainly explained in terms of the Donnan exclusion theory. However, much is still unknown about the structure of the different membranes and the mechanism(s) governing of ion transport across them. This lack of knowledge is a barrier for the development of membranes for specific applications such as desalination, reverse electrodialysis, and so on.
In this paper, we focus on the membrane resistance. With data from the literature, we test some structural models of the involved membranes. To get more information while measuring the membrane resistance, some parameters should be varied in the same way as in spectroscopy where the structure of a compound can be elucidated from the spectrum. By analogy with spectroscopy where the frequency is varied, in membrane technology, the effect on the resistance of the following parameters are commonly studied:
  • Varying the frequency of the applied current, a method known as electrical impedance spectroscopy (EIS) provides information about the partial resistance of membrane, Stern layer, diffusion boundary layer, and bulk solution. However, no special information is retrieved about the internal membrane structure [45].
  • Varying the current gives a I-U (current density-voltage) plot showing the limiting and over-limiting current in electrodialysis [46].
  • Varying the kind of ion (e.g., measuring the resistance of a Neosepta CMX membrane in a MgCl2, CaCl2, SrCl2, and BaCl2 solution) provides knowledge about the transport mechanism and the role of ion hydration thereby [7,18].
  • Varying the membrane composition “step-by-step” gives direct information between production and resistance and some information about the transport mechanism [6].
  • Varying the temperature makes it possible to derive the activation energy from the Arrhenius plot [47,48].
  • Varying the thickness of the membrane provides information about the contribution of liquid surface layers (Stern layer and diffusion boundary layer) to the total resistance [49].
  • Varying the relative composition of the bulk solution gives insight into the particular effect of a given ion, for example different NaCl/MgCl2 solutions with the same total concentration, to study the effect of bivalent ions on the resistance [37,50].
  • Varying the concentration of the bulk solution gives insight into the internal structure of the membrane [1].
In this paper, the last method, the effect of the bulk salt concentration on the membrane resistance, is applied: in the scientific literature, most data are reported for NaCl solutions. Therefore, we have restricted ourselves to this salt. It should be emphasized that a good ion exchange membrane has a low resistance in combination with a high permselectivity and low water transport. In practice, membrane manufacturers make a trade-off between these contradictory properties.
In almost all applications, the ion exchange membrane under study separates two compartments containing solutions with different salt concentrations. For practical work, it is important to know the resistance of the membrane under these conditions. However, only a few papers indicate this aspect [1,4,51]. This item is out of the scope of this publication and will not be discussed further.
During the analysis of the datasets, we found a broad spread of data of resistance measurements of commercial membranes. The large variances can be assigned to the supplied membranes, to pretreatment conditions, and to measurement techniques. The first cause may be important because the dataset extends to a period of 50 years, but it is difficult to quantify this effect. Pretreatment is normally restricted to conditioning some hours in solutions of the concerning salt (in our case NaCl), and we expect in most cases no significant contribution of different conditioning times to the observed variance. Distinct ways of pretreatment will be discussed in the text. We focus on the different measurement techniques and try to get insight into their usefulness and reliability.
Resuming, our first goal was to find the correlation between six membrane models and the experimental data reported in the literature. These models include three theoretically based models and three phenomenological constructions. Additionally, the different used measuring techniques were compared.

2. Model Development

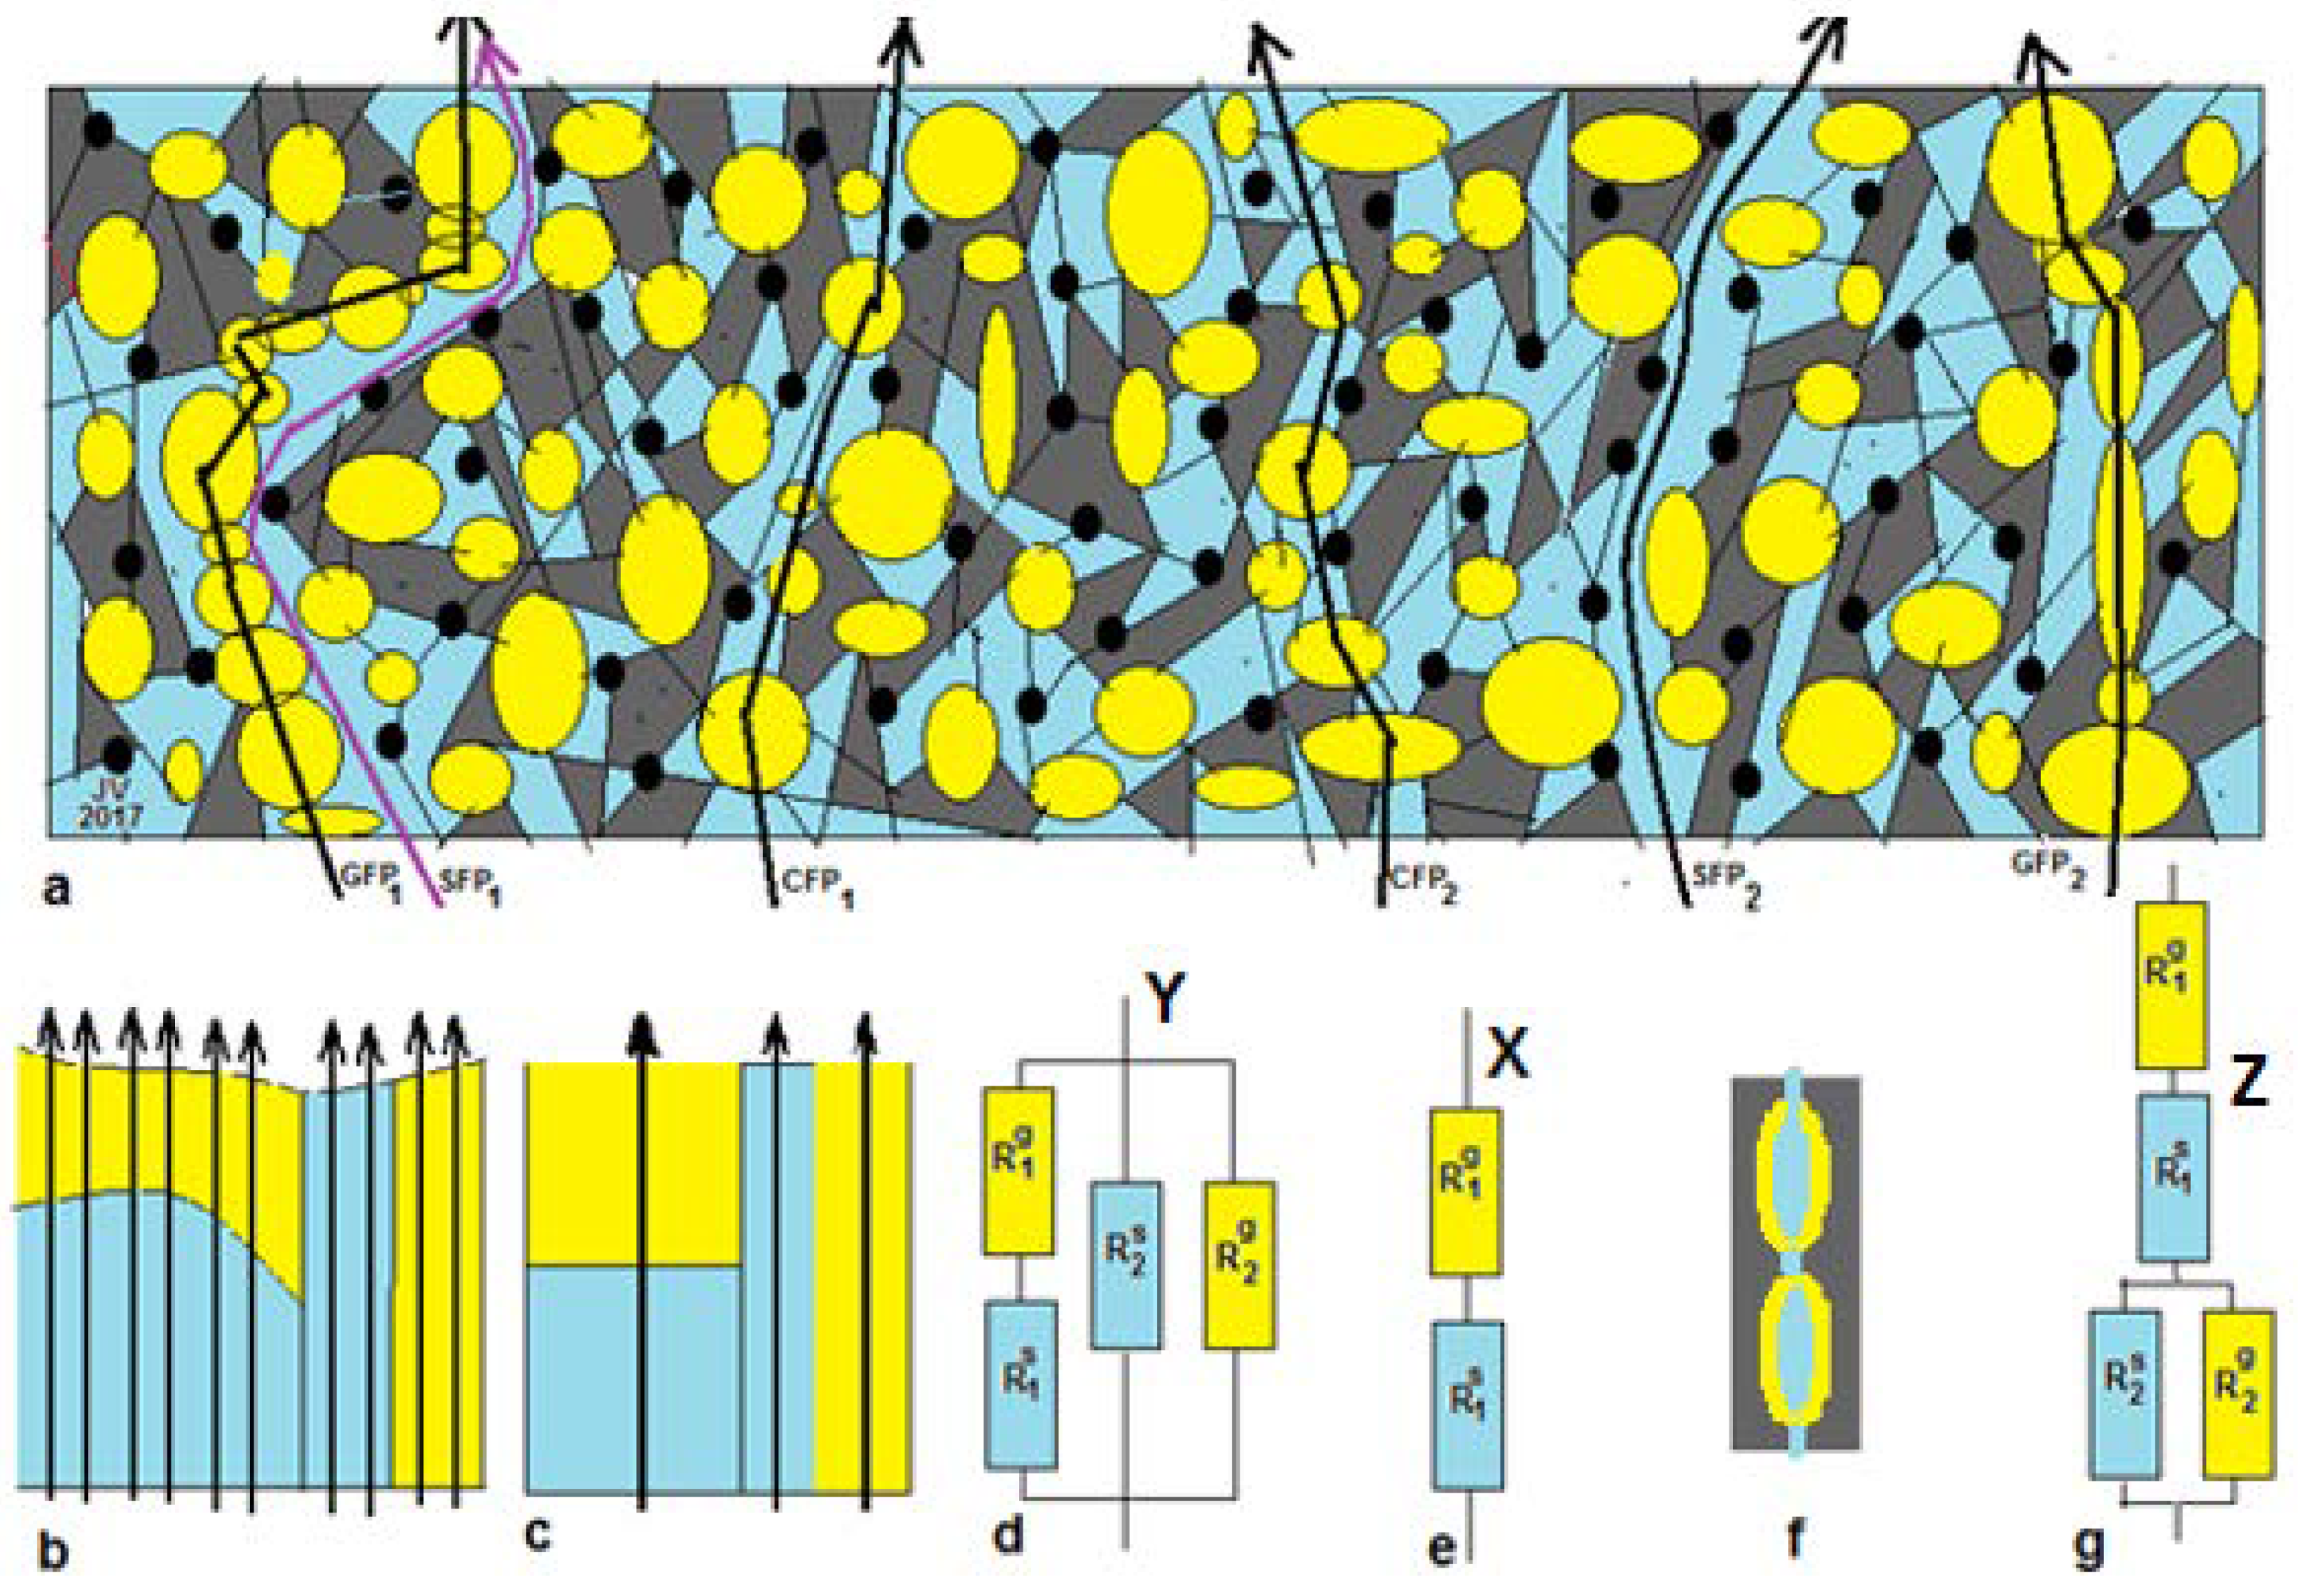
All ion exchange membranes—including the homogeneous membranes—are heterogeneous on a small scale. Figure 1a presents a summary of possible paths across both gel and solution phases as well as paths that cross solely gel or solely solution phases. By imaginary rearrangement of the different phases and omitting the non-conducting phases, we can construct Figure 1b. Thus, there are three types of flow path: CFP (combination flow paths), GFP (gel flow paths), and SFP (solution flow paths).

2.1. Equivalent Circuit Models

The general expression for the total resistance of the model of Figure 1b can be written according to the “resistances-in-series” approach as:
1 R = i 1 R i C F P + j 1 R j G F P + k 1 R k S F P   .
All resistances R are expressed in Ω∙cm2 and are formally called area resistances. From this expression, three physical models are derived:
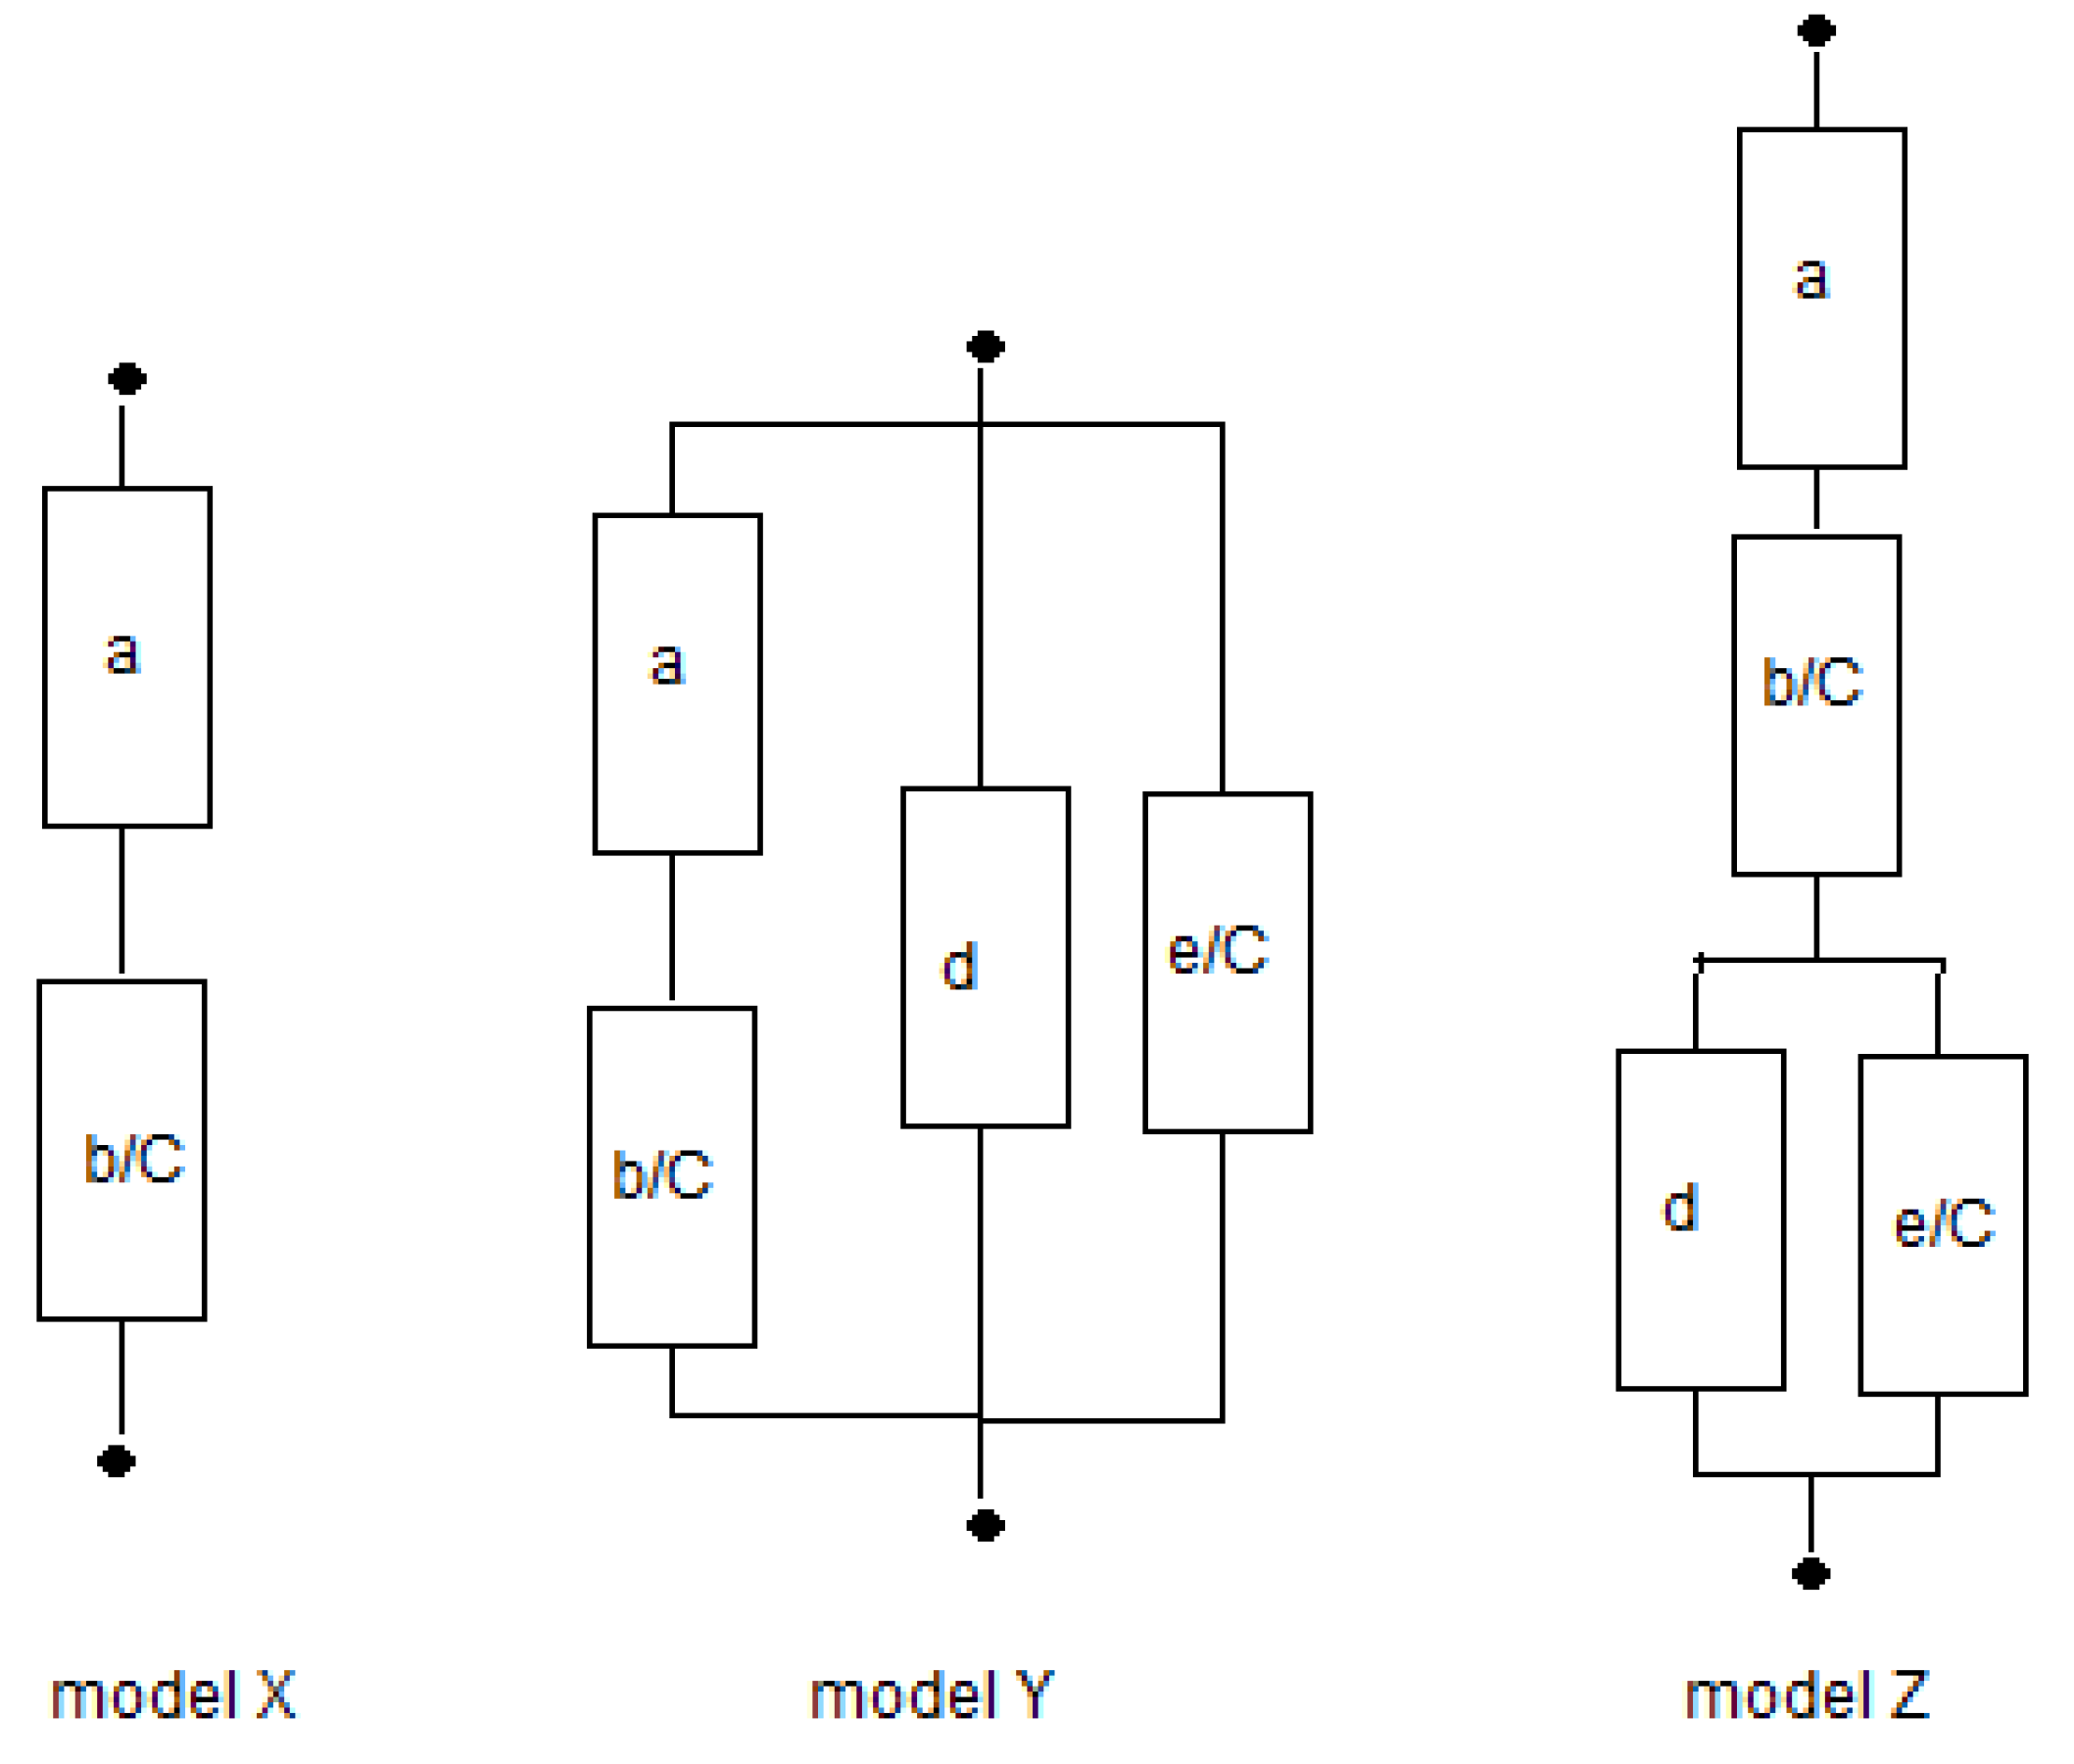
  • Three-thread model Y. In this paper, we use data from the literature and unfortunately, most authors have shown only about 5 data points for each concentration-dependent resistance plot. Therefore, we have to simplify the model in the following manner: If the dimensions of the different phases are small with respect to the thickness of the membrane, then all CFP trajectories contain about the same amount gel phase and solution phase with a small standard deviation. The same holds for the GFP and the SFP. This system can be represented by Figure 1c, and the concept is introduced by Gnusin et al. [52] and later on elaborated by Zabolotsky and Nikonenko [40]. This model is called the 3-thread model, and the equivalent circuit Y is shown in Figure 1d. The 3-thread model includes 4 fitting parameters, and that is almost over the limit of feasibility if there are only 5 measurements. An additional complication may be the possible presence of pinholes in the studied membrane: their effect appears as SFPs.
  • One-thread model X.Figure 1a shows that the presence of single flow channels (solely gel or solution phase) is doubtful, and we can simplify the 3-thread model to a 1-thread model Y as depicted in Figure 1e. Galama et al. showed this model to be successful in their work on the Neosepta CMX membrane [1].
  • Gierke model Z. Gierke et al. [53] concluded that a Nafion CEM contains vesicles with the negatively charged sulfonate groups pointing from the wall to the water clusters. Together with water and positively charged counter-ions, in this way, a gel layer is formed, whereas a solution phase is present within the vesicles. These vesicles are interconnected by small channels, partially as gel and partially as solution phase (Figure 1f). The corresponding equivalent circuit Z is shown in Figure 1g.
In addition to the physical models, we will also consider three phenomenological models E, P, and M. The assumption for the X, Y, and Z models was that inhomogeneities in the membrane structure are averaged. This is only true if they are small with respect to the membrane thickness. However, they are rather large in heterogeneous membranes and are much larger in reinforced membranes with nonwoven structures and very large in membranes containing woven structures. Such circumstances cause different parallel flow channels, and averaging the concentration-dependent resistance results in big standard deviations. Therefore, we introduce the models E, P, and M.
  • The exponential model E is defined as:
    R = p + q   ·   e r · C
    where R stands for the area resistance (Ω∙cm2) and C stands for the bulk concentration (mol/L), whereas p, q, and r are fitting parameters.
  • The power model P is:
    R = p + q   ·   C r .
The power model p is proposed by Zhu et al. [23] to explain the concentration-dependent resistance of ion exchange membranes inserted in different salt solutions (the chlorides of Na, K, Ca, Mg, and Al as well as HCl).
  • The mixed model M is
    R = p + q   ·   C + r / C .
The mixed model is added to incorporate the effect of decreasing conductivity at high bulk concentrations due to membrane shrinking.
From all these models, the one-thread model X is the most simple with only two parameters. It will be shown that this model can be used with rather good values of R2 in most experiments to describe the membrane resistance. Moreover, due to the restricted number of data points in many published experiments, it is in most cases the only possible fit model. The value of the term a stands for the contribution of the gel and that of b stands for the solution part in the membrane. The values of a and b are derived from plots of Rarea (in Ω∙cm2) versus concentration (in mol/L) and are membrane properties with units Ω∙cm2 for a and Ω∙cm2.mol/L for b. For a thickness independent comparison between the different membranes, we will use the parameters a/δ and b/δ, where δ stands for the membrane thickness; these values are related to the specific resistance and are material properties.

2.2. Resistance of the Gel and Solution Phases

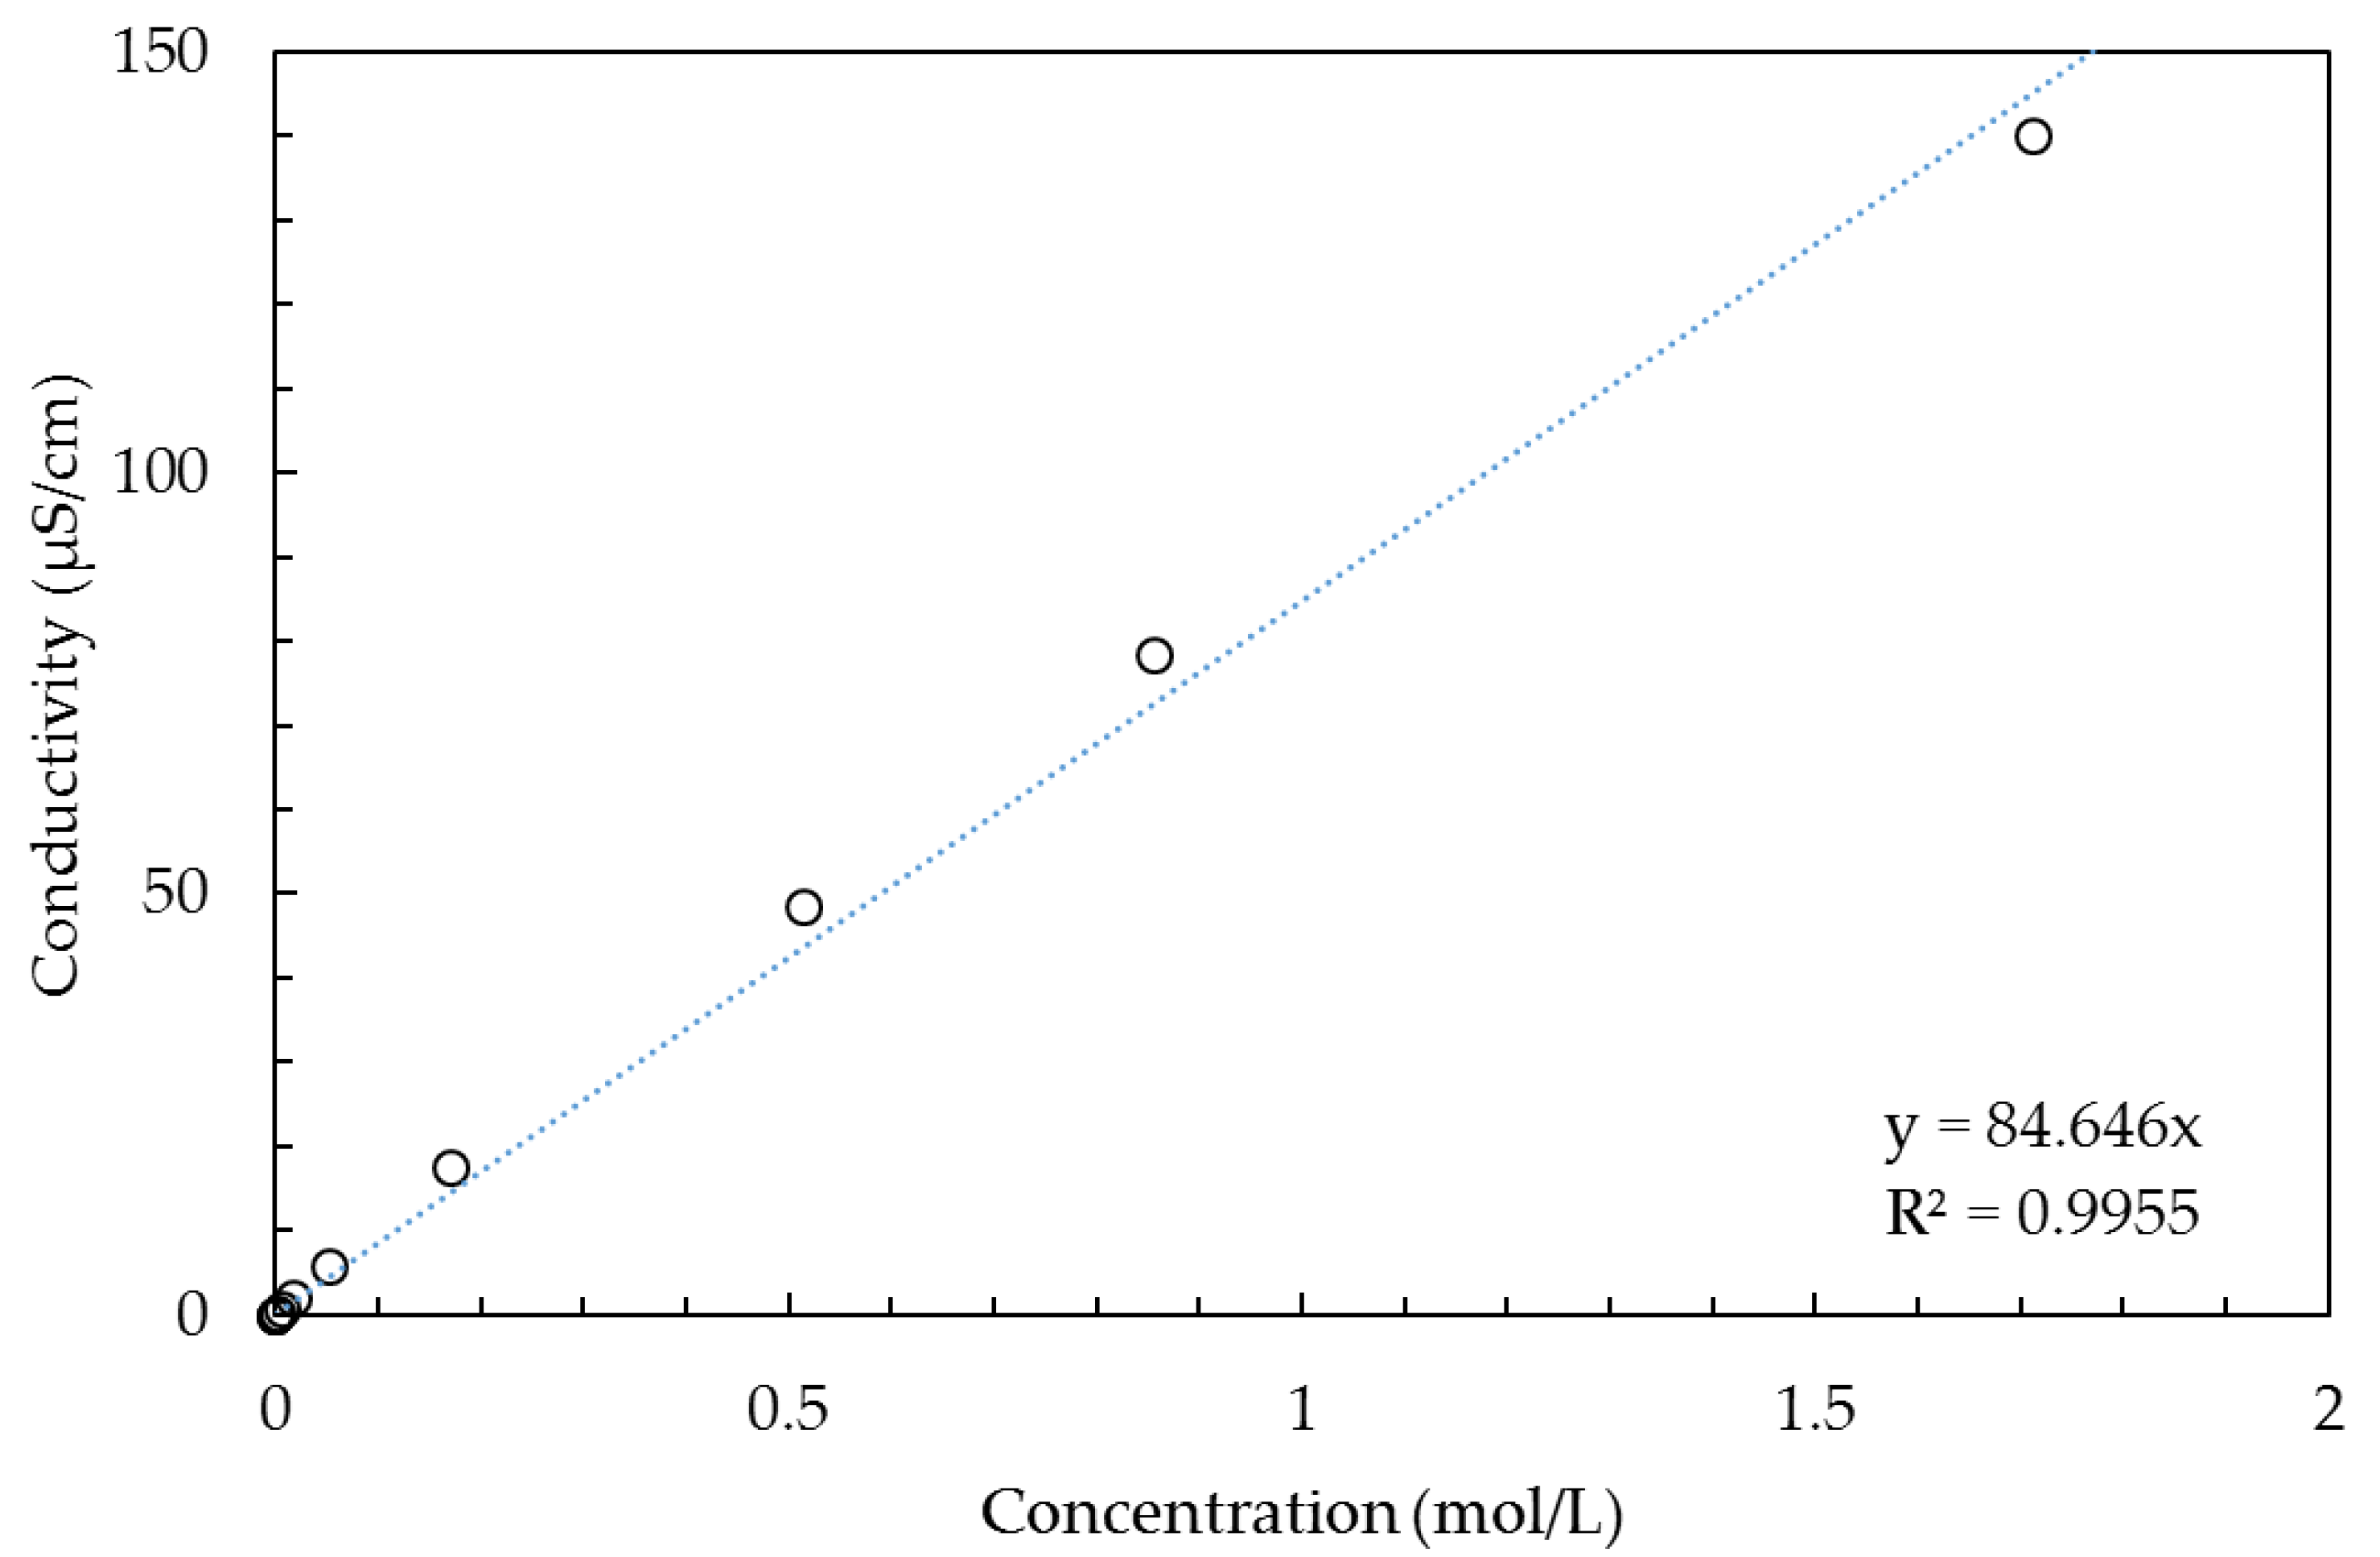
Solution phase. The resistance of the solution phase is strongly dependent on the salt concentration, and we assume there the same dependence as within the bulk solution outside the membrane. With the use of data from [54], we constructed Figure 2 and fitted the simple one parameter function Κ = a∙C for concentrations below 2 mol/L (Κ is the conductivity in µS/cm and C the concentration in mol/L). The regression resulted in a = 84.646 with a rather good coefficient of determination (R2 = 0.9955). If the concentration range is restricted to a lower maximum, the coefficient of determination is better as depicted in Table 1.
Although models with more fit parameters (e.g., parabolic equations with 3 parameters) result in better R2 values, it is important to restrict the number of fit parameters as much as possible. The number of data points in a single experiment in the scientific literature is often restricted to only 5 or less, and we use also fit parameters for the gel phase in the different models. Therefore, we will apply the simple function K = a∙C for the solution phase with only one fit parameter.
Gel phase. The conductivity of the gel phase is mainly ascribed to the presence of the counter-ions. The concentrations of counter-ions (p) and co-ions (q) are determined by the Donnan equations [42]:
p = f + f 2 + 4 C 2 2
q = f + f 2 + 4 C 2
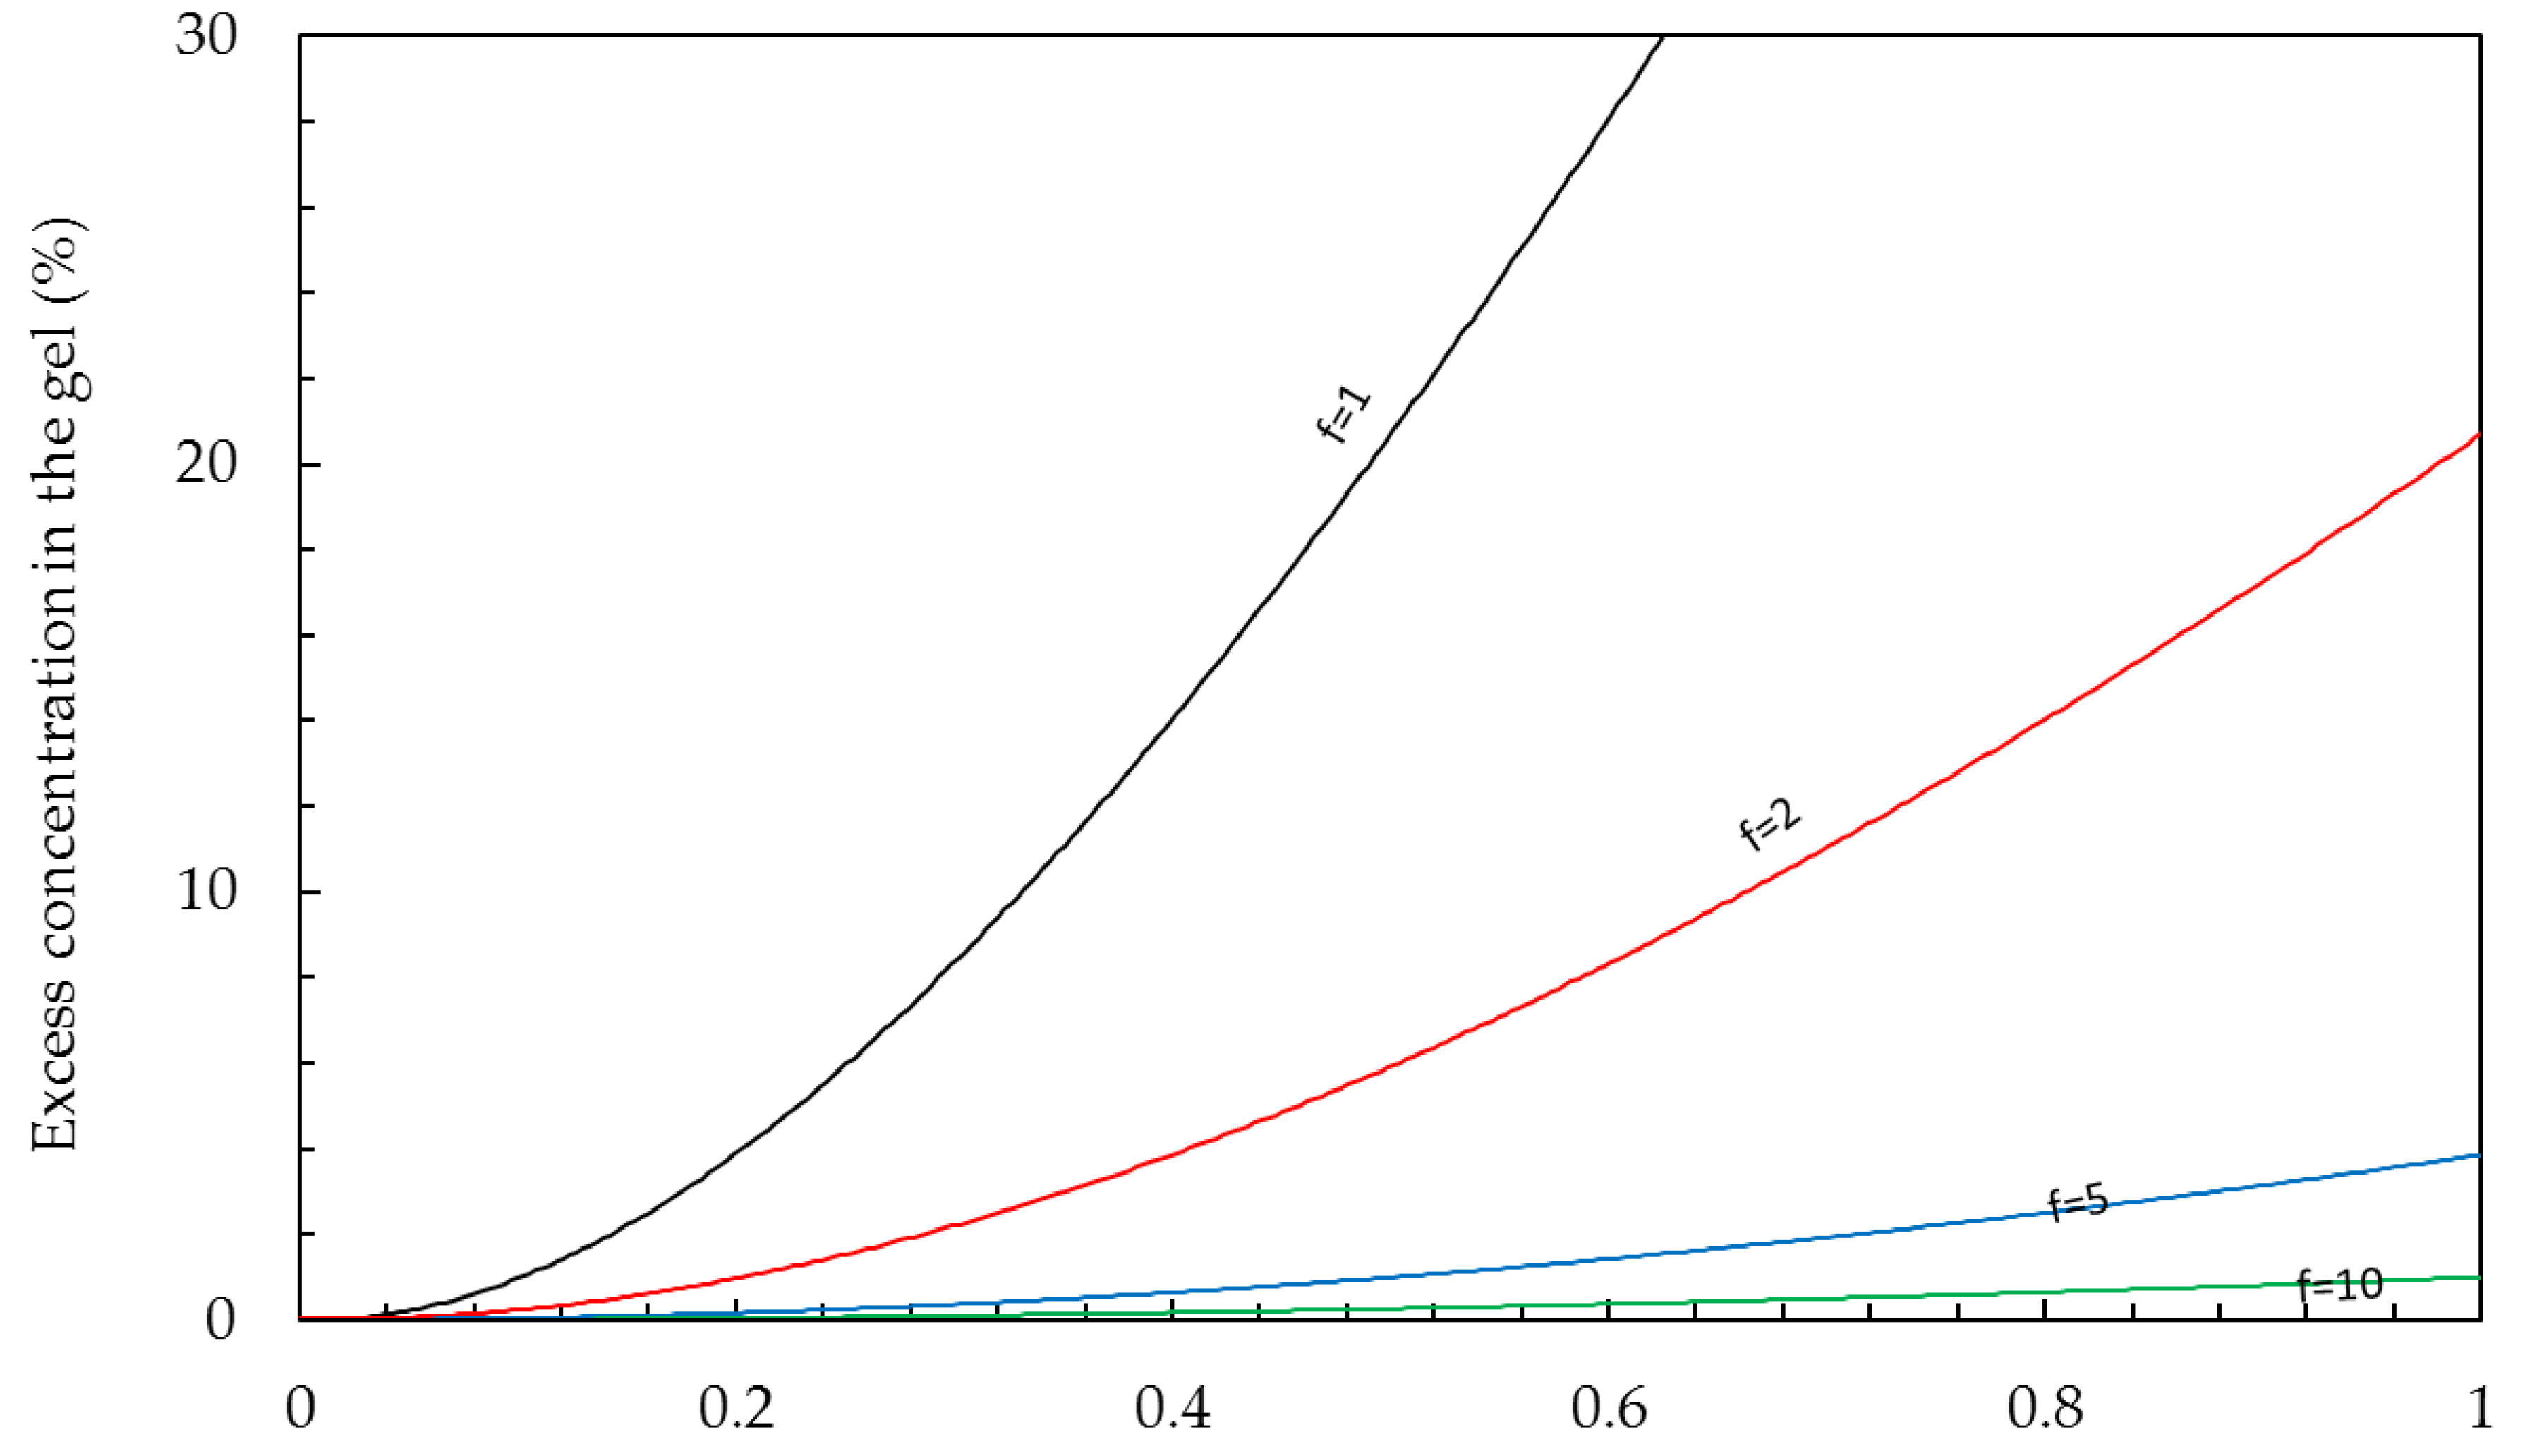
where C is the bulk concentration (mol/L) and f is the concentration of fixed charges in the membrane gel phase (‘charge density’). The charge density of most ion exchange membranes is in the range 5–10 mol/L. If an IEM is in equilibrium with pure water, there are no co-ions present. In this case, the concentration of the counter-ions is equal to the charge density, and these ions are called condensed counter ions. In an IEM, immersed in a NaCl solution, there is a small concentration of co-ions and also the same excess of counter-ions. These ‘free ions’ are known as the ‘free salt’ and the concentration is the value q in Equation (6). Figure 3 shows this excess in percentage for different membranes in contact with NaCl solutions of up to 1 mol/L.
Membrane conduction is facilitated by the transport of (i) condensed counter-ions, (ii) excess counter-ions, and (iii) co-ions. Kamcev et al. suggest that the diffusion constant of condensed ions is about 2–2.5 times greater than those of the excess co-ions [55]. This is explained by a facilitated transport of condensed ions via the charged backbone of the gel polymer. It is reasonable to assume that this factor holds also for ionic mobilities. Mobilities of Na+ and Cl in free solution at 25 °C are respectively 5.19 and 7.91 (in units of∙10−8 m2s−1V−1). If we assume that these are also the mobilities of the free ions in the gel phase, it follows (applying the factor of 2.5) that the mobility of condensed Na+ ions in a CEM is about 13 in the same units, which is almost equal to the sum of the two free ion mobilities. The consequence is that an excess of 1% results in an increase of the conductivity of 1%. In the case of an AEM, we expect a mobility of condensed Cl of 20 units, which is 1½ times the sum of the free ions. Thus, an excess of 1% in an AEM results in an increase of the conductivity of less than 1%.
It is worth mentioning that the discussed increase of co-ions in the gel phase at higher bulk electrolyte concentrations is the cause of reduced membrane permselectivity at these concentrations. Thus, plots describing the effect of bulk concentration on permselectivity can give more insight into the degree of excess. Unfortunately, there are very few papers that pay attention to this phenomenon.
Most commercial membranes have charge densities higher than 5 eq/L [56], and most maximal bulk NaCl concentrations in the datasets are 0.5 mol/L. With these values, Equation (6) predicts an excess of 0.99% and therefore also a comparable increase of membrane conductivity. Therefore, we can conclude that the conductivity (and the resistance) is almost independent of the bulk concentration for commercial membranes at bulk concentrations beneath 0.5 mol/L NaCl.
Another complication in theoretical considerations about the effect of concentration on membrane resistance is swelling at low concentrations and shrinking of the membrane at high salt concentrations. The degree of volume change is influenced by the cross-linking density. This effect of swelling on the membrane area resistance is minimal for CMX membranes [23] but may be considerable for non-cross-linked membranes.

2.3. Fitting the Models

In the foregoing analysis, we have restricted the number of fit parameters for both the solution phase and the gel phase to only one. We will consider the three physical models X, Y, and Z as shown in Figure 4 and also the three phenomenological models E, P, and M. The equations of the 6 studied models are summarized in Table 2. Fits can be performed in the resistance or in the conductivity domain, as will be discussed further on.
The purpose of this study is to test the aforementioned models with data from published scientific literature and to get more knowledge about the internal structure of ion exchange membranes. Moreover, we want to compare data found with different measurement techniques. A complication is that the membrane resistance is dependent on the membrane material and its thickness, as well as the used salt and its concentration and temperature. Most published concentration-dependent resistance measurements were done with NaCl at 25 °C (sometimes 20 °C) with concentrations between 0.01 and 0.5 mol/L. A few experiments were done with other salts, such as NH4Cl and KCl, and we decided to focus on NaCl. Usually, measurements were done in 5 steps, and this restricted number of data points complicates a thorough statistical analysis.
Finally, we will give some short notes on the meaning of the membrane resistance for the application of these membranes: (i) In practice, all membranes work under direct current circumstances, and therefore it can be argued that direct current (DC) measurements are more realistic. (ii) Secondly, in all applications, the concentration at both membrane sides is different. Galama et al. [1] and Geise et al. [4] have shown that in this case, the lower concentration has the largest influence on the membrane resistance. In membrane specifications, normally the area resistance is listed for 0.5 mol/L NaCl solutions. However, in many applications, the lowest concentration is much lower than 0.5 mol/L and therefore an indication of the resistance at 0.1 mol/L or lower in membrane specifications would be very valuable. (iii) In practice, almost all membrane operations (except for Donnan dialysis) are performed with an electrical direct current (DC). Ion movement, osmosis, and electro-osmosis can influence the membrane behavior. (iv) Other ions—especially bivalent ions—have a large influence on the membrane resistance.
Comparisons between AC and DC methods for measuring membrane resistance and general comparisons between different measurement techniques are discussed by Galama et al. [1,20], Karpenko et al. [22], Kamcev et al. [21], Nouri et al. [15], and Zabolotsky et al. [40].

3. Measurement of the Resistance

We found in the scientific literature 145 graphs of the resistance or conductivity as a function of the NaCl concentration. We digitalized these graphs and tabled the data. The following used measuring cells and other variables can be considered.

3.1. Used Measuring Cells

Table 3 summarizes the used measuring cells. In fact, there are two ways of contact: (i) direct contact with the electrode (carbon, mercury, platinum, or other metals) or (ii) immersed in a salt solution. If direct contact is used, no blank measurement is needed in contrast to the methods with water contact. To prevent air inclusions between the membrane and the electrodes, sometimes special mercury contact cells are used where air is removed with vacuum [35]; however, with these cells, no NaCl-dependent data have been published, so they do not appear in the table.
The systems A, B, and C are equipped with four electrodes, of which two are used to apply the electrical current and the other two are used to measure the voltage over the cell. Commercial Ag/AgCl reference electrodes are robust and fast. If combined with a Luggin–Haber capillary, the voltage near the membrane can be measured in such a way that they cause very little disturbance of the electrical current. These electrodes can be applied for AC as well as DC measurements. An alternative—only usable for AC measurements—is the use of platinum reference electrodes. An extensive study of the effect of reference electrodes is performed by Galama et al. [20]. Since the potential of a Pt-electrode is dependent on the oxidation–reduction potential of the solution, it is important that on both sides of the membrane, the same solution is circulated [57]. The same holds for bare Ag/AgCl electrodes, the potential of which is dependent on the Cl concentration.

3.2. Other Variables

  • Perpendicular or tangential measurement. All authors of these datasets performed their measurements perpendicular to the membrane, in the same way as the electrical current is applied or generated in the different membrane processes. Conductivity measurements can also be performed in the tangential direction [58,59,60] with the advantage that surface effects (Stern layer and diffusion boundary layer) are marginal with respect to the total membrane resistance. Moreover, the higher resistance enables more accurate measurements. Dedmond and Cooper [61] demonstrated this technique to be useful with the membranes Nafion-117 and Nafion-212 in H2SO4 solutions, while Sedkaoui et al. determined the membrane resistance of CMX, AMX, MK-40, and MA-41 in KCl solutions [60]. However, these authors did not use NaCl solutions, and therefore, we cannot use their data in this paper.
  • Area resistance or specific resistance. Most data are published as area resistance Rarea (Ω∙cm2), and this value is used in this paper. Rarea is a real membrane property. Dividing Rarea through the membrane thickness results in the specific resistance Rspec (Ω∙cm), which is a material property. Values published as Rspec (or as the inverse, the specific conductivity Kspec in S/cm) are converted into Rarea using the listed membrane thickness. If thickness was not published, we used the thickness from other publications. It is true that the conversion of Rspec to Rarea introduces some uncertainty, but nevertheless, membrane thickness has no influence on the coefficients of determination (R2) of the regression process.
  • Pretreatment of the membranes. In most cases, membranes are equilibrated some hours in the bulk solution before measurement. One exception is the experiments by Kamcev et al., where membranes were dipped briefly in a 5 M NaCl solution to improve the contact (and expel an adjacent water layer) between the metal electrodes and the membrane [21]. Another example of different conditioning techniques is reported by Berezina et al. [34]. These authors studied the effect of extreme methods such as salt exposure, boiling, and thermal treatment on the ion conductivity of some perfluorinated CEMs. Especially the thermal method results in membranes with an almost concentration-independent conductivity. However, we did not add these experiments to our dataset.
  • Applied current. The following methods are used:
    -
    Direct current. With direct current (DC), the resistance of the membrane including the stagnant liquid boundary layers and the Stern layer is measured. At first glance, it seems that this method is valuable because at real applications, the additional layers are also present. However, this is not a robust method, because the concentration polarization is dependent on the applied current density and the thickness of the stagnant boundary layer is affected by the flow velocity of the circulating salt solution. Galama et al. [1] compared AC and DC measurements with the same cell at the same membrane.
    -
    Alternating current. With alternating current (AC), the intrinsic membrane resistance can be determined. If electrochemical impedance spectroscopy is used, the optimal frequency can be derived from the Nyquist plot, i.e., the real part where the imaginary part is zero. Lindheimer et al. [62] showed that for a clip-cell in 1 M NaCl with an interelectrode distance of 6 mm, the optimal frequency is 3 kHz, while also values between 1 and 100 kHz give a good approximation. Otherwise, frequencies over 1000 kHz lead to an overestimation of the resistance of about 20%.
    -
    AC/DC combinations. With alternating current superimposed on a direct current, the pure membrane resistance can be found at real operating conditions presumed that the fluid velocity and current density are the same in the both cases. Kamcev et al. used this combination [21]. However, they used different ratios DC/AC throughout their measurements. In our analysis, we classified these results as ‘DC’.
  • Temperature. Most experiments were performed at 25 °C, and a smaller number were performed at 20 °C. Other authors reported ‘room temperature’, and in some cases, no temperature was reported at all. The resistance of NaCl solutions at 20 °C is about 10% higher than at 25 °C, and this effect may alter all fit parameters in the model. Temperature correction is possible for the solution phase and it is probably possible for the gel phase if an equal temperature dependence is assumed. However, not all temperatures were known. It was found that the variation in the calculated fit parameters is much larger than 10%, and therefore, no attempts were performed for temperature correction.
  • Flow rate in the cell. Długołęcki et al. found a huge effect of the cell flow rate on measured resistances [45]. However, they used the DC method where the boundary diffusion layers are also included in the measured resistance. It is evident that the flow rate of the bulk solution affects the thickness of these boundary layers and therefore also the resistance. We expect minor effects using AC.

4. Results and Discussion

Our dataset contains 145 datasets of 60 different membranes from 36 publications and are listed in Table 4. Not included are experiments with special pretreatments such as boiling and heating as performed by Berezina et al. [34]. The most abundant membranes are CMX for the class of homogeneous CEMs (16x), AMX for the homogeneous AEMs (13x), MK-40 for the heterogeneous CEMs (10x), and MA-41 for the heterogeneous AEMs (6x). Perfluorinated CEMs can be considered as a special class because the common commercial membranes are not cross-linked; Nafion-117 is the most abundant (10x) representative in our dataset.

4.1. Dependence of the Resistance on the Bulk Concentration

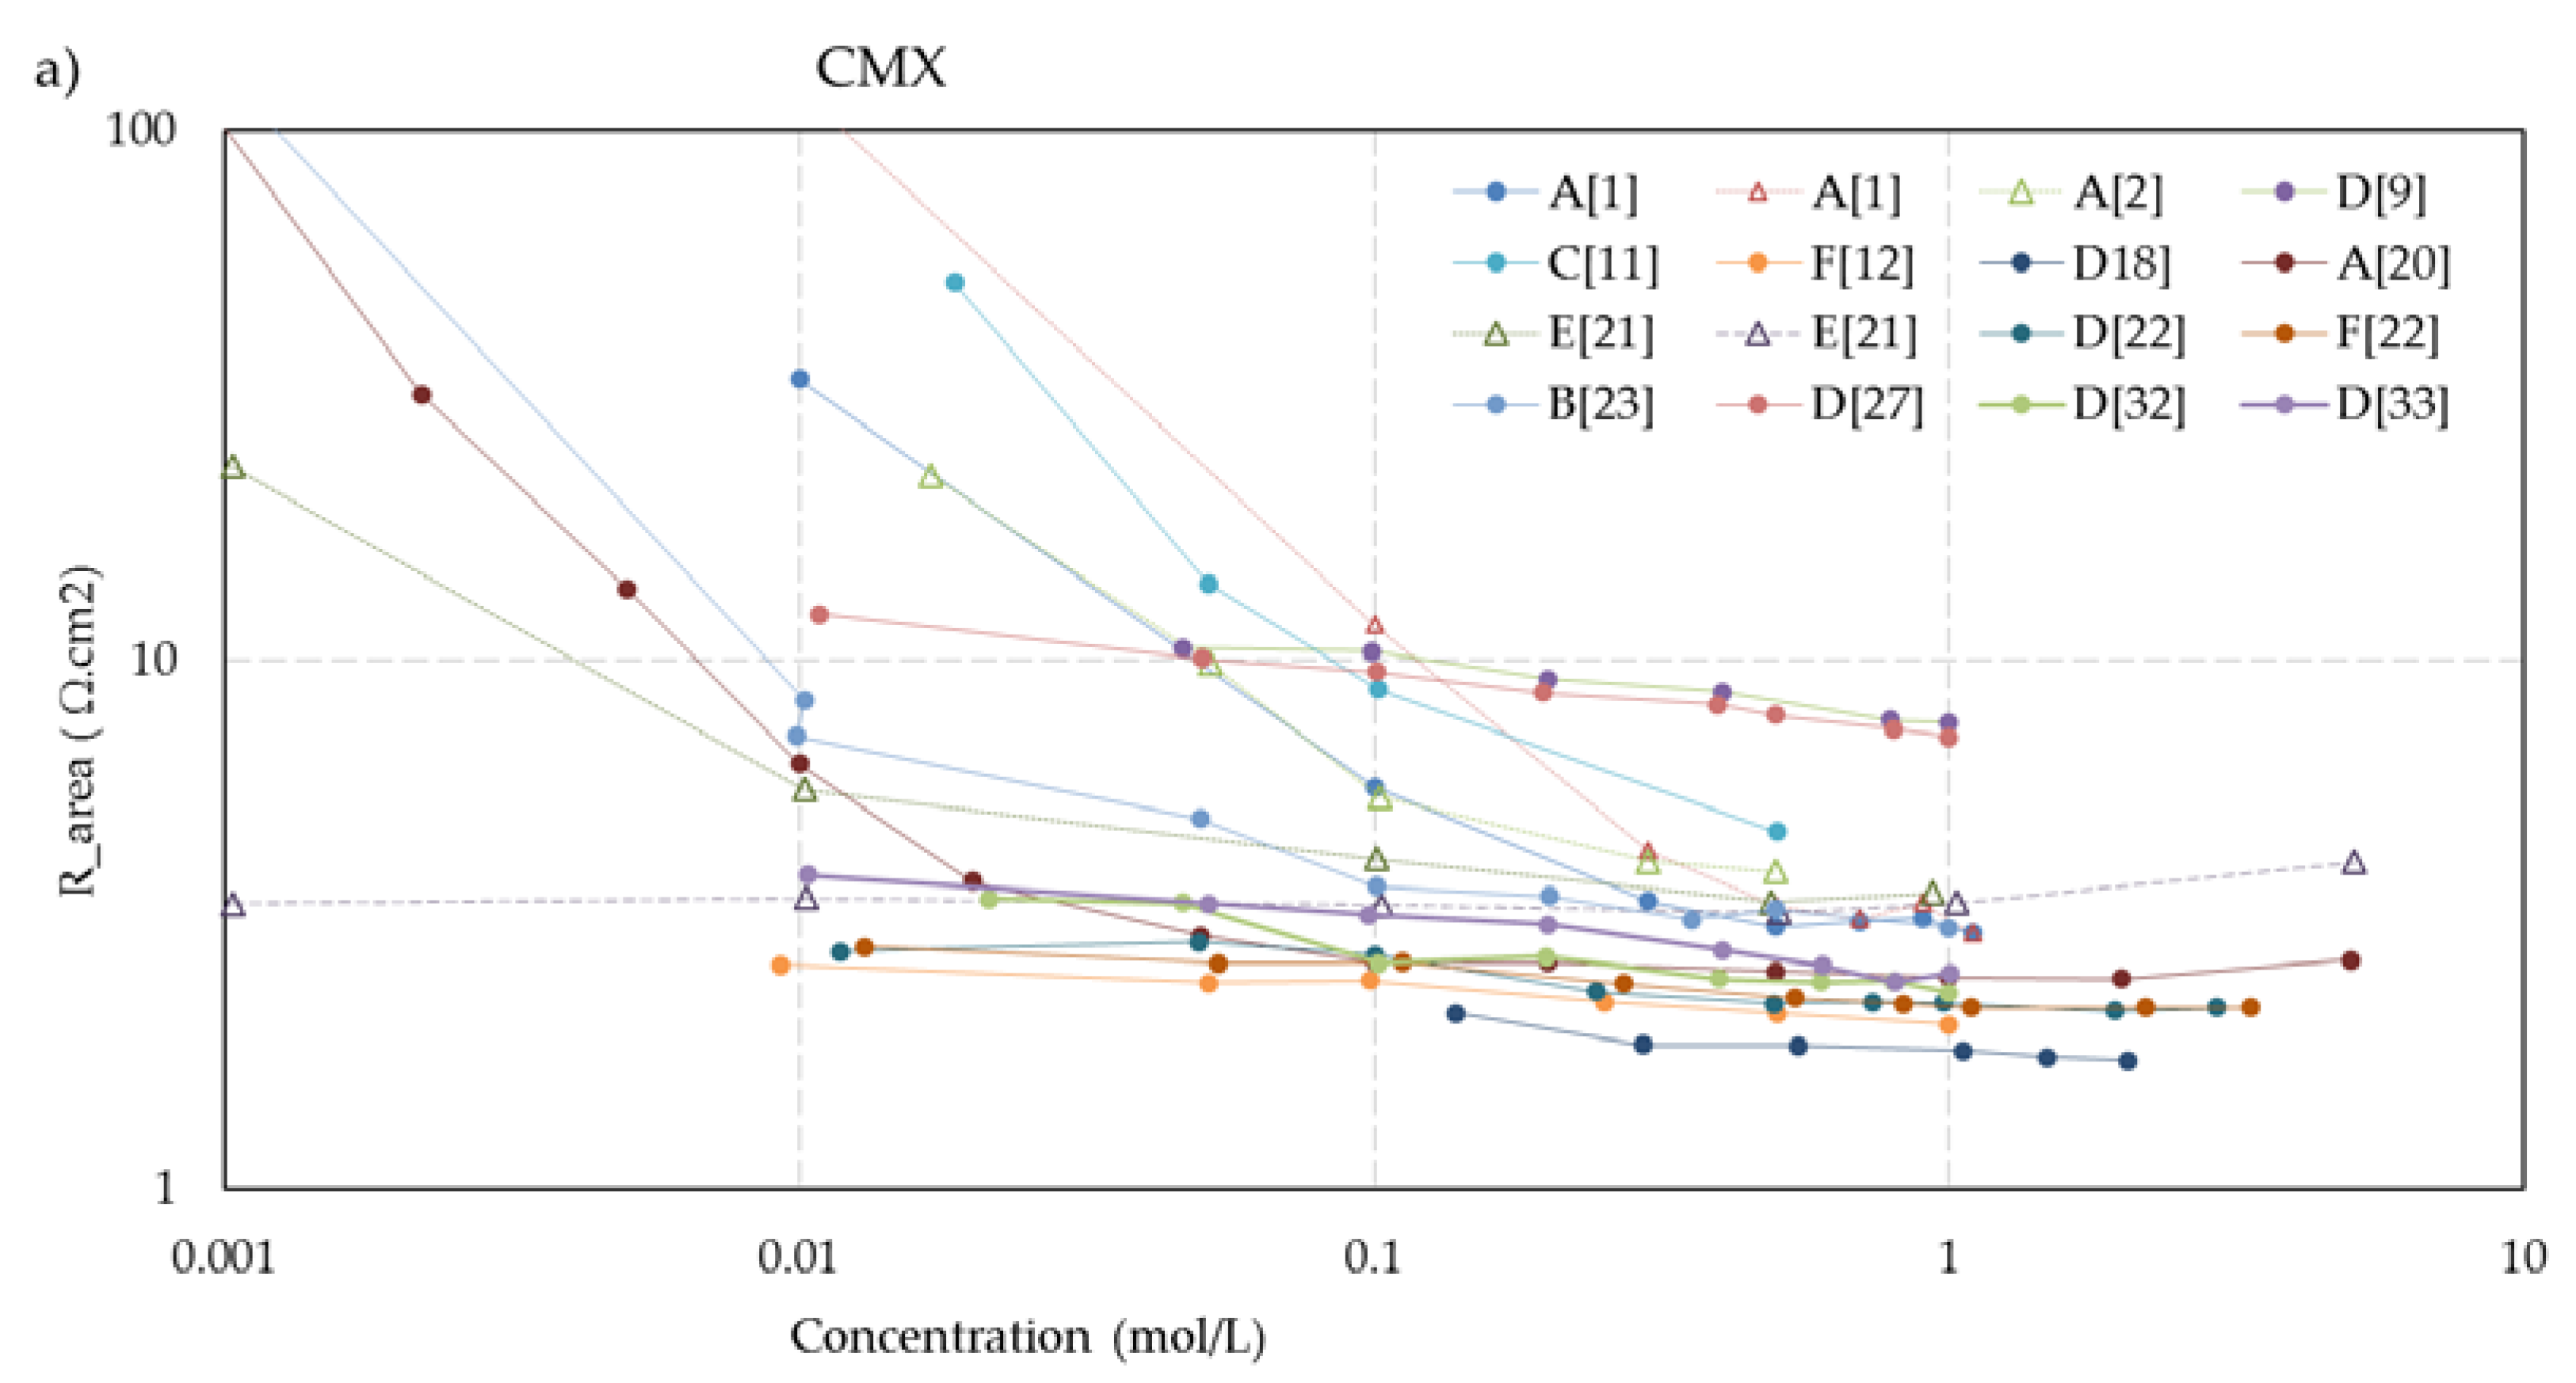
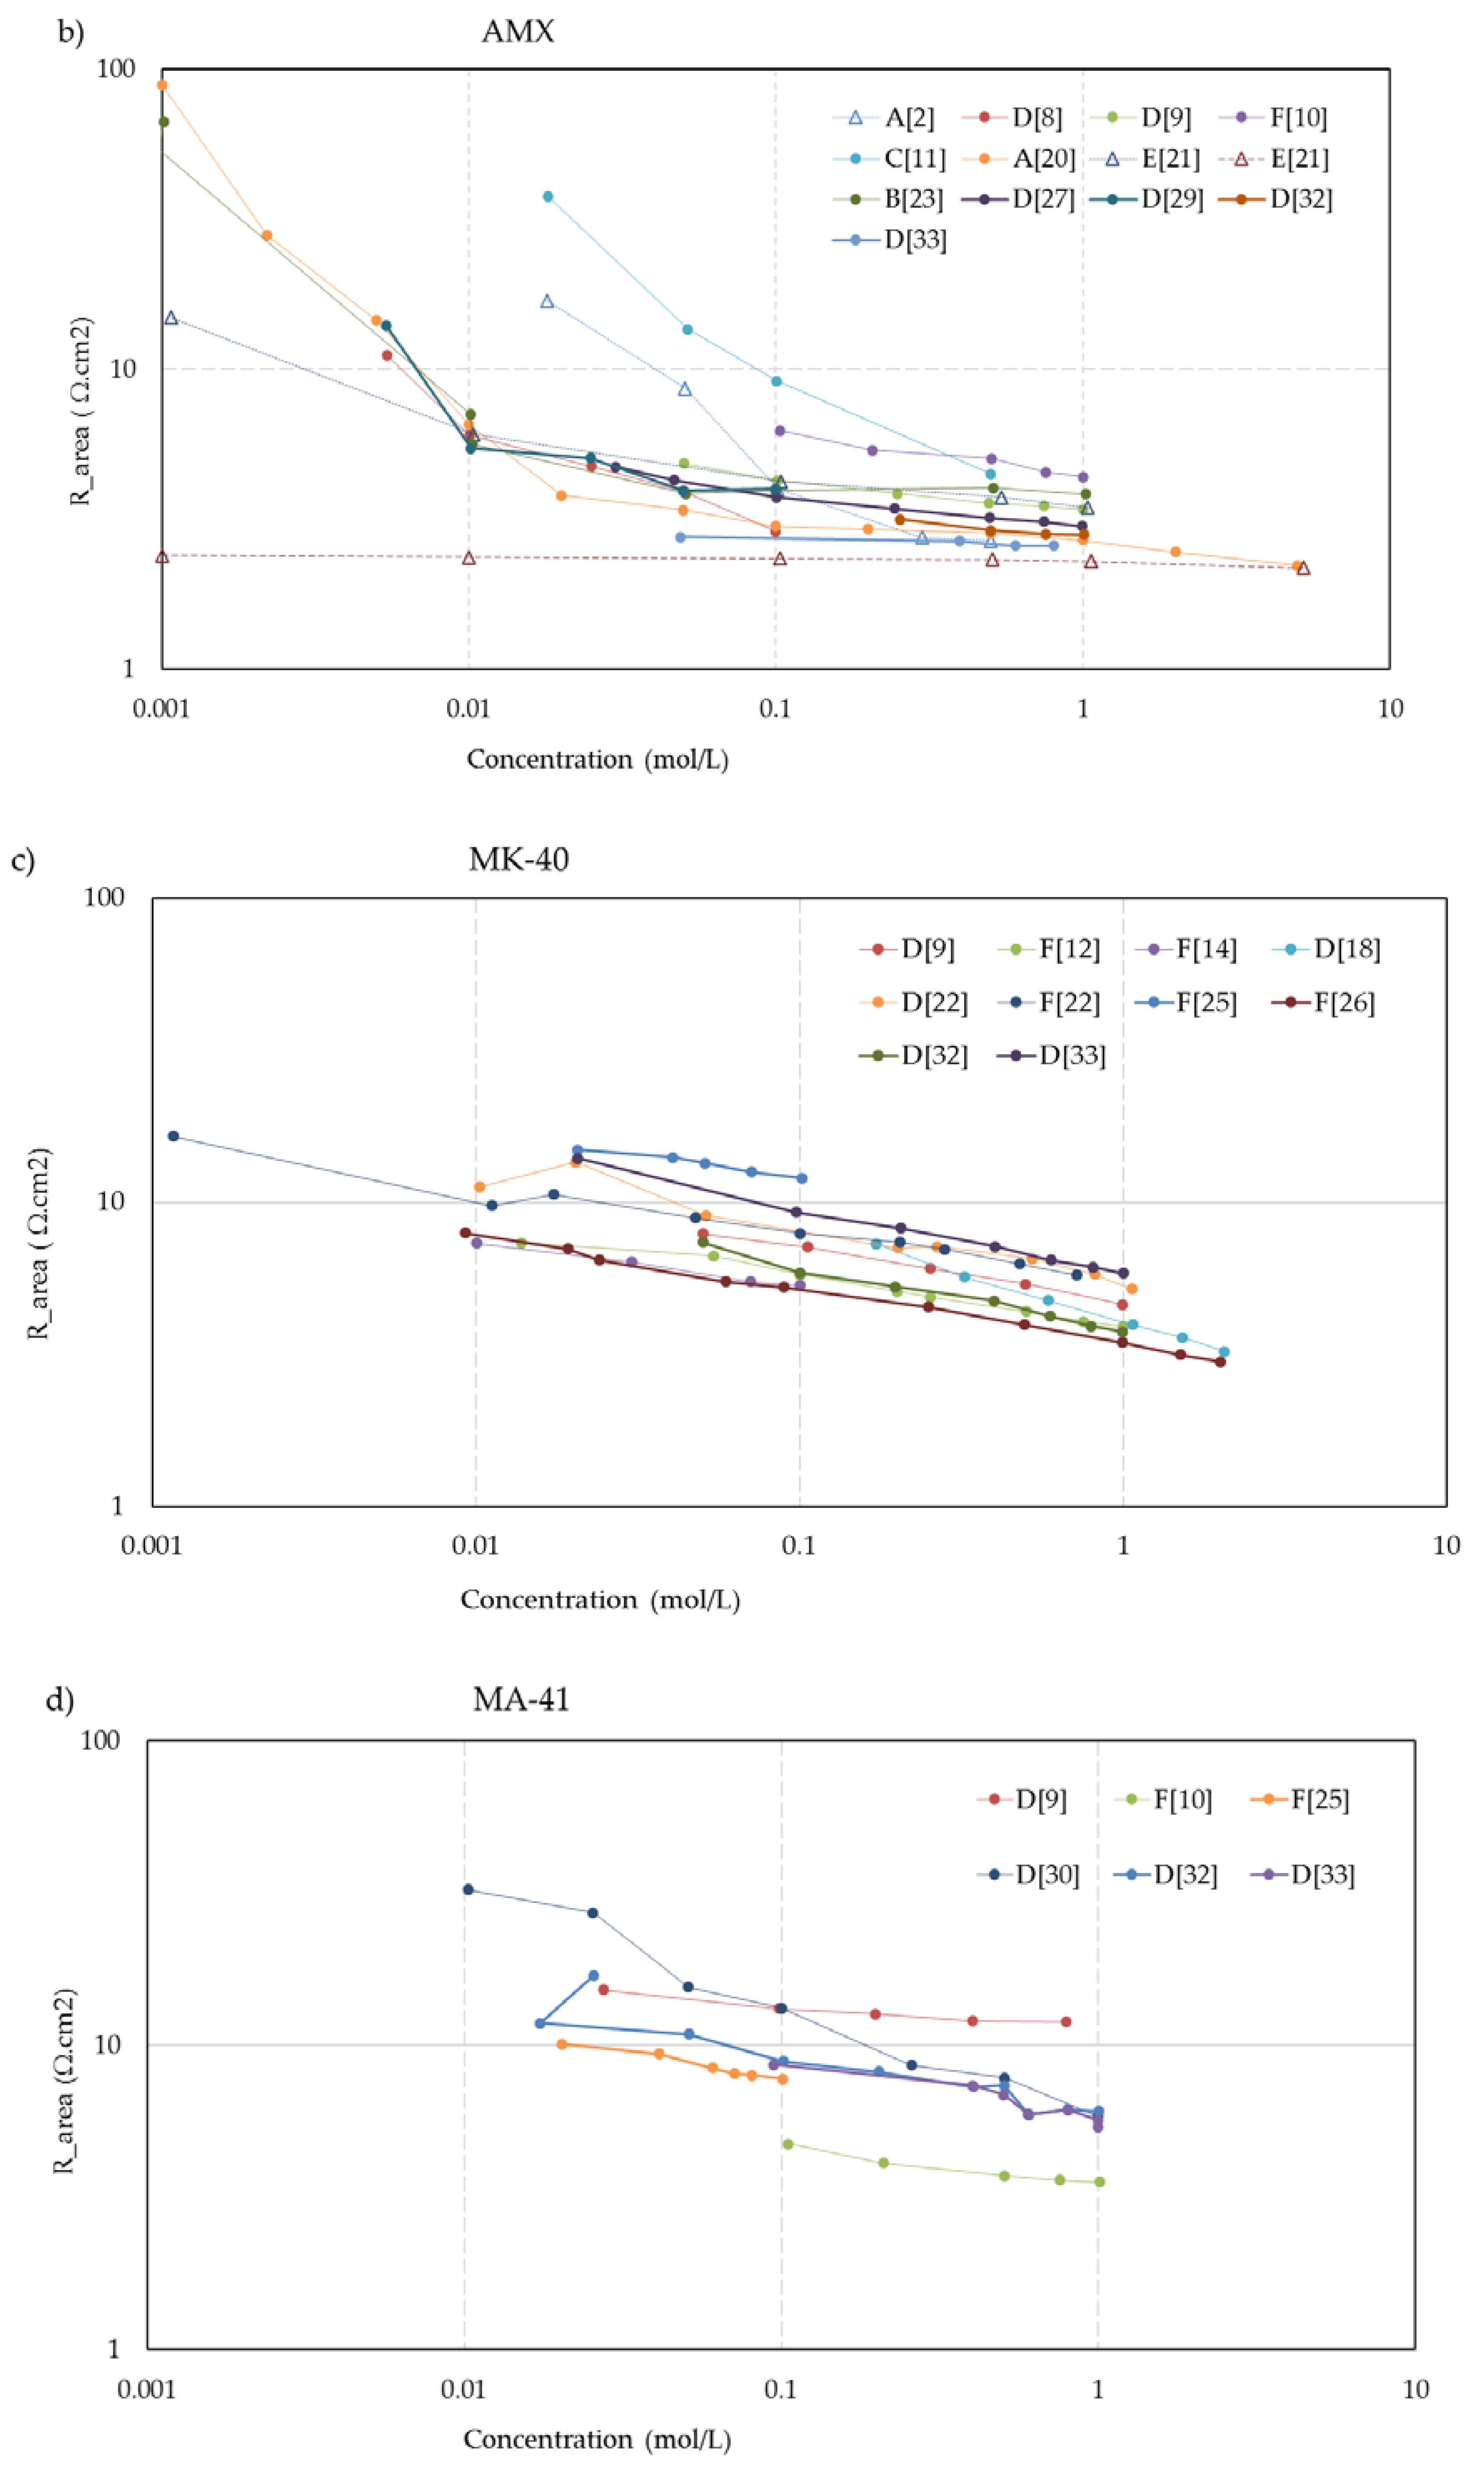
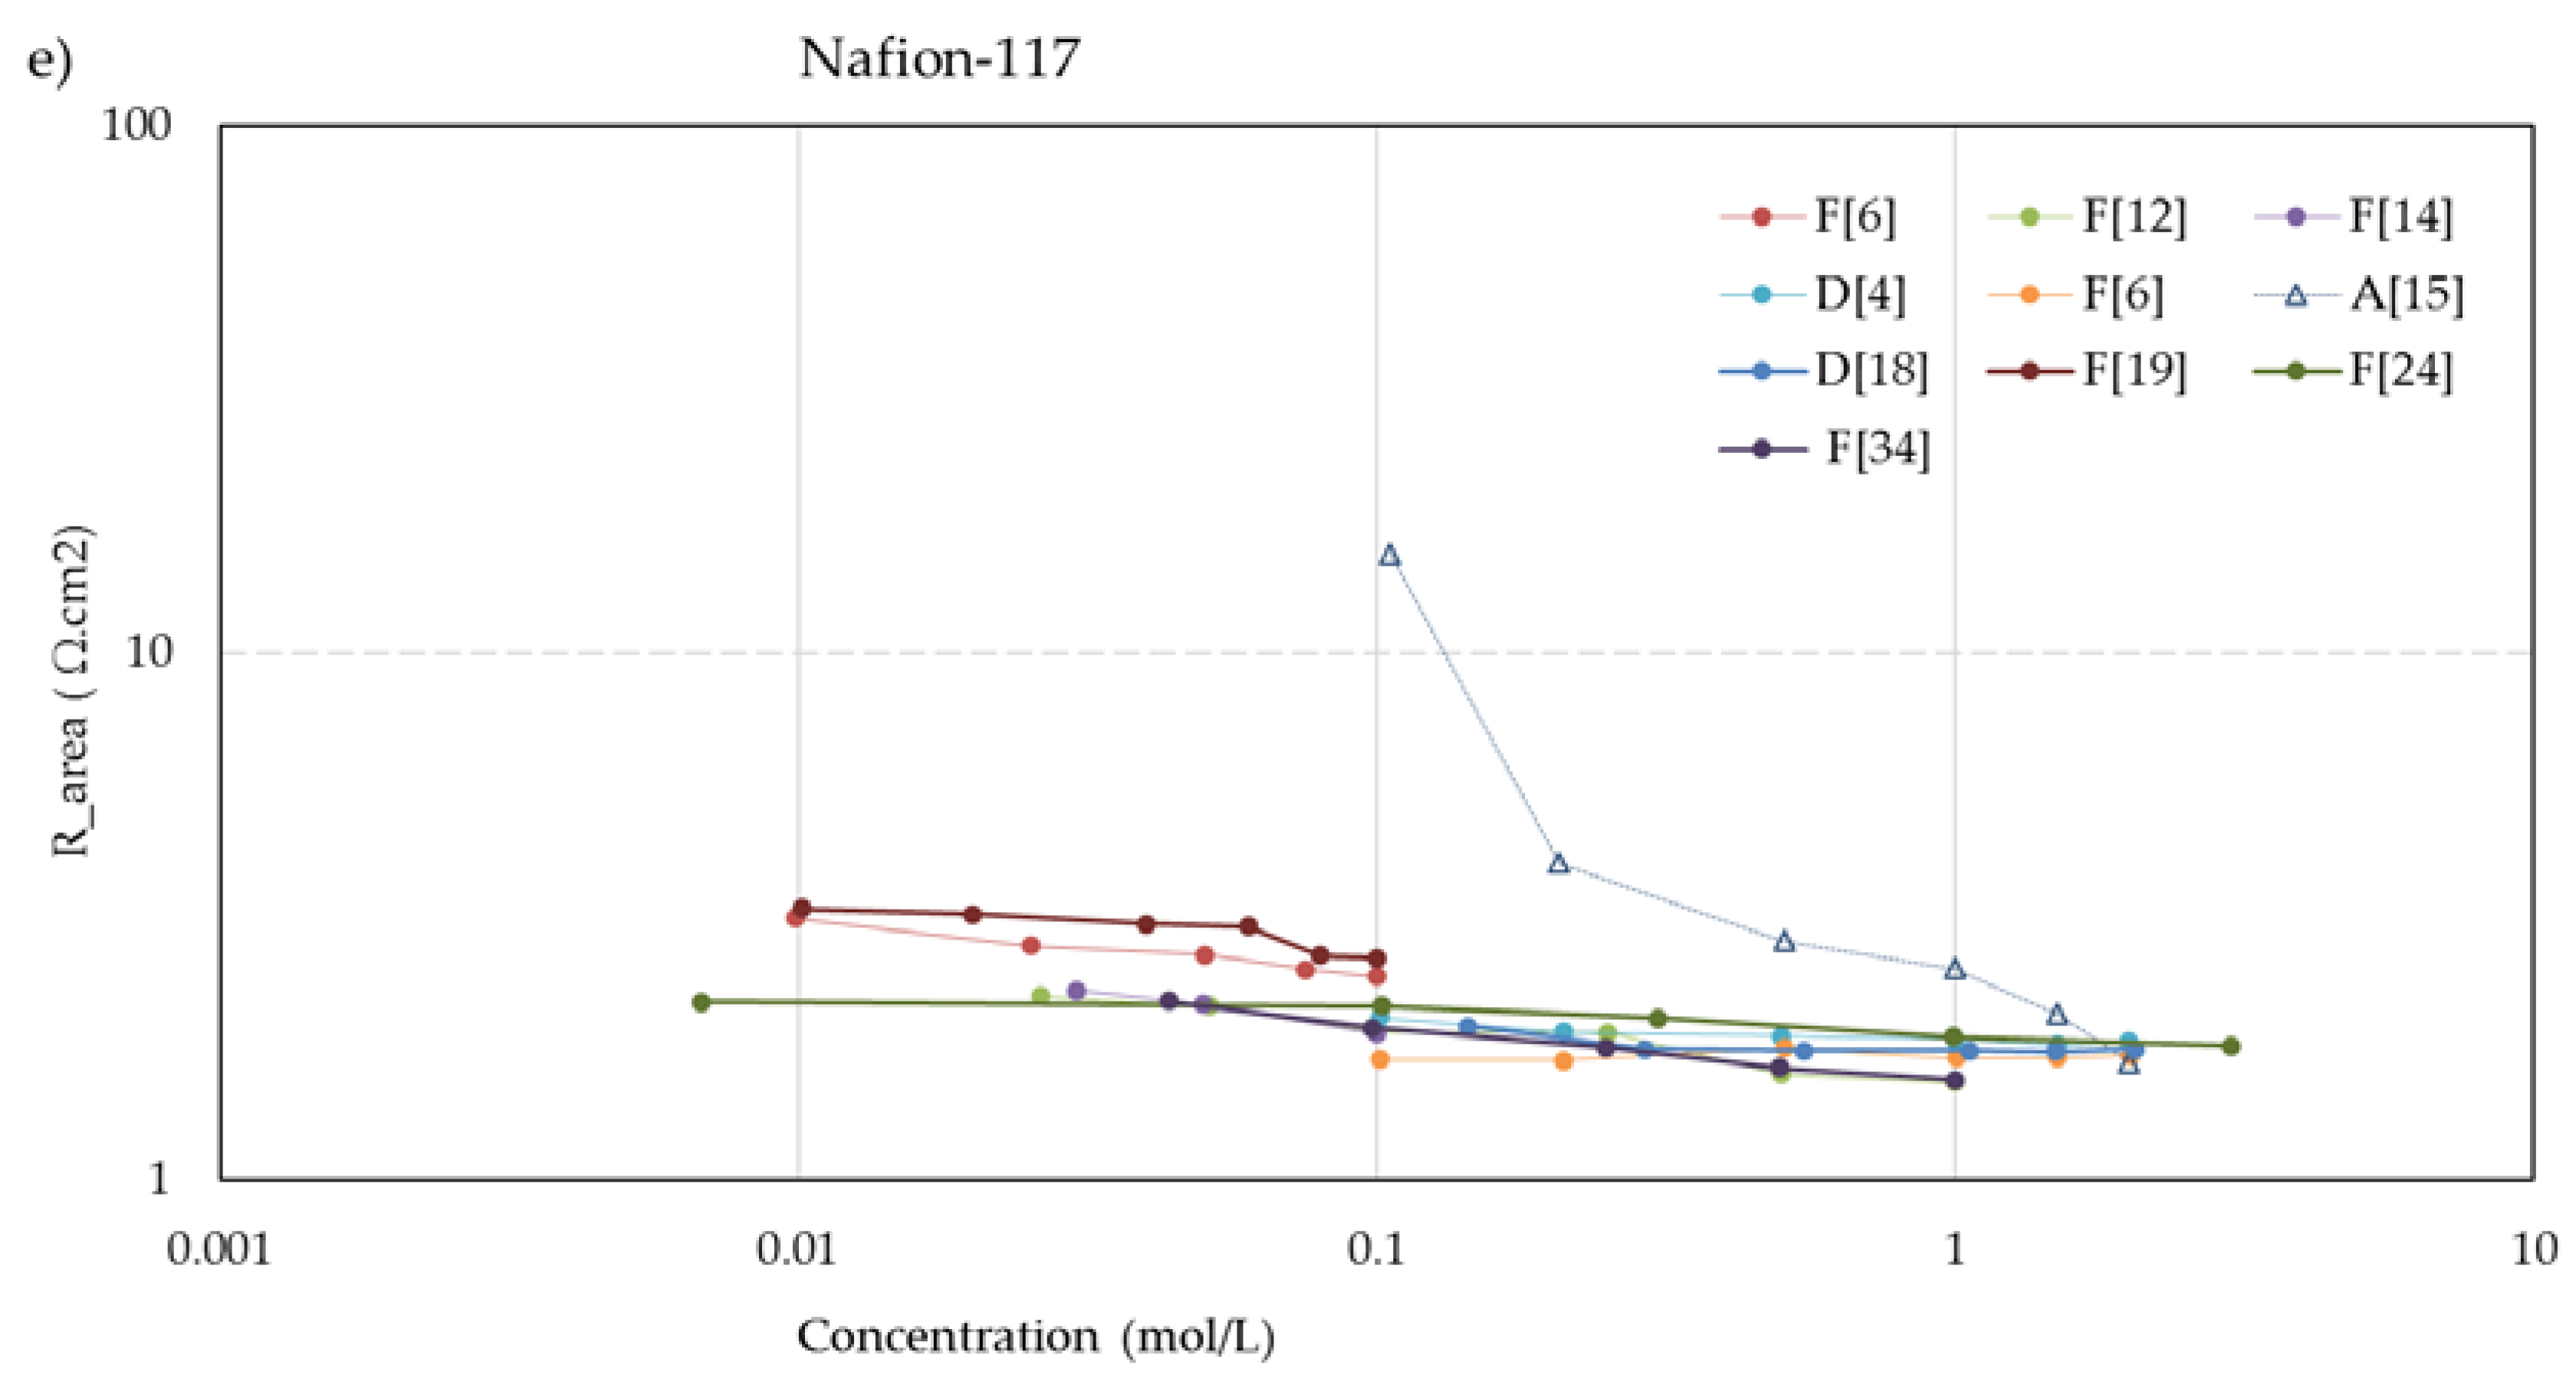
Figure 5 shows the concentration dependent resistance of these five membranes. The legend mentions the used measurement cell (A, B... F) as well as the source. To aid visual interpretation, the data points are interconnected by solid lines for experiments performed with alternating current (AC) and dotted lines for experiments performed with direct current (DC). An exception is the dashed lines in the CMX and AMX plots from the experiments of Kamcev et al. [21], who used a short dip with the membranes in concentrated NaCl (5 M) before the measurement to prevent depletion layers between the electrodes and the membrane. Apart from these two datasets, the membrane resistance increased at lower concentrations in all cases of these five selected membranes. This suggests that the dip method as applied by Kamcev is not entirely optimal. The Nafion-117 plots (Figure 5e) also show an outlier: the plot indicated as A [15] from the experiments of Nouri et al. [15]. In the collection of all Nafion-117 plots in this figure, the A [15] plot is the only one performed with DC and the only one measured in a six-compartment cell with two pairs of electrodes. However, such deviations are not seen in the graphs of the other membranes in Figure 5, and our conclusion is an error in the measurement or in the examined membrane.
The trend of higher resistance at lower bulk concentration is present in the whole dataset.
Exceptions are:
  • The MF-4SK-1** and MF-4SK-2** membranes in the paper of Falina et al. [19]. These membranes have a very dense reinforcing fabric which makes swelling difficult. This results in membranes with little solution phase, leading to a relatively high resistance in a 0.5 M bulk solution and no remarkable increase of the resistance at dilution of this solution.
  • The membranes CMX and AMX in the experiments with a 5 M NaCl dip of Kamcev et al. [21]. The authors used the metal contact method and argued that a short dip in a concentrated NaCl solution improves the contact between electrode and membrane. However, all other datasets show an increase of the resistance at dilution of the bulk, and it seems that the salt is diffused inside the membrane. Moreover, the authors applied a DC current with a superimposed AC current and therefore, the migration of salt ions into the membrane is conceivable.
  • The membranes CM-1, CM-2, and Nafion-117 in the experiments of Nouri et al. [15] with the mercury contact method. However, with other measuring techniques, they found an increasing resistance at dilution of the bulk. Given the abundance of conflicting results with other methods and by other researchers, we regard these data as outliers.

4.2. Effect of the Method

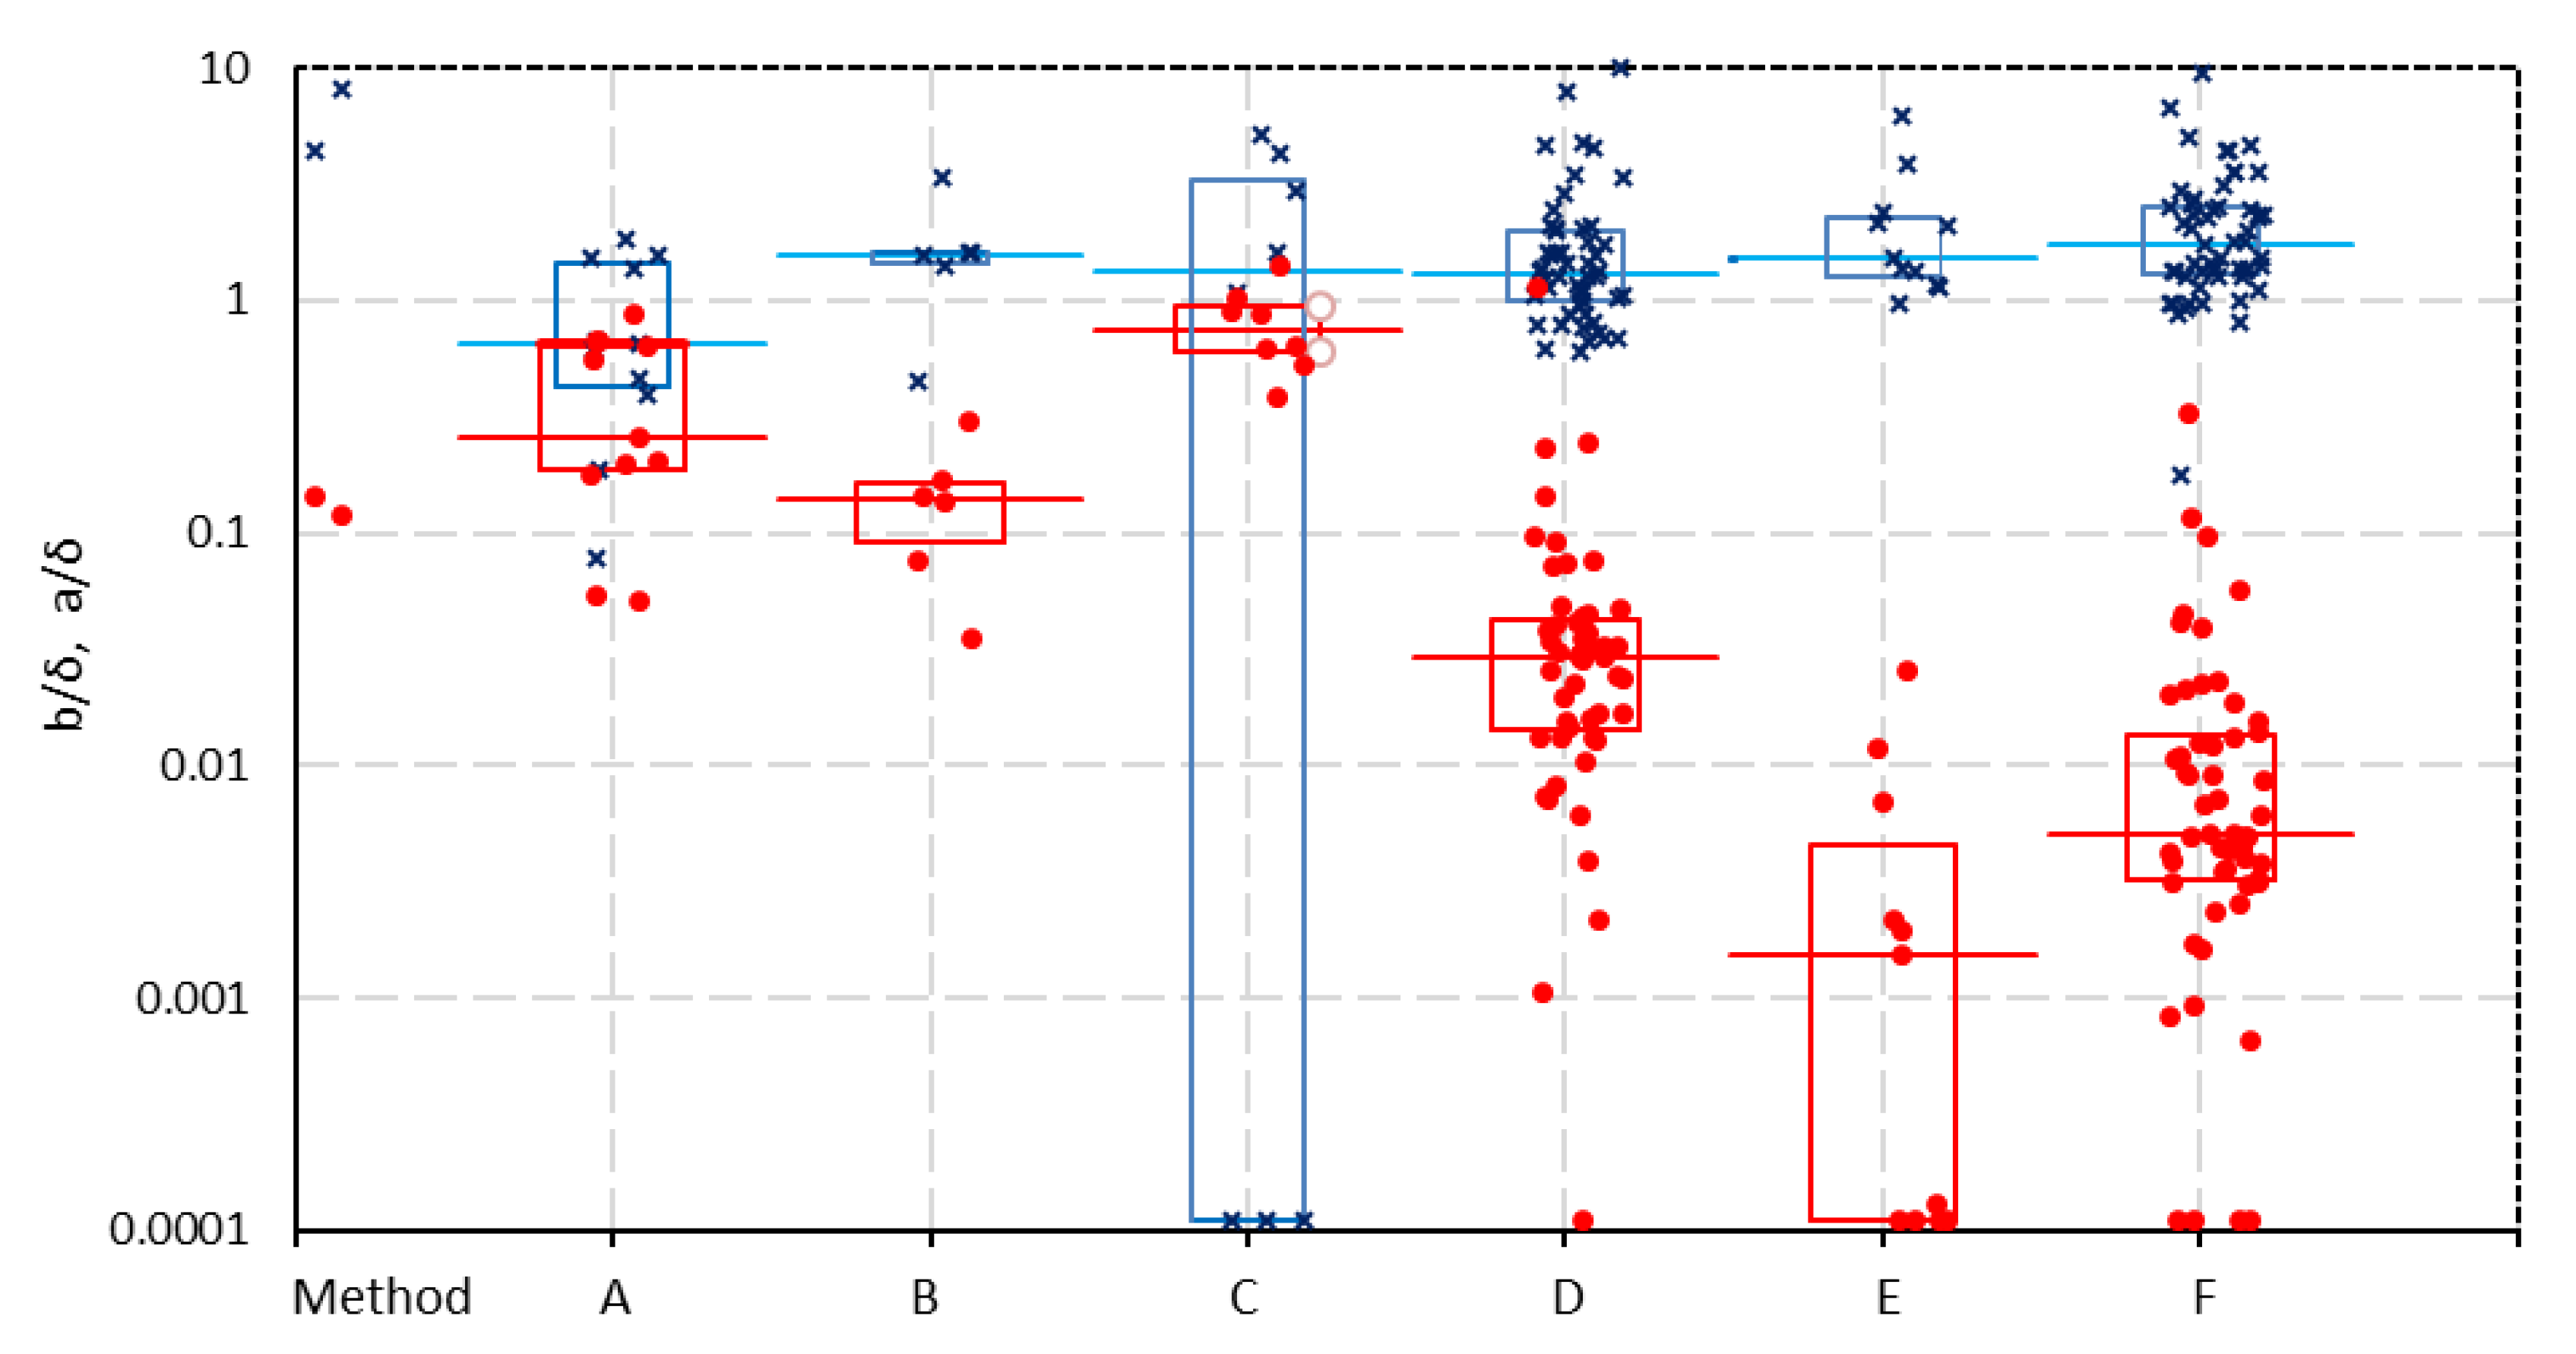
In Figure 6, the corrected values a/δ and b/δ from the one-thread model of all the datasets are plotted according to the various measuring techniques. There are no significant differences for a/δ with the different methods. However, remarkably large differences are seen for b/δ between results on the one hand for A, B and C and on the other hand for E and F with an intermediate formed by D.
The same trend is seen in Figure 7 where the specific resistance (the area resistance Rarea divided by the membrane thickness δ) at low concentrations (0.005 mol/L) of all membranes is plotted. These resistances are calculated using the values a and b from the fits of the 1-thread model (Rspec = (a + b/C)/δ). The figure shows no large deviations between the methods at ‘normal’ bulk concentrations (0.5 mol/L). However, at low concentrations (0.005 mol/L), the resistances measured with methods A, B, and C are very increased, and with method D, the values are increased moderately. We will try to interpret these differences.
  • Use of reference electrodes. The difference between (A, B, C) and (D, E, F) is that in the first group (A, B, C) of reference electrodes are used in the cell and in the other group (D, E, F), the voltage is measured across the working electrodes. In most cases, these reference electrodes are Ag/AgCl electrodes connected with Luggin–Haber capillaries near the membrane surface. Capillaries near the membrane can obstruct the ionic current perpendicular on the membrane. An indication that the broad Luggin–Haber capillaries are the cause of the deviant behavior are the two datasets (for AMX and CMX) from Galama et al. [20], who used thin platinum–iridium wires as reference electrodes in a 6-compartment cell; in these cases, the b/δ values are rather small (respectively 0.051 and 0.053).
  • Applying blank correction. With direct contact methods between the membrane and electrodes (method E and F), no blank correction is used. However, possible effects of the blank correction on the resistance are unclear. Then, method D remains a separate problem: most measurements in our dataset are achieved with clip cells where a blank correction is applied. Here, the increase in resistance is significant but not as extreme as with the methods A, B, and C.
Nouri et al. [15] compared three methods: the mercury cell, a clip cell (‘LMEI clip’), and a 6-compartment cell with reference electrodes (‘Guillou’s cell’). As stated before, the results with the mercury cell are very divergent from all other datasets with this cell type, and we shall ignore these measurements. However the comparison of the 6-compartment cell (method A) and the clip cell (method D) is very illustrative. Table 5 shows again the same discrepancy for b/δ if measured with different systems.
In all considerations about membrane resistance, the question is whether we are interested in membrane properties or material properties. Suppose that the mercury contact method is superior for determining the material resistance; then, it is possible that the water-contact methods give a better approach of the expected resistance of the membrane in real applications.

4.3. Choice of Fitting in the Resistance or in the Conductivity Domain

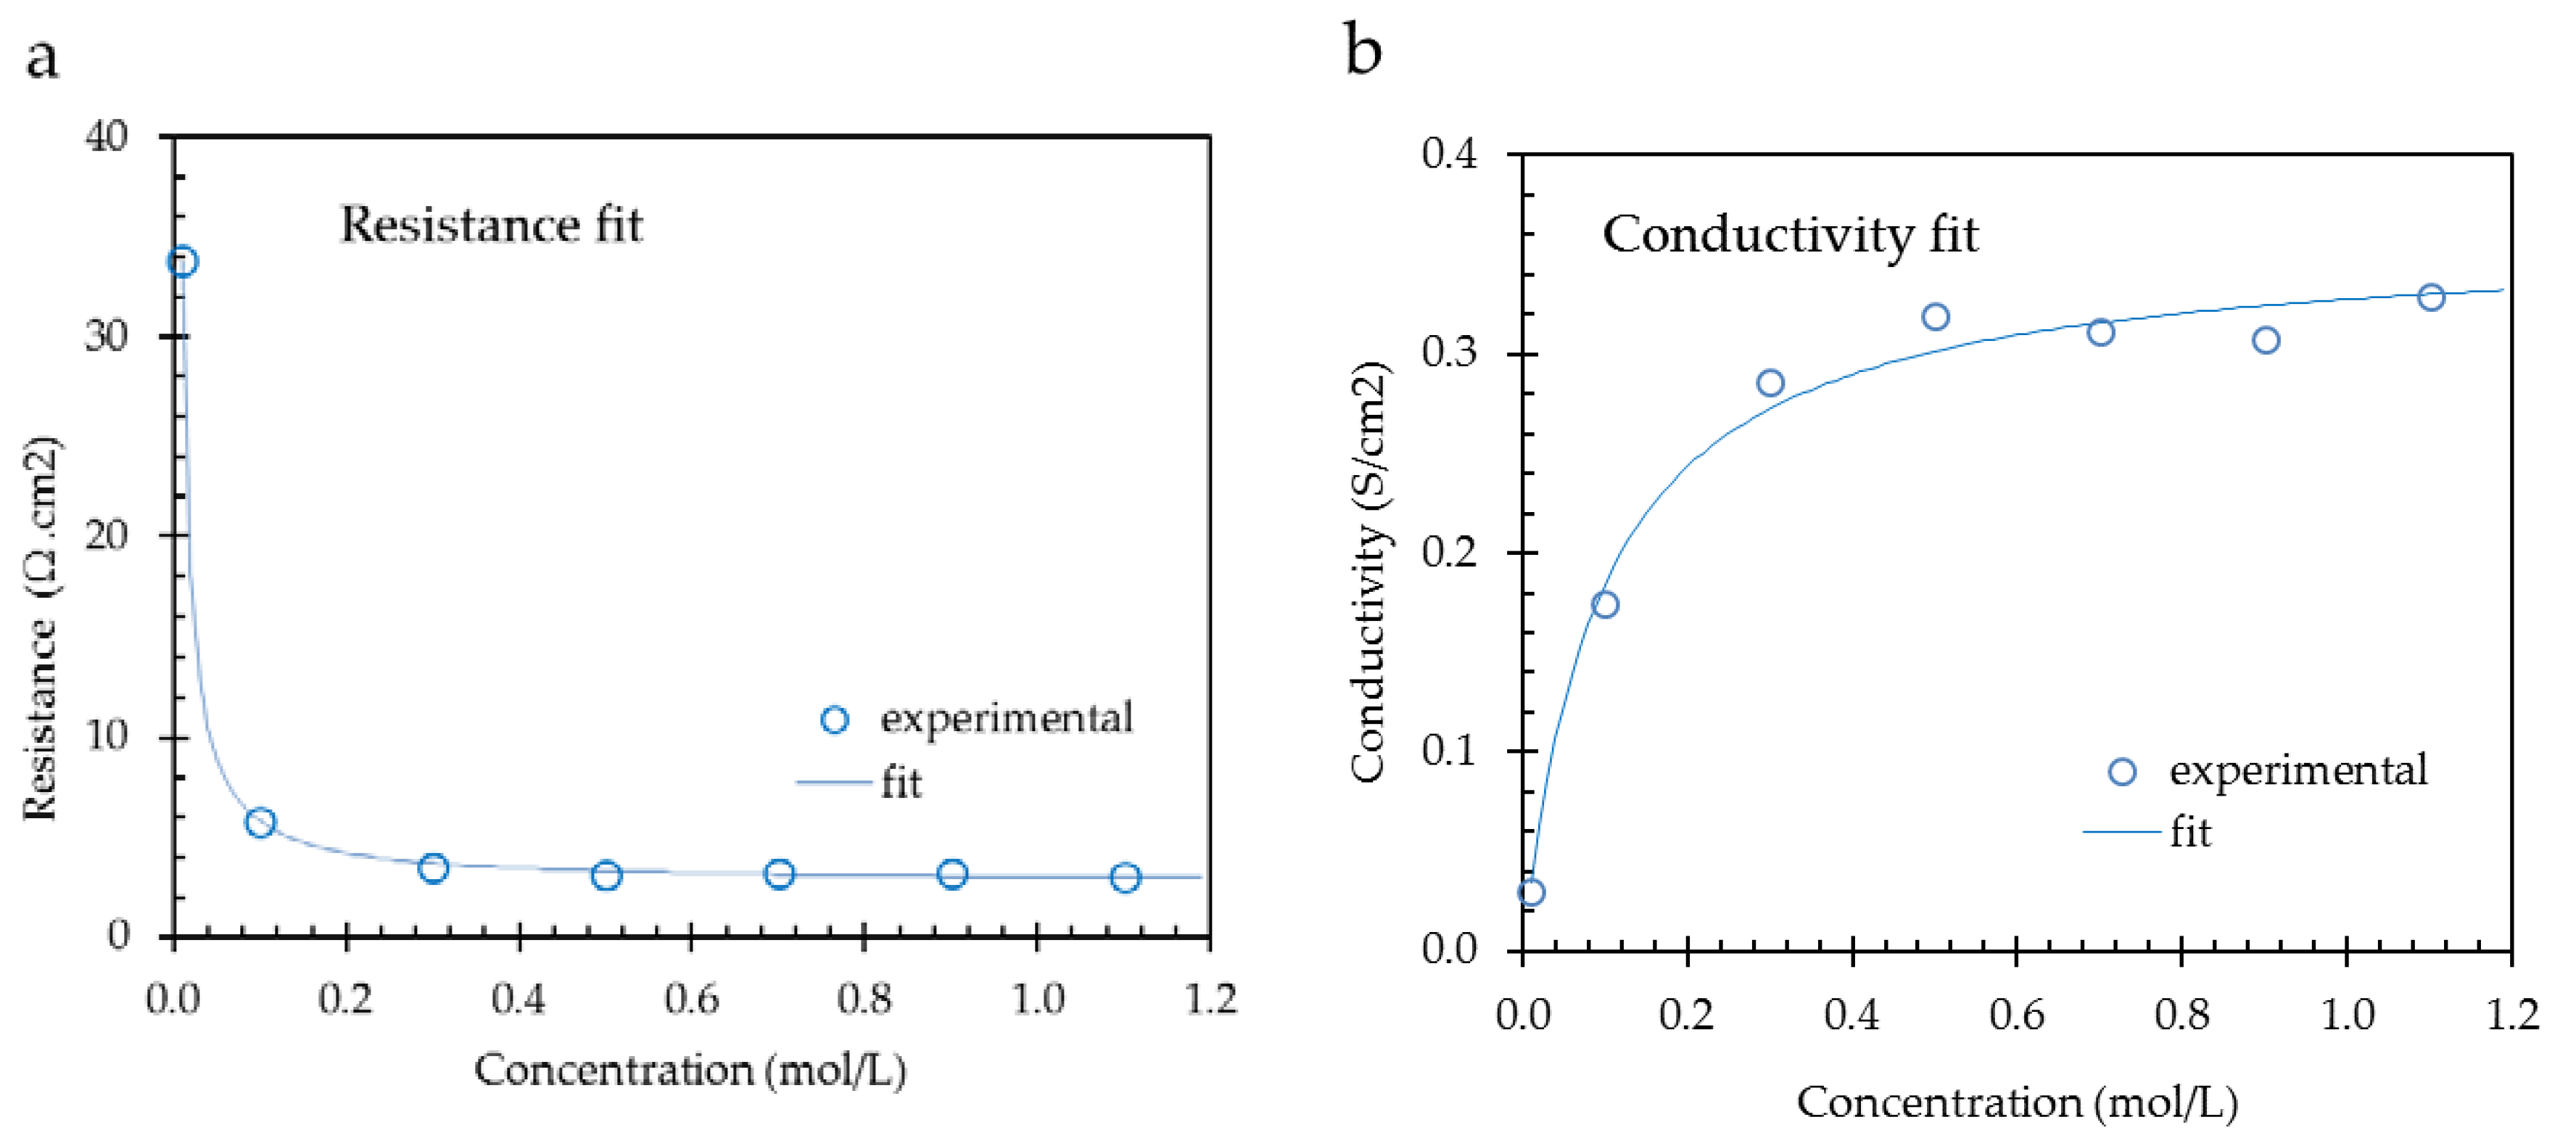
Figure 8 shows the results for a CMX membrane from a resistance fit (left) and a conductivity fit (right); data used from [1]. The numerical results are listed in Table 6. For the fits, the simple 1-thread (two parameter) model is applied.
With the resistance fit method, the fit values at low concentrations are high and influence the model more than the high concentration fit values. At low concentrations, the contribution of the solution phase is predominant. At these low concentrations, there is a danger of experimental errors in maintaining the bulk concentration constant, especially if metal contact methods are used. Otherwise, the assumptions of a linear conductivity of the bulk and a constant conductivity of the gel phase are better guaranteed at lower concentrations. Moreover, the published datasets cover usually the lower concentration range below 1 mol/L. The conclusion is that we expect that fitting the resistance is more reliable than fitting the conductivity, assuming that the experiments were carried out with great care.
In the example as presented in Table 6, the best fits are obtained with the resistance method due to the higher R2 value. However, this is only one example, and we fitted the 6 suggested models to each of the 145 datasets in two ways (resistance and conductivity). For each pair (resistance and conductivity plot), we compared the R2 values. For each model, Table 7 shows higher R2 values with the resistance regression. The last row in the table indicates the p-values as obtained with the binomial sign-test. For most models, these p-values are less than the significance level of 0.05, indicating a significant improvement. Only for the 3-thread model do both fit methods seem to be statistically equivalent. Therefore, we will restrict ourselves to the following considerations to the resistance fit method.

4.4. Comparison between AC and DC Measurement

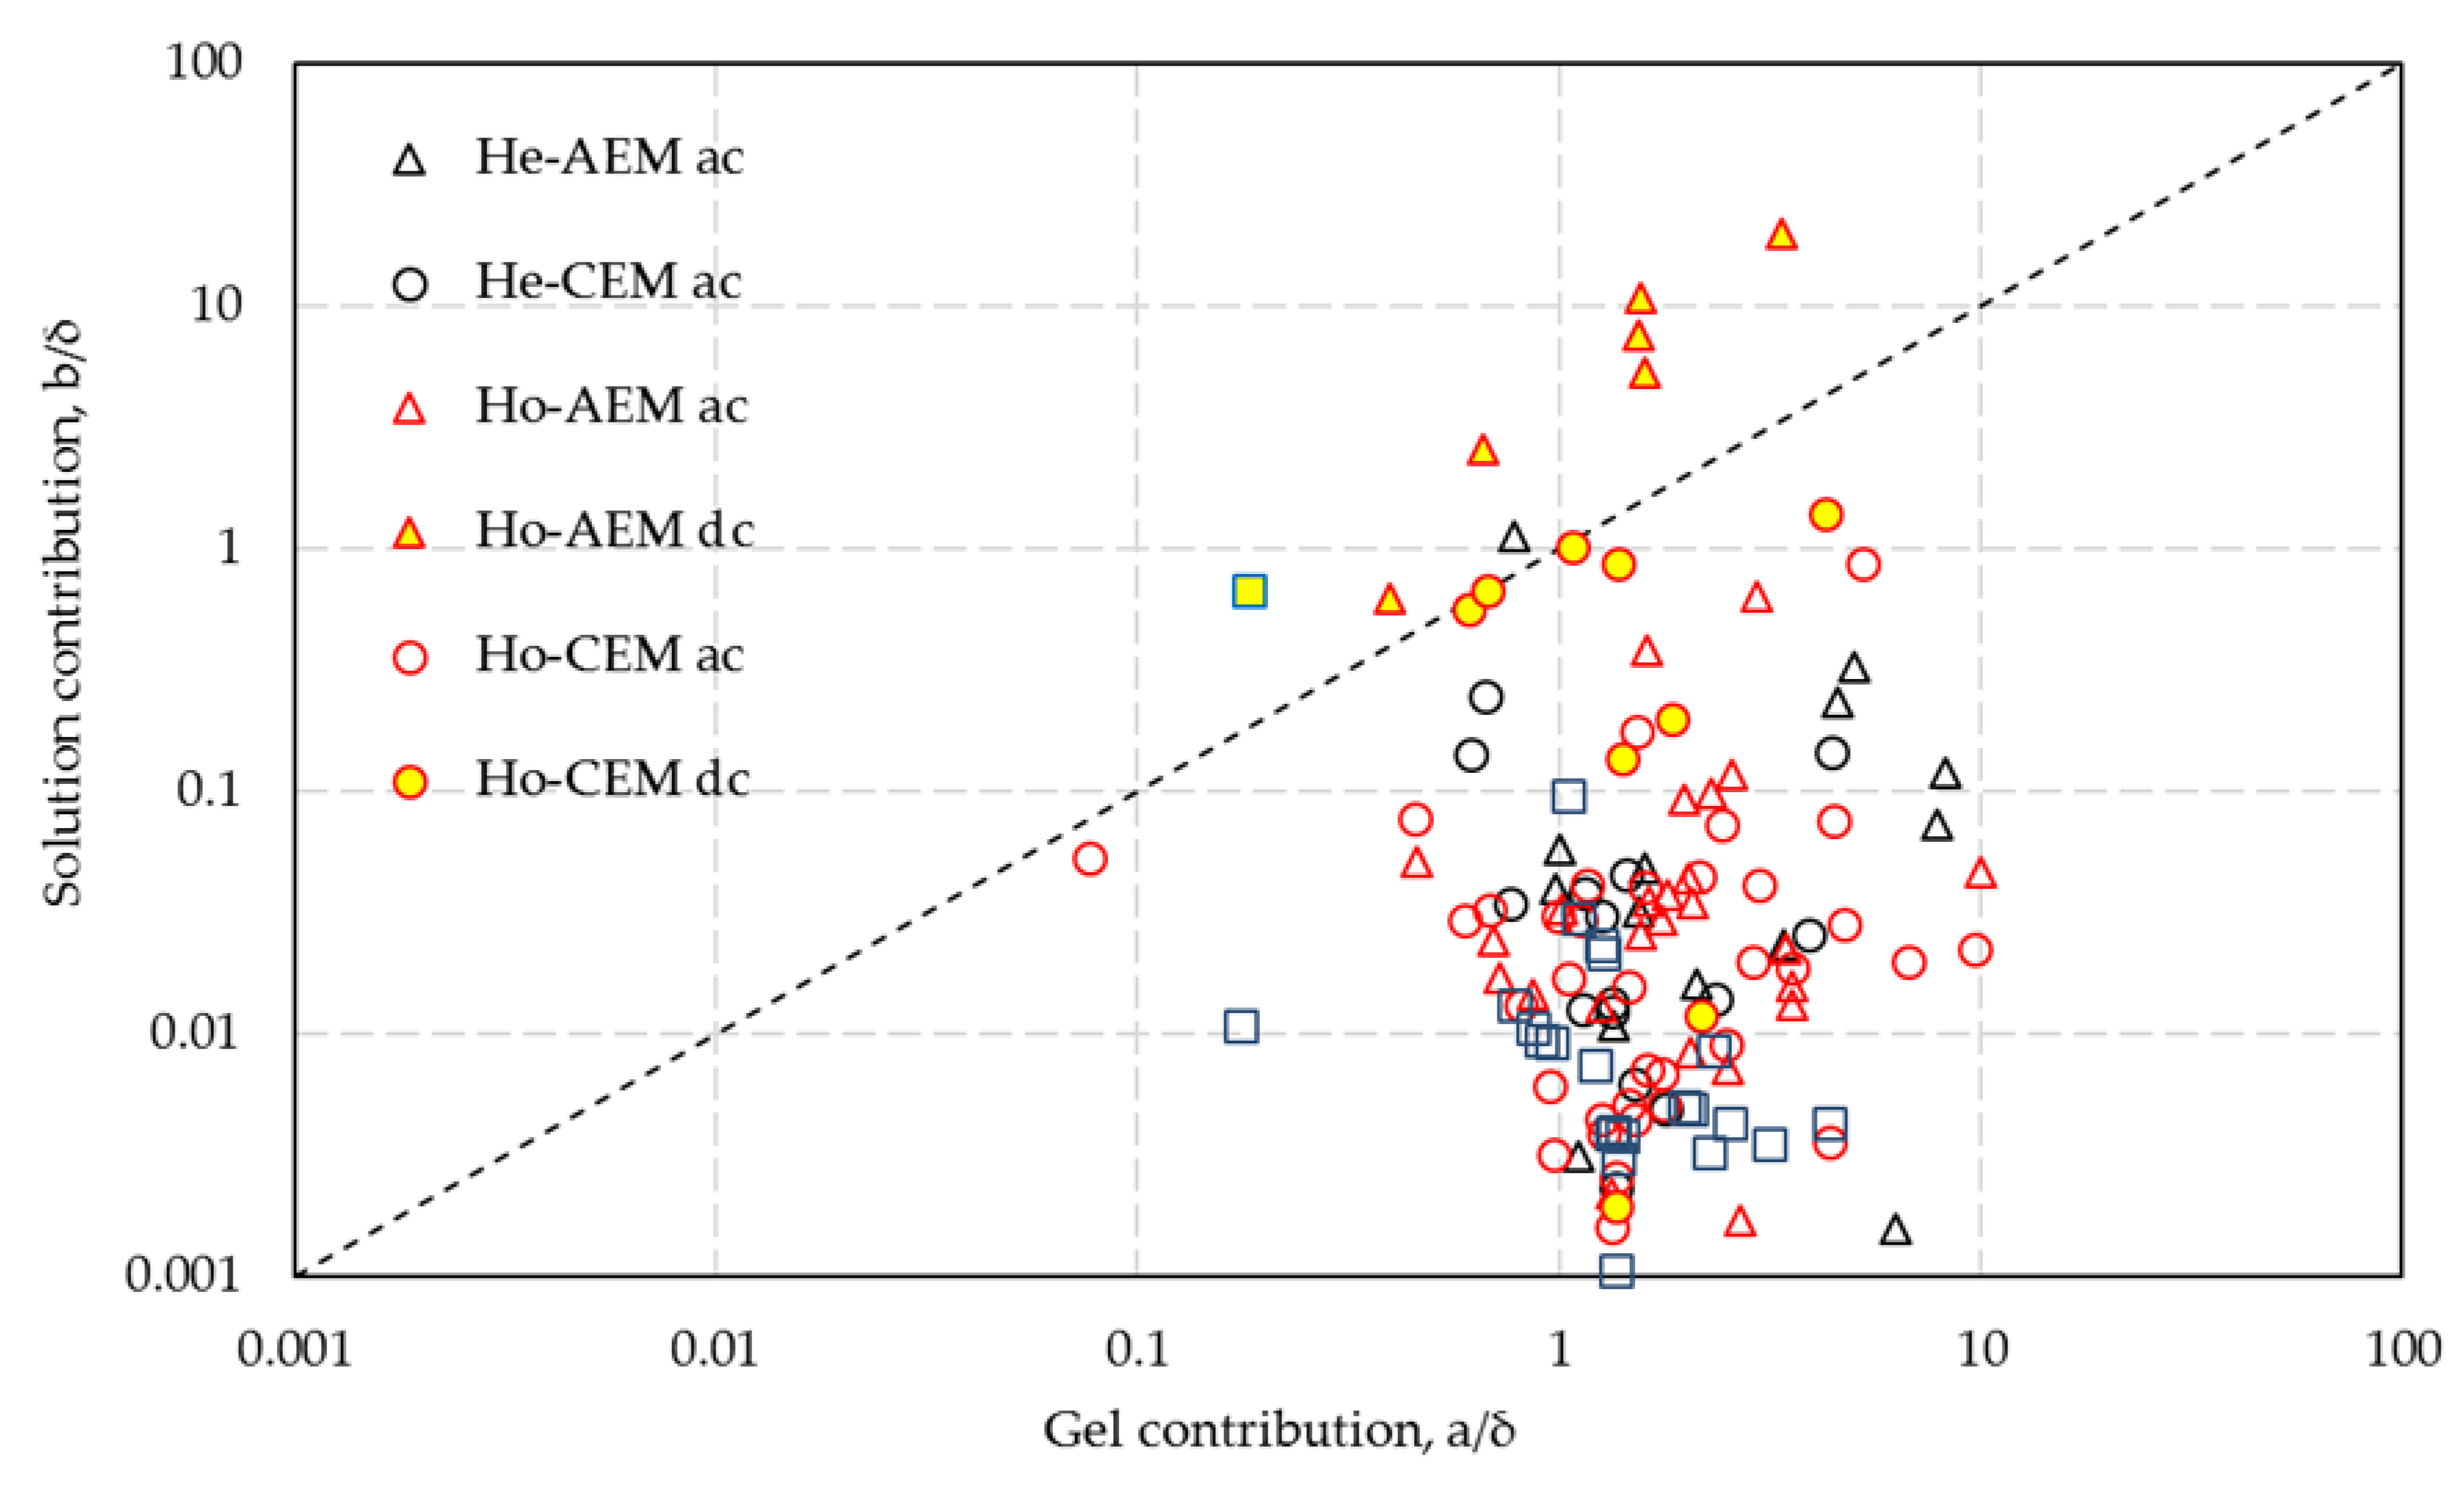
The simple model R = a + b/C is fitted in the resistance domain for all datasets. The corrected parameters a/δ (the contribution of the solution in the membrane vesicles) and b/δ (the gel contribution) are shown in Figure 9. It should be emphasized that the plot includes very different membranes (homo- and heterogeneous, anion and cation exchange, commercial and homemade) and measurement methods (AC and DC, metal or water contact, with or without reference electrodes, with 2, 4, or 6 compartments, different year of production).
The mean values for the two parameters are a / δ ¯ = 2.00 and b / δ ¯ = 0.111; thus, the contribution of the gel phase is about 20 times that of the solution phase or 25 times that of the solution phase when not normalizing the fitting parameters by the membrane thickness. No significant differences between the five membrane types are seen in this figure. However, with DC measurement, the b/δ values are much higher than with AC measurement, while the a/δ values are lower. Table 8 shows also the ratio ( a / δ ¯ )/( b / δ ¯ ), which is quite different for both methods. The reason is that with DC measurement, there is the effect of ion depletion outside one side of the membrane and perhaps also within the membrane vesicles.

4.5. Fitting the Six Different Models

The six membrane models from Table 2 were fitted to the found datasets in the resistance (R) and conduction (Κ) domain. Calculated are the normal (R2) and the adjusted coefficients of determination (R2adj). Adjusted coefficients of determination are needed to compare methods with a different number of variables. From all individual coefficients of determination, the mean values are calculated. Table 9 shows the results. R2adj are calculated with [63]:
R a d j 2 = 1 ( 1 R 2 ) n 1 n p 1
where n stands for the number of data points and p stands for the number of fit parameters; R2 is the normal coefficient of determination.
The following conclusions can be drawn from this table:
  • Mean values of normal and adjusted coefficients of determination are in almost all cases larger for the resistance fit (R-fit) than for the conductivity fit (K-fit).
Very low values of R2adj are the result of the small number of data points in each experiment (in much cases less than 5). This can result in zero or negative values of R2adj.
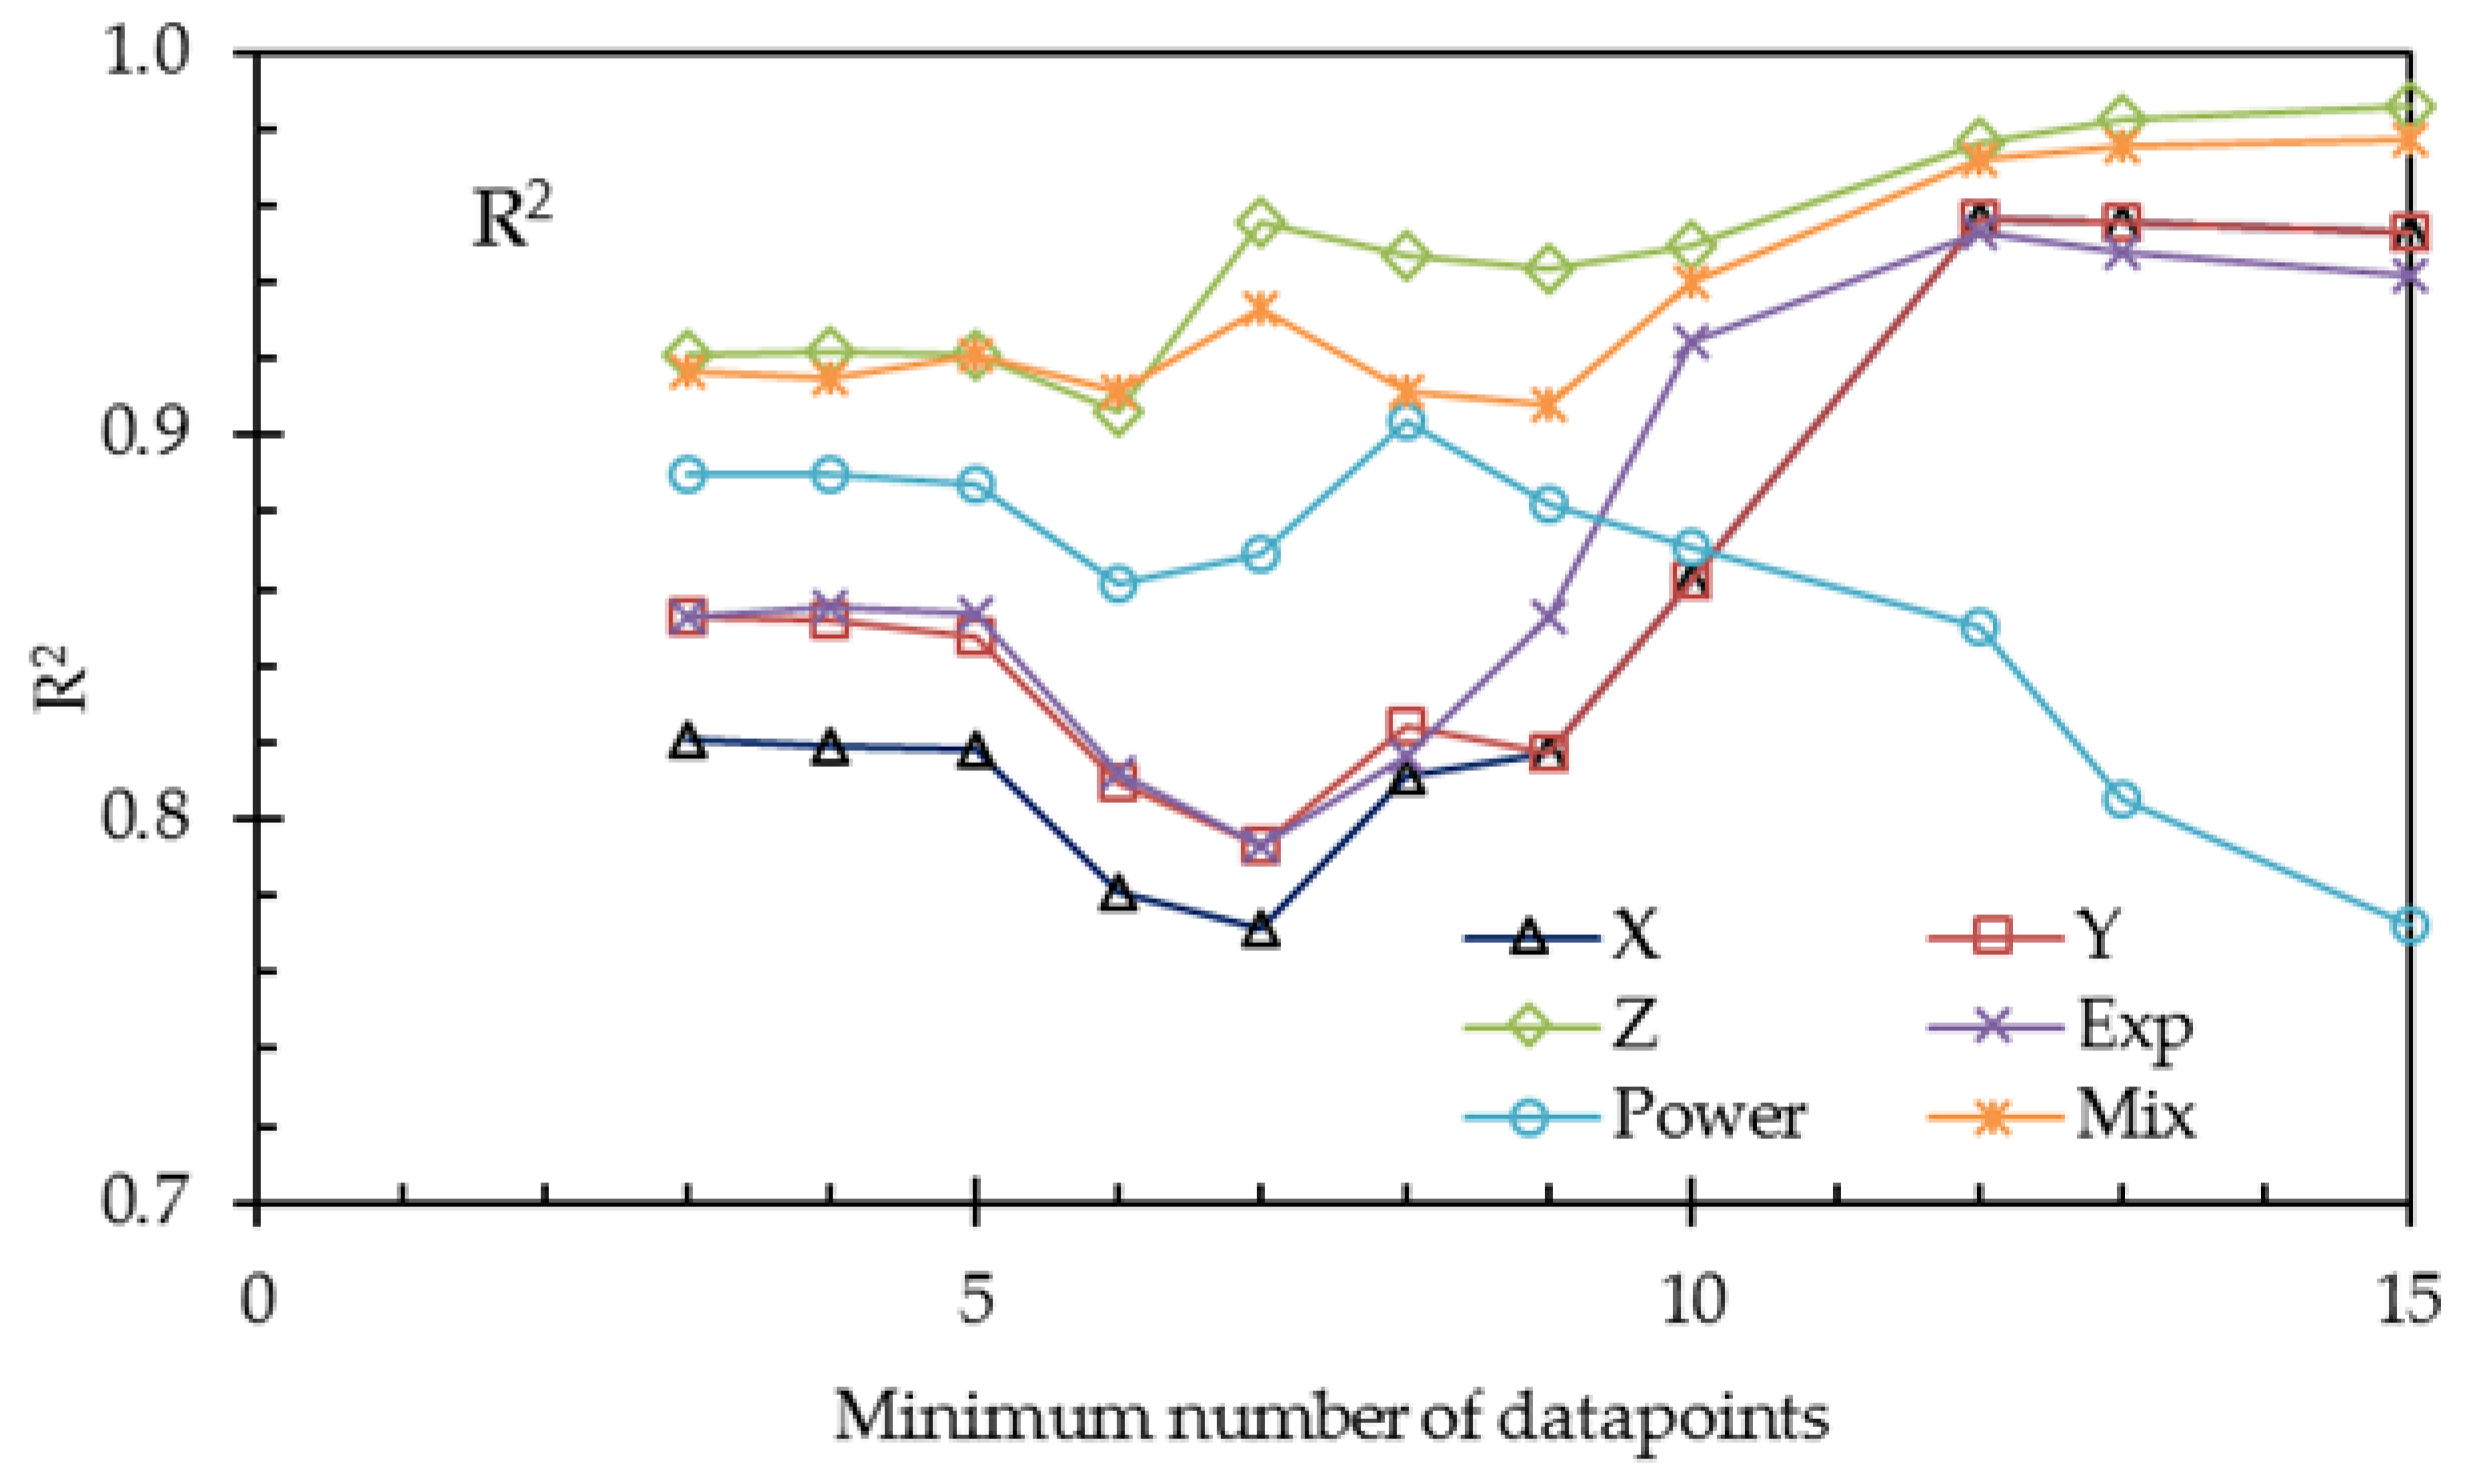
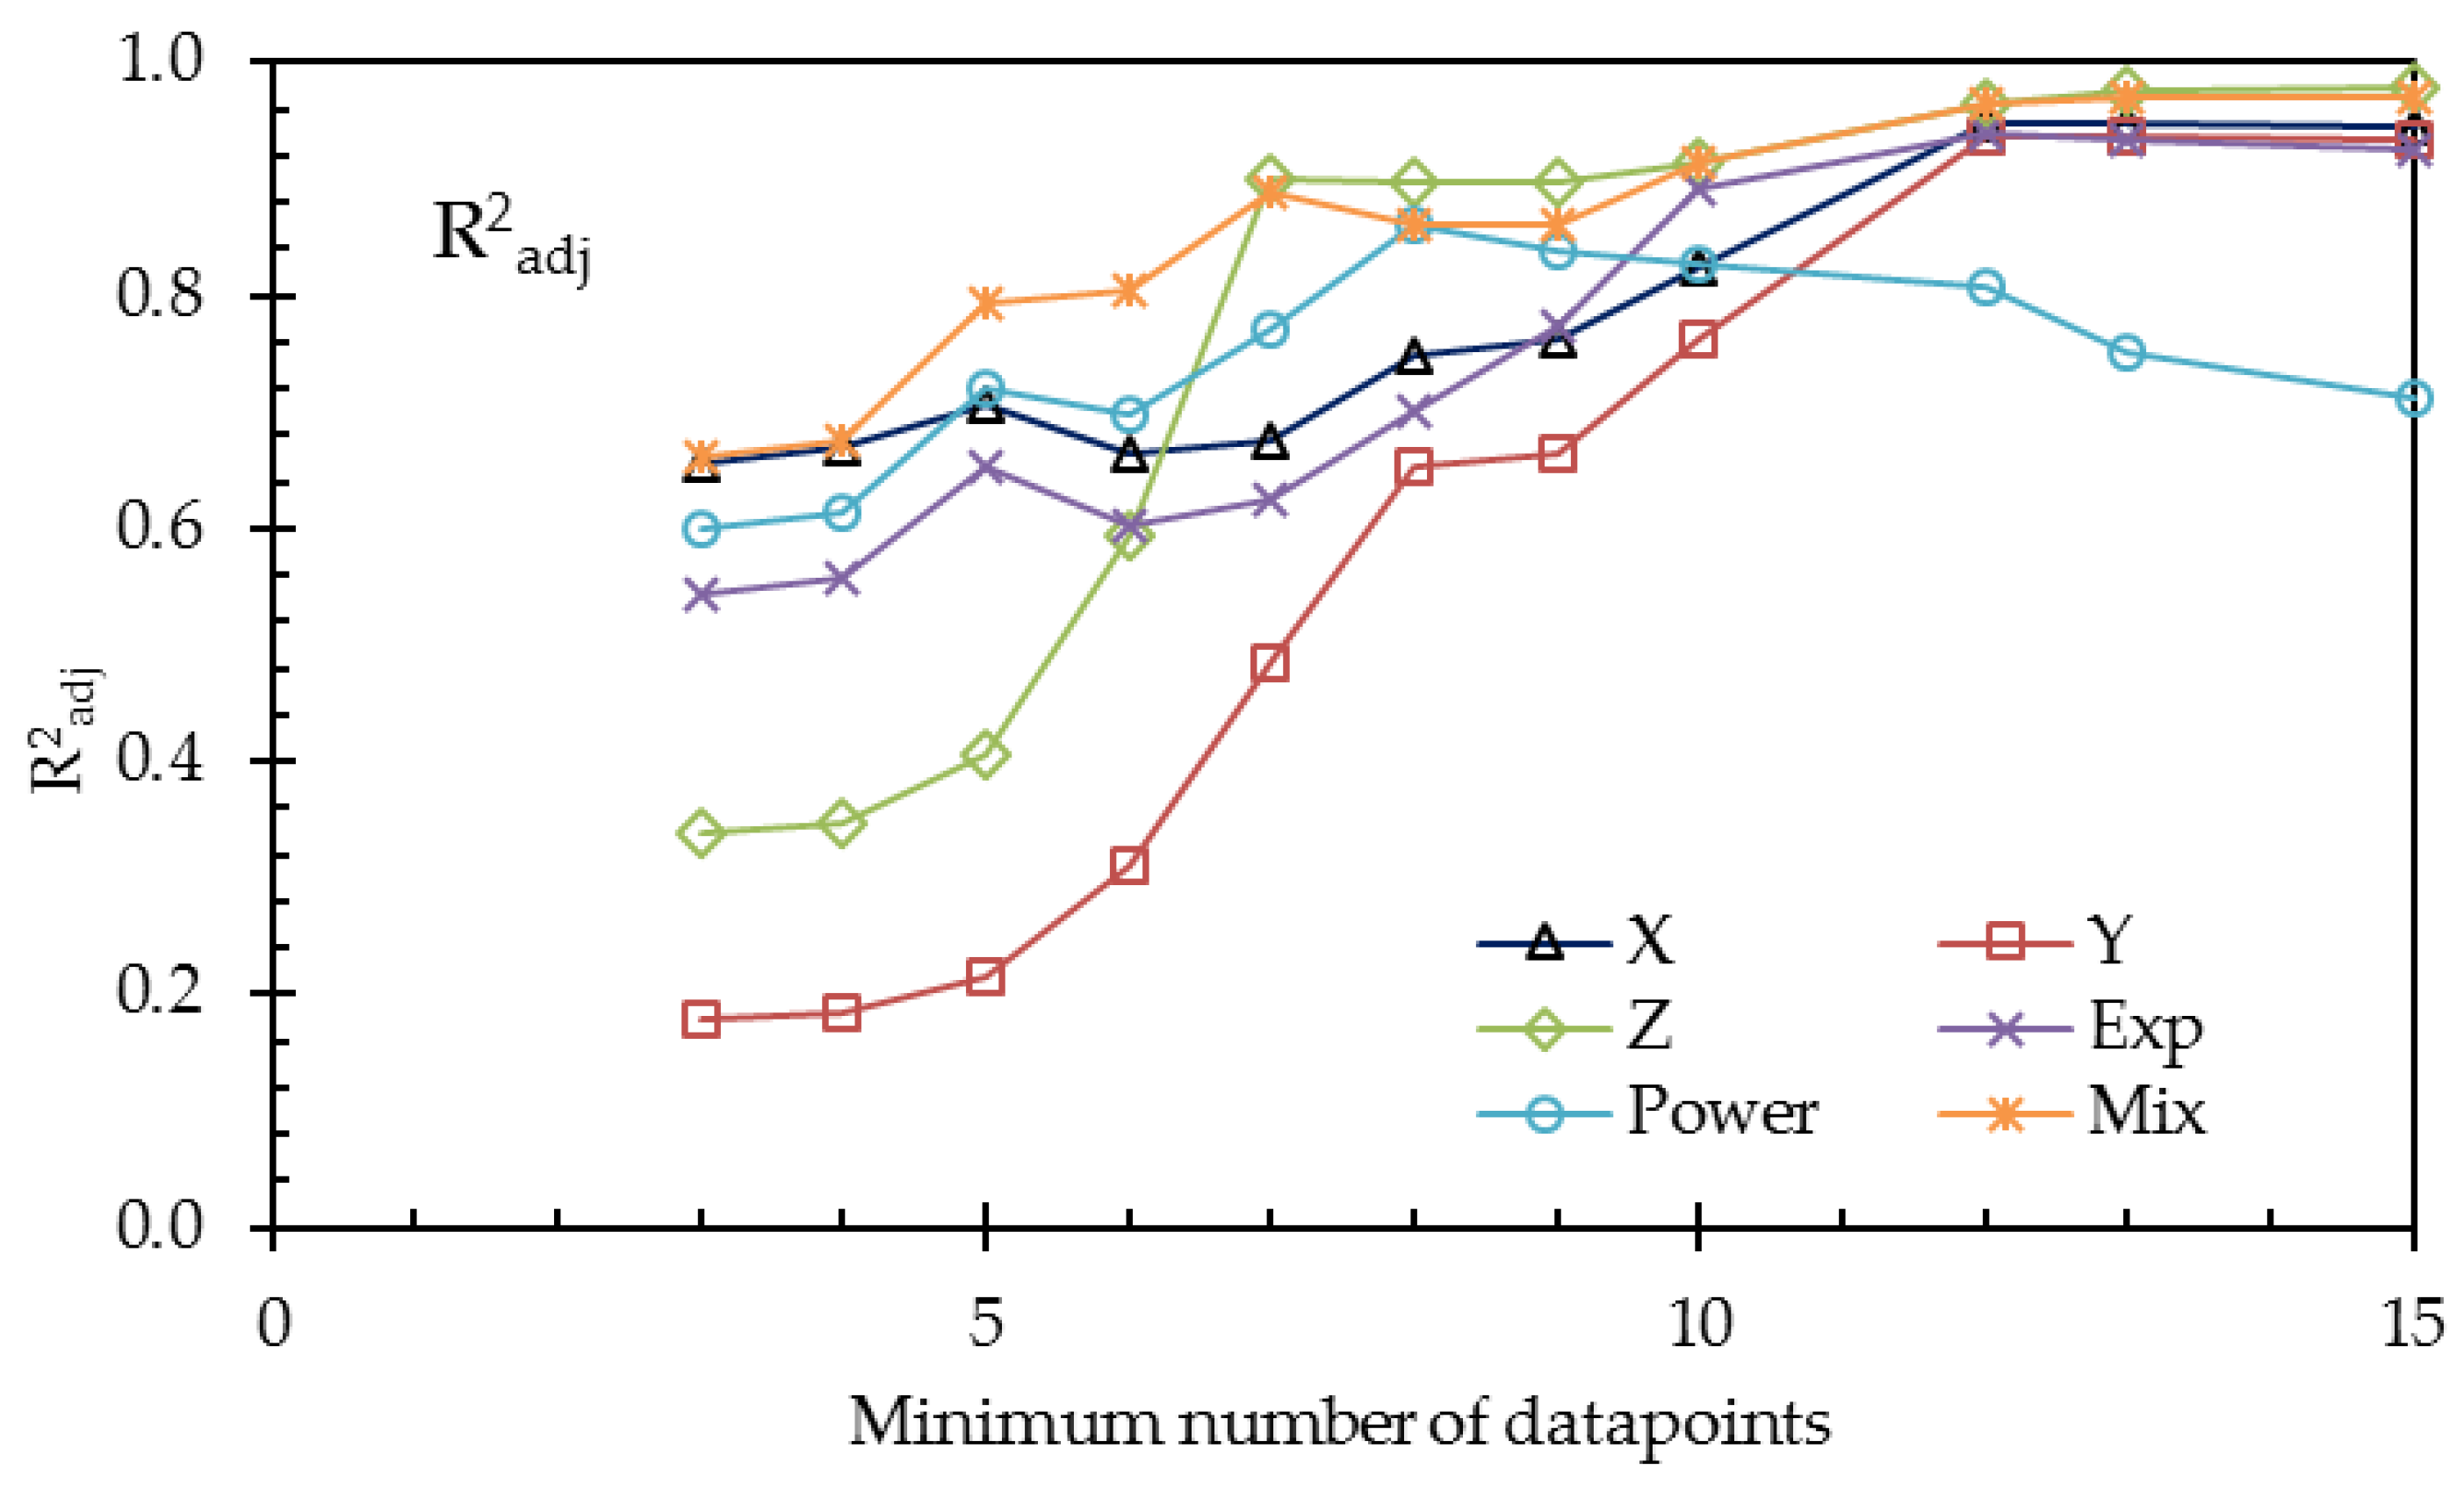
To overcome the problem of the small number of data points, we repeated the calculations with restricted numbers of datasets. The results are listed in Table 10 and plotted in Figure 10 and Figure 11.
From Table 10 and the last two figures, we can conclude, on the basis of the adjusted coefficients of determination, that the 3-thread model (Y) is not an improvement of the 1-thread model X. Although the value R2 of Y is a little higher, the improvement is due to the increased number of fit parameters, resulting in a decrease of the value of R2adj. On the other hand, the refinement by using the Gierke model (Z) is a real improvement, as seen in the larger R2adj.
The exponential (Exp), the power (Power), and the mixed (Mix) phenomenological models—each with three fit parameters—can be compared with each other with the use of R2. The mixed model provides the best fit, which is probably because this model accounts for the nonlinear conductance of gel and solution.

5. Conclusions

Our goal was to compare different methods of measuring membrane resistance and to compare different fit models. We found differences between the different methods but could not clearly identify the causes. There are probably two main causes: the use of reference electrodes (especially thick Luggin–Haber capillaries) and the contact medium (water or metal/carbon) with the membrane. Complications are the great variety in apparatuses, protocols, blank correction methods, and EIS procedures. Moreover, commercial membranes are not chemical compounds with unchanging properties; different lot numbers, year of production, and storage conditions can influence their properties. This makes a straightforward comparison of the applied methods difficult.
For the structural elucidation of ion exchange membranes, concentration-dependent resistance measurement can be a useful tool if enough data points are available. Our first goal was to test three physical models—the 1-thread model, the 3-thread model, and the Gierke model—using the datasets as found in the scientific literature. Resistance measurements in most publications are limited to about 5 data points, which is far too few for models with 4 parameters. By limiting ourselves to only datasets with a larger number of data points, it was possible to investigate also the 4 parameter models, and we concluded that the Gierke model is an improvement of the 1-thread model in contrast to the 3-thread model.
We tested also three phenomenological models: an exponential model, a power model, and mixed model. The power model turned out to be very poor, while the exponential model performed better; however, the best fits were achieved with the mixed model, although these were not better than those of the Gierke model.
Funding

This research received no external funding.

Acknowledgments

This work was facilitated by REDstack BV in the Netherlands. REDstack BV aims to develop and market RED technology. RED (Reverse ElectroDialysis) is a form of sustainable energy production. The author would like to thank Dr. Svetlozar Velizarov from the University of Lisbon, the members of the research theme ‘Blue Energy’ from the European centre of excellence for sustainable water technology Wetsus, as well as his colleagues from the REDstack company for the fruitful discussions.

Conflicts of Interest

The author declares no conflict of interest

Nomenclature

Roman
agel contribution of the membrane area resistance (Ω∙cm2)
bsolution contribution of the membrane area resistance (Ω∙cm2∙mol/L)
c, dfit parameters for the 3-thread model and for the Gierke model
Cconcentration (mol/L)
FFaraday constant (96 485 C∙mol−1)
nnumber of involved charges
Rgas constant (8.32432 J∙mol−1K−1)
Rareaarea resistance (Ω∙cm2)
Rspecspecific resistance (Ω∙m)
p, q, rfit parameters for the three phenomenological models
Ttemperature (K)
Greek
δmembrane thickness (μm)
Kconductivity (µS/cm)
Acronyms
AEManion exchange membrane
CEMcation exchange membrane
CFPcombination flow paths
GFPgel flow paths
IEMion exchange membrane
SFPsolution flow paths

References

  1. Galama, A.H.; Vermaas, D.A.; Veerman, J.; Saakes, M.; Rijnaart, H.H.M.; Post, J.W.; Nijmeijer, K. Membrane resistance: The effect of salinity gradients over a cation exchange membrane. J. Membr. Sci. 2014, 467, 279–291. [Google Scholar] [CrossRef]
  2. Długołęcki, P.; Anet, B.; Metz, S.J.; Nijmeijer, K.; Wessling, M. Transport limitations in ion exchange membranes at low salt concentrations. J. Membr. Sci. 2010, 346, 163–171. [Google Scholar] [CrossRef]
  3. Urano, K.; Masaki, Y.; Kawabata, M. Electric resistances of ion-exchange membranes in dilute solutions. Desalination 1986, 28, 171–176. [Google Scholar] [CrossRef]
  4. Geise, G.M.; Curtis, A.J.; Hatzell, M.C.; Hickner, M.A.; Logan, B.E. Salt concentration differences alter membrane resistance in reverse electrodialysis stacks. Environ. Sci. Technol. Lett. 2014, 1, 36–39. [Google Scholar] [CrossRef]
  5. Le, X.T.; Bui, T.H.; Viel, P.; Berthelot, T.; Palacin, S. On the structure–properties relationship of the AMV anion exchange membrane. J. Membr. Sci. 2009, 340, 133–140. [Google Scholar] [CrossRef]
  6. Berezina, N.P.; Kononenko, N.A.; Dyomina, O.A.; Gnusin, N.P. Characterization of ion-exchange membrane materials: Properties vs structure. Adv. Colloid Interface Sci. 2008, 139, 3–28. [Google Scholar] [CrossRef]
  7. Badessa, T.S.; Shaposhnik, V.A. The dependence of electrical conductivity of ion exchange membranes on the charge of counter ions. Condens. Matter Interphases 2014, 16, 129–133. [Google Scholar]
  8. Elattar, A.; Elmidaoui, A.; Pismenskaia, N.; Gavach, C.; Pourcelly, G. Comparison of transport properties of monovalent anions through anion-exchange membranes. J. Membr. Sci. 1998, 143, 249–261. [Google Scholar] [CrossRef]
  9. Pismenskaya, N.D.; Belova, E.I.; Nikonenko, V.V.; Larchet, C. Electrical conductivity of cation- and anion-exchange membranes in ampholyte solutions. Russ. J. Electrochem. 2008, 44, 1285–1291. [Google Scholar] [CrossRef]
  10. Demina, O.A.; Berezina, N.P.; Sata, T.; Demin, A.V. Transport–structural parameters of domestic and foreign anion-exchange membranes. Russ. J. Electrochem. 2002, 38, 896–902. [Google Scholar] [CrossRef]
  11. Mir, F.Q.; Shukla, A. Sharp rise in resistance of ion exchange membranes in low concentration NaCl solution. J. Taiwan Inst. Chem. Eng. 2017, 72, 134–141. [Google Scholar] [CrossRef]
  12. Karpenko-Jereb, L.V.; Berezina, N.P. Determination of structural, selective, electrokinetic and percolation characteristics of ion-exchange membranes from conductive data. Desalination 2009, 245, 587–596. [Google Scholar] [CrossRef]
  13. Zhang, B.; Hong, J.G.; Xie, S.; Xia, S.; Chen, Y. An integrative modeling and experimental study on the ionic resistance of ion-exchange membranes. J. Membr. Sci. 2017, 524, 362–369. [Google Scholar] [CrossRef] [Green Version]
  14. Gnusin, N.P.; Berezina, N.P.; Kononenko, N.A.; Dyomina, O.A. Transport structural parameters to characterize ion exchange membranes. J. Membr. Sci. 2004, 243, 301–310. [Google Scholar] [CrossRef]
  15. Nouri, S.; Dammak, L.; Bulvestre, G.; Auclair, B. Comparison of three methods for the determination of the electrical conductivity of ion-exchange polymers. Eur. Polym. J. 2002, 38, 1907–1913. [Google Scholar] [CrossRef]
  16. Tuan, L.X.; Bues-Herman, C. Study of water content and microheterogeneity of CMS cation exchange membrane. Chem. Phys. Lett. 2007, 434, 49–55. [Google Scholar] [CrossRef]
  17. Belaid, N.N.; Ngom, B.; Dammak, L.; Larchet, C.; Auclair, B. Conductivité membranaire - interprétation et exploitation selon le modèle à solution interstitielle hétérogène. Eur. Polym. J. 1999, 35, 879–897. [Google Scholar] [CrossRef]
  18. Lteif, R.; Dammak, L.; Larchet, C.; Auclair, B. Conductivité électrique membranaire: Étude de l’effet de la concentration, de la nature de l’électrolyte et de la structure membranaire. Eur. Polym. J. 1999, 35, 1187–1195. [Google Scholar] [CrossRef]
  19. Falina, I.V.; Demina, O.A.; Kononenko, N.A.; Annikova, L.A. Influence of inert components on the formation of conducting channels in ion-exchange membranes. J. Solid State Electrochem. 2017, 21, 767–775. [Google Scholar] [CrossRef]
  20. Galama, A.H.; Hoog, N.A.; Yntema, D.R. Method for determining ion exchange membrane resistance for electrodialysis systems. Desalination 2016, 380, 1–11. [Google Scholar] [CrossRef]
  21. Kamcev, J.; Sujanani, R.; Jang, E.-S.; Yan, N.; Moe, N.; Paul, D.R.; Freeman, B.D. Salt concentration dependence of ionic conductivity in ion exchange membranes. J. Membr. Sci. 2018, 547, 123–133. [Google Scholar] [CrossRef]
  22. Karpenko, L.V.; Demina, O.A.; Dvorkina, G.A.; Parshikov, S.B.; Larchet, C.; Auclair, B.; Berezina, N.P. Comparative study of methods used for the determination of electroconductivity of ion-exchange membranes. Russ. J. Electrochem. 2001, 37, 287–293. [Google Scholar] [CrossRef]
  23. Zhu, S.; Kingsbury, R.S.; Douglas, F.C.; Coronell, O. Impact of solution composition on the resistance of ion exchange membranes. J. Membr. Sci. 2018, 554, 39–47. [Google Scholar] [CrossRef]
  24. Stenina, I.A.; Sistat, P.; Rebrov, A.I.; Pourcelly, G.; Yarolavtsev, A.B. Ion mobility in Nafion-117 membranes. Desalination 2004, 170, 49–57. [Google Scholar] [CrossRef]
  25. Gnusin, N.; Demina, O.; Berezina, N.; Kononenko, N. Modeling of mass electrotransfer in terms of the transport and structural properties of ion-exchange membranes. Theor. Found. Chem. Eng. 2004, 38, 394–398. [Google Scholar] [CrossRef]
  26. Demina, O.; Kononenko, N.; Falina, I. A new approach to the characterization of ion-exchange membranes using a set of model parameters. Pet. Chem. 2014, 54, 515–525. [Google Scholar] [CrossRef]
  27. Sarapulova, V.; Nevakshenova, E.; Pismenskaya, N.; Dammak, L.; Nikonenko, V. Unusual concentration dependence of ion-exchange membrane conductivity in ampholyte-containing solutions. J. Membr. Sci. 2015, 479, 28–38. [Google Scholar] [CrossRef]
  28. Subrahmanyan, V.; Lakshminarayanaiah, N. A rapid method for determination of electrical conductance of ion-exchange membranes. J. Phys. Chem. 1968, 72, 4314–4315. [Google Scholar] [CrossRef]
  29. Lee, H.-J.; Hong, M.-K.; Han, S.-D.; Moon, S.-H. Influence of the heterogeneous structure on the electrochemical properties of anion exchange membranes. J. Membr. Sci. 2008, 320, 549–555. [Google Scholar] [CrossRef]
  30. Pismenskaya, N.; Nikonenko, V.; Volodina, E.; Pourcelly, G. Electrotransport of weak-acid anions through anion-exchange membranes. Desalination 2002, 147, 345–350. [Google Scholar] [CrossRef]
  31. Ramp, F.L. A method of characterization ion-exchange membranes by conductance measurements. Desalination 1975, 16, 321–329. [Google Scholar] [CrossRef]
  32. Sarapulova, V.; Shkorkina, I.; Mareev, S.; Pismenskaya, N.; Kononenko, N.; Larchet, C.; Dammak, L.; Nikonenko, V. Transport characteristics of fujifilm ion-exchange membranes as compared to homogeneous membranes AMX and CMX and to heterogeneous membranes MK-40 and MA-41. Membranes 2019, 9, 84. [Google Scholar] [CrossRef] [PubMed] [Green Version]
  33. Sarapulova, V.V.; Titorova, V.D.; Nikonenko, V.V.; Pismenskaya, N.D. Transport characteristics of homogeneous and heterogeneous ion-exchange membranes in sodium chloride, calcium chloride, and sodium sulfate solutions. Membr. Membr. Technol. 2019, 1, 168–182. [Google Scholar] [CrossRef]
  34. Berezina, N.P.; Timofeev, S.V.; Kononenko, N.A. Effect of conditioning techniques of perfluorinated sulphocationic membranes on their hydrophylic and electrotransport properties. J. Membr. Sci. 2002, 209, 509–518. [Google Scholar] [CrossRef]
  35. Gómez-Coma, L.; Ortiz-Martínez, V.M.; Carmona, J.; Palacio, L.; Prádanos, P.; Fallanza, M.; Ortiz, A.; Ibañez, R.; Ortiz, I. Modeling the influence of divalent ions on membrane resistance and electric power in reverse electrodialysis. J. Membr. Sci. 2019, 592. [Google Scholar] [CrossRef]
  36. Winger, A.G.; Bodamer, G.W.; Kunin, R. Some electrochemical properties of new synthetic ion exchange membranes. J. Electrochem. Soc. 1953, 100, 178–184. [Google Scholar] [CrossRef]
  37. Fontananova, E.; Messana, D.; Tufa, R.A.; Nicotera, I.; Kosma, V.; Curcio, E.; van Baak, W.; Drioli, E.; di Profio, G. Effect of solution concentration and composition on the electrochemical properties of ion exchange membranes for energy conversion. J. Power Sources 2017, 340, 282–293. [Google Scholar] [CrossRef]
  38. Kneifel, K.; Hattenbach, K. Properties and long-term behavior of ion exchange membranes. Desalination 1980, 34, 77–95. [Google Scholar] [CrossRef]
  39. Vyas, P.V.; Ray, P.; Rangarajan, R.; Adhikary, S.K. Electrical conductance of heterogeneous cation-exchange membranes in electrolyte solutions. J. Phys. Chem. B 2002, 106, 11913. [Google Scholar] [CrossRef]
  40. Zabolotsky, V.I.; Nikonenko, V.V. Effect of structural membrane inhomogeneity on transport properties. J. Membr. Sci. 1993, 79, 181–198. [Google Scholar] [CrossRef]
  41. Veerman, J. Reverse Electrodialysis–Design and Optimization by Modeling and Experimentation; Rijksuniversiteit Groningen: Groningen, The Netherlands, 2010. [Google Scholar]
  42. Veerman, J.; Vermaas, D.A. Reverse electrodialysis: Fundamentals. In Sustainable Energy from Salinity Gradients; Cipollina, A., Micale, G., Eds.; Woodhead Publishing: Cambridge, UK, 2016; Chapter 4. [Google Scholar] [CrossRef]
  43. Cipollina, A.; Micale, G.; Tamburini, A.; Tedesco, M.; Gurreri, L.; Veerman, J.; Grasman, S. Reverse electrodialysis: Applications. In Sustainable Energy from Salinity Gradients; Cipollina, A., Micale, G., Eds.; Woodhead Publishing: Cambridge, UK, 2016; Chapter 5. [Google Scholar] [CrossRef]
  44. Veerman, J.; Kunteng, D. Inorganic pseudo ion exchange membranes–Concepts and preliminary experiments. Appl. Sci. 2018, 8, 2142. [Google Scholar] [CrossRef] [Green Version]
  45. Długołęcki, P.; Ogonowski, P.; Metz, S.J.; Nijmeijer, K.; Wessling, M. On the resistances of membrane, diffusion boundary layer and double layer in ion exchange membrane transport. J. Membr. Sci. 2010, 349, 369–379. [Google Scholar] [CrossRef]
  46. Barragán, V.M.; Ruíz-Bauzá, C. Current–Voltage curves for ion-exchange membranes: A method for determining the limiting current density. J. Colloid Interface Sci. 1998, 205, 365–373. [Google Scholar] [CrossRef] [PubMed]
  47. Cappadonia, M.; Erning, J.W.; Niaki, S.M.S.; Stimming, U. Conductance of Nafion 117 membranes as a function of temperature and water content. Solid State Ion. 1995, 77, 65–69. [Google Scholar] [CrossRef]
  48. Kopitzke, R.W.; Linkous, C.A.; Anderson, H.R.; Nelson, G.L. Conductivity and water uptake of aromatic–based proton exchange membrane electrolytes. J. Electrochem. Soc. 2000, 147, 1677. [Google Scholar] [CrossRef]
  49. Izquierdo-Gil, M.A.; Barragán, V.M.; Villaluenga, J.P.G.; Godino, M.P. Water uptake and salt transport through Nafion cation-exchange membranes with different thicknesses. Chem. Eng. Sci. 2012, 72, 1–9. [Google Scholar] [CrossRef]
  50. Vermaas, D.A.; Veerman, J.; Saakes, M.; Nijmeijer, K. Influence of multivalent ions on renewable energy generation in reverse electrodialysis. Energy Environ. Sci. 2014, 7, 1434–1445. [Google Scholar] [CrossRef] [Green Version]
  51. Veerman, J.; Saakes, M.; Metz, S.J.; Harmsen, G.J. Reverse electrodialysis: Performance of a stack with 50 cells on the mixing of sea and river water. J. Membr. Sci. 2009, 327, 136–144. [Google Scholar] [CrossRef] [Green Version]
  52. Gnusin, N.P.; Grebenyuk, V.D.; Pevnitskaya, M.V. Electrochemistry of Ion-Exchangers; Naukova Dumka: Kiev, Ukraine, 1972. [Google Scholar]
  53. Gierke, T.D.; Munn, G.E.; Wilson, F.C. The morphology in Nafion perfluorinated membrane products, as determined by wide- and small-angle x-ray studies. J. Polym. Sci. B 2003, 24, 1767–1782. [Google Scholar] [CrossRef]
  54. Available online: http://myweb.wit.edu/sandinic/Research/conductivity%20v%20concentration.pdf (accessed on 14 February 2020).
  55. Kamcev, J.; Paul, D.R.; Manning, G.S.; Freeman, B.D. Ion diffusion coefficients in ion exchange membranes–Significance of counterion condensation. Macromolecules 2018, 51, 5519–5529. [Google Scholar] [CrossRef]
  56. Tufa, R.A.; Pawlowski, S.; Veerman, J.; Bouzek, K.; Fontananova, E.; di Profio, G.; Velizarov, S.; Crespo, J.G.; Nijmeijer, K.; Curcio, E.; et al. Progress and prospects in reverse electrodialysis for salinity gradient energy conversion and storage. Appl. Energy 2018, 225, 290–331. [Google Scholar] [CrossRef]
  57. Cooper, L. Oxidation-reduction potential in sea water. J. Mar. Biol. Assoc. UK 1937, 22, 167–176. [Google Scholar] [CrossRef] [Green Version]
  58. Silva, R.F.; de Francesco, M.; Pozio, A. Tangential and normal conductivities of Nafion membranes used in polymer electrolyte fuel cells. J. Power Sources 2004, 134, 18–26. [Google Scholar] [CrossRef]
  59. Gardner, C.I.; Anantaraman, A.V. Studies on ion-exchange membranes. II. Measurement of the anisotropic conductance of Nafion. J. Electroanal. Chem. 1998, 449, 209–214. [Google Scholar] [CrossRef]
  60. Sedkaoui, Y.; Szymczyk, A.; Lounici, H.; Arous, O. A new lateral method for characterizing the electrical conductivity of ion-exchange membranes. J. Membr. Sci. 2016, 507, 34–42. [Google Scholar] [CrossRef]
  61. Scribner Associates, Inc. Effect of Solution Conductivity on In-Plane Membrane Conductivity Measurement. Available online: http://www.scribner.com (accessed on 14 February 2020).
  62. Lindheimer, A.; Molenat, J.; Gavach, C. A study of the superselectivity of Nafion perfluorosulfonic membranes. J. Electroanal. Chem. 1987, 216, 71–88. [Google Scholar] [CrossRef]
  63. Available online: www.r-tutor.com/elementary-statistics/multiple-linear-regression/adjusted-coefficient-determination (accessed on 11 February 2019).
Figure 1. (a) An ion exchange membrane with four different phases: reinforcement (black), non-conducting polymer (gray), gel (yellow), and solution phase (blue). Some flow paths of the ionic current are shown: combination flow paths (CFP1 and CFP2), gel phase flow path (GFP1 and GFP2) as well as solution flow paths (SFP1 and SFP2). (b) The model after rearranging the different phases. (c) A simplification of the rearranged model called a ‘3-thread model’. (d) Electrotechnical representation of the 3-thread model (further called ‘model Y’). (e) Ultimate simplification of the 3-thread model: the 1-thread model (or ‘model X’). (f) Gierke model with solution-filled gel vesicles. (g) Representation of the Gierke model (or ‘model Z’).
Energies 13 01946 g001
Figure 2. Conductivity of NaCl solutions with regression line forced through the origin; data from [54].
Energies 13 01946 g002
Figure 3. Effect of the bulk concentration and the charge density (f) on the excess percentage.
Energies 13 01946 g003
Figure 4. The models X (one thread), Y (three thread), and Z (Gierke).
Energies 13 01946 g004
Figure 5. Resistance as a function of the bulk NaCl concentration for CMX (a), AMX (b), MK-40 (c), MA-41 (d), and Nafion-117 (e). The code for the measurement cell (A, B... F) and the source are listed in the legend box. Lines are added to aid visual interpretation; dashed lines in the CMX and AMX plots (─ ─ ● ─ ─) indicate experiments with a short dip of the membrane in a 5 M NaCl solution before the resistance measurement [21]. Most experiments are performed with AC and indicated (──●──); experiments with DC are indicated by (Δ).
Energies 13 01946 g005aEnergies 13 01946 g005bEnergies 13 01946 g005c
Figure 6. Values of parameters a/δ (blue crosses) and b/δ (red dots) specified for the different measuring methods (A, B… F). The parameters a and b are divided by the membrane thickness δ to express the material properties of the membrane material. To prevent overlap of the data points, X-values are slightly offset on the X-axis. Values below 0.0001 or above 10 are offset to the borders of the graph. The horizontal lines indicate the median value for each data cluster, while the boxes indicate the lower and upper quartiles.
Energies 13 01946 g006
Figure 7. Specific resistance at 0.5 mol/L (red dots) and 0.005 mol/L (blue crosses) as calculated with the 1-thread model, specified for the different measuring methods (A, B…F). To prevent overlap of the data points, X-values are slightly offset on the X-axis. The horizontal lines indicate the median value for each data cluster, while the boxes indicate the lower and upper quartiles.
Energies 13 01946 g007
Figure 8. Fit of model X (one thread model) for a CMX membrane. (a) Resistance vs. concentration, (b) Conductivity vs. concentration. Experimental data from [1].
Energies 13 01946 g008
Figure 9. Fitted values for the contribution of a/õ (for the gel) and b/õ (for the solution) to the area resistance R = a + b/C. Different types of membranes are indicated in the legend: heterogeneous (He), homogeneous (Ho), and perfluoridated (PF) structures with anion exchange (AEM) or cation exchange (CEM) functionality. Yellow filled symbols indicate DC measurement; others are AC measured.
Energies 13 01946 g009
Figure 10. Mean coefficients of determination (R2) for the different models. Started with 145 datasets (some containing only 3 data points) until only 3 datasets remained (each with 15 data points).
Energies 13 01946 g010
Figure 11. Mean adjusted coefficients of determination (R2adj) for the different models. Started with 145 datasets (some containing only 3 data points) until only 3 datasets remained (each with 15 data points).
Energies 13 01946 g011
Table 1. R2 of the fit K = a∙C as function of maximum concentration.
Max. Conc. (mol/L)R2
3.40.9809
1.70.9955
0.80.9991
0.50.9988
Table 2. Used models.
ModelEquation Parameters
X (1 thread) R = a + b/C2
Y (3 thread)R = (a+b/C)||d||e/C *)4
Z (Gierke)R = a + b/C + d||e/C *)4
Exp (exponential)R = p + q∙exp(-r∙C)3
Pw (power)R = p + q∙C^(-r)3
Mix (mixed)R = p + q∙C + r/C3
*) x||y ≡ (x−1 + y−1) −1.
Table 3. Used measuring cells.
Nr/
Code
Description Membrane
in Contact With
Used by
0/NNot specified[36]
1/ASix-compartment cell, with inert generating electrodes. Voltage measured with Ag/AgCl reference electrodes or with Pt/Ir electrodesH2O[1,2,15,20]
2/BFour-compartment cell with inert generating electrodes. Voltage is measured with reference electrodesH2O[3,23]
3/CTwo-compartment cell with inert generating electrodes. Voltage is measured with reference electrodesH2O[4,11,13]
4/DTwo-compartment cell with two electrodes (e.g., clip cell) H2O[8,9,17,18,21,22,27,29,30,32,33]
5/ESolid metal or carbon contact cell Metal/C[7,9,21]
6/FMercury contact cellHg[5,6,10,12,14,15,16,19,22,24,25,26,28,34,35]
Table 4. Acquired datasets from the literature. AEM: anion exchange membranes, CEM: cation exchange membranes.
TypeManufacturerReferences
H o m o g e n e o u s A E M
204-SZRAIonics [29]
ACH-45TNeosepta[3]
ACMNeosepta[8]
ACSNeosepta[8]
AFNNeosepta[8]
AM-1Neosepta[6,10,25]
AMVSelemion[3,5,11,12]
AMXNeosepta[2,8,9,10,11,20,21,22,23,27,29,32,33]
AMX-SBAstom[27]
AR-103GE Power and Water[21]
ASVSelemion[3]
AXAstom[27]
FADFumasep[2]
FASFumasep[13,35]
FKDFumasep[2]
Fuji-AEM-1Fujifilm[32]
Fuji-AEM-XFujifilm[32]
Fuji-AEM-2Fujifilm[32]
H o m o g e n e o u s C E M
CL-25TNeosepta[12,14]
CM-1Neosepta[6,12,15,17,18,22,25]
CM-2Neosepta[12,15,17,18]
CMSNeosepta[16]
CMVSelemion[3,4,11,12]
CMXNeosepta[1,2,9,11,12,18,20,21,22,23,27,32,33]
CR-61GE Power and Water[21]
FKSFuma[13,35]
Fuji-CEM-1Fujifilm[32]
Fuji-CEM-XFujifilm[32]
Fuji-CEM-2Fujifilm[32]
MF-4SK-101ONPO Plastpolymer[22]
MF-4SK-2**home-made[19]
sPPOhome-made[13]
SPS-2home-made[14]
AMF-C103Asahi[28]
Fuji-CEMFuji[30]
H e t e r o g e n e o u s A E M
3362-BWShanghai[10]
AR-204-SZRA-412Ionics[25]
HJAHaji, Korea[29]
LNALin’an, China [29]
MA-40Shchekinoazot[10,30,32]
MA-41
Amberplex A-1
Shchekinoazot, Plastmassy, home-made [7,9,10,25,30,32,33]
Room and Haas[36]
H e t e r o g e n e o u s C E M
CR-67-HMR-412Ionics[25]
CRPRhône Poulenc[17,18]
MK-40Shchekinoazot, Plastmassy, home-made[7,9,12,14,18,22,25,26,32,33]
SPEEK-1home-made[14]
Ionac MC3470Sybron Chem. Co.[31]
Amberplex C-1Room and Haas[36]
P e r f l u o r i n a t e d C E M
MF-4SC/MF-4SKhome-made, Plastmassy, Plastpolymer[12,14,19,22,26]
Nafion-115Dupont de Nemours[34]
Nafion-117Dupont de Nemours[6,12,14,15,18,19,24,34]
Nafion-125Dupont de Nemours[17]
Nafion-324Dupont de Nemours[17,18]
Nafion-425Dupont de Nemours[6,19]
Table 5. Corrected solution contribution b/δ from experiments by Nouri et al. [15].
Corrected Solution Contribution b/δ
MembraneSystem ASystem BSystem C
CM-10.5620.0330
CM-20.8780.040
Nafion-1170.6170.010
All data0.3960.0610.019
Table 6. Results of the resistance and conductivity fit of the 1-thread model of a CMX membrane.
CoefficientGelSolutionRarea at 0.5 mol/L
of determinationphasephasecalculated
R2abwith model X
(-)(Ω∙cm2)(Ω∙cm2∙mol∙L−1)(Ω∙cm2)
Resistance0.99982.6730.3113.295
Conductivity 0.98792.790.2643.318
Table 7. Comparison of R2 values of two regression methods. Listed are numbers and percentages for which the coefficient of determination (R2) of the resistance plot was higher than the R2 of the conductivity plot. The last row indicates the p-value of the sign test.
ModelXYZEPM
Name1-thread3-threadGierkeExponentialPowerMixed
higher R2 with R-fit (score) 978090859081
higher R2 with R-fit (%)675562596256
p-value0.000030.1220.0020.0230.0020.092
Table 8. Mean values of the parameters a/δ, b/δ, and their ratio for direct current (DC) and alternating current (AC) measurement and for the whole set.
a / δ ¯ b / δ ¯ ( a / δ ¯ ) / ( b / δ ¯ )
DC 1.390.3523.95
AC2.130.0610.061
DC + AC2.000.1110.111
Table 9. Results of fitting the six membrane models using all datasets.
Mean Values of R2 and R2adj
ModelXYZExpPwMix
Name1-thread3-threadGierkeExponentialPowerMixed
Parameters244333
R2 adj
R-fit0.65690.17920.33900.54460.60080.6617
Κ-fit 0.63900.12880.27530.43250.41780.4885
R2
R-fit0.82060.85310.92100.85290.89000.9163
Κ-fit0.80520.84050.89790.88950.88670.9162
Table 10. Results of fitting with restricted numbers of datasets.
MinimumNumber%Mean Values of R2 with R-fitMean values of R2adj with R-fit
Points perofofXYZExpPowerMixXYZExpPwMix
DatasetDatasetsDatasets244333244333
31451000.82060.85310.92100.8529 0.89000.9163 0.6569 0.1792 0.33900.54460.6008 0.6617
4142980.81920.85200.92160.85510.88990.91450.67080.18300.34620.55610.63140.6757
5121830.81830.84730.92080.85380.88750.92130.70480.21480.40620.65260.71990.7930
681560.78130.80930.90660.81200.86110.91140.66440.30900.59500.60210.69840.8055
741280.77160.79340.95550.79280.86930.93340.67650.48570.89970.62490.76940.8883
824170.81110.82410.94650.81620.90340.91150.74920.65280.89630.70140.86170.8599
917120.81740.81760.94360.85260.88220.90810.76360.66360.89840.77450.83710.8600
101390.86180.86200.94950.92460.87110.93960.82510.76110.91360.89280.82720.9126
12860.95610.95620.97630.95290.85000.97220.94810.96350.96460.93900.80840.9634
13640.95550.95560.98240.94780.80530.97580.94790.93730.97480.93330.75180.9688
15530.95320.95330.98540.94200.77270.97750.94540.93460.07960.92610.71070.9714