1. Introduction
Distribution systems are normally regulated monopolies where the authority set electricity rates. In such a scenario, an electricity tariff system is a rate structure that aims to guarantee regulatory and economic aspects.
From a regulatory perspective, the methodology, employed criteria and procedures of the tariff system must be made public to ensure transparency [
1]. In this sense, the tariff systems must be as simple as possible to guarantee that each actor can understand the aim of the methodology and respond to the tariff system in a harmonic manner. Thus, simplicity is a very important feature in tariff systems, as seen in current practices [
2,
3].
From an economic perspective, tariff systems must simultaneously guarantee cost recovery and efficiency, which makes tariff design a difficult task. In terms of costs, the tariff systems must ensure that energy and network costs are recovered, as tariff systems are a regulated by the authority [
1]. In addition, a tariff system must send adequate economic signals both in the short and long term to improve the efficiency of the distribution system [
1].
Generally, regulatory and economic aspects of tariff systems are not consistent each other. For example, the best way of guaranteeing efficiency is to reflect marginal prices in the tariff system; however, marginal prices do not recover network costs and the marginal pricing theory is mathematically complex. On the other hand, one can define an average flat rate to ensure full recovery of costs. This approach would be the simplest, but it would be economically inefficient, as no responsiveness from demand would exist. Thus, there exists a trade-off between the tariff system principles [
1], which makes the problem difficult to solve. The fact that tariff systems depend on a multiplicity of factors is discussed in detail in [
4].
This need for simplicity has captured particular attention in the literature. In [
5], an experiment is conducted in Ireland to test consumer behaviour towards smart meters and time-of-use tariffs. The results suggest that consumers struggle to match their electricity usage to appropriate tariffs, and that a general aversion to more complex tariffs can lead to sub-optimal choices. Similarly, in [
6], an experiment on German consumers was conducted, obtaining similar findings. The results suggest that consumer reactions to dynamic tariffs are strongly related to the cognitive effort they make in order to understand the tariff system to estimating the bill amount. It concludes that it will be challenging to convince European consumers to select complex dynamic tariffs. In [
7], the consequences for the cost-reflectivity, predictability, and robustness of different types of network tariffs are investigated. The study finds that predictability (how accurately a customer can estimate the total bill from the understanding of the tariff system) is the central factor for the sustainability of a tariff system, even more important than cost reflectivity. Therefore, it can be seen that simplicity is a crucial aspect of a tariff system.
In their aim for simplicity, most tariff systems are based on a single charge that is proportional to the energy consumption, in addition to other fixed charges. These tariff systems are generally called volumetric [
8], as the cost of energy and network are represented in one single charge. As a volumetric tariff is the simplest way electricity can be priced, it is widely used in practice [
2,
3].
Although simple and widely used, volumetric tariffs are very limited in terms of guaranteeing recovery of the total regulated costs under the penetration of Distributed Generation (DG). In terms of determining volumetric tariffs, the authority intends to define a volumetric charge that covers the energy and network costs; the energy cost is by nature proportional to the amount of energy, and the network cost is determined by assuming a representative average power profile of customers to obtain an estimate of network usage. However, if a significant penetration of DG occurs, the amount of energy withdrawn from the grid will decrease, and the tariff collection may not be enough to cover total network costs. This problem is described in detail in [
9,
10,
11].
The definition of tariff systems for a harmonic integration of DG has captured particular attention in the literature, but most of the approaches are of a very complex nature, contrasting with the need for simplicity. In [
12], the behavior of photovoltaic DG respect to distribution tariffs is analyzed. In the analysis, three simple tariff mechanisms are considered, and the relationship between different DG technologies is analyzed using a game theory approach. Although representative of the collective behavior of distribution customers, the work proposes a very complex model that is difficult to extend to a tariff definition. In addition, the tariff mechanism that is presented is assumed volumetric, which does not guarantee cost recovery when a large DG penetration scenario is considered. Similarly, in [
13], the behavior of distributed storage systems respect to distribution tariffs is analyzed. Considering the particular case of Findland, this work discusses the benefits of a distribution customer with storage, and the benefits of the distribution system operator. Mainly associated with new domestic storage and smart meters, the study shows that the use of storage can be profitable for some cases where power-based distribution tariffs are considered. The analysis also assumes that the tariff structure does not change with the integration DG. A similar approach is presented in [
14], where the influence on the tariff structure is not considered.
Most approaches that consider, to some extent, recovery of regulated costs under the integration of DG are mathematically complex in the context of tariff systems. The work in [
15] deals with volumetric tariff limitations, but considers an optimization problem capturing the basic features of the problem in a very complex manner. The work proposes that distribution customers behave optimally, so tariff parameters are tuned iteratively until a set of parameters for the tariff are obtained, constrained to recovery of the total regulated cost. However, together with the complexity of the approach, a change in the conditions (an increment in DG penetration for example) requires a new run of the algorithm and a new set of parameters. In [
16], a Local Marginal Pricing (LMP) approach is extended to a tariff for the Nigerian case. As the focus is cost representativeness, the impact of a LMP formulation complexity on a distribution customer level did not capture particular attention. A similar approach is presented in [
17], where a more generalized optimization framework is presented. In [
18], the minimization costs of the customer is represented without considering recovery of the regulated cost. In [
19], a dynamic tariff system is proposed to incentive distribution customers to install photovoltaic (PV) DG and storage based on feed-in tariffs. In line with current practices that maintain design simplicity, the tariff system is based on fuzzy rules that represent physical constraints of the network and the objective of incentivizing PV and storage. Although the cost recovery of the PV and storage from the customer size is considered, the recovery of network cost is not represented, as the formulation focus is on feed in tariff definition. In [
20], a tariff structure for each day is calculated by formulating and solving a binary linear optimization problem, as well as [
21] that proposes an optimization framework to represent the tariff system in order to maximize social welfare. As it can be seen, the problem of tariff systems under the penetration of DG is clear, but the various approaches in the literature overlook the need for simplicity coming from the regulatory need of transparency and customer responsiveness.
This paper proposes a simple tariff system definition under the penetration of DG. The goal of the formulation is to consider the trade-off between simplicity, cost recovery, and efficiency by formulating a tariff system that guarantees recovery of the total regulated costs and incetivizes efficiency through prices with a simple mathematical formulation. A numerical example is presented in order to show the behavior of the proposed approach.
3. Formulation of the Tariff System
The tariff system will consider that there is an operating period for which cost recovery must be ensured. The operating period will be divided in N intervals in which prices will be defined. In order to simplify the notation, the fixed network charges, namely generation capacity, transmission, distribution, and others, will be represented by a unique cost per day . The energy cost will be represented by a constant price that represent a flat-price generation contract; the representation of more complex energy prices is left for future work. Then, the idea of the proposed formulation is to establish prices for injection and consumption for each operating period k that incetivize peak shaving.
The tariff system considers the following definitions:
N: number of equal time intervals within an operating period,
i∈: set of equal time intervals within an operating period,
k∈: set of customers,
CD: cost of the physical operation of the distribution grid ($/day),
πR: price of energy supplied by a generation company ($/kWh),
ER: energy supplied by a generation company (kWh/day),
: price of energy purchased from the grid in period k ($/kWh),
: price of energy sold to the grid in period k ($/kWh),
: energy purchased from the grid in period k by customer i (kWh), and
: energy sold to the grid in period k by customer i (kWh).
An initial concern of a tariff system is to guarantee cost recovery. Mathematically, the following necessary conditions can be formulated:
Note that this definition internalizes the cost of physical operation and energy into one single charge, similar to the idea of volumetric tariffs. Now, let
be the average of net demand (
) over a period of operation:
where
are, respectively, the total net energy consumed and injected.
Similarly, it can be seen that the total energy
consumed from customers is given by:
Thus, from (
3), a sufficient condition for (
1) to hold is:
Note that (
7) is a condition on each period
k, but requires information from all periods to compute
. This leads to an
ex-post definition of the tariff system because one needs to first know the behavior of customers’ energy demand and injections for the entire period to then obtain prices consistent with such choices of demand and injection. Assume that
and
are known for all
and
. In such a case, (
7) has no unique algebraic solution as one equation and two variables (
, and
) exist. Additional conditions are necessary to define a unique solution to (
7). One additional condition can be defined to incentivize peak shaving behavior as follows:
where
is a given non-negative scalar function. If
, then
, so the customer is incentivized to use storage for self consumption to avoid energy consumption from the grid. If
, then
, the customer is incentivized to consume from the grid taking advantage of a better price. The term
(
$/kWh) is intended to modulate/control the price differentiation effect. Thus, the tariff rule formed by (
7) and (
8) consists of a linear system as follows:
Note that system (
9) has a unique solution for all
that is,
. In this case, the prices of energy consumed and injected at instant
k, are given by:
If, for some k, , or , the pricing rule becomes indefinite. The condition for which occurs when generation matches demand, and demand from the distribution system is not needed. In that case, the distribution system cannot ensure regulated cost recovery, which is a general problem of distribution systems when a large penetration of DG occurs. This issue is complicated because it presents the situation when there is no need for energy from the transmission/generation system, and the distribution system is somehow self-sufficient. This topic is beyond the scope of this work, although the tariff system shows the problem from its underlying mathematical definition.
Note that the price determination in (
10) is simpler than state-of-the-art methods in terms of processing time and implementation. The tariff system in (
10) is based on a simple arithmetic operations of rational numbers. This is less computationally expensive than current approaches based on optimization [
16,
17,
18,
19,
20,
21], which are numerically implemented with iterative algorithms normally based on repetitive inverse matrix computations. In this sense, the proposed tariff system results in shorter processing time than those based on optimization programs. In addition, one can see that the proposed approach does not need real-time metering, as the tariff computation is ex-post. Note that expression (
10) requires the hour-by-hour power consumption of customers at the end of the tariff period, so there is no need for real-time metering. In fact, the proposed tariff system can be implemented with existing offline metering technologies, where the hour-by-hour reading can be manually obtained from the meter data-logger to then compute the prices and the total bill of customers. Then, the proposed tariff system is simple in terms of the metering infrastructure that is required to be implemented.
One limitation of the proposed tariff system is that optimization approaches represent welfare maximization explicitly, while the proposed approach represents economic efficiency through peak shaving. Optimization approaches represent welfare maximization as an explicit constraint that ensures both recovery of regulated costs and profit maximization of customers. The proposed formulation also ensures recovery of regulated costs, but do not guarantee profit maximization of customers; instead, the tariff system incentivizes peak shaving that leads to economic efficiency. However, the complexity of the optimization proposals is a limitation while considering the impact of customer understandability on the performance of a tariff system [
5,
6,
7]. A more accurate (but simple) representation of welfare maximization is left for future work.
4. Interpretation of the Tariff System
In the wholesale generation operation, market participants present offers of their energy generation/consumption, and an optimization program makes a decision on which participants are dispatch/serve; the objective of the optimization is to minimize the operating costs under the physical constraints of the electric system. This way, energy prices approach the real value of electricity, and competition is incentivized as prices, and dispatch/served quantities are known after offers are made explicit. Various authors have proposed to implement the same structure for modern distribution systems, encountering multiple implementation issues. The most critical complexity is the fact that distribution users must submit generation/consumption offers. This way, distribution tariff systems are meant to be simple, tending to volumetric rates that are easy to understand but with significant limitations in terms of representing the cost of electricity and that of the infrastructure to transport and distribute such electricity.
In the case of the proposed tariff system, prices are known after the operating period, depending on the behavior of the participants; however, the rule does not require customers to submit offers. Instead, customers have the option of not performing any action over their energy profile, or considering a more active role and respond to the tariff system incentives. On the other hand, the rule results in high prices for energy when demand is high respect to average demand, and otherwise, when demand is low. This way, a following-rule customer will tend to flatten out net demand, which tend to reduce long term costs in distribution systems. This way, the tariff system incentivizes efficiency through peak shaving, and guarantee cost recovery with an algebraic, closed-form mathematical formulation consistent with the requirements of regulatory simplicity.
5. Customer Model
In order to show the functioning of the proposed tariff system, a customer model will be presented. It is important to note that the customer model is developed with the objective of illustrating the functioning of the tariff system in a simple manner.
The customer model aims to resemble a simple logic behavior intending to reduce the electricity bill of the customer by managing an Energy Storage System (ESS) and in the presence of a Photovoltaic system (PV). The logic is simple: if the prices for energy consumption are high, the customer will tend to discharge the EES to reduce its energy consumption from the network. If the prices for energy consumption are low, the customer will tend to charge the ESS to take advantage of the low price to use the stored energy in periods of high prices. In order to represent this logic in a simple manner, a fuzzy logic controller is selected because of the similarity between the fuzzy rule structure and the logic described above. As the customer model is not the central contribution of the work, the development of the fuzzy controller will be simple and it will not represent more complex phenomena such as maximization of the collective profit of customers and retailers or the interaction between customers (which leads the problem to a game). Actual data of customers will be considered, but the intelligence of the fuzzy controller will be only representative of simple logic rules.
Since the tariff system is ex-post, the fuzzy controller will need a forecast of the period to be represented. The tariff system determines the prices after knowing the behavior of customers for the period under analysis, in order to make decisions based on simple logic rules, the fuzzy controller must have a forecast of the behavior of customers. In order to represent the forecast error, forecast error for PV and demand are obtained from the literature.
5.1. ESS Dynamics
A first element to be defined is the functioning of the ESS. Although numerous approaches define optimal battery charge/discharge policies, such policies are more focused on preserving the chemical life of batteries and other aspects related to operating concerns [
24]. The proposed model for storage is simple enough to capture the conservation of energy in a storage device as follows:
where
is the state of charge of the storage system of customer
i at period
k,
and
are the minimum and maximum storage capacity, respectively, and
is the amount of energy deployed by the storage system (if
, the storage system is charged from the grid).
Then, the energy balance of customer
i at period
k is
where
is the customer demand profile, and
is the output of the PV system.
5.2. Forecast Information Available to the Fuzzy Controller
The fuzzy representation of customers is assumed to have forecast information of solar generation (namely
) and of the demand profiles (namely
) of the system under analysis, so a forecast of the total power profile (namely
) is available in the absence of ESS actions for each period
k. Solar irradiance forecasting methods and implementations are widely known [
25], as well as forecasting methods for load [
26,
27]. Forecasting of load in the distribution level has also been treated in the literature [
28].
The forecast error for solar irradiance will be simulated with a Normalized Mean Absolute Error, NMAE%, of 1.5% (according to [
29], 1% < NMAE% < 2%). The forecast error for demand has a NMAE% of 0.87%, according to [
30]. Then, the fuzzy controller will have forecast information to make decisions on the use of the ESS.
5.3. Fuzzy Controller
This work proposes a set of fuzzy rules to represent customer behavior in response to the tariff system. A fuzzy controller [
31] may not be an optimal choice in light of other approaches [
32,
33], but a set of fuzzy rules was found to be simple enough to show some responsiveness of customers to the proposed tariff system.
As mentioned below, the fuzzy controller is assumed to have forecast information of solar generation (
) and of the demand profiles (namely
). Then, a forecast of prices (namely
) and
) can be constructed by considering the values of
,
, and
by using (
10).
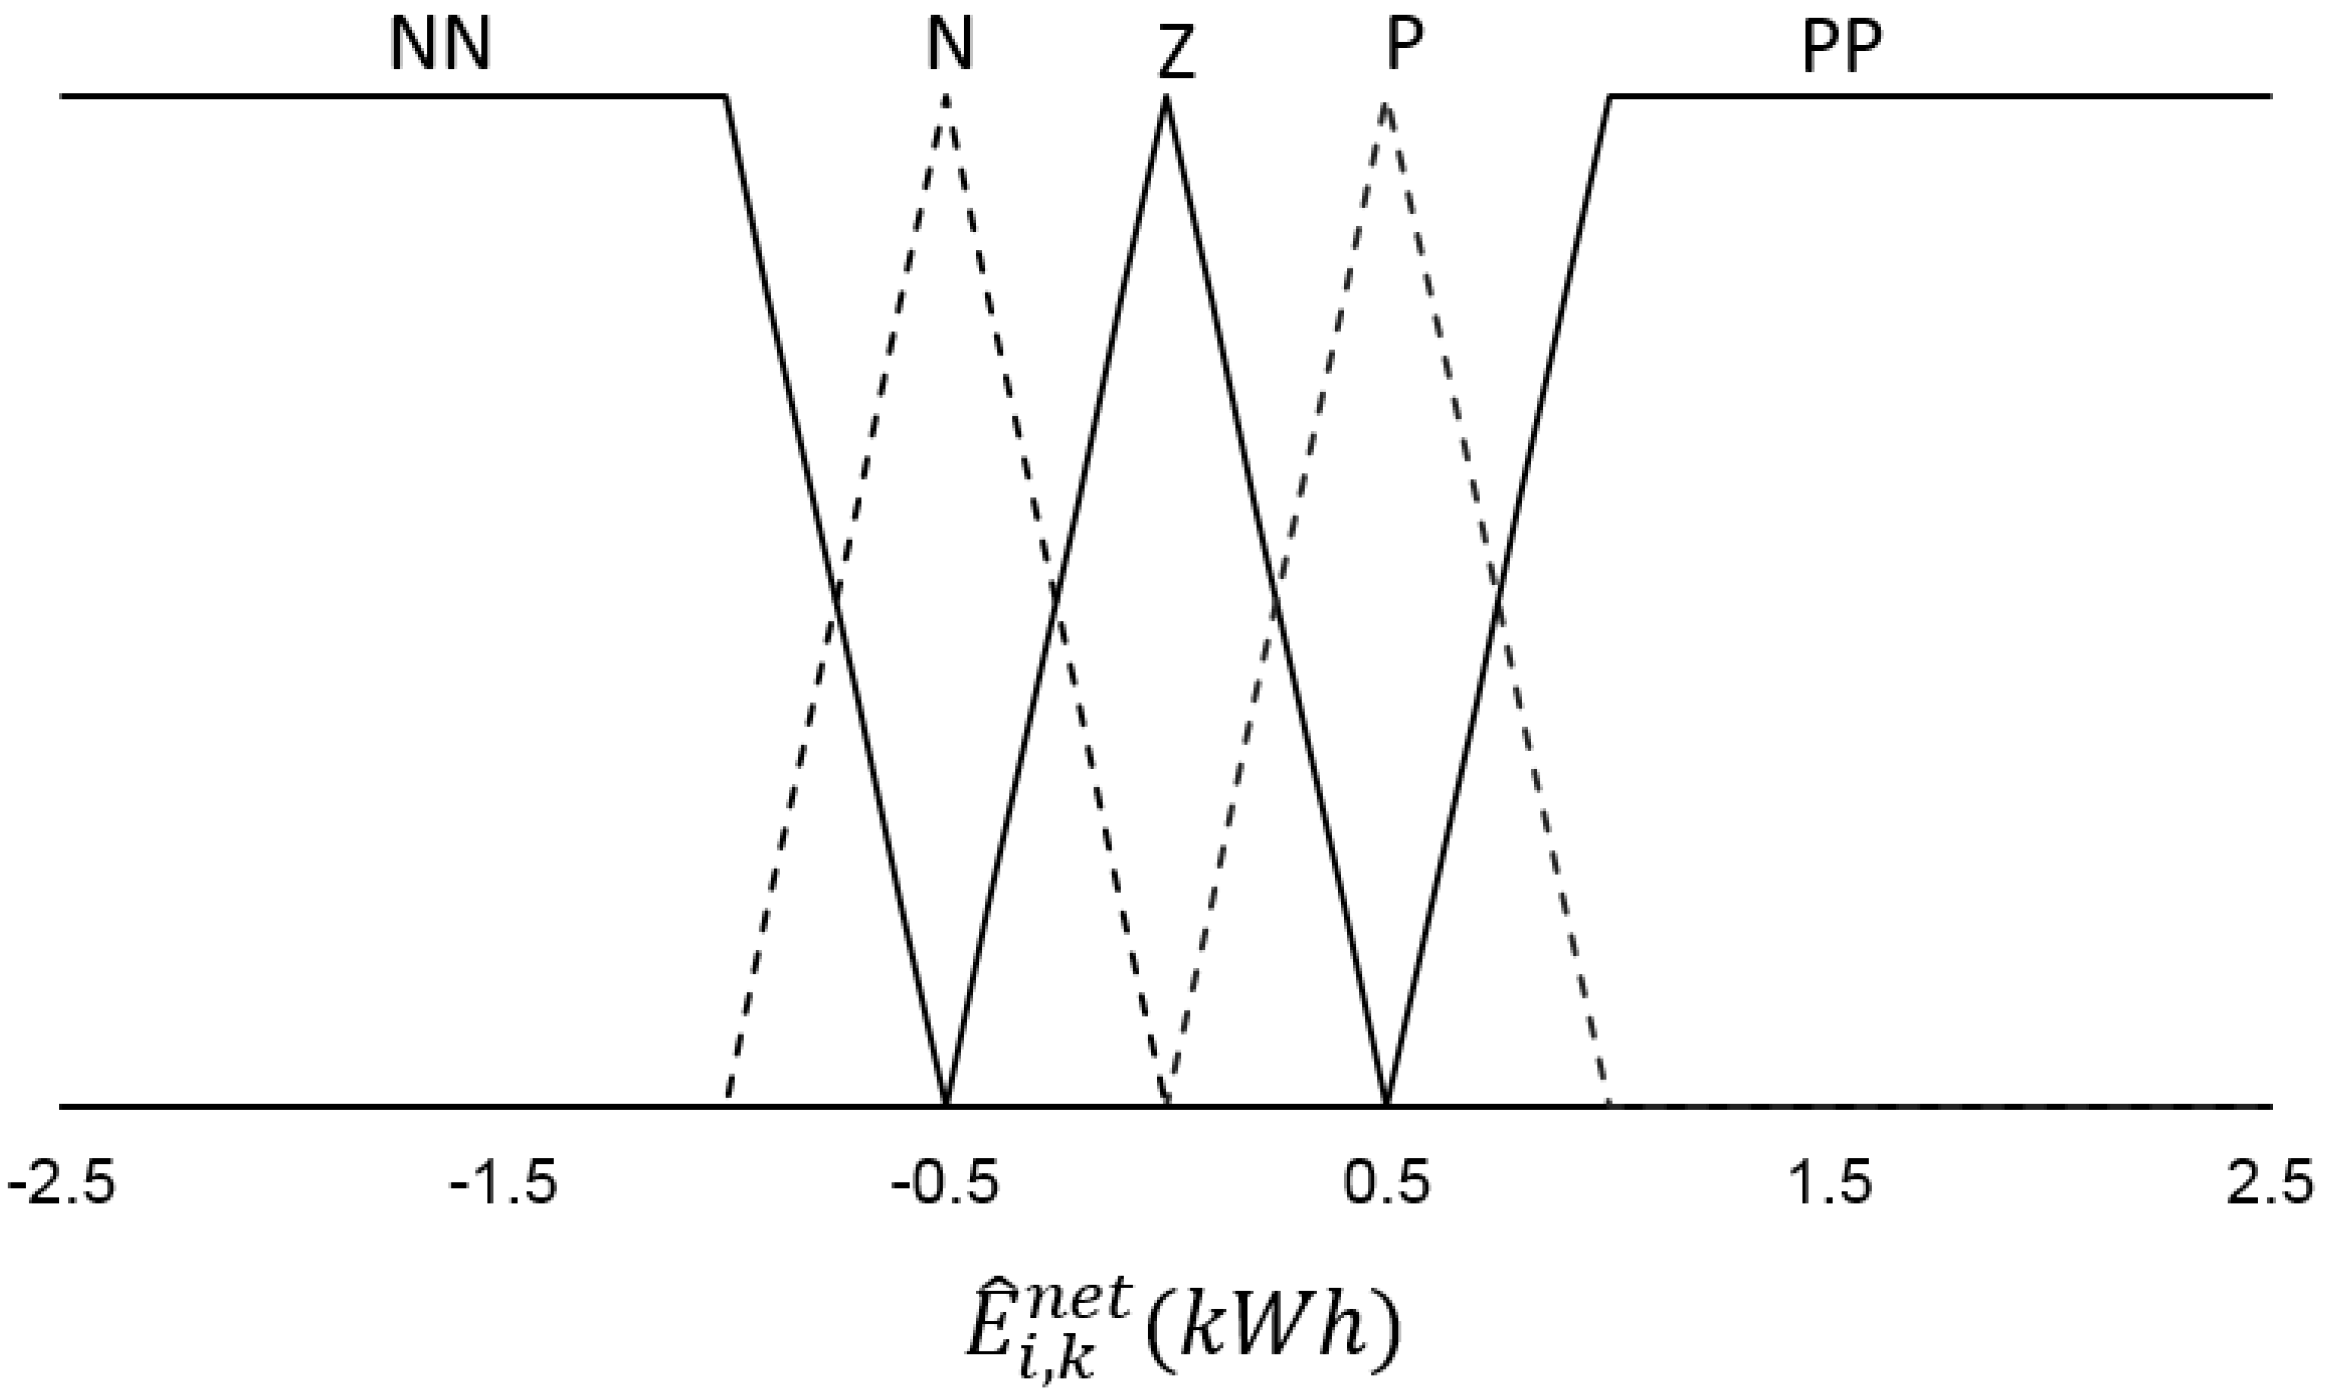
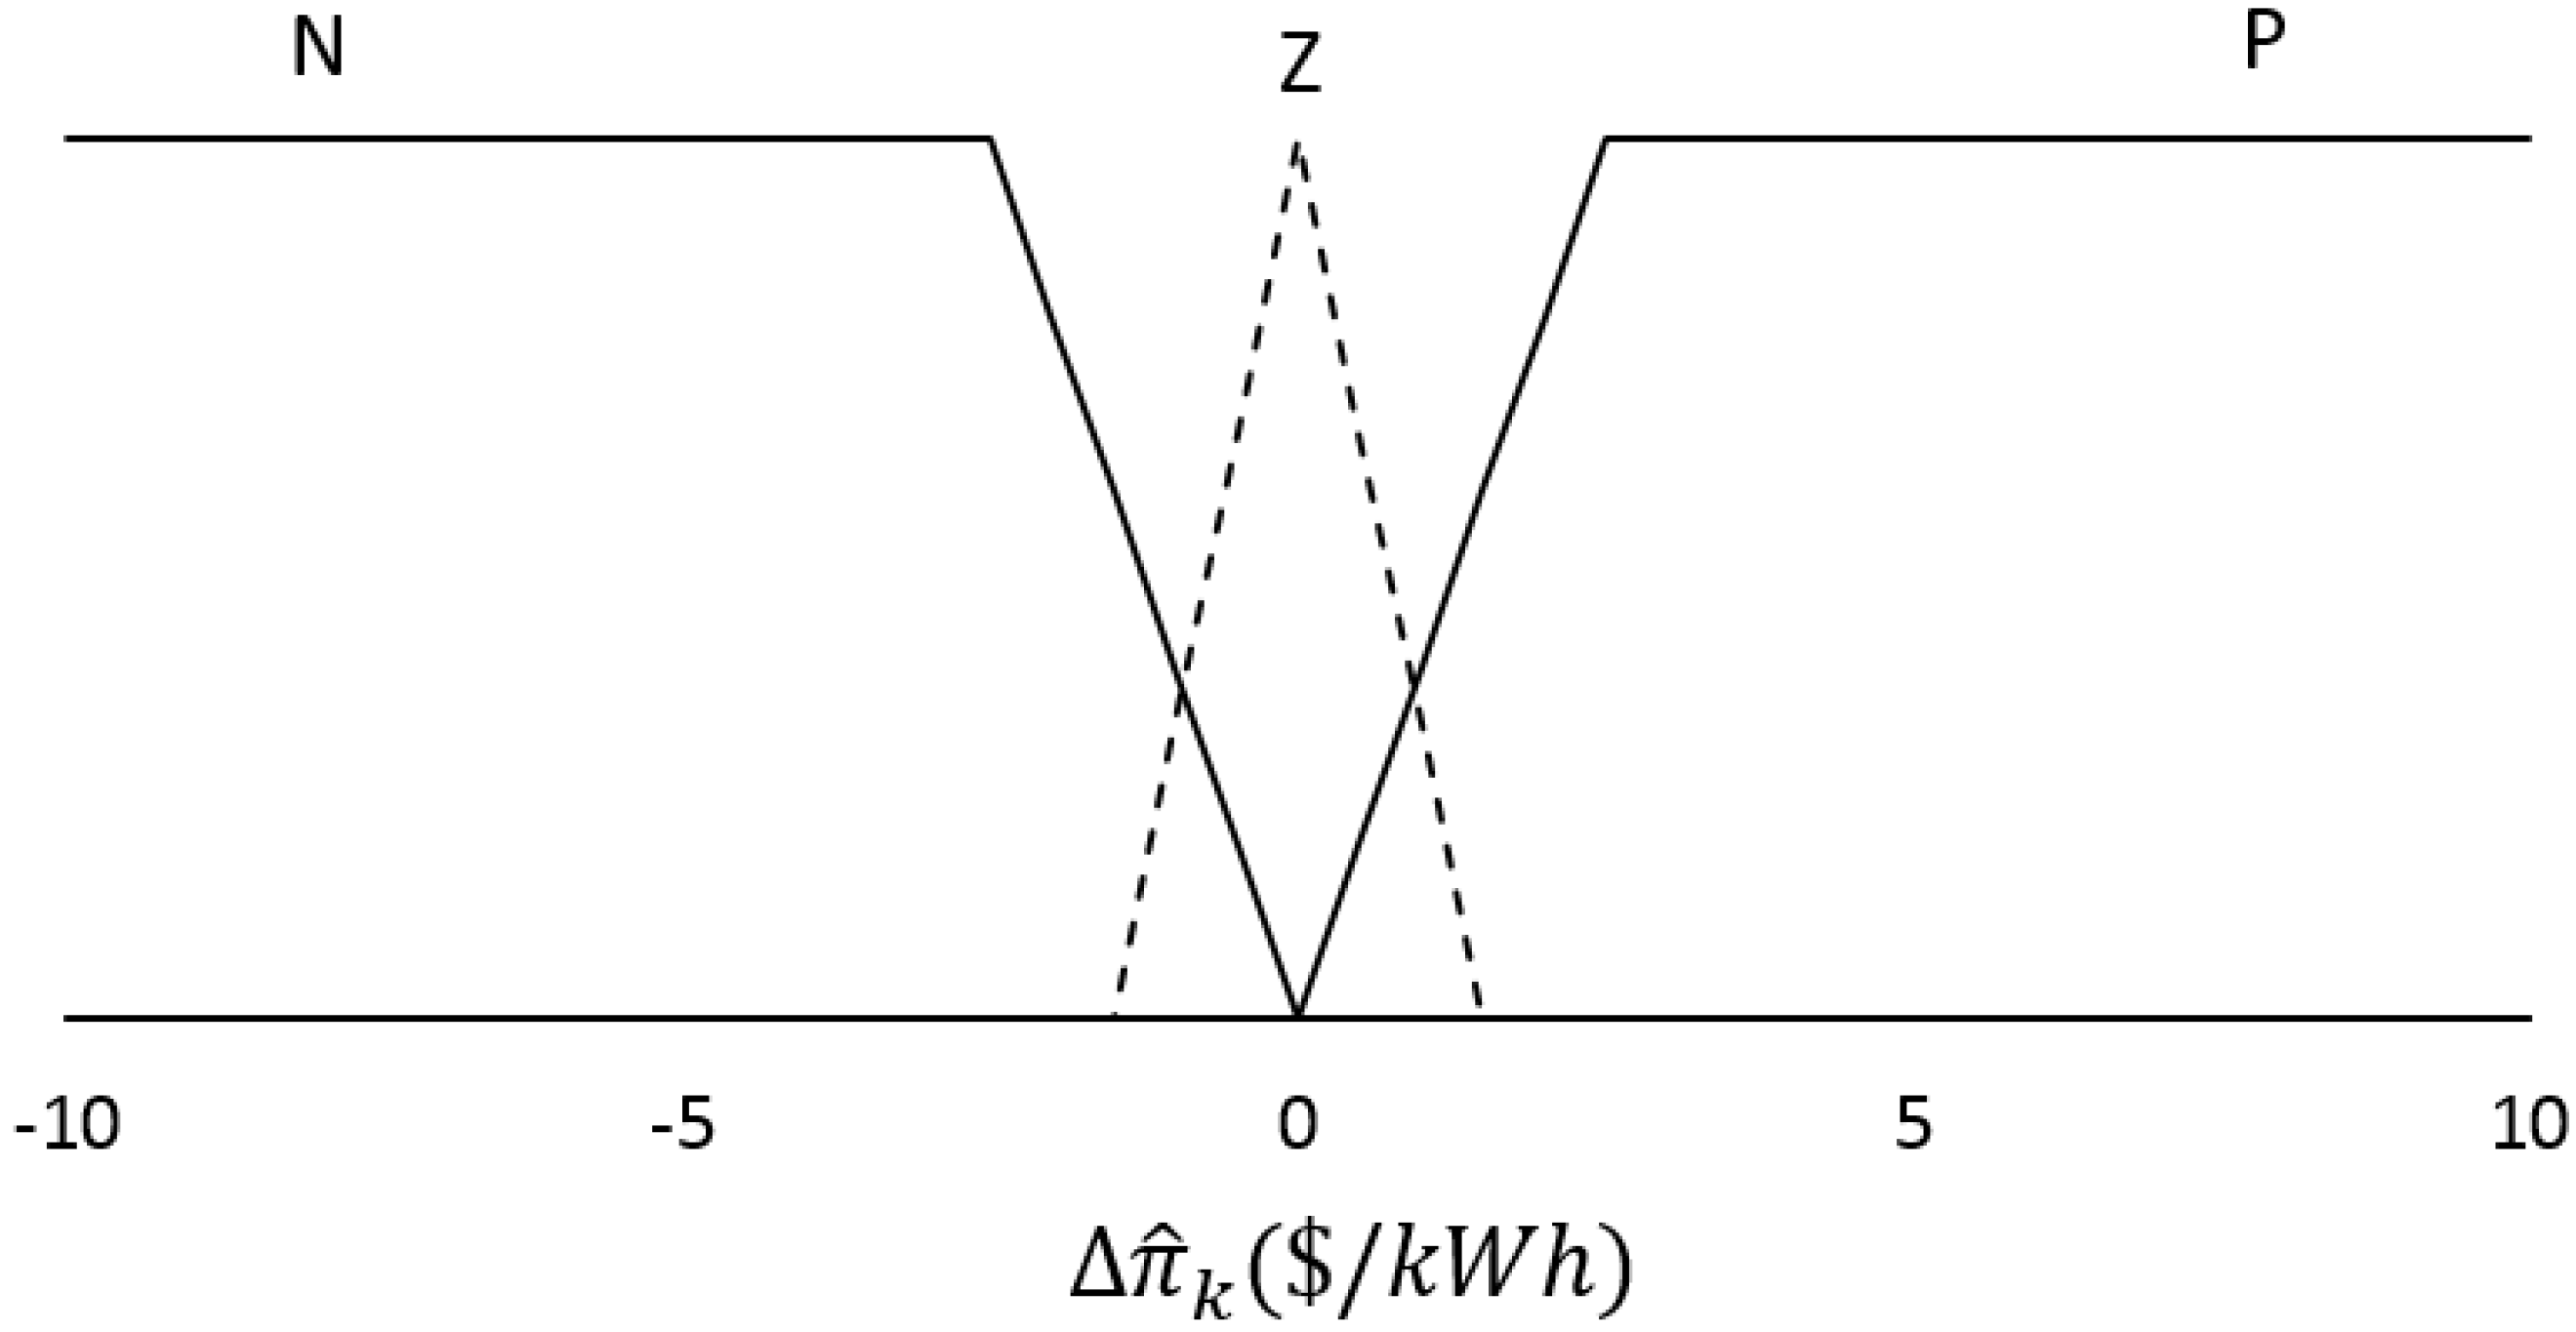
In terms of the inputs considered for the fuzzy controller, these are , , and . In order for the controller to capture the difference between , and , it was found that the difference between prices was a better choice for an input. The output of the fuzzy controller is the power delivered or absorbed by the ESS .
The various rules for the fuzzy system and fuzzy variables are described in
Table 1.
In
Table 1, the symbols L, M, H represent, respectively, Low, Medium, and High; while NN, N, Z, P, and PP represent very Negative, Negative, Zero, Positive, and very Positive, respectively.
The logic of the rules is simple, as mentioned above. For example, if the price difference is such that it is very convenient to consume, but PV production is high, the logic action would be to charge the storage system aggressively to both absorb the energy from the PV system and consume from the distribution system. Similarly, if PV production is low, and demand is high, the storage system must discharge aggressively to follow profit maximization if the injection price is high. In all rules, the SOC constraint (
11) is considered to avoid unfeasible conditions for the ESS (either fully depleted or fully charged).
The ranges were defined by trial and error, observing the regular behavior of the variables through repetitive simulations. The shape of the fuzzy functions was also defined by trial and error, observing the behavior of the variables through repetitive simulations.
7. Conclusions and Future Work
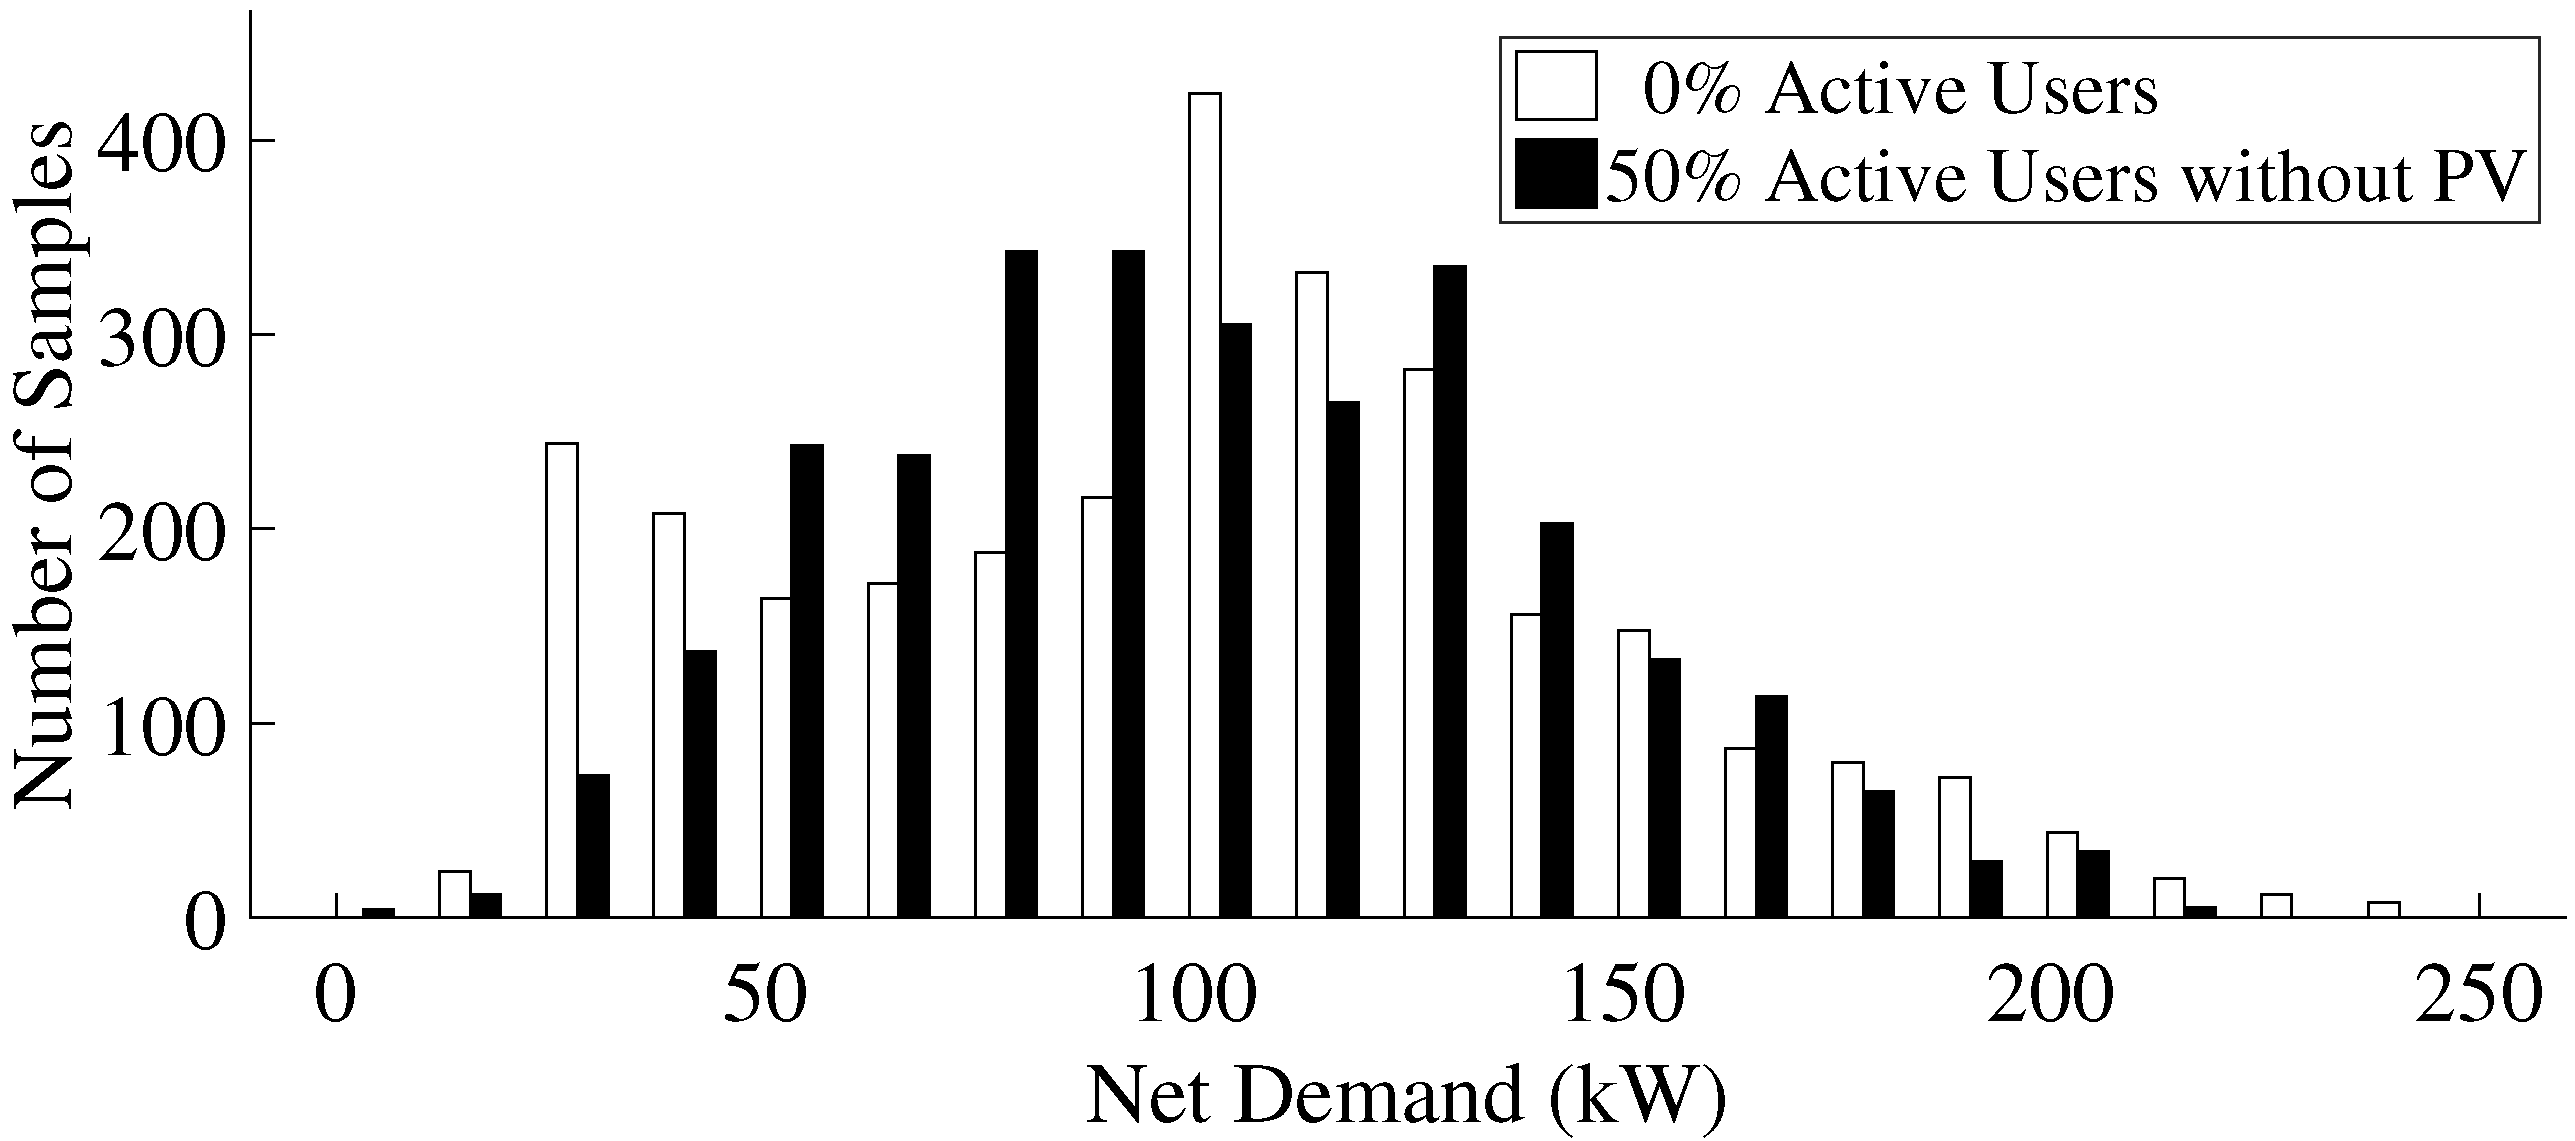
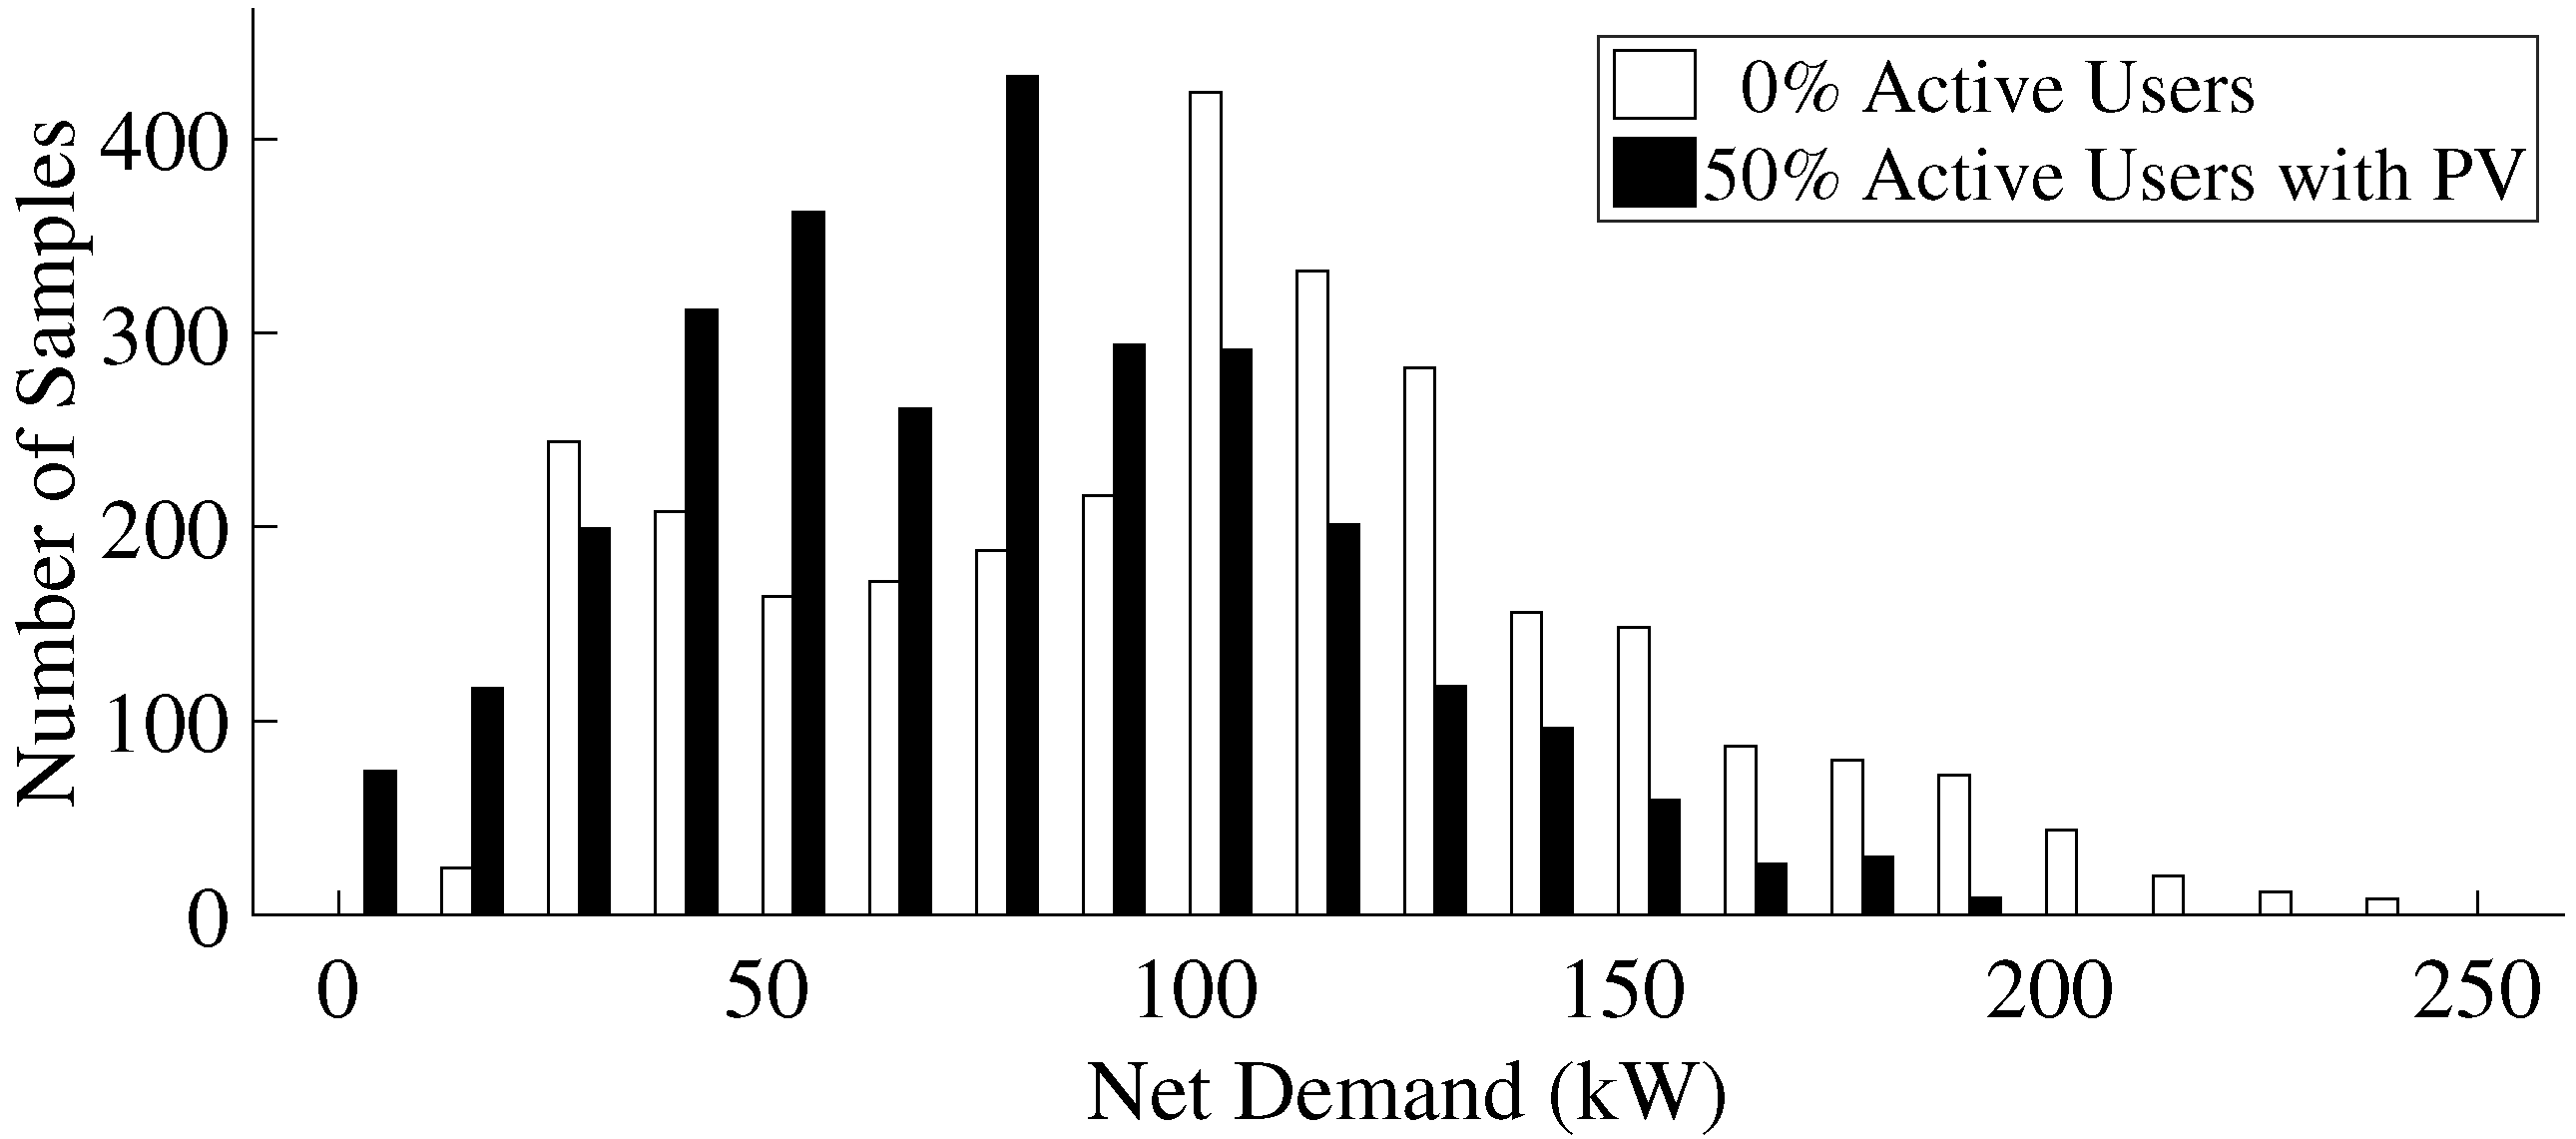
This work has presented a tariff system of simple implementation that guarantees recovery of the total regulated cost and send price signal tending to efficiency by incentivizing peak shaving. The proposed tariff system was implemented in a simulation to see the effects of active/passive customer scenarios, showing that the definition of prices incentivizes customers to reduce demand peaks. Although the tariff system behaves as expected, there are various aspects that need to be treated in future works.
The tariff system assumes that the energy price is fixed. In general, this price may not be fixed, depending on the value of energy in the electricity market or the energy contract that may not be fixed. Future work may explore an adaptation of the rule to represent variable and its impact on prices and customer behavior.
The proposed simulation does not consider the investment cost of storage and PV to assess the adequacy of customers’ investment. Although the simulation shows prices and a reduction in energy cost for active customers, financial indicators are not taken into account. If financial indicators are considered, the inclusion of active customers may not be profitable for all conditions, as the investment cost of the customer must be represented. Future work is proposed to explore such a scenario.
In addition, a more accurate description of welfare maximization is left for future work in terms of maintaining the simplicity of the mathematical representation.
Similarly, the work contribution is centered on the simplicity of the approach, and a qualitative comparison was exposed in
Section 3. Future work will be focused on developing a more systematic comparison metric that can numerically evaluate different tariff proposals.


