Article

Cutting Niches in Rock Salt by Means of a High-Pressure Water Jet in Order to Accelerate the Leaching of Storage Caverns for Hydrogen or Hydrocarbons

by
Waldemar Korzeniowski
1,*,
Katarzyna Poborska-Młynarska
1,
Krzysztof Skrzypkowski
1,
Krzysztof Zagórski
2 and
Mariusz Chromik
1
1
Faculty of Mining and Geoengineering, AGH University of Science and Technology, Mickiewicza 30 av, 30-059 Kraków, Poland
2
Faculty of Mechanical Engineering and Robotics, AGH University of Science and Technology, Mickiewicza 30 av, 30-059 Kraków, Poland
*
Author to whom correspondence should be addressed.
Energies 2020, 13(8), 1911; https://doi.org/10.3390/en13081911
Submission received: 19 March 2020 / Revised: 6 April 2020 / Accepted: 12 April 2020 / Published: 14 April 2020
(This article belongs to the Section D: Energy Storage and Application)

Abstract

:
The article explores the potential for modification of the well-known salt cavern leaching process for brine production or/and hydrocarbon or hydrogen storage facilities, enabling the acceleration of the pace of acquiring new storage capacities with their increased geomechanical stability. The innovative technology is based on the use of high-pressure water jet technique for disc niche cutting in salt rock. The effect of such operations is a significant increase in the contact area of the water with the rock during cavern leaching and faster concentrated brine recovery already in the first leaching phase. This aspect was tested in 67 tests performed for three different types of rock salt: green, pink, and Spiza salt. Laboratory tests of the successive cutting of niches with a stream of water at 500 bar were carried out. The effectiveness of water jet was demonstrated and the possibilities of effective cutting of niches. Significant relationships were found between the obtained depth of niches at a given stream pressure and the duration of individual operations. Depending on the type of salt, the rate of increase in their depth was determined. The presented test results precede the much larger upscaling project, currently at the preparatory stage.

Graphical Abstract

1. Introduction

For several decades, salt caverns in many salt deposits around the world have been used as underground caverns—storage of liquid and gaseous hydrocarbons, hydrogen [1] and other useful substances [2,3,4,5]. Due to the planned increasing share of renewable energy in electricity production in Poland, the issue of underground hydrogen storage will become increasingly relevant. The storage caverns are made by leaching technology, borehole mining from the surface, originally used only for the production of brine. Depleted salt caverns, designed only as mining excavations, may under certain circumstances and after prior adaptation, meet the conditions of underground storage of some liquids, e.g., crude oil, [6]. There are four key points in the well leaching technology that affect its efficiency: ways of water injection and the brine outflow, shape of the cavern, leaching process development, and preparation of the cavern for exploitation. Cavern shape may be controlled by monitoring the development trend of its current dimension, which allows fitting of the designed shape to the maximum extent by adjusting the parameters such as circulating mode [6]. The shape of the caverns in practice is more or less irregular cylindrical, conical, or bell-like shapes, single or grouped (connected each other) [3]. The technology of making storage caverns, although generally known, requires each time to be adapted to the geological conditions in a given deposit [5]. Variation in the shapes requires the technology used within one single cavern to be changed from stage to stage, to secure construction the best quality of the storage facility, including required shape and volume at the right time. Some theoretical considerations on cavern shape irregularity, which reduces its volume and the utilization ratio of the salt formations, and its correction method were confirmed in field tests or numerical studies [7,8]. An interesting test, based on self-resonating cavitating water jet, generating high frequency ultrasonic waves, showed a method to accelerate salt diffusion and finally the construction rate [9].
The authors of the article assumed that modification of the standard cavern solution technology can be accelerated and improved by cutting a disc niche in the leaching well [2]. In this regard, the preliminary tests were undertaken and carried out under laboratory conditions. The research methodology is based on the use of a high-pressure water jet stream to cut out niches in rock salt samples under laboratory conditions to test efficiency of this process. Both the salt leaching process and the water jet cutting technique have been known for many years and are well described theoretically [4,10,11]. Water cutting has many applications, both with the use of water alone and with an abrasive additive significantly supporting this process [12,13,14,15,16]. It is successfully used for stress relaxation in underground mines to prevent rock burst hazard [17,18] or to support excavating by roadheaders in coal mines [19,20] and in selective mining methods [21,22].
Based on the experiments, efficiency of water jet cutting of salt rocks is confirmed with 500 bar pressure that allows to assume preliminary input parameters for planned full scale salt leaching tests with disc niche cutting on the construction of the new installation. Controlled cuttings of niches in various salt rocks allowed determination of the range and expected velocity and trends of the process. The positive findings will serve the development of the innovative, faster salt leaching technology extending fuel storage facilities.

2. Salt Deposits, Borehole Leaching, and Brine Production in Poland

Rock salt deposits of industrial importance occur in Poland within two different salt age formations: Zechstein (upper Perm) and Miocene (Neogene). Zechstein salts occur in the area of the Polish Lowlands in the central, southwest, and northwest of the country. They usually lie at a great depth of several thousand meters, but in a few areas they are shallower, at a depth available for exploitation. Those are:
  • Central Poland and adjacent areas to the north and northwest with salt dumps; Zechstein salts occur here at a depth of less than 1000 m only in the form of salt dumps, breaking through completely or partially through the Mesozoic overburden;
  • Fore-Sudetic area with salt seams, extending in the direction of NW–SE from the area of new salt, through hawthorn and further towards SE;
  • The Baltic area with salt deposits, from Łeba in the west to the Gdańsk Bay in the east.
In each of these areas there are deposits currently exploited. Deposits of Miocene salt are found in the Carpathian Foreland. They lie in a narrow Carpathian belt starting east of Krakow and reaching for Tarnów in the east. The exception is the on-board deposit in the region of Rybnik in Upper Silesia. Generally, Podkarpacie deposits take the form of a folding system and tectonic scales. These deposits are currently not exploited. The production of brine in Poland by the method of well leaching from the surface takes place nowadays in Inowrocław Salt Mines SOLINO S.A., ORLEN Group in the “Góra” and “Mogilno” mines on the dome salt deposits of Góra and Mogilno I. The construction of another leaching mine on the off-shore salt deposit in Lubień Kujawski is planned, and formal and legal proceedings are pending. The amount of salt production in brine in previous years is shown in Table 1.

3. Underground Storage Facilities in Leaching Salt Caverns

In 2017, there were 671 underground gas storage facilities in the world with a total capacity of 417 billion cubic meters, of which 70% is in the USA, Russia, Ukraine, Canada, and Germany. It is estimated that by 2035, volume in underground gas storage will increase by up to 54%, i.e., up to 640 billion m3. Currently, there are over 100 gas storage facilities in salt caverns [24]. In the last 20 years, due to the demand for storage capacities in the country, three underground gas and fuel storage warehouses in salt deposits were built in Poland, established in salt leaching caverns (Table 2). The first to be launched at the turn of 1997–1998 was the Cavern Underground Gas Storage Mogilno, KPMG Mogilno [25] in the Mogilno II salt mine. A few years later, in 2002, an underground oil and fuel storage facility in the Góra salt dome [26] was opened in the depleted mining caverns of the “Góra” Salt Mine. In 2014, KPMG Kosakowo [25] started operating in the Mechelinki seam type deposit. The construction of a storage planned for completion in 2022 is currently underway. The brine produced during the leaching of the caverns is completely discharged into the Baltic Sea. In the coming years, another underground gas storage facility at the Damasławek dome will be built by the Operator Gazociągów Komunikacyjnych Gaz-System S.A.

4. Salt Caver Leaching Technology

Salt cavern leaching is a long-term process. The time measured from the start of leaching in the borehole to reach the final dimensions of the cavern lasts from several to several or more years, and the individual stages of the cavern leaching usually takes several to several months or more. The cavern leaching time depends on:
  • Expected final dimensions,
  • Geological structure of the deposit and type of salt rocks within the cavern,
  • Accepted leaching technology.
Construction of storage caverns consists of creating an underground space in the salt deposit using the leaching technique, in which brine is produced. A characteristic quantity here is the rate of underground space formation as a result of salt dissolution in the bed, i.e., the rate of cavern volume increase, expressed in (m3/h). The brine output from the cavern and its concentration inform about the rate of cavern volume increase. The technology of leaching salt caverns using the borehole method has not changed significantly for several decades. It consists of enabling access from the surface to rock salt deposits by means of a vertical borehole (well), which is then equipped with two free hanging columns of leaching pipes (casings), thus creating three spaces with which one can properly inject water as a leaching medium or collect liquid/brine. The outer space is intended for the medium insulating the ceiling of the leached cavern. Currently, solar oil or nitrogen is most commonly used for this purpose. Depending on which space the water is injected and which brine is collected, we are talking about reverse or direct circulation.

4.1. Shape, Rock Properties, and Cavern Stability

Depending on the type of circulation selected, the rate of increase in brine concentration varies, and the resulting caverns have different shapes. In reverse circulation, the leaching medium (water) is fed through a pipe fixed in the borehole and ends in the ceiling of the planned location of the cavern. The string of brine production casing is placed concentrically in relation to the water pipes and reaches the bottom of the leached interval. This arrangement is characterized by a high concentration of obtained brine and the shape of the cavern in the form of an inverted cone (Figure 1a).
In direct circulation, the water is fed through a central pipe with the smallest diameter and the brine is collected outside. In this way, a lower concentration of brine is obtained, while the cavern shape is regular and close to the cylinder, (Figure 1b), which allows it to be used as a storage cavern with increased capacity and much better geomechanical stability compared to the previous one. The final shape of the caverns is also influenced by local geological conditions, in particular the presence of insoluble layers (e.g., anhydrites, clays) and quickly leaching potassium magnesium salts.
In mining caverns, insoluble layers limit the amount of salt that can be extracted, and as a consequence, at certain intervals, the cavern depth is reduced in diameter, which reduces the leaching efficiency. In the case of design and construction of storage caverns, they can be a potential place of cavern leakage or create so-called “traps” for the stored product. Consequently, when designing the location of the storage cavern, such places are ignored due to the reduction of their potential capacity. When the salt quickly leaches in the lithological profile, the permissible cavern diameters may be exceeded and, as a consequence, its geomechanical stability may be lost. In addition, when geological layers are inclined at a large angle, then there may be an adverse change in the leaching direction along this layer, which will eventually lead to an unfavorable shape of the cavern, which deviates significantly from the designed one. Such layers are also potential places for leaks in caverns, as well as accidental connections with other voids or caverns.

4.2. Salt Leaching Rate

In the brine production process, its characteristic parameter is its concentration and flow rate, informing about the amount of salt in the brine extracted from the cavern. Usually, the so-called industrial concentration required by the recipients is sought. In standard, commonly used technology, in the early stages of cavern leaching, brine is obtained with a much lower concentration. The reason for this is the initial small contact surface of the salt leached in the cavern with the leaching medium (surface area of the borehole wall with a diameter of about 0.3 m), which grows as it leaches. Experience to date [4] shows that:
  • The average speed of lateral leaching of the vertical wall of the salt rock mass, with clean water at a temperature of 20 °C, is within 8–12 mm/h.
  • The rate of floor leaching can vary more than the speed of side leaching—the ratio of floor to side leaching can vary between 1.2 and 3.
  • There are no significant differences between the average leaching rates for individual deposits in the world.
The possibility of increasing the contact surface already in the early stages of cavern development according to innovative technology (patent pending) [17], currently in the research and development phase, creates extremely favorable conditions for the following reasons:
  • Shortening of the total cavern production time.
  • Obtaining higher concentration brine.
  • Limited freshwater intake.
  • Reduction of energy consumption in the technological process.
  • Decrease in demand for storage capacities for non-industrial brine.
Preliminary laboratory tests of static leaching of rock salt samples carried out by the authors, in which fissures (niches) were mechanically cut out, indicated that this increase may allow acceleration of cavern production by up to about 20%, as compared to the technologies currently used worldwide.

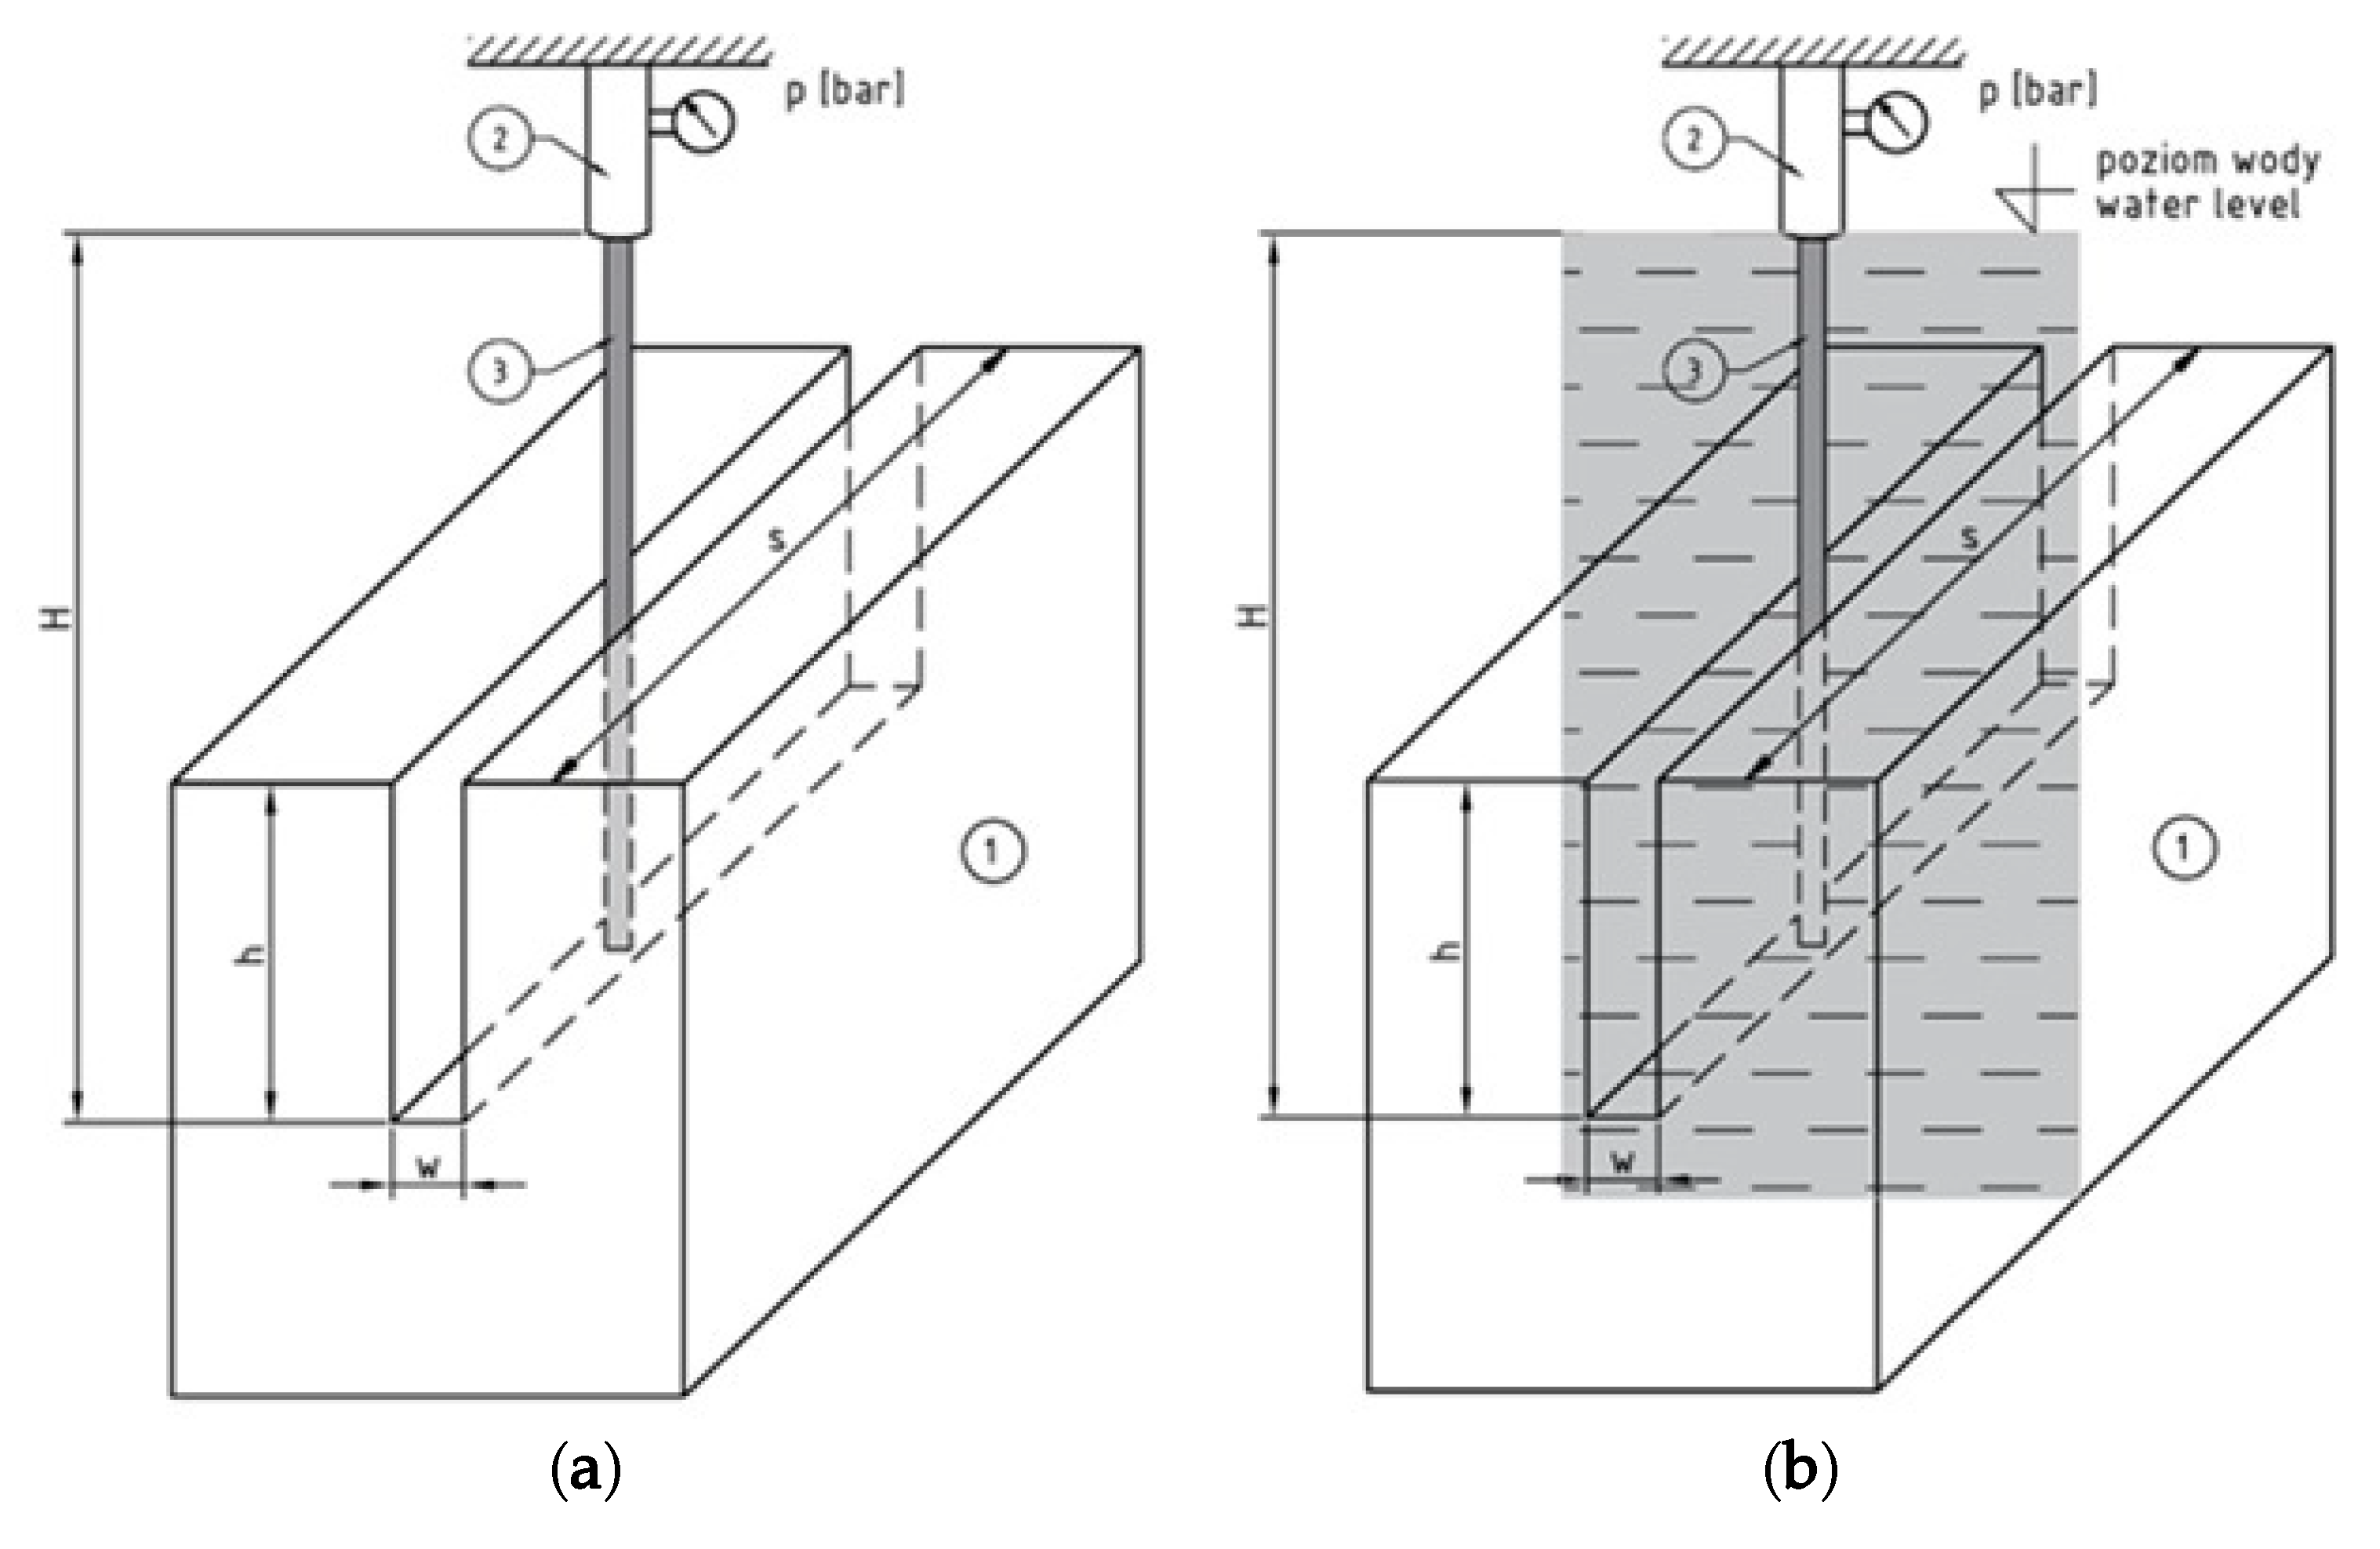
5. Experimental Cutting of Samples with a High-Pressure Water Jet

The long-term goal of the research program is to demonstrate the possibility of making niches (fissures) in the salt rock mass using a high-pressure water jet. In the event of success and commercialization of innovative technology, with the disc niche depicted in Figure 1b, as a consequence, much faster and more efficient technology of underground borehole leaching can be expected, especially for the needs of underground storage caverns. At the current stage of research, laboratory experiments were carried out to determine the most important relationships between, on the one hand, the properties of rocks and the rock mass, and on the other the parameters of the high-pressure water jet and the effects obtained during the experiments. The test stand is shown in Figure 2. Prepared cubic samples of rocks with a side length of 100 mm were placed on the table of a water-cutting machine manufactured by STM Stein-Moser GmbH enabling the achievement of a narrow water jet pressure of several thousand bars, flowing through a nozzle with a hole diameter of 1 mm (Figure 3). For the purposes of the experiment, due to the anticipated future solutions on a full technical scale and the possibility of achieving and using a pressure of about 500 bar, laboratory tests were carried out for the same pressure. The water jet velocity was about 25 m/s, with a capacity of about 1.18 L/min.

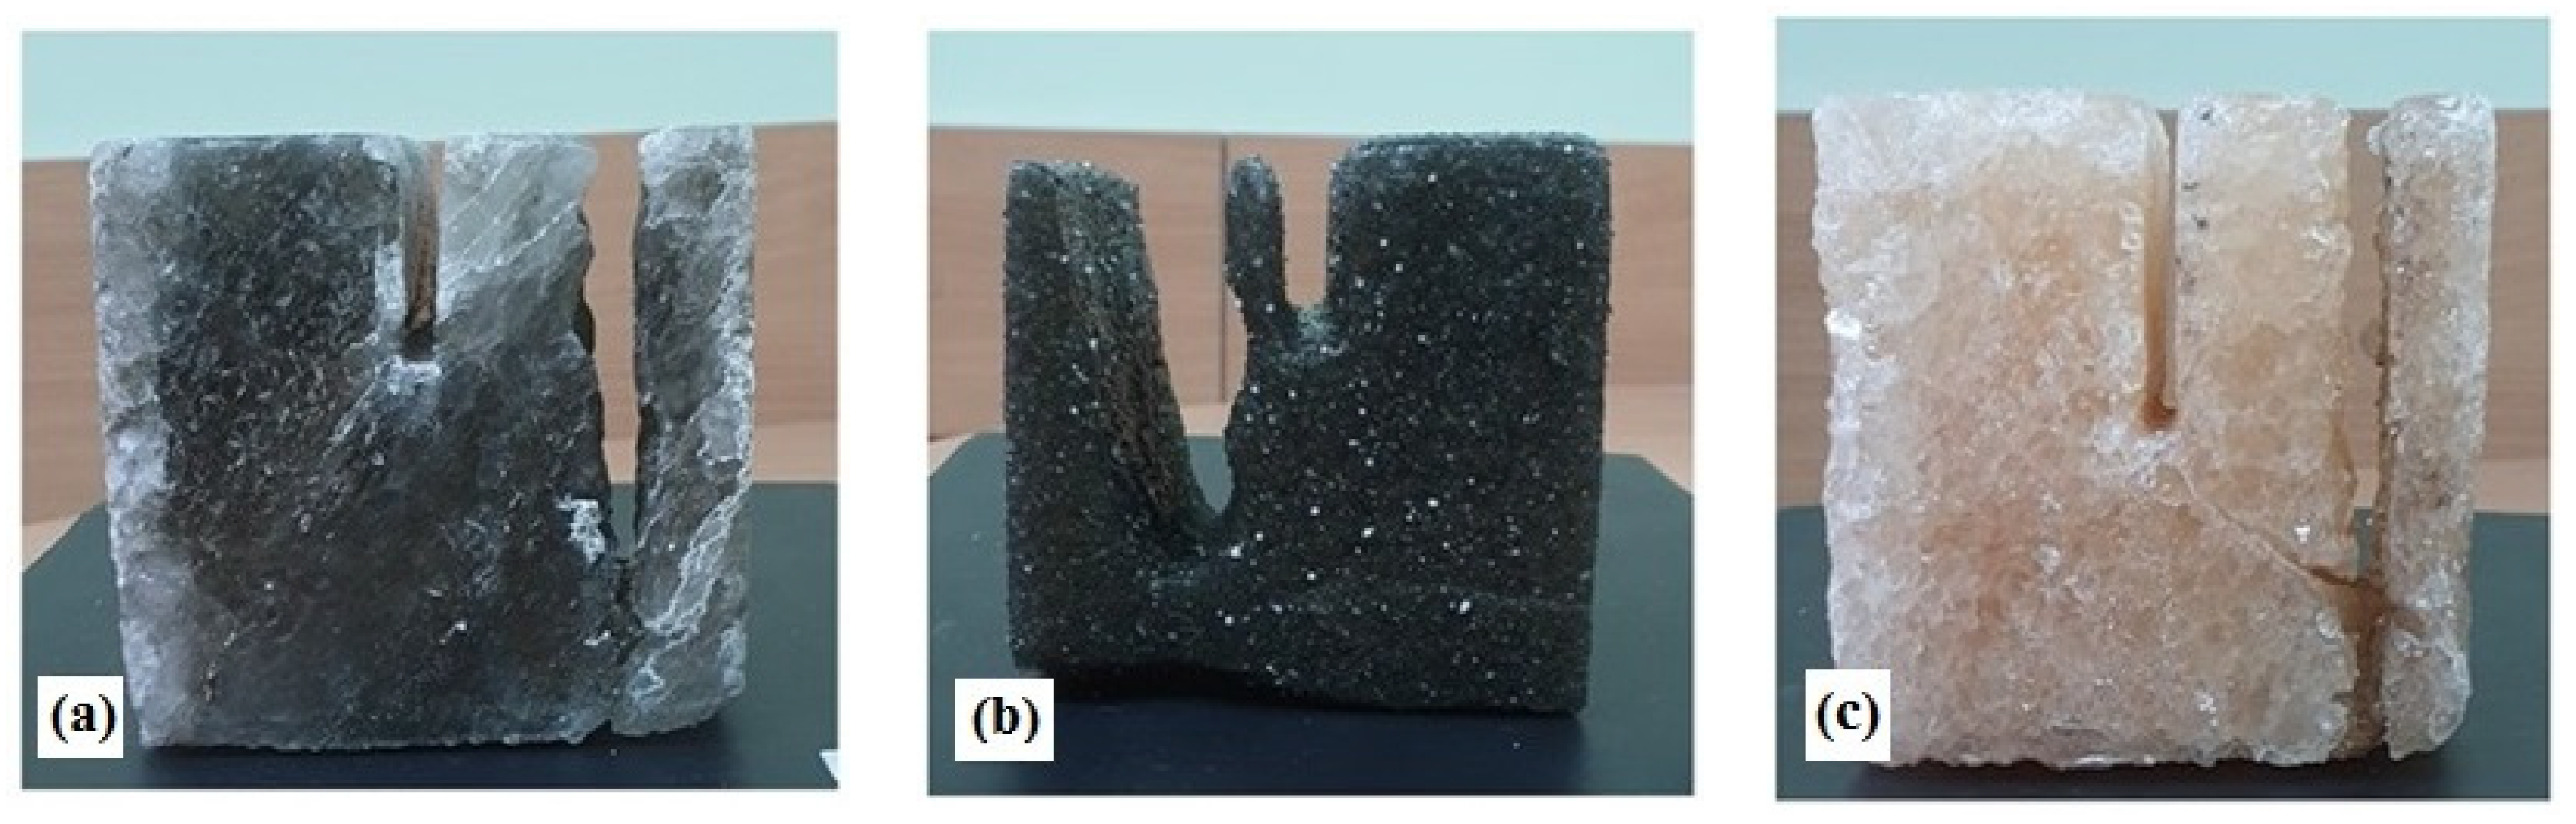
5.1. Petrographic Characterization of Salt Samples

Cubic rock salt samples with dimensions of about 100 × 100 × 100 mm were used for the tests. The samples came from the Wieliczka and Kłodawa rock salt deposits and represent three lithological types of salt: green salt (samples Z1, Z2, Z3) and Spiza salt (samples S1, S2, S3) from Wieliczka and pink salt (samples R1, R2, R3) from Kłodawa (Figure 4a–c).
Kłodawa is a salt dome of Zechstein (upper Permian) salt formation in Central Poland. The geographical location and the simplified geological cross-section of the dome is shown in Figure 5a. Three samples: R1, R2, R3 represent the PZ4 Youngest Halite litostratigraphic level of the PZ4 cyclotheme of Zechstein (Figure 5b). In Kłodawa mine salts from this level are called pink salts, because of the pink and orange colors. Pink salts from Kłodawa dome are generally pure rock salt, which consists of about 97% of the mineral halite and a small amount of impurities, mainly anhydrite. The samples R1 and R2 are typical pink salt. The R3 sample represents anhydrite with halite, which occurs as interlayers, bands, and irregular accumulations within the Youngest Halite complex.
Wieliczka is a Miocene (Badenian) salt deposit occurring in the Subcarpathian zone, Southern Poland (Figure 6a). The irregular deposit consists of evaporitic and clastic layers strongly folded, thrust over the Miocene sediments, and uplifted. The samples come from two stratigraphic levels, the Upper Spiza (Bronze) Salts and Green Salts (Figure 6b). Samples Z1, Z2, and Z3 represent the Green Bedded Salts stratigraphic level. Green Bedded Salts consist of mainly coarse crystalline halite seams with significant quantity of anhydrite and clay impurities, giving them a gray-green color. Samples S1, S2, and S3 come from the upper part of the Upper Spiza Salts (Bronze Salts) stratigraphic level. The salts consist of various crystalline halite with a big quantity of clastic impurities, mainly quartz sand and clay.

5.1.1. Green Salt

Sample Z1. Green rock salt (Figure 4a), white-grey, different crystalline: medium and thick crystalline, pure. Sample Z1, similarly to Z2, involves contact of a transparent, off-white salt with a grey salt. Halite crystals have different colors: colorless transparent and off-white, light grey, and single crystals are milky. The largest crystals reach a dimension of 10 mm. The white, colorless salt shows the directional arrangement of crystals and their elongated shapes. Inclusions in crystals are also visible. The salt is very clean, locally slightly contaminated by the concentration of anhydrite sand.
Sample Z2. White-grey rock salt, different crystalline: medium and thick crystalline, pure. The sample involves contact of a transparent, colorless, off-white salt with a grey salt. In the sample, halite crystals have a different color: in white salt they are colorless transparent and whitish—in grey salt they are light grey. Some individual beans are dairy. The largest dimensions of the crystals reach 17 mm. Salt is slightly contaminated with dark grey clay material unevenly: in grey salt in the form of streaks and clouds, in white salt impurities are not visible or insignificant.
Sample Z3 (cut under water). Green rock salt is grey and differently crystalline: fine, medium, and coarsely crystalline, clean, slightly contaminated with clay and charred organic matter. Halite crystals are transparent, colorless and grey, and among them are scattered milky crystals. The largest dimensions of the crystals reach 17 mm. Visible impurities are anhydrite in the form of whitish fine clusters of 2–3 mm in size, spot-scattered black terigenic material and carbonized organic matter, and local detritus of skeletons of marine animals.

5.1.2. Spiza Salt (Bronze Salt)

Sample S1. Rock stone salt (Figure 4b), is dark grey, finely crystalline, with a random texture, heavily contaminated with sandy and clay terigenic material. Usually, quartz sand is the main component of the rock, which was then in salt sandstone, in which halite is a binder for crumb material. Additionally, also appearing in the rock are single whitish anhydrite clumps of 0.5–1 mm in size and a few loose admixtures of cherry sand. The sample is cut with irregular two veins of pure, colorless salt, 0.3–1 cm wide.
Sample S2. Dark grey, fine-crystalline rock salt, with a random texture, heavily contaminated with grey clay, quartz sand, small clusters of charred organic matter and small clusters of anhydrite in the form of debris and sand. There are single large halite crystals up to 28 mm in the rock. Fine-crystalline halite is colorless, transparent with black spots of organic or clay matter inside the crystals and a large amount of quartz sand between them. In rock, usually the terigenic material prevails over halite.
Sample S3 (cutting under water). Dark grey, fine-crystalline rock salt, with a random texture, contaminated with densely dispersed carbonized organic matter and clay material and, to a lesser extent, quartz sand. Halite crystals are transparent, colorless. There are numerous admixtures of anhydrite in the form of lumps of 0.5–2 mm in salt. In this sample, halite quantitatively prevails over impurities.

5.1.3. Pink Salt

Sample R1. Pink rock salt (Figure 4c), is pale orange, medium and thick crystalline, pure. The color of the crystals varies from transparent colorless to orange. The dimensions of the crystals usually reach from 5 to 10 mm. The texture is random. The only visible pollution is a few whitish aggregates and smears of anhydrite sand.
R2 sample. Pale orange rock salt, medium and coarse crystalline, pure. Sample R2 represents the same type of rock salt as sample R1. The color of the crystals varies from transparent colorless to orange. The largest dimensions of crystals reach 15 mm, 22 mm. The texture is generally random, but the localized arrangement of elongated crystals is locally visible. The salt is clean, slightly contaminated with whitish anhydrite sand in the form of smears and streaks.
Sample R3 (cut under water). Anhydrite with pale orange rock salt. The sample includes anhydrite rock overgrowing with rock salt. Anhydrite rock is whitish, cream, and crypto-crystalline. Forms porous irregular aggregates, debris, crusts and growths on halite crystals. It is overgrown with fine and medium crystalline salt. The dimensions of the largest halite crystals reach 30–40 mm.

6. Discussion

The specific fissure resulted in the procedure of water jet cutting is called a niche which are cut intentionally to improve the technology, while typical geological fissures are naturally created in rock mass discontinuity resulting mostly from a change in the system of forces loading its specific areas. The last types of discontinuities are usually irregular and more or less chaotically distributed. The niche created by the action of a strong, directed water jet has a predictable shape and location.
The specificity and purpose of the research set out at the beginning is related to the determination of the effects of the high-pressure water jet action on salt rocks. In such an experiment, two phenomena coexist. The first and most pronounced effect is the gradual formation of a kind of void (niche) as a result of shear forces resulting from a narrow (about 1 mm diameter) and high-pressure (500 bar) water jet. The second effect is the dissolution (leaching) of a relatively easily soluble salt, not only because of the obvious surface “rinsing” effect of the sample due to the interaction of fresh water, but also due to the additional accompanying phenomenon of uptake by the jet of fine particles of crushed salt, which increases the degree of saturation of the resulting brine. In Table 3, Table 4 and Table 5 the results of the measurements carried out on the three samples of rock salt described above and for comparison on additional samples of sandstone and granite were matched (Table 6 and Table 7). Column No. 8 provides the average values of measured local niche heights cut out in one, 1-min cycle. Each subsequent cutting cycle, as a result of which the previously cut niche was deepened, lasted 1 min. Due to the fixed position of the water nozzle, its distance H in subsequent cycles was greater than the previous one by the average value of depth increase. In each of the tables column 9 shows the value of the average rate of increase of niche depth for all cycles of the experiment performed on each sample of a particular type of salt. Each time, this value is the result of a linear approximation of the measurement results (Figure 7, Figure 8, Figure 9, Figure 10, Figure 11, Figure 12 and Figure 13). In column 10, analogous values are given, which in this case are the result of measurements in each completed cycle.

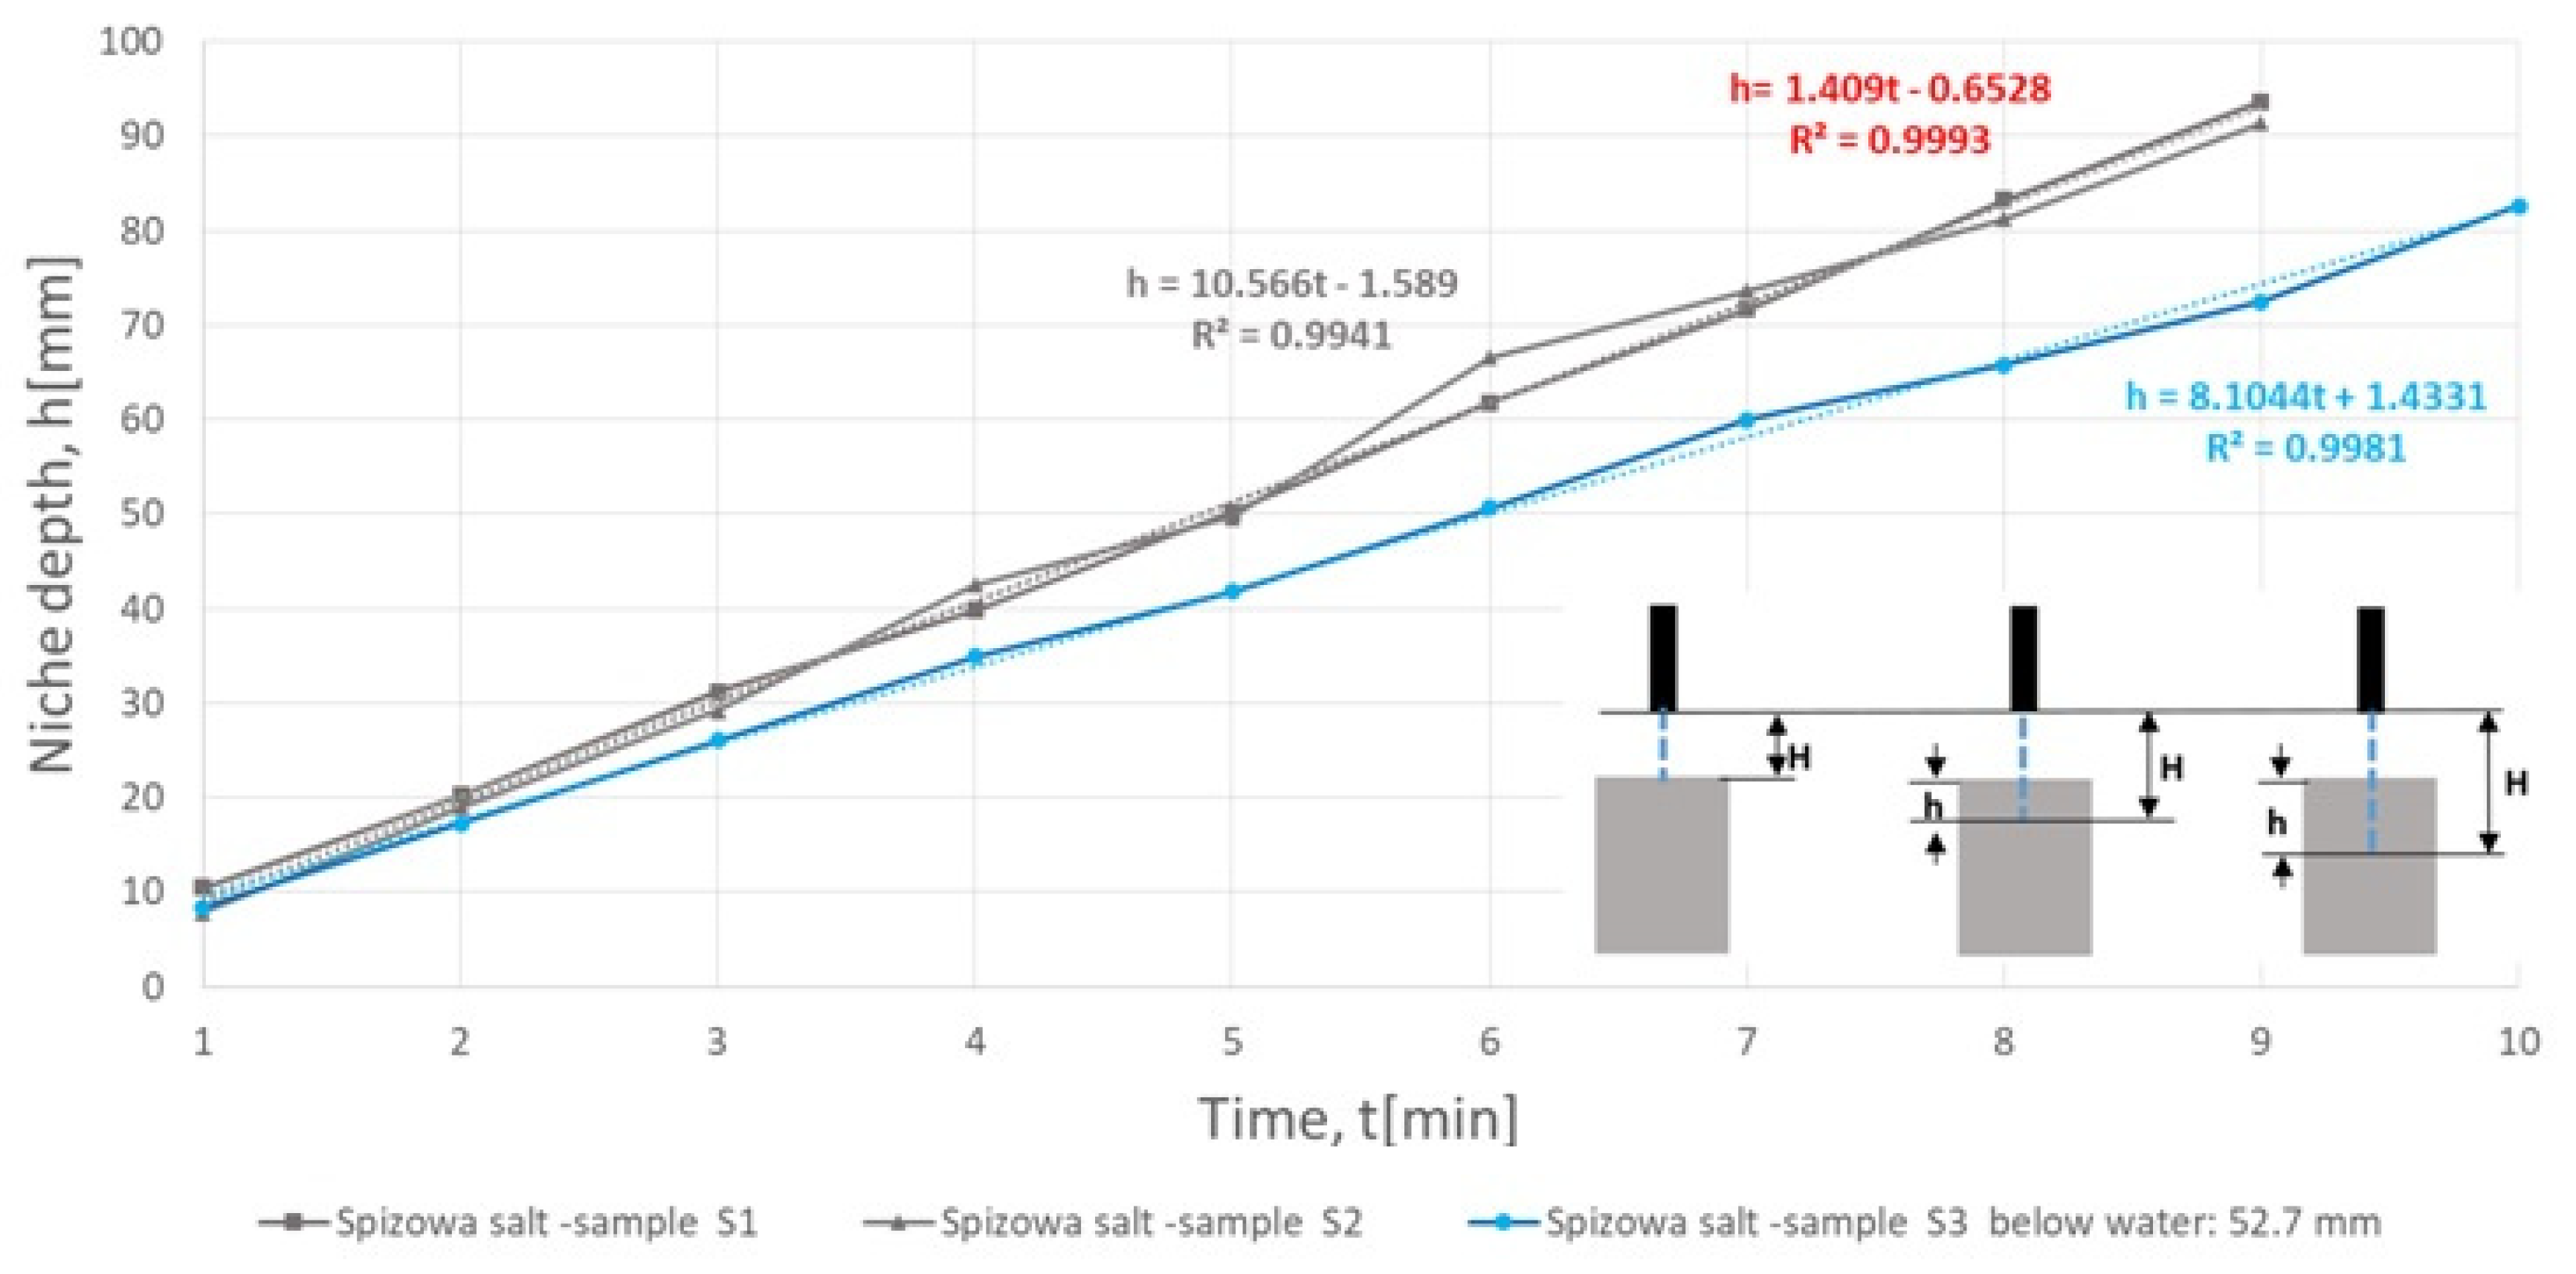
6.1. The Speed of Cutting the Nozzle in Salt Samples

A single niche cutting cycle lasted 1 min and covered the entire sample width of 100 mm, which means that the speed of the water jet along the cutting path was v = 100 (mm/min). All tests were carried out with the same initial parameters. As indicators of the efficiency of cutting out niches, the following were adopted: depth h (mm) obtained at individual stages of the experiments, the average rate of increase of this depth Vh (mm/min), and the average depth increase in one cycle dh (mm). The measurement results, taking into account the current nozzle distance H (mm), for which position the other parameters were measured, are summarized in the tables.
Samples of green salt (Table 3, Figure 7 and Figure 8). Niches cut out in samples of green salt Z1 and Z2, with a jet passing through the air, deepened at a similar speed. Based on the linear approximation of the experimental results, with high correlation coefficients with values R2 = 0.9987 and R2 = 0.9977, these values were determined for samples Z1 and Z2, respectively: 13.97 and 14.90 (mm/min), with variability of measured local depths (i.e., at measuring points with current coordinates: 0; 25; 50; 75; 100 mm) in the range from 13.11 to 17.36 mm in sample Z1 and from 10.93 to 16.38 mm in sample Z2. The resulting shape of the niches was regular, with smooth, even, and flat walls.
The niche cut in sample Z3 by means of a jet passing through water showed a greater depth increase rate, which was estimated based on approximation, with a lower correlation coefficient R2 = 0.9879, at 16.23 (mm/min) and local depth variations from 14.06 to 22.09 mm. In this case, a very irregular niche was obtained, with stepped channels deep into the sample. The cutting process was different than in previous samples, where the nozzle was located above the water surface. In this case, a much stronger influence of the leaching process on the deepening (and widening) of the niche was observed. Irregular shaping of the niche is most likely related to the petrographic characteristics of the Z3 sample, where the presence of larger anhydrite grains was found, which, as the rocks of much stronger and non-leaching, were released chaotically creating “abruptly” subsequent voids.
Samples of Spiza salt (Table 4, Figure 9 and Figure 10). Niches cut in these samples S1 and S2, with a jet passing through the air, deepened at a rate about 30% lower compared to the salt of green salt samples. The linear approximation of the results of experiments, with very high correlation coefficients with the values R2 = 0.9941 and R2 = 0.9993, shows that these values are for samples: 10.41 and 10.57 (mm/min), with variability measured local depths at analogous measuring points to green salt, in the range from 8.65 to 11.58 mm in sample S1 and from 7.07 to 16.90 mm in sample S2. The resulting shape of the niches was regular, with smooth, even, and flat walls.
The niche cut in sample S3 by means of a jet passing through water showed a lower depth increase rate, which was estimated based on approximation, with a high correlation coefficient R2 = 0.9981, at the level of 8.10 (mm/min) and local depth variations from 5.79 to 10.14 mm. The result of the experiment was a niche of regular shape, but compared to cutting with a jet in the air, its final width was clearly larger (eventually about three times), which may be the result of a greater effect of leaching.
Pink salt samples (Table 5, Figure 11 and Figure 12). When cutting out niches in samples R1 and R2 with a jet passing through the air, the highest depth increase rates were achieved compared to those previously tested. This increase was higher than the analogous in green samples by about 30% and clearly higher by about 80% compared to the low salt. The linear approximation of the results of experiments, with very high correlation coefficients with the values R2 = 0.9982 and R2 = 0.9889, shows that these values are for R1 and R2 samples: 18.57 and 18.14 (mm/min), respectively, with variability of measured local depths at analogous measuring points to the green salt, in the range from 15.87 to 21.98 mm in sample R1 and from 10.99 to 23.34 mm in sample R2. The resulting niches were irregular, with uneven walls, on which anhydrite sand was visible. The niche cut in sample R3 by means of a jet passing through water showed a lower depth increase rate, which was estimated based on approximation, with a high correlation coefficient R2 = 0.9981, at the level of 8.10 (mm/min) and local depth variations from 6.52 to 18.36 mm. During the experiment, it was found that the exposed anhydrite shells and anhydrite sand disturbed and inhibited the leaching and niche formation slightly. The niche walls were irregular, with grains of faster leaching salt visible.

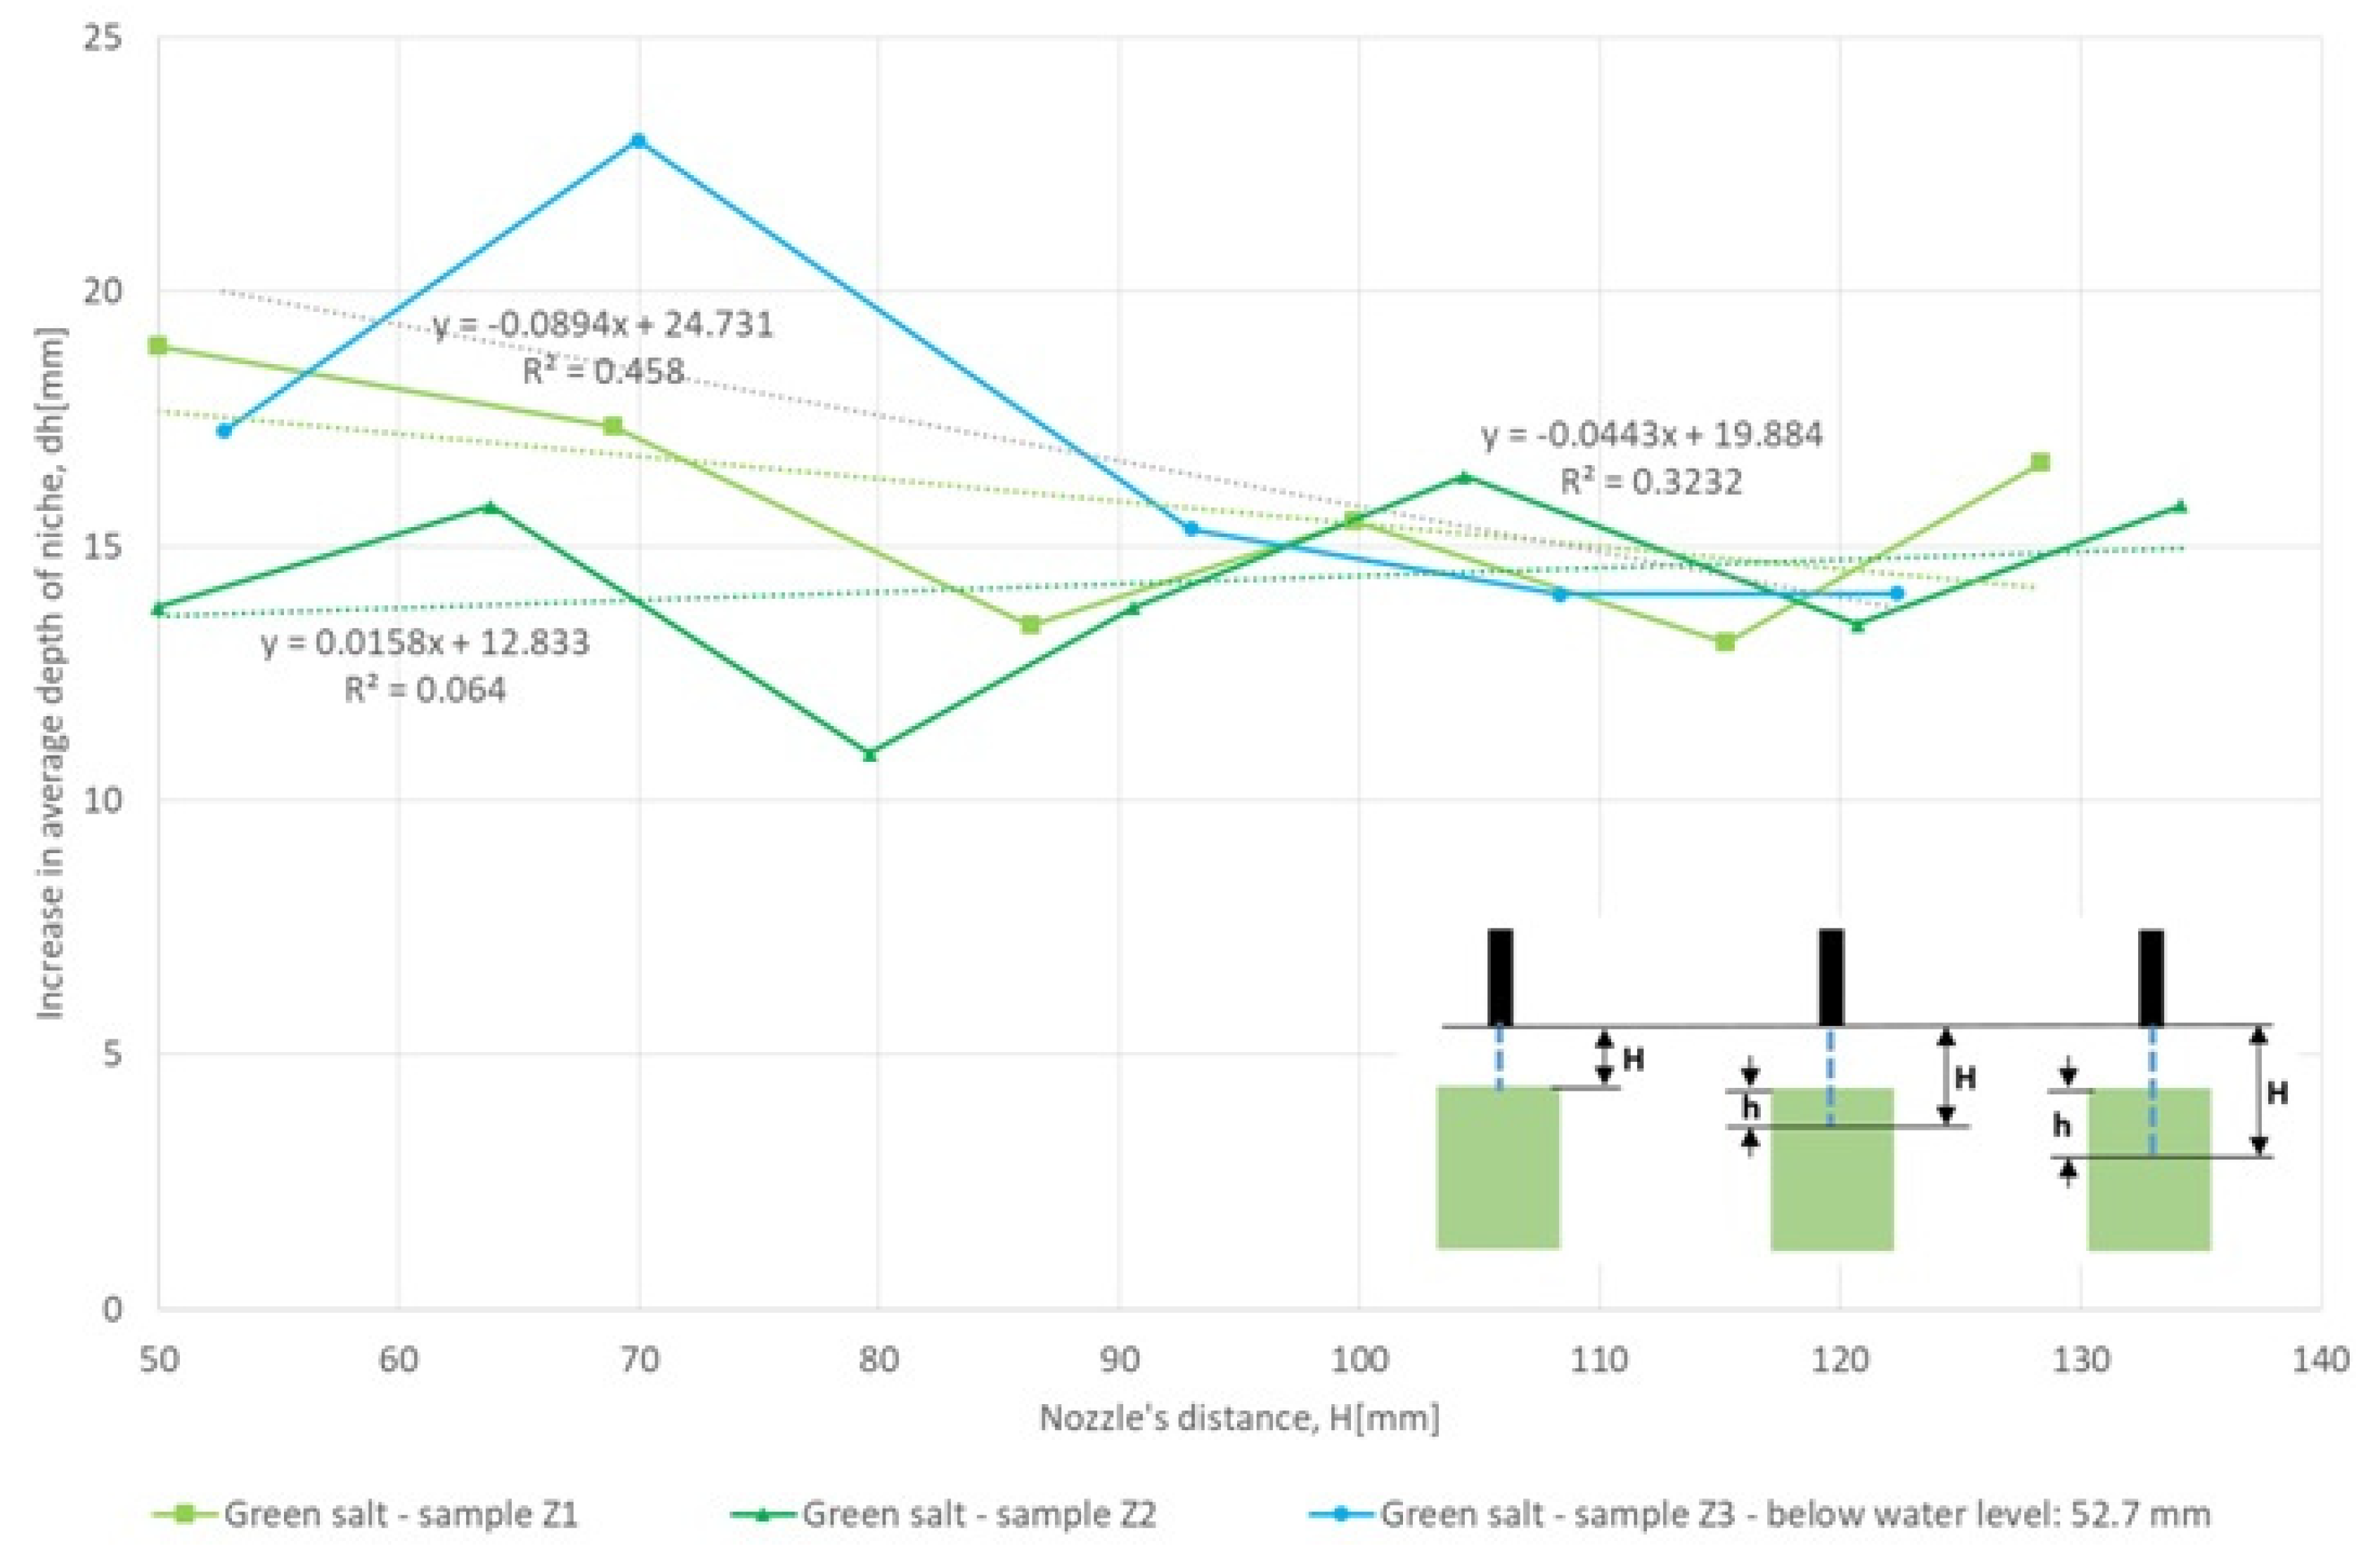
6.2. Impact of Nozzle Distance on the Amount of Niche Depth Increase

As mentioned earlier, during the tests, the position of the water nozzle was at a certain, fixed distance from the top surface of the sample. Subsequent cutting cycles, continued in the same niches, took place at successively larger distances H, which resulted from the increase in depth of the previous cycle. The current distance H was measured between the outlet of the nozzle and the current depth of the niche (position of the bottom of the niche) at the beginning of a given cycle, which is marked on the graphs (Figure 2).
Figure 7, Figure 8, Figure 9, Figure 10, Figure 11, Figure 12 and Figure 13 show the results of measuring the relationship between the nozzle distance and the obtained increments in niche depth. Linear approximation of results indicates a lack of clear relationships or trends in this area. A relatively large spread of results as well as variable volatility trends are noted. The lack of such a relationship is probably due to the relatively small absolute distances and depth of niches. Such relationships will probably be easier to grasp in the planned technical tests of this new technology when we are dealing with distances of the order of one or several meters, as well as a much longer duration of individual cycles.

6.3. Changing the Cutting Effect Due to the Flow of the Water Jet on the Samples Placed Below Water Level

There was no clear difference between the variation in the value of the increase in nozzle depth dh between the experiment with the jet flowing in water and in air. In both cases, there is a lack of trend and similarly, difficult to determine at the current stage of research, a variety of directions and values of increments (Figure 8, Figure 10 and Figure 12).
The rate of increase in niche depth (Table 8), when cutting with a jet passing through water, decreases in the case of tested samples of the salt (S) by about −23% and pink (R) by about −43%, while it increases when testing the green salt (Z) by approximately +12% compared to an air jet.

6.4. Influence of Rock Type on the Cutting Effect

Analogous comparative studies were carried out on samples radically different from salt samples (UCS = 40 MPa). Tests were carried out on another sample of sedimentary rock—sandstone (UCS = 100 MPa) and igneous rock, i.e., granite (UCS = 150 MPa). The samples were diversified both in petrographic and geomechanical terms (brittleness, plasticity, deformability, compressive strength). As could be intuitively assumed, the cutting progress achieved was definitely smaller for stronger rocks, and amounted to 1.95 (mm/min) on sandstone and 0.64 (mm/min) on granite on average. Salt susceptibility in this range is several times higher (Table 8).

7. Conclusions

The high-pressure water jet cutting tests carried out on the three types of salt rocks samples, sandstone, and granite, under laboratory conditions, confirmed the possibility of effective cutting out of niches. The following conclusions can be drawn regarding rock type significance for the process, cutting tool location, cutting rate achieved, jet flow environment, and technological remarks for future industrial well leaching technology:
a
Rock type—based on comparative tests carried out on samples radically different from salt samples, i.e., granite and sandstone, diversified both petrographically and geomechanically, the strong relationship between rock properties and niche cutting efficiency was confirmed. Salt susceptibility in this range is several times higher. In rocks of greater strength (sandstone, granite), the width of the cut niche was similar to the diameter of the nozzle (jet).
b
Cutting tool position—the relationship between the distance of the nozzle from the rock surface (the bottom of the niche being cut out) and the increase in the depth of the niche is not clear and within the range of the tested depths it changes within relatively wide limits, which at this stage does not provide grounds for determining the trend.
c
Cutting rate—the speed of making a niche depends on the type of rock salt and can vary from 30% to even 80%. In salt rocks, the width of the obtained niche gradually increased with the time of conducting the experiment. At the end of the test cycle, it was 5 to about 35 times larger than the nozzle diameter, reaching 35 mm.
d
Jet flow environment—the result of cutting out a niche with a high-pressure jet passing entirely through the water, located between the surface of the tested sample and the nozzle, is much more diverse compared to the situation when the jet flows in the air. In addition to the main water jet effect, with given flow parameters, intensive expansion of the niche results from the effect of the reflected water jets.
e
Leaching technology—it should be assumed that in technical conditions, a high-pressure water jet flowing in the water environment, or rather brine of increasing concentration due to the ongoing leaching process, may weaken the final cutting effect. Salt cutting, in contrast to stronger rocks, is additionally accompanied by a process of dissolution, as well as the removal of larger grains of structural samples.
(a)
Depending on the particular type of salt, it may happen that the solid particles (salt, anhydrite, etc.) that are removed by the jet will assist in cutting out the niche. The cut niche in the technical borehole creates extra contact surfaces of water and rock, which in turn may significantly accelerate the industrial leaching process.
The successful conducted tests and their positive results precede the currently prepared experiments aimed at developing innovative technology for making salt caverns on a semi-technical and full technical scale.

Author Contributions

Conceptualization, W.K.; methodology, W.K., K.S., and K.Z.; software, W.K., K.S., and K.Z.; validation, W.K., K.P.-M. and M.C.; formal analysis, W.K., K.S., and K.P.-M.; investigation, K.S., K.Z., W.K., and K.P.-M.; resources, W.K., K.S., M.C.; writing—original draft preparation, W.K.; writing—review and editing, K.S., W.K.; visualization, W.K., and K.S.; supervision, W.K., K.S. All authors have read and agreed to the published version of the manuscript.

Funding

This article was financed by a subsidy: AGH University of Science and Technology, Krakow, Poland, No. 16.16.100.215.

Conflicts of Interest

The authors wish to confirm that there are no known conflicts of interest associated with this publication and there has been no significant financial support for this work that could have influenced its outcome.

References

  1. Tarkowski, R. Some aspects of underground hydrogen storage. Geol. Rev. 2017, 65, 282–291. [Google Scholar]
  2. Chromik, M.; Korzeniowski, W. Supporting method for salt caverns leaching—Initial computer simulations. In Proceedings of the XXIV International Salt Symposium ‘Quo Vadis Sal’, Salt Caverns as Components of Pro-Ecological Energy Policy, Żnin, Poland, 9–11 October 2019; Jaworska, J., Nowińska, J., Eds.; Polish Salt Mining Association: Kraków, Poland, 2019; pp. 28–29. [Google Scholar]
  3. Kunstman, A.; Poborska-Młynarska, K.; Urbańczyk, K. Solution Mining in Salt Deposits. Outline of Recent Development Trends; AGH University of Science and Technology: Kraków, Poland, 2007; p. 20. [Google Scholar]
  4. Urbańczyk, K. Sources of our knowledge about leaching process (Salt cavern leaching process p. I). Salt Rev. 2015, 11, 32–43. [Google Scholar]
  5. Wippich, M.; Kleczar, M.; Wilke, F. Geolological Exploration for Storage Cavern Construction in the Zuidwending Salt Dome, The Netherlands. In Proceedings of the SMRI Fall 2010 Technical Conference, Leipzig, Germany, 3–6 October 2010. [Google Scholar]
  6. Wanyan, Q.; Ding, G.; Zhao, Y.; Li, K.; Deng, J.; Zheng, Y. Key technologies for salt-cavern underground gas storage construction and evaluation and their application. Nat. Gas Ind. B 2018, 5, 623–630. [Google Scholar] [CrossRef]
  7. Jinlong, L.; Shi, X.; Yang, C.; Li, Y.; Wang, T.; Ma, H.; Shi, H.; Li, J.; Liu, J. Repair of irregularly shaped salt cavern gas storage by re-leaching under gas blanket. J. Nat. Gas Sci. Eng. 2017, 45, 848–859. [Google Scholar] [CrossRef]
  8. Zheng, Y.; Zhao, Y.; Ding, G.; Wu, Z.; Lu, S.; Lai, X.; Qiu, X.; Yang, N.; Han, B.; Wang, L. Solution mining technology of enlarging space for thick-sandwich salt cavern storage. Pet. Explor. Dev. 2017, 44, 139–145. [Google Scholar] [CrossRef]
  9. Song, X.; Li, G.; Yuan, J.; Tian, Z.; Shen, R.; Yuan, G.; Huang, Z. Mechanisms and field test of solution mining by self-resonating cavitating water jets. Pet. Sci. 2010, 7, 385–389. [Google Scholar] [CrossRef] [Green Version]
  10. Oh, T.-M.; Cho, G.-C. Rock Cutting Depth Model Based on Kinetic Energy of AbrasiveWaterjet. Rock Mech. Rock Eng. 2016, 49, 1059–1072. [Google Scholar] [CrossRef]
  11. Urbańczyk, K. Physical and mathematical description of leaching process. (Salt cavern leaching process p. II). Salt Rev. 2017, 13, 47–66. [Google Scholar]
  12. Arab, P.B.; Celestino, T.B. A microscopic study on kerfs in rocks subjected to abrasive waterjet cutting. Wear 2020, 448–449, 203210. [Google Scholar] [CrossRef]
  13. Gryc, R.; Hlaváč, L.M.; Mikoláš, M.; Šancer, J.; Daněk, T. Correlation of pure and abrasive water jet cutting of rocks. Int. J. Rock Mech. Min. Sci. 2014, 65, 149–152. [Google Scholar] [CrossRef]
  14. Kim, J.-G.; Song, J.-J. Abrasive water jet cutting methods for reducing blast-induced ground vibration in tunnel excavation. Int. J. Rock Mech. Min. Sci. 2015, 75, 147–158. [Google Scholar] [CrossRef]
  15. Oh, T.-M.; Joo, G.-W.; Cho, G.-C. Effect of Abrasive Feed Rate on Rock Cutting Performance of Abrasive Waterjet. Rock Mech. Rock Eng. 2019, 52, 3431–3442. [Google Scholar] [CrossRef]
  16. Pierri, L.C.; Pacheco dos Santos, R.; José dos Passos, J., Jr.; Pains, A.M.; Noronha, M.A.M. High pressure abrasive water jet for excavation purpose: A tridimensional approach for cutting strategy. REM Int. Eng. J. 2019, 72, 25–230. [Google Scholar] [CrossRef] [Green Version]
  17. Song, D.; Wang, E.; Li, Z.; Zhao, E.; Xu, W. An EMR-based method for evaluating the effect of water jet cutting on pressure relief. Arab. J. Geosci. 2015, 8, 4555–4564. [Google Scholar] [CrossRef]
  18. Song, D.; Wang, E.; Liua, Z.; Liu, X.; Shen, R. Numerical simulation of rock-burst relief and prevention by water-jet cutting. Int. J. Rock Mech. Min. Sci. 2014, 70, 318–331. [Google Scholar] [CrossRef]
  19. Averin, E. Universal Method for the Prediction of Abrasive Waterjet Performance in Mining. Engineering 2017, 3, 888–891. [Google Scholar] [CrossRef]
  20. Liu, Z.H.; Du, C.L.; Zheng, Y.L.; Zhang, Q.B.; Zhao, J. Effects of nozzle position and waterjet pressure on rock-breaking performance of roadheader. Tunn. Undergr. Space Technol. 2017, 69, 18–27. [Google Scholar] [CrossRef]
  21. Gauert, C.D.K.; Van der Westhuizen, W.A.; Claasen, J.O.; Viljoen, S.; Grobler, J. A progress report on ultra-high-pressure waterjet cutting underground: The future of narrow reef gold and PGE mining. J. S. Afr. Inst. Min. Metall. 2013, 113, 441–448. [Google Scholar]
  22. Korzeniowski, W.; Chromik, M. The method of cavern leaching, especially in the rock salt deposit. Patent Application, no: P.427305. Pat. Off. Bull. 2019, 14, 34. [Google Scholar]
  23. Polish Geological Institute. National Research Institute. Available online: https://www.pgi.gov.pl/en (accessed on 12 March 2020).
  24. Salt Caverns Can Be Used as Hydrogen Storage. Available online: https://www.energetyka24.com (accessed on 12 March 2020).
  25. Gas Storage Poland sp. z o.o. PGNiG S.A. Available online: https://ipi.gasstoragepoland.pl/pl/menu/#mapa-strony (accessed on 18 March 2020).
  26. Solino Orlen Group. Available online: https://www.solino.pl/PL (accessed on 18 March 2020).
  27. Burliga, S.; Czapowski, G.; Misiek, G.; Poborska-Młynarska, K.; Garlicki, A. Możliwości Utrzymania Produkcji w Kopalni Soli “Kłodawa” oraz Koncepcji jej Likwidacji w Świetle Obecnego Rozpoznania Budowy Geologicznej, Zagrożeń Naturalnych i Geomechanicznych Skutków Wieloletniej Eksploatacji. Etap I. Aktualizacja Budowy Geologicznej Wysadu Solnego w Granicach Obszaru Górniczego Kopalni Soli “Kłodawa” z Wnioskami dla Dalszego jej Funkcjonowania; Fundacja “Nauka i Tradycje Górnicze“, AGH: Kraków, Poland, 2004; unpublished. [Google Scholar]
  28. Wachowiak, J. Poziomy mineralne w solach cechsztyńskiego wysadu solnego Kłodawa jako narzędzie korelacji litostratygraficznej. Geologia 2010, 36, 367–393. [Google Scholar]
  29. Poborski, J. Obraz Stosunków Geologicznych w Przekroju Przez Okolice Wieliczki; Studia i Materiały do Dziejów Żup Krakowskich w Polsce; Muzeum Żup Krakowskie: Wieliczka, Poland, 1977; Volume 6. [Google Scholar]
  30. Garlicki, A. Sedymentacja Soli Mioceńskich w Polsce; Prace Geologiczne/Polska Akademia Nauk. Oddział w Krakowie. Komisja Nauk Geologicznych; Zakład Narodowy im. Ossolińskich Wydawnictwo PAN: Wrocław/Warszawa, Poland, 1979; p. 119. ISSN 0079-3361. [Google Scholar]
Figure 1. Salt caverns: (a) reverse leaching; (b) direct leaching.
Energies 13 01911 g001
Figure 2. Test stands for cutting out niches in rock samples: (a) water jet in the air; (b) water jet in water; 1—rock sample; 2—water nozzle; 3—water jet.
Energies 13 01911 g002
Figure 3. Water nozzle (STM Stein-Moser GmbH) during the salt rock cutting test.
Energies 13 01911 g003
Figure 4. Salt rock samples after with niches cut by means of high-pressure water jets: (a) “green salt”; (b) “spiza” (bronze) salt; (c) “pink salt”. (The shallower niches were cut mechanically).
Energies 13 01911 g004
Figure 5. (a) Cross-section of the upper part of the Kłodawa salt dome, Central Poland (after Burliga 2004 [27], simplified by the authors); (b) stratigraphic profile of the Upper Permian (Zechstein) in the Kłodawa salt dome with matched Youngest Halite stratigraphic level (after Wachowiak 2010, [28], simplified and modified by the authors).
Energies 13 01911 g005
Figure 6. (a) Cross-section of the Wieliczka salt deposit, Central Poland (after Poborski 1977, [29], simplified by the authors); (b) stratigraphic profile of the Miocene (Badenian) salt deposit in Wieliczka mine, with matched Spiza Salt and Green Bedded Salts stratigraphic levels (after Garlicki 1979, [30], simplified and modified by the authors).
Energies 13 01911 g006
Figure 7. Comparison of average depth of cut niche as a function of water cutting time for various rocks. Nozzle’s displacement velocity v = 100 (mm/min). Water jet pressure p = 500 bar.
Energies 13 01911 g007
Figure 8. Dependence of the nozzle’s distance from the salt contact surface and average increases in niche depth after one cycle. Nozzle’s displacement velocity v = 100 mm/min. Water jet pressure p = 500 bar.
Energies 13 01911 g008
Figure 9. Average depth of cut niche as a function of water cutting time—Spiza salt. Nozzle’s displacement velocity v = 100 (mm/min). Water jet pressure p = 500 bar.
Energies 13 01911 g009
Figure 10. Dependence of the nozzle’s distance from the salt contact surface and average increases in niche depth after one cycle. Nozzle’s displacement velocity v = 100 (mm/min). Water jet pressure p = 500 bar.
Energies 13 01911 g010
Figure 11. Average depth of cut niche as a function of water cutting time-pink salt. Nozzle’s displacement velocity v = 100 (mm/min). Water jet pressure p = 500 bar.
Energies 13 01911 g011
Figure 12. Dependence of the nozzle’s distance from the salt contact surface and average increases in niche depth after one cycle. Nozzle’s displacement velocity v = 100 (mm/min). Water jet pressure p = 500 bar.
Energies 13 01911 g012
Figure 13. Average depth of cut niche as a function of water cutting time—granite and sandstone. Nozzle’s displacement velocity v = 100 (mm/min). Water jet pressure p = 500 bar.
Energies 13 01911 g013
Table 1. Salt production in brine in Poland [23].
Mine/DepositSalt Yield in Brine, in Thousand TonsContribution in the National Production (%)
YearYear
2014201520162017201820142015201620172018
Góra and Mogilno I2950270631253243281770.478.0376.669.668.3
Mechelinki46925647460943211.27.411.613.110.5
Table 2. Underground storages in salt caverns, Poland.
Salt DepositEnterpriseStored ProductStorage Capacity (mln m3)
Mogilno II, salt domeKPMG MogilnoNatural gas585.40
Góra, salt domePMRiP GóraCrude oil4.250
Petroleum
Heating oil
1.880
Mechelinki, salt seamKPMG KosakowoNatural gas239.40
Table 3. Results of measurements of high-pressure water jet niche cutting parameters—“green salt” type.
Green Salt—Sample Z1
Cycle time, t(min)Nozzle-rock surface distance, H(mm)Local depth of niche, hi (mm)Average depth, h (mm)Average depth increase rate, Vh (mm/min)Average depth increase of niche in a cycle, dh (mm)
Current measuring position, xi (mm)
0255075100
12345678910
150.0022.7019.5813.1521.7817.4818.9414.9018.94
268.9439.4736.8932.2437.9534.9236.2917.36
386.2954.6544.9551.8651.1546.1249.7513.45
499.7566.1970.0163.2867.0059.7265.2415.49
5115.2473.7781.4080.9687.3568.2978.3513.11
6128.3592.90100.00100.0095.3086.8095.0016.65
min:13.11
max:17.36
Green Salt—Sample Z2
Cycle time, t(min)Nozzle-rock surface distance, H(mm)Local depth of niche, hi (mm)Average depth, h (mm)Average depth increase rate, Vh (mm/min) Average depth increase of niche in a cycle, dh (mm)
Current measuring position, xi (mm)
0255075100
12345678910
150.0012.5713.8715.0414.3213.2613.8113.9713.81
263.8128.1832.2632.1526.1829.2729.6115.80
379.6142.4345.7043.2836.9834.3040.5410.93
490.5455.7263.5360.8447.6443.9654.3413.80
5104.3479.3379.3275.3260.2059.4070.7116.38
6120.7193.7092.7690.0072.4672.0284.1913.47
7134.19100.00100.00100.00100.00100.00100.0015.81
min:10.93
max:16.38
Green Salt—Sample Z3 (below Water)
Cycle time, t(min)Nozzle-rock surface distance, H(mm)Local depth of niche, hi (mm)Average depth, h(mm)Average depth increase rate, Vh (mm/min)Average depth increase of niche in a cycle, dh (mm)
Current measuring position, xi (mm)
0255075100
12345678910
152.7020.6220.6517.2311.6416.2217.2716.2317.27
269.9748.6045.9036.8036.2033.8040.2622.99
392.9663.9254.7055.3354.2049.9055.6115.35
4108.3172.6076.4673.1864.1161.9969.6714.06
5122.37100.0077.7074.00100.0067.0083.7414.07
min:14.06
max:22.99
Table 4. Results of measurements of high-pressure water jet niche cutting parameters—“Spiza (bronze) salt” type.
Spiza Salt—Sample S1
Cycle time, t(min)Nozzle-rock surface distance, H (mm)Local depth of niche, hi (mm)Average depth, h (mm)Average depth increase rate, Vh (mm/min)Average depth increase of niche in a cycle, dh (mm)
Current measuring position, xi (mm)
0255075100
12345678910
150.0011.339.899.9212.399.1410.5310.4110.53
260.5318.2219.3720.6822.8020.2620.279.73
370.2728.6031.4033.6834.7127.6031.2010.93
481.2039.2239.0238.2541.0541.7039.858.65
589.8551.8350.5252.0750.7046.1050.2410.40
6100.2461.2265.0960.0460.2062.5061.8111.57
7111.8172.6175.1572.1271.0267.5171.689.87
8121.6882.1085.6481.4084.0383.1583.2611.58
9133.2695.6793.9898.3793.4187.0293.6910.43
min:8.65
max:11.58
Spiza Salt—Sample S2
Cycle time, t(min)Nozzle-rock surface distance, H (mm)Local depth of niche, hi (mm)Average depth, h (mm)Average depth increase rate, Vh (mm/min) Average depth increase of niche in a cycle, dh (mm)
Current measuring position, xi (mm)
0255075100
12345678910
150.009.609.667.097.545.327.8410.577.84
257.8421.4119.4621.1018.4114.7119.0211.18
369.0234.0630.3831.8027.7022.1529.2210.20
479.2239.1053.7340.4046.0833.2242.5113.29
592.5154.3656.2251.3047.1339.4149.687.18
699.68100.0065.2061.1055.6650.9566.5816.90
7116.58100.0072.5571.1265.8258.7773.657.07
8123.65100.0081.3180.4677.1067.4081.257.60
9131.25100.00100.0090.5888.7577.7891.4210.17
min:7.07
max:16.90
Spiza Salt—Sample S3 (below Water)
Cycle time, t(min)Nozzle-rock surface distance, H(mm)Local depth of niche, hi (mm)Average depth, h(mm)Average depth increase rate, Vh (mm/min)Average depth increase of niche in a cycle, dh (mm)
Current measuring position, xi (mm)
0255075100
12345678910
152.708.818.759.147.987.258.398.108.39
261.0916.1016.7520.0819.5514.0517.318.92
370.0125.4626.0228.4433.0317.3526.068.75
478.7633.0833.4536.5542.3329.2034.928.86
587.6239.4041.7140.5450.4537.1341.856.92
694.5549.9748.1550.8059.6944.6550.658.81
7103.3557.2354.9574.2565.0148.4759.989.33
8112.6858.4965.6373.7770.7460.2465.775.79
9118.4761.0273.3182.4280.3565.4072.506.73
10125.2064.3080.39100.00100.0068.5282.6410.14
min:5.79
max:10.14
Table 5. Results of measurements of high-pressure water jet niche cutting parameters—“pink salt” type.
Pink Salt—Sample R1
Cycle time, t(min)Nozzle-rock surface distance, H(mm)Local depth of niche, hi (mm)Average depth, h (mm)Average depth increase rate, Vh (mm/min)Average depth increase of niche in a cycle, dh (mm)
Current measuring position, xi (mm)
0255075100
12345678910
150.0019.8220.2015.7311.8211.8015.8718.5715.87
265.8738.2938.2432.1629.3533.6334.3318.46
384.3358.6557.6749.1446.6050.9952.6118.28
4102.6188.8471.4161.7660.1164.3269.2916.68
5119.29100.0089.0074.8492.50100.0091.2721.98
min:15.87
max:21.98
Pink Salt—Sample R2
Cycle time, t (min)Nozzle-rock surface distance, H(mm)Local depth of niche, hi (mm)Average depth, h (mm)Average depth increase rate, Vh (mm/min)Average depth increase of niche in a cycle, dh (mm)
Current measuring position, xi (mm)
0255075100
12345678910
150.0017.4011.128.7011.356.4010.9918.1410.99
260.9931.8021.3430.8031.9718.5426.8915.90
376.8938.9839.6533.8244.8132.9038.0311.14
488.0364.4063.0160.4773.8842.6460.8822.85
5110.8884.2085.40100.0089.4662.0384.2223.34
6134.22100.00100.00100.00100.0095.0099.0014.78
min:10.99
max:23.34
Pink Salt—Sample R3 (below Water)
Cycle time, t (min)Nozzle-rock surface distance, H (mm)Local depth of niche, hi (mm)Average depth, h (mm)Average depth increase rate, Vh (mm/min)Average depth increase of niche in a cycle, dh (mm)
Current measuring position, xi (mm)
0255075100
12345678910
152.7017.6010.534.5022.6019.0714.8610.3014.86
267.5631.3022.258.2529.6219.2722.147.28
374.8435.8433.8311.8536.7532.9030.238.10
482.9344.4237.3012.5853.2245.4638.608.36
591.3054.7738.2813.0862.3057.1545.126.52
697.8264.7755.4527.7085.7973.7261.4916.37
7114.1979.7179.0058.0694.2288.2679.8518.36
min:6.52
max:18.36
Table 6. Comparative results of measurements of niche cutting parameters for granite.
GRANITE—Sample G
Cycle time, t (min)Nozzle-rock surface distance, H (mm)Local depth of niche, hi (mm)Average depth, h (mm)Average depth increase rate, Vh (mm/min)Average depth increase of niche in a cycle, dh (mm)
Current measuring position, xi (mm)
0255075100
12345678910
150.000.080.130.821.391.080.700.640.70
250.700.121.151.271.401.151.020.32
351.020.761.311.702.031.761.510.49
451.511.201.651.702.404.302.250.74
552.251.511.752.704.304.512.950.70
652.952.732.222.786.055.603.880.92
min:0.32
max:0.92
Granite—Sample G (below Water: 52.7 mm)
Cycle time, t (min)Nozzle-rock surface distance, H (mm)Local depth of niche, hi (mm)Average depth, h (mm)Average depth increase rate, Vh (mm/min)Average depth increase of niche in a cycle, dh (mm)
Current measuring position, xi (mm)
0255075100
12345678910
152.700.050.580.670.340.220.37 0.37
Table 7. Comparative results of measurements of niche cutting parameters for sandstone.
Sandstone—Sample P1
Cycle time, t (min)Nozzle-rock surface distance, H (mm)Local depth of niche, hi (mm)Average depth, h (mm)Average depth increase rate, Vh (mm/min)Average depth increase of niche in a cycle, dh (mm)
Current measuring position, xi (mm)
0255075100
12345678910
150.003.914.724.104.425.224.471.904.47
254.476.747.516.698.127.907.392.92
357.398.969.428.8810.7910.189.652.25
459.6411.0110.9210.4612.5412.4711.481.83
561.4811.5412.9911.9313.1114.2512.761.28
662.7613.2014.9213.2614.2715.3414.201.43
min:1.28
max:2.92
Sandstone—Sample P2
Cycle time, t (min)Nozzle-rock surface distance, H (mm)Local depth of niche, hi (mm)Average depth, h (mm)Average depth increase rate, Vh (mm/min)Average depth increase of niche in a cycle, dh (mm)
Current measuring position, xi (mm)
0255075100
12345678910
150.004.324.084.654.905.754.741.994.74
254.747.267.117.437.148.747.542.80
357.549.449.3710.949.5411.8310.222.69
460.2211.2011.4713.6012.0113.8512.432.20
562.4312.8912.5814.2612.8615.6113.641.21
663.6414.2013.4515.3314.0915.6514.540.90
min:0.90
max:2.80
Sandstone—Sample P3 (below water: 52.7mm)
Cycle time, t (min)Nozzle-rock surface distance, H (mm)Local depth of niche, hi (mm)Average depth, h (mm)Average depth increase rate, Vh (mm/min)Average depth increase of niche in a cycle, dh (mm)
Current measuring position, xi (mm)
0255075100
12345678910
152.703.622.892.742.613.663.101.973.10
255.805.944.403.504.197.155.041.93
357.748.045.765.844.338.076.411.37
459.118.227.857.355.229.567.641.23
560.3411.3011.9011.1012.1511.7711.644.00
664.3411.4712.1713.7013.1012.1512.520.87
min:0.87
max:4.00
Table 8. Average depth increase of niches cut with water jet for various types of rocks.
Type of RockAverage Depth Increase of Niche, dh (mm/min)
SampleSample below Water
MinMaxAverageMinMaxAverage
Green salt10.9317.3614.4414.0622.9916.23
Spizowa salt7.0716.9010.495.7910.148.10
Pink salt10.9923.3418.366.5218.3610.30
Strong rocks
Granite0.320.920.64--0.37
Sandstone0.902.921.950.874.001.97
Water jet parameters
Diameter of jet (nozzle). d (mm)1.00
Pressure. p (bar)500
Jet flow velocity. V (m/s)25.40
Nozzle’s displacement velocity. v (mm/min)100
Flow rate Q (liter/min)1.18

