Abstract
The disclosing of new diffusion frontiers for wind energy, like deep-water offshore applications or installations in urban environments, is putting new focus on Darrieus vertical-axis wind turbines (VAWTs). To partially fill the efficiency gap of these turbines, aerodynamic developments are still needed. This work in particular focuses on the development of a mathematical model that allows predicting the possible performance improvements enabled in a VAWT by application of the Gurney flaps (GFs) as a function of the blade thickness, the rotor solidity and geometry of the Gurney flap itself. The performance of airfoil with GFs was evaluated by means of detailed simulations making use of computational fluid dynamics (CFD). The accuracy of the CFD model was assessed against the results of a dedicated experimental study. In the simulations, a dedicated method to simulate cycles of variation of the angle of attack similar to those taking place in a cycloidal motion (rather than purely sinusoidal ones) was also developed. Based on the results from CFD, a multidimensional interpolation based on the radial basis functions was conducted in order to find the GF design solution that provides the highest efficiency for a given turbine in terms of airfoil and solidity. The results showed that, for the selected study cases based on symmetric airfoils, the GF positioned facing outwards from the turbine, which provides the upwind part of the revolution, can lead to power increments ranging from approximately 30% for the lower-solidity turbine up to 90% for the higher-solidity turbine. It was also shown that the introduction of a GF should be coupled with a re-optimization of the airfoil thickness to maximize the performance.
1. Introduction
1.1. Background
The interest in cheap and environment friendly electrical energy generation, lately driven also by the need for meeting stricter standards of clean energy production, has resulted in a wide range of scientific research on the subject of renewable energy sources. One of the leading technologies is wind energy, which is reaching a cost of energy competitive (in the case of large rotors) with other conventional sources. Although the majority of installed wind energy power today comes from wind farms made of several large horizontal axis wind turbines (HAWTs), the disclosing of new diffusion frontiers like deep-water offshore applications or installations in densely inhabited environments are putting new focus on different turbine architectures, like Darrieus vertical axis wind turbines (VAWTs) [1]. This technology has some undisputed advantages (e.g., the insensitivity to wind direction, the possibility of putting the generation system on the ground, the lower susceptibility to highly turbulent flows [2,3]), but their efficiency is lower compared to that of HAWTs. This is not only due to intrinsically more complex aerodynamics with a continuous variation of the angle of attack (AoA), often leading to dynamic stall [4], but also due to the lack of systematic scientific research from their conception in the 1920s up to the 1990s [2]. If this efficiency gap is somehow filled, many scientists forecast a significantly more important role of VAWTs in the near future [5].
Among different approaches to reach this scope, lately increasing attention is given to the possibility of applying passive flow control devices to Darrieus blades [6], in order to delay the onset of stalls and improve the lift-to-drag ratio, especially at medium-low Reynolds numbers. Gurney flaps (GFs) are one of the technologies in the spotlight. In the early 1970s, the American racing driver Dan Gurney came out with an idea to fix a short metal bar at the trailing edge on his racing car rear wing. After conducting few tests, he found out that this simple modification allowed approaching turns with higher velocity and also increasing the car speed on straight lines. The simple construction of this device has encouraged researchers to investigate its application in different areas [7,8,9,10], and especially in wind turbines, where they do represent one of the most interesting solutions [11,12]. It has been found that the effect of the lift coefficient enhancement of the GF is connected with the change of the flow structure at the trailing edge, as it is shown in Figure 1, which reports the vorticity contours near the trailing edge of the airfoil. The two large separation bubbles around the sharp trailing edge are replaced by two thinner vortices inducing a lower drag. The Gurney flap also delays the flow separation to a higher angle of attack. The gain on the lift coefficient is burdened with increments of the drag coefficient. Thus, it is a particularly good solution in case of applications where the drag force is of minor importance, like in the case of Darrieus VAWTs.

Figure 1.
(A) Flow field around smooth airfoil; (B) flow field around an airfoil with a Gurney flap (field data of vorticity from numerical calculation of the authors).
1.2. Objectives
The aim of the present study is to assess the possible benefits provided by GFs if used on airfoils subject to continuous variations of the angle of attack, as in the blades of Darrieus wind turbines. More specifically, focus is given to the symmetric NACA 4-digits airfoils, which have been shown to be particularly effective in VAWTs [13]. The airfoil thickness represents the first investigated parameter; values of 12% chord (NACA0012), 15% chord (NACA0015), 18% chord (NACA0018), and 21% chord (NACA0021) are considered. Then, the impact of different heights and shapes of the GFs on the performance of these airfoils is evaluated in static conditions, but also in dynamic pitching movements. It is often erroneously thought that the variation of the angle of attack in the Darrieus-type cycloidal motion can be modeled as a pure pitching motion. However, different energy extractions take place upwind and downwind, which in turn impose a notable variation of the AoA in those zones [2]. Moreover, the change of sign of the AoA in proximity of the azimuthal positions of 0° and 180° leads to very sudden variation rates, which are also responsible for the onset of dynamic stall [14].
To meet the objectives described above, the use of computational fluid dynamics (CFD) is mandatory. Due to the complex flow structures taking place behind the GF, the continuous variation of the AoA, and the existence of large separated regions when the stall appears, the simpler modeling methods (e.g., a panel method) are insufficient for this scope [6,15]. In order to limit the computational cost, the unsteady Reynolds-averaged formulation of the Navier–Stokes equations (URANS approach) is used for the presented analyses as the best compromise. Due to the wide range of spatial and temporal scales that need to be captured in the flow features in the presented problem, more accurate methods addressing the turbulent flows such as direct numerical simulation (DNS) or large eddy simulation (LES) would be in fact unusable. In addition, recent examples in the literature showed that the proposed approach is able to properly capture all the effects connected to the use of GFs [6]. A key original model developed for the study presented in this paper is represented by the definition of AoA variations that match exactly the functioning conditions in a broad range of Darrieus VAWTs. These were defined upon combination of detailed full-CFD simulations carried out by the authors and computation of airfoil in pitching motion. Finally, the obtained results were extended using radial basis functions (RBFs) interpolation to provide a comprehensive overview of the effects of GFs installation on the performance of selected airfoils.
1.3. Organization of the Study
The study is organized as follows. Section 2 presents the study cases that have been used both for the calibration and validation of the numerical approach and for the sensitivity analyses. Section 3 presents the methods that were used for the analysis. A description of the CFD settings, including their validation, is first presented; then, the development of the AoA variation trends that mimic the Darrieus functioning is discussed. Section 4 is the main body of the study, including results obtained for static airfoils as well as results obtained for dynamic airfoils in Darrieus-like motion. In this section the multivariate sensitivity analysis based on the radial basis functions (RBFs) interpolation is presented. Section 5 summarizes the main outcomes of the study.
2. Study Cases
2.1. Experimental Validation Benchmark
In order to assess the effectiveness of the numerical techniques prior to proceed with the extended sensitivity analysis on the GF effects on the airfoil in Darrieus-like motion, an experimental benchmark was identified. In particular, the test case presented by researchers from the Technical University (TU) of Berlin in [16] was used. Dedicated experimental studies were conducted inside the laminar wind tunnel of the Hermann Föttinger Institute. The tested airfoil was NACA0021 with the Gurney flap on the pressure side. As discussed, this airfoil was also used in one of the study cases of the sensitivity analysis; therefore the experimental case was then fully representative for the scope of this study.
In [17] the authors presented a variety of tests with different Reynold numbers (Re = 140 k and Re = 180 k) and GF size and mounting configuration. For the sake of brevity, the CFD validation was here reported only for the configuration with the GF conventionally mounted on the pressure side, depicted in Figure 2, which shows a sketch of the Gurney flap geometry used in the experiments. Table 1 reports the chosen test conditions for the validation and the Gurney flap height is given by a percentage value of chord length. For any additional details on experimental measurements (which are not the original content of the present work), please refer to [17].
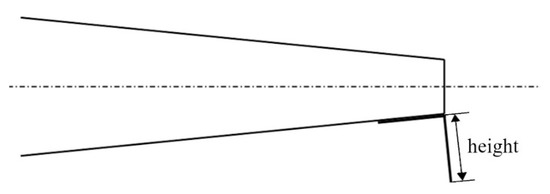
Figure 2.
Experimental Gurney flap (GF) geometry.

Table 1.
Details of the experimental setup.
2.2. Gurney Flaps
Two different types of Gurney flap mounting were investigated (represented in Figure 3). In further detail, the conventional one-side mounting (A) is the most common method, generally including the GF mounted towards the pressure side of the airfoil. In case of functioning onboard a Darrieus turbine, however, each side of the airfoil acts alternatively as the pressure or suction side depending on the fact that the blade is moving in the upwind or downwind half of the trajectory [18]. On this basis, both the configuration with the GF facing out and the one facing in with respect to the revolution centre were tested. In addition to these configurations, the one presented in Figure 3B, called “fish tail” in the following, was also tested. This configuration was thought to somehow reply to the contrasting requests discussed before, i.e., it is able to provide the power augmentation both for positive and negative incidence angles, partially limiting the additional drag coming from the half working in the suction side by inclining it with respect to the chord. In this sense, it can be considered as an evolution of the “both-side” configuration tested in [6].
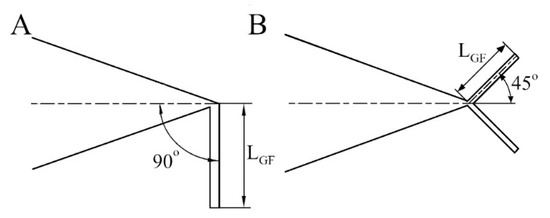
Figure 3.
GF configurations: (A) one-side GF; (B) fish tail GF.
For the scopes of the present work, the two configurations were tested with GFs having a length varying in the range of 0% to 5% of the chord length.
2.3. Test Plan
As discussed, the scope of the study was to evaluate the effectiveness of GFs as power augmentation devices when operating on board Darrieus turbine. To this end, three configurations of an airfoil in cycloidal motion were considered. The idea was to reproduce realistic functioning conditions in terms of Reynolds number, AoA variation trend, and inflow. On this basis, relevant study cases were selected from the literature, with particular attention to those already tested by some of the authors and for which a relevant body of data was available. The configurations are summarized in Table 2. Upon examination of the table, one can notice that one important parameter that has been taken into account is the equivalent turbine solidity, calculated as in Equation (1).

Table 2.
Summary of the operational conditions considered for the study cases.
The solidity of the rotor is in fact an index of how much the turbine is “permeable” to the flow, thus of how much the energy extraction is unbalanced between the upwind and the downwind portion of the revolution. In more detail, the higher the solidity, the more kinetic energy from the wind is harvested by the upwind part and the less energy can be harvested by the downwind part. The velocity used to calculate the blade Reynolds number, presented in Table 2, is an average value of the relative wind velocity during the revolution. The turbine tip-speed ratio (TSR) is conventionally defined as the ratio between the peripheral speed of the airfoil and the undisturbed wind velocity.
The study cases presented in Table 2 were used in particular to extract realistic trends of variation of the angle of attack and the relative air speed on the airfoils. These curves, presented in Figure 4, were obtained with the procedure described in [19] and slightly smoothed to purge them by unphysical discontinuities arising during the calculation of the induced velocity in areas of macro-vorticity, as discussed in the reference. The trends of Figure 4 were then used as an input for the sensitivity analysis on the GF effects. To this end, they were applied to four different uncambered airfoils of different thickness-to-chord ratios, namely the NACA0012, NACA0015, NACA0018, and NACA0021 (shown in Figure 5).
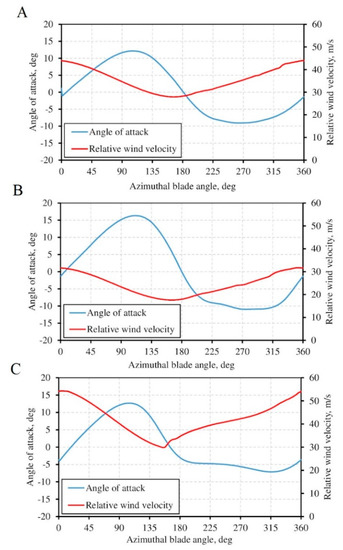
Figure 4.
Variation trends for the angle of attack and the relative wind velocity for the selected study cases.
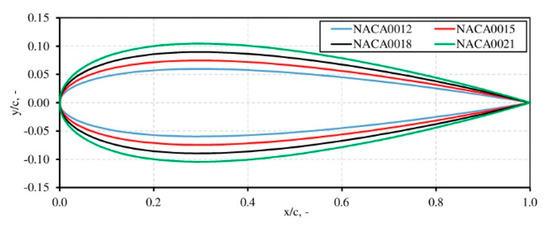
Figure 5.
Investigated NACA airfoils.
3. Methods
3.1. Numerical CFD Simulations
The computational domain adopted for the CFD simulations is depicted in Figure 6A. The domain was made in the conventional bullet shape, having a distance of 20 and 40 chords upstream and downstream of the airfoil, respectively. The dimensions of the bullet were in agreement with the most conservative suggestions that can be found in the literature. The choice of the bullet-shaped domain was due to the possibility of imposing only an inlet (at which values of the velocity vector, turbulence intensity, and turbulent viscosity ratio were assumed) and an outlet boundary (at which the value of the gauge pressure was assumed, and for all other quantities zero normal derivative was assumed), with benefits in terms of calculation stability. The same approach was followed successfully in [16]. The works by Balduzzi et al. [20] were taken as the main references in order to select the most suitable numerical settings for the solver. For the sake of completeness, an overview on the main settings of the simulation models is given in the following section.

Figure 6.
(A) Computational domain; (B) detailed view of the mesh at the trailing edge of the smooth airfoil (left) and near the GF (right).
The commercial code ANSYS® FLUENT® was used in the two-dimensional form to solve the time-dependent unsteady Reynolds-averaged Navier–Stokes (URANS) equations in a pressure-based formulation. The fluid was air, modeled as an ideal compressible gas. Based on previous experience, the validation against experiments made use of the four equations Transition SST model. This choice was due to the very low Reynolds number achieved in experiments (max 180 k), which provoked a massive impact of transition phenomena. Conversely, in the sensitivity analysis based on the realistic conditions of Table 2, the authors decided to achieve the turbulence closure by means of Menter’s SST k-ω model [21], which is a blend of k-ε and k-ω two-equation formulations. This was due to pretty higher Reynolds numbers, which made the transitional effects less relevant. Moreover, the same study cases were originally simulated with this turbulence model, which proved to be particularly effective and robust. The Coupled algorithm (non-segregated) was employed, where the Navier–Stokes equations set is directly solved through an implicit discretization of pressure in the momentum equations, with benefits in terms of robustness and convergence, as shown in [20]. The second order upwind scheme was used for the spatial discretization of the whole set of URANS and turbulence equations, as well as the bounded second order for time differencing to obtain a good resolution. To allow for the pitching movement of the airfoil, the domain was split into rotating and stationary parts. The interface was circular, having a diameter of 14C. To handle the coupling of the two domains, a general grid interface (GGI) was used. The computational mesh generated for the two domains was of the unstructured type, made with the native mesher of the ANSYS® package. Triangular elements were used throughout the domain, with a massive element refinement within the rotating region and an additional local refinement area around the GF, as shown in Figure 6B. In order to properly capture the flow behavior within the boundary layer, a 30-layer O-grid with prismatic elements was instead created around the airfoil and the GF. The first element height was always chosen so as to guarantee a dimensionless wall distance (y+) at the grid nodes of the first layer above the blade wall constantly lower than 1. According to the prescriptions of [22], the expansion ratio for the growth of elements starting from the surface was kept below 1.05 to achieve good mesh quality. A mesh dependency study was carried out to ensure that the results were not affected by mesh density and quality. Regarding the grid created for the validation of experiments, please refer to [17] for any additional details. For the spatial discretization of the airfoils with GF three different meshes were created. The y+ was lower than 1, thus the meshes differed by the number of elements along the airfoil surface and their size in the free stream area. Created meshes had around 160,000, 280,000, and 400,000 elements, respectively. The mesh sensitivity analysis was conducted for the NACA0021 airfoil with Gurney flap lengths equal to 1%, 2%, and 3% of the chord length, respectively (these values are indicated in Figure 7A–C as GF1, GF2, GF3). Different AoAs were tested, even though Figure 7 only reports the case at AoA = 0° at Re = 250 K for brevity.
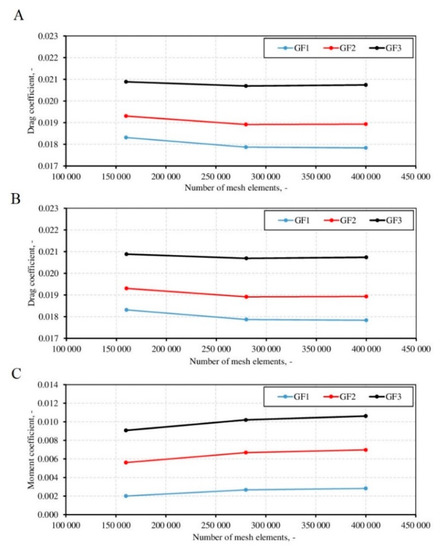
Figure 7.
Mesh quality influence on (A) lift, (B) drag, and (C) moment coefficients.
It can be observed that asymptotic convergence is reached as the mesh is refined. The mesh with a number of elements equal to 400,000 was considered as not affected by the mesh size and further computations were carried out using this mesh. The values of the coefficients presented in Figure 7 have been averaged over 500 time steps after getting a converged solution. As extensively discussed in [22], the influence of the time step size also has to be considered carefully in order to obtain the desired accuracy of the computational model. In order to perform reliable dependence studies of temporal discretization, both the one-side GF and the fish tail GF were tested, since they were thought to induce a quite different vortex shedding at the trailing edge for low AoAs (see [6]), thus leading to different characteristic Strouhal numbers. Tests were carried out using a time-step of 10−3, 10−4, and 10−5 s, respectively. Upon examination of the results, it was apparent that a time-step of 10−4 s was sufficient to achieve independent results (differences in the absolute value lower than 0.1%).
3.2. Pitching Movements and Conventions
The cycloidal motion of each blade on board a Darrieus VAWT generates a continuous variation of the angle of attack on the blade itself as a function of the relative positioning of the chord and the oncoming wind. This, in turn, leads to a variable intensity of the relative speed and to discontinuous forces exerted by the airfoils.
For the conventions used in the study, please refer to Figure 8. The overall torque T produced by the blade is given by Equation (2), where L and D are the lift and drag forces, respectively, and M it the moment around the blade-spoke connection point, which does not always correspond to the aerodynamic centre [23].
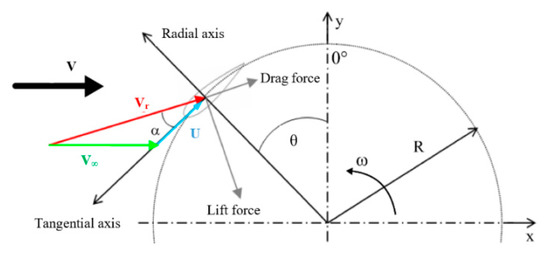
Figure 8.
Forces acting on the turbine blade.
The dependency of the AoA on the relative positioning between the blade and the wind, as well as on the force really exerted by the blade, which induces a reduction of the oncoming wind, lead to the well-known variation trends of the AoA that are non-symmetrical between the upwind and the downwind halves of the revolution and characterized by very steep variation rates. As a result, recent research works (e.g., [17]) showed that simulating a blade in pure pitching motion is not sufficient to give reliable estimation of the functioning of cycloidal motion.
To this end, in the present study, the AoA trends depicted in Figure 4 were applied directly to the blades. An average value of the Reynolds number (calculated based on the actual ones taken from CFD) was imposed at the inlet boundary, while the actual forces (lift, drag, and pitching motion) in motion were reconstructed point-by-point by means of the relative speed value also presented in the same figure, in order to have a more precise estimation. By doing so, the variation of the airfoil performance with the Reynolds number is unfortunately neglected, but this cannot be avoided in the case of a pitching approach like the one presented here. However, since each simulation is carried out with each specific equivalent TSR, this variation is thought to be sufficiently small to not compromise the accuracy of the results. In order to compare airfoils and turbines working in different conditions, the introduction of dimensionless coefficients is needed. The main coefficients used in the following of the study are the torque coefficient (Equation (3)) and the power coefficient (Equation (4)):
3.3. Radial Basis Functions (RBFs) Interpolation for Data Reduction
The parametric analysis carried out on the airfoil performance with different GFs provided only a finite set of points. In order to obtain a continuous response surface, the multivariate radial basis functions (RBFs) interpolation was applied. This method is very efficient for interpolation of large scattered data sets. It also has some drawbacks connected with unstable solutions and fast growth of the computational cost for large data series and also non-negligible error connected with Runge’s phenomenon at the boundary of the domain. Drawbacks notwithstanding, it seems to be a suitable choice for the considered case of data reduction [24].
A multivariate function Φ is called radial (RBF) if its value at each point depends only on its distance from the base point, what is written in mathematical notation as:
where is the Euclidian norm in the space and is the vector describing the position of the base point. The radial function based interpolation takes the form of a linear combination of base functions attached to all N collocation nodes giving following equation:
where is an unknown interpolation coefficient. The values of interpolation coefficients can be found by collocating the interpolation function of Equation (6) and then solving the resultant linear set of equations which can be briefly written as:
where the interpolation (or collocation) matrix is computed as:
The radial function form has to be chosen adequately with respect to the considered problem. Thus, to find the most suitable function, a dedicated analysis was carried out for different common types of radial functions. The functions are shown in Table 3.

Table 3.
Utilized radial basis functions.
The shape parameter c, which appears in the definition of different radial basis functions, is a parameter that controls the shape of the basis function and hence the size of the region of influence of a given basis function around the collocation point. The higher the value of shape parameter, the bigger is the region of influence of the basis function; unfortunately, this also causes deterioration of conditioning of the approximation problem.
It needs to be pointed out that the interpolation matrix is symmetric and positively defined, hence it is always invertible. However, by incrementing the number of nodes and consequently the number of base functions, the matrix conditioning becomes worse. The condition number of a matrix measures error is introduced by the finite arithmetic of computations on computers [25]. The matrix condition number for inversion is given by following equation:
where is the conditioning number. In case of an interpolation based on the RBFs, the conditioning number value of the interpolation matrix is strictly connected with the shape of applied interpolation function. In the case of the functions presented in Table 3, this is controlled by the shape parameter [26]. For every interpolation problem it is possible to find optimal value of the shape parameter value; see [26]. To this end, two additional simulations, regarding the geometrical parameters of the airfoil thickness and the Gurney flap length, which had not been covered during the case studies, were done for each interpolation data set. Further, based on the additional simulations, the root main square (RMS) method was used to assess the interpolation accuracy, which is given by the following equation:
where is the vector of points, which in the interpolation corresponds with the collocation points, indicates the interpolation function, and is the numerical values of the original function. Figure 9 shows the values for the matrix of conditioning number and resulting RMS error as a function of the shape parameter.
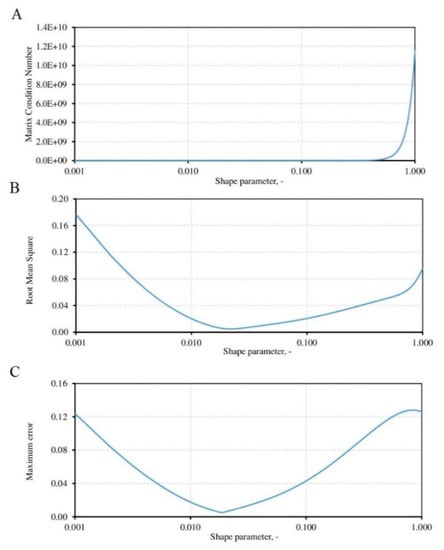
Figure 9.
Shape parameter influence on: (A) matrix conditioning number, (B) root mean square (RMS) error, (C) maximum error.
4. Results and Discussions
4.1. Experimental Assessment of the Numerical Model
As discussed, an extensive validation of the numerical model was carried out preliminary upon comparison with experimental data from the Hermann Föttinger Institute (HFI) of the TU Berlin [17].
The test case was a NACA0021 airfoil under a Reynolds number of 180 k. The numerical model was tested both in terms of static polars and in dynamic pitching motion. For the sake of brevity, only the results with a one-sided GF (2.5%c) are reported here: Figure 10 displays the comparison of static polars and Figure 11 the performance in sinusoidal movement within an AoA range between 10 and 30 deg and a reduced frequency k of 0.05.
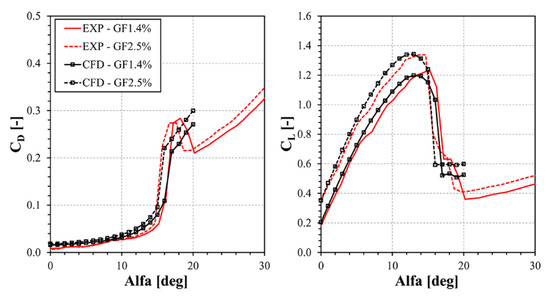
Figure 10.
Comparison experimental results and CFD computations for static flow around airfoil equipped with GF at different values of angle of attack.
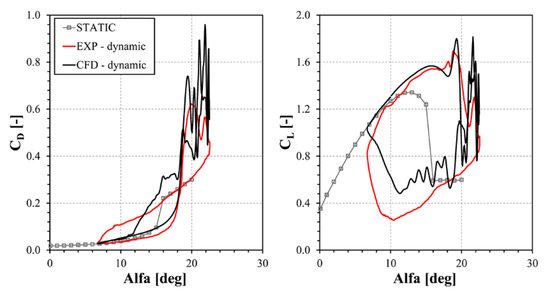
Figure 11.
Comparison experimental results and CFD computations for dynamically changed angle of attack.
It has to be remarked that the numerical data in Figure 10 were run in unsteady RANS mode for several incidence angles (see Figure 12). Figure 12, in particular, shows the contours of normalized velocity, i.e., the local velocity divided by the undisturbed one. In particular, as common practice, the use of unsteady simulations was mandatory for high AoAs after a stall, where the analysis of the residuals showed issues in convergence history, characterized by the intense fluctuations of the calculated aerodynamic forces already shown by [6].
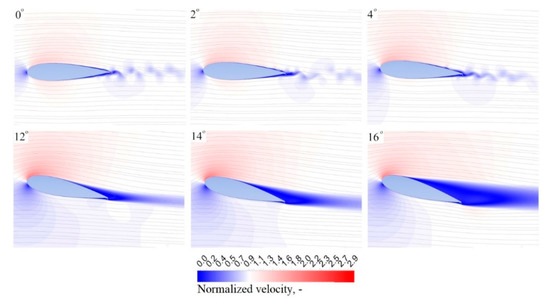
Figure 12.
Normalized velocity contours for 0°, 2°, 4° and 12°, 14°, 16° angles of attack.
In thte case of GFs, the use of unsteady simulations was also necessary for very low AoAs (between 0° and 4°), where the GF itself produces some vortices that detach alternatively from the corners and then are convected downstream. In those cases, the timestep for the simulation was based on the previous experience of [6]. Upon examination of both comparisons, sound agreement can be noted overall between experiments and simulations, proving the effectiveness of the method.
4.2. GF Effects in Cycloidal Motion: Impact on Torque Profiles
If the final expected outcome of the application of GFs to Darrieus turbines is the power enhancement (that will be discussed in detail in the next section), it is worth analyzing from a physical point of view their impact on the functioning of the airfoils during a revolution. The balance of the energy extraction between the upwind and the downwind halves of the revolution is in fact very important not only for the overall efficiency, but also for the possible creation of stresses and vibrations of the turbine.
Figure 13 shows the influence of the Gurney flap length and configuration (i.e., the single facing outward or inward, and the fish tail GF, respectively) on the torque coefficient as a function of the turbine position. Displayed data do refer to the first test case only (solidity equal to 0.057 and NACA0018), even though the physical behavior was of general validity in the case of blades in cycloidal motion. The values indicated as “No GF” show the torque distributions with the smooth airfoil.
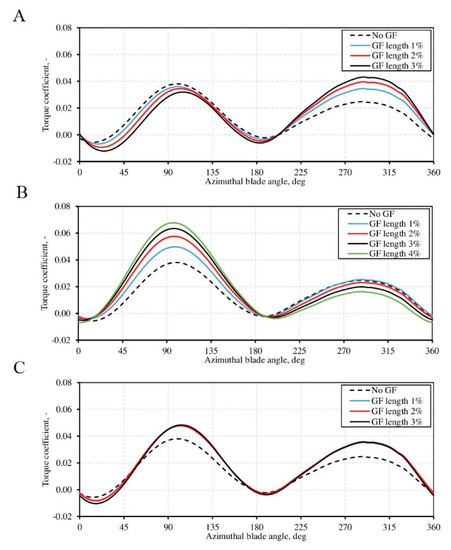
Figure 13.
(A) Outward pointing one-sided, (B) inward pointing one-sided, and (C) fish tail Gurney flap length influence on the torque distribution in function of turbine position.
Upon examination of the figure, it is apparent that the outward pointing Gurney flap tends to increase the unbalance of the torque distribution. The increment of torque in the upwind part is significant and it is connected with the lift-to-drag ratio increment induced by the GF, which is particularly relevant for the higher AoAs reached upwind. On the other hand, the torque reduction downwind is related to the increased drag at those low AoAs that derive from the low wind speed going through the rotor. The inward pointing Gurney flap instead leads to an increment of the torque coefficient along the downwind part of turbine, leading to a more balanced torque profile, even though the extracted work (i.e., the area below the curve) is pretty much the same. The fish tail configuration finally confirmed the hypothesized change in performance, providing a relative increase of the torque coefficient for both the upwind and the downwind parts of the revolution.
The relative impact to the produced power of the two halves of the machine is even more apparent from Figure 14. It is very interesting to notice that the fish tail not only provides an increase of the performance on both halves of the machine, but also a very balanced power between the two.
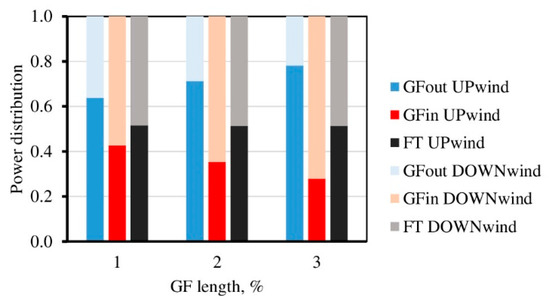
Figure 14.
Gurney flap length and configuration influence on the power extraction distribution.
4.3. GF Effects in Cycloidal Motion: Sensitivity Analysis on GF Characteristics
As discussed, the scope of the present analysis was to study the prospects of different GF configuration in terms of power augmentation of Darrieus VAWTs using symmetric airfoils. To this end, a large number of simulations were carried out. Figure 15A–C and Figure 16A–C show the results of all the studied cases in a way which allows the reader to have an overall outlook on the main effects. In further detail, the two figures show the influence of the one-sided Gurney flap (Figure 15) and the fish tail configuration (Figure 16), respectively, in terms of power coefficient variation for different airfoils thickness. Graphs A–C refer to the three different equivalent turbine solidities (increasing from A to C). The white color in the color palette indicates the reference value of the power coefficient with the smooth airfoil, the red color indicates an incremented one, and the blue color a decreased one.
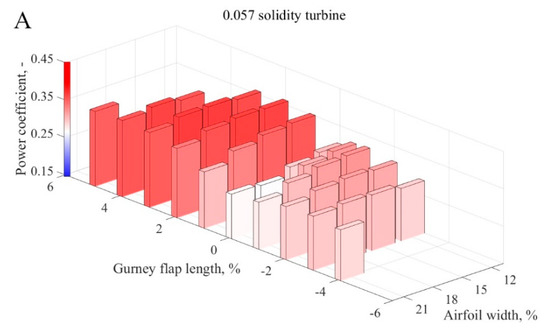
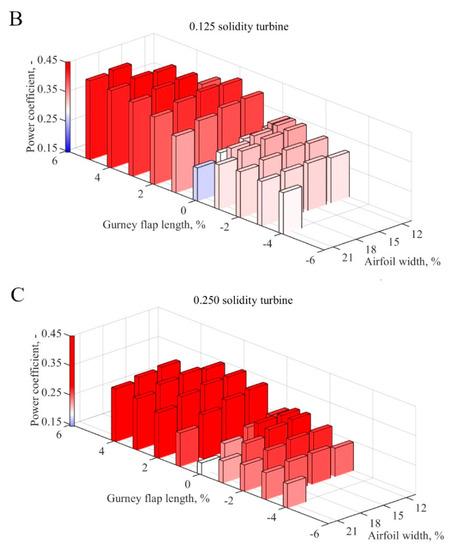
Figure 15.
Numerical model results for one-sided Gurney flap for (A) 0.057, (B) 0.125, and (C) 0.25 equivalent solidity turbines.
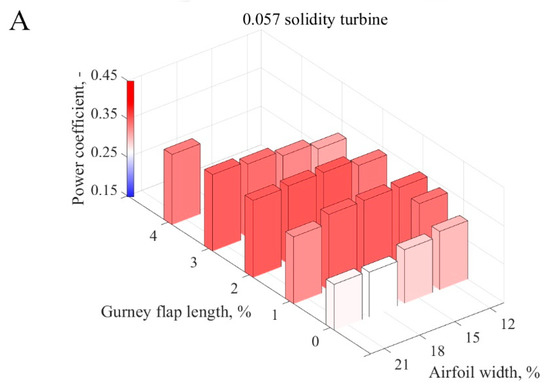
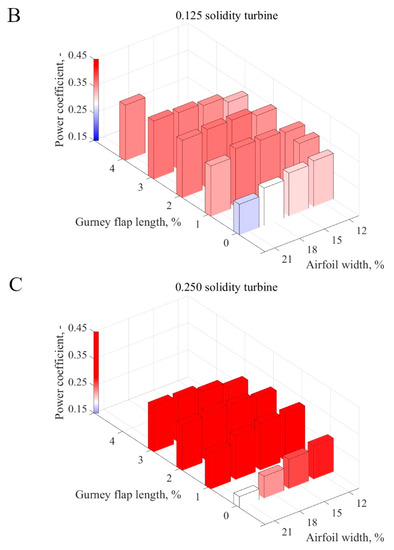
Figure 16.
Numerical model results for the fish tail Gurney flap for (A) 0.057, (B) 0.125, and (C) 0.25 equivalent solidity turbines.
Finally, the positive and negative values of Gurney flap length in Figure 15 indicate its outward and inward pointing directions, respectively, with respect to the turbine axis.
Upon examination of the graphs, some interesting observations can be noted:
- ■
- The outward positioning of the GF (if one-sided) always provided the largest power increase in a blade in cycloidal motion; however, as soon as the solidity increased, the possibility of having a more balanced energy extraction (i.e., with the inward positioning) became attractive;
- ■
- For higher solidities, the application of the GF seems to provide a constant increase of performance. This can be explained as follows: a) in case of the inward positioning, this is due to the discussed re-distribution of the energy extraction between the upwind and downwind halves. In a very solid turbine, indeed, the wind velocity oncoming to the downwind half of the revolution is very low, thus leading to small AoAs and then to a reduced torque production. In this view, adding a GF that is able to increase the performance in this region (where it acts on the pressure side of the airfoils) leads to potential benefits; b) in case of the outward positioning, the torque extraction is maximized in the upwind half (where the flow is more energized), sacrificing the performance downwind;
- ■
- For low solidities, this latter approach is the only one providing significant benefits. In this case, the torque profile is sufficiently balanced even in the original configuration and then it is more convenient to maximize the impact of the GF upwind, where the flow speeds are higher.
Due to the complexity of analyzing so much data at a glance, some relevant trends have been extracted and reported in Figure 17 and Figure 18.
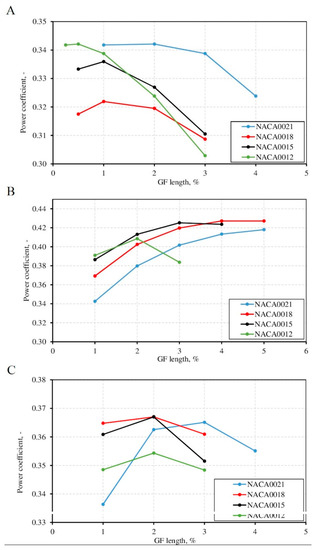
Figure 17.
Turbine power coefficient as a function of the GF length and airfoil thickness for equivalent turbine solidity 0.25: (A) inward GF, (B) outward GF, (C) fish tail.

Figure 18.
Increment of the torque value for optimal length of GFs for all investigated turbine configurations: (A) inward GF, (B) outward GF, (C) fish tail.
Figure 17 first reports the extracted power for the four tested airfoils (i.e., as a function of the thickness-to-chord ratio of the airfoils) as a function of the GF length in the case of the outward (A), inward (B), mounting, and fish tail configurations (C). The high-solidity test case was selected, even if the same considerations can be repeated for the other three cases. Upon examination of the figure, one can notice that for the inward mounting (i.e., the one privileging the downwind side), the thinner the airfoil, the higher the performance that can be achieved. Also, the optimal GF length decreases monotonically with the airfoil thickness. On the other hand, the thinner NACA0012 airfoil is more sensitive to the GF length, with steeper variation curves. This is due to the larger impact of the GF additional drag on the thin airfoil. Overall, the thicker NACA0021 airfoil shows a quite different behavior than the other ones, with flatter response curves and much larger optimal GF lengths.
On the other hand, in case of the outward mounting, the best performance is achieved for medium-solidity airfoils, where the application of a GF to very thin or very thick ones does not provide benefits. The optimal GF length keeps shifting to lower values as soon as the airfoil thickness decreases. The same analysis is repeated in case of the fish tail configuration (see Figure 17C). One can notice that the fish tail configuration provides consistent benefits for almost all the airfoils, with only the exception of the very thin one, where the draft increase is probably not compensated for by the additional lift.
Figure 18 and Figure 19 compare the optimal configurations found among the tested turbines with different values of solidity.
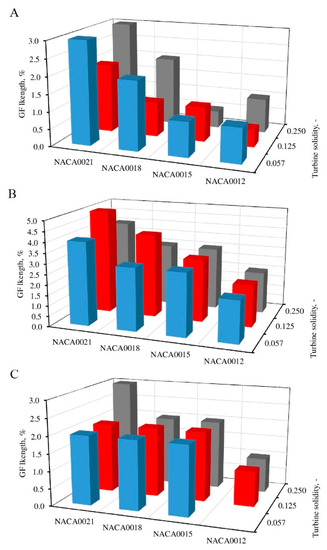
Figure 19.
Optimal value of the GFs length for all investigated turbine configurations: (A) inward GF, (B) outward GF, (C) fish tail.
Upon examination of the figure, some of the relevant trends discussed before are still clearly noticeable. In addition, it is worth noticing that:
- ■
- In the case of the inward mounting, the maximum performance (presented as a torque increment with respect to no GF configuration) in the case of low solidity is monotonically increasing with the airfoil thickness-to-chord ratio, while for the high solidity, better performance is obtained with the medium NACA00018. The optimal GF height generally increases with the airfoil thickness.
- ■
- An opposite trend than the one above was noticed for the outward mounting of the Gurney flap. However, the optimal GF height kept increasing with the airfoil thickness;
- ■
- In the cases of the fish tail configurations quite thick airfoils are preferred, with the optimal GF height also increasing with the airfoil thickness.
4.4. Response Surfaces
Even though scattered data coming from the simulations already provided some interesting indications about the relevant trends, more detailed results were needed to find optima with a sufficient accuracy. To this end, a radial basic interpolation was carried out on the data. This analysis provided a three dimensional solution of the surface response. As a result, the power coefficient as a function of the airfoil thickness and the Gurney flap length for different configurations are shown in Figure 20 and Figure 21 for the single-side GF and the fish tail GF, respectively. These plots were obtained for interpolation with use of the Inverse Multiquadric (IMQ) basis functions.
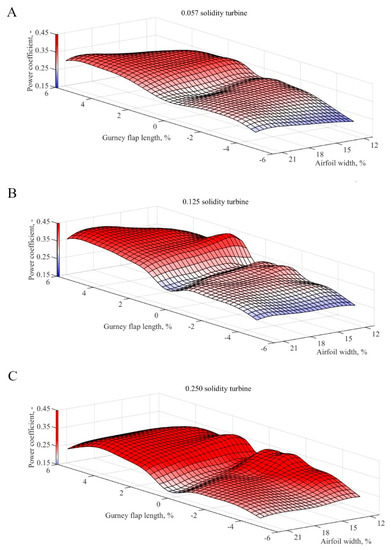
Figure 20.
Power coefficient for one-sided Gurney flap using IMQ functions for (A) 0.057, (B) 0.125, and (C) 0.25 equivalent solidity turbines.
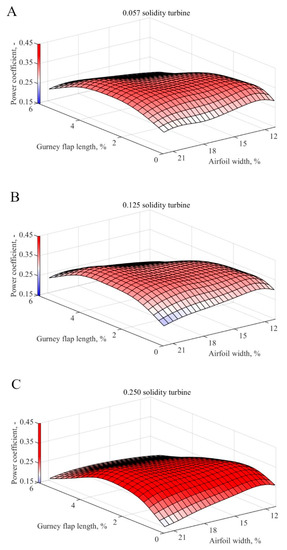
Figure 21.
Power coefficient for the fish tail configuration using IMQ functions for (A) 0.057, (B) 0.125, and (C) 0.25 equivalent solidity turbines.
Optima were then found on the surfaces. Table 4 reports the values of the power coefficient for the configurations equipped with the most efficient blade and the reference blade, respectively. The power coefficient increment was defined as a ratio of the power coefficient of the blade with changed thickness and of the Gurney flap to the power coefficient of the reference blade.

Table 4.
Power coefficient and geometrical parameters of the most efficient turbine and the reference one using IMQ functions.
It can be observed that the potential increment of the power coefficient due to the introduction of the Gurney flap can be really significant (up to +89.5%), especially when higher-solidity turbines are considered.
Overall, the increment provided by the fish tail configuration is lower than that of a one-sided GF. The fish tail shape is more suitable for turbines with lower solidity, while the one-sided Gurney flap configuration significantly influences the performance of turbines with higher solidity values. It has to be pointed out, however, that the quantitative results reported in Table 3 only refer to the selected study cases (some of them quite theoretical) and operating conditions. Performance increases to be expected for real rotors are probably lower than the reported values. However, the tendencies are thought to be of general application and they clearly highlight the potential of GFs for use in Darrieus VAWTs. Finally, it is worth noticing that the introduction of the Gurney flap in case of medium-high solidity turbines would suggest that the airfoil thickness should be slightly changed, going toward notably thinner airfoils in the case of the one-sided GF and to slightly thinner ones for the fish tail configuration. In case of low-solidity machines, on the other hand, a medium-thickness airfoil is still the best choice.
5. Conclusions
In this study, the possible benefits provided by Gurney flaps when applied to blades subject to continuous and non-sinusoidal variations of the angle of attack have been analyzed by means of an extended sensitivity analysis. These analyses are propaedeutic for understanding the possible use of GFs as power augmentation devices in Darrieus wind turbines. Symmetric NACA 4-digits airfoils were considered. The airfoil thickness which represents one of the investigated parameters had values of 12% chord (NACA0012), 15% chord (NACA0015), 18% chord (NACA0018), and 21% chord (NACA0021). The GF height and mounting (angle of inclination with respect to the chord and airfoil side with respect to the revolution axis) represented the other main variables. The different test cases were analyzed by means of unsteady CFD simulations. Then, radial basis functions were used to interpolate the results and provide detailed response surfaces describing the impact of the aforementioned variables.
Upon examination of the results, it was shown that:
- ■
- A proper GF selection can indeed provide performance increases when used in a Darrieus wind turbine (possible benefits up to +89.5% when added in combination with the correct thickness of airfoil);
- ■
- The potential benefits are higher in case of more solid turbines;
- ■
- The introduction of a GF should be coupled with a re-optimization of the airfoil thickness to obtain the maximum performance. In case of medium-high solidity turbines, this would imply a reduction in the thickness-to-chord ratio;
- ■
- The one-sided Gurney flap allows obtaining the highest turbine efficiency, but it leads to a significant imbalance of the torque distribution between the upwind and the downwind part of the turbine;
- ■
- The Fish Tail Gurney flap configuration (both-sided GF with an inclination angle of 45°) provides a lower increment of the turbine power coefficient compared to the one-sided Gurney flap, but it results in a more balanced torque output.
Further developments of the present model could consider higher dimensionality of the model itself, viz., increasing the number of variables considered in the surrogate model. Additional variables that could be considered are, for example, the airfoil type, additional Gurney flap angles relative to the chord, or combination of differently shaped Gurney flaps in inward or outward pointing directions.
Author Contributions
Conceptualization, A.B. and F.B.; Methodology, A.B., F.B. and Z.B.; Software, F.B.; Validation, P.W.; Formal Analysis, P.W. and A.B.; Investigation, P.W.; Resources, A.B. and Z.B.; Data Curation, P.W. and A.B.; Writing-Original Draft Preparation, P.W.; Writing-Review & Editing, A.B.; Visualization, F.B.; Supervision, A.B. and Z.B.; Project Administration, Z.B.; Funding Acquisition, Z.B. All authors have read and agreed to the published version of the manuscript.
Funding
This research received the financial support by National Science Centre within the OPUS scheme under contract UMO-2017/27/B/ST8/02298.
Acknowledgments
Thanks are due to Giampaolo Manfrida from the Università degli Studi di Firenze for supporting the visiting period of MSc. Wiśniewski in Firenze and to Giovanni Ferrara of the same university for providing the facilities for hosting him. All the authors would like also to thank Holst at TU Berlin for providing the experimental data for validation.
Conflicts of Interest
The authors declare no conflict of interest.
References
- Bianchini, A. Trends, prospects, and R&D directions in wind turbine technology. In Reference Module in Earth Systems and Environmental Sciences; Elsevier: Amsterdam, The Netherlands, 2019; ISBN 978-0-12-409548-9. [Google Scholar]
- Paraschivoiu, I. Wind Turbine Design: With Emphasis on Darrieus Concept; Presses Internat Polytechnique: Montreal, QC, Canada, 2009; Reprinted; ISBN 978-2-553-00931-0. [Google Scholar]
- Molina, A.C.; Massai, T.; Balduzzi, F.; Bianchini, A.; Ferrara, G.; De Troyer, T.; Bartoli, G. Combined experimental and numerical study on the near wake of a Darrieus VAWT under turbulent flows. J. Phys. Conf. Ser. 2018, 1037, 072052. [Google Scholar] [CrossRef]
- Simão Ferreira, C.J.; Van Zuijlen, A.; Bijl, H.; Van Bussel, G.; Van Kuik, G. Simulating dynamic stall in a two-dimensional vertical-axis wind turbine: Verification and validation with particle image velocimetry data. Wind Energy 2010, 13, 1–17. [Google Scholar] [CrossRef]
- Islam, M.R.; Mekhilef, S.; Saidur, R. Progress and recent trends of wind energy technology. Renew. Sustain. Energy Rev. 2013, 21, 456–468. [Google Scholar] [CrossRef]
- Bianchini, A.; Balduzzi, F.; Di Rosa, D.; Ferrara, G. On the use of Gurney Flaps for the aerodynamic performance augmentation of Darrieus wind turbines. Energy Convers. Manag. 2019, 184, 402–415. [Google Scholar] [CrossRef]
- Amini, Y.; Liravi, M.; Izadpanah, E. The effects of Gurney flap on the aerodynamic performance of NACA 0012 airfoil in the rarefied gas flow. Comput. Fluids 2018, 170, 93–105. [Google Scholar] [CrossRef]
- Han, D.; Dong, C.; Barakos, G.N. Performance improvement of variable speed rotors by Gurney flaps. Aerosp. Sci. Technol. 2018, 81, 118–127. [Google Scholar] [CrossRef]
- Zhu, H.; Hao, W.; Li, C.; Ding, Q. Numerical study of effect of solidity on vertical axis wind turbine with Gurney flap. J. Wind Eng. Ind. Aerodyn. 2019, 186, 17–31. [Google Scholar] [CrossRef]
- Zhu, B.; Huang, Y.; Zhang, Y. Energy harvesting properties of a flapping wing with an adaptive Gurney flap. Energy 2018, 152, 119–128. [Google Scholar] [CrossRef]
- Aramendia, I.; Fernandez-Gamiz, U.; Ramos-Hernanz, J.A.; Sancho, J.; Lopez-Guede, J.M.; Zulueta, E. Flow control devices for wind turbines. In Energy Harvesting and Energy Efficiency; Bizon, N., Mahdavi Tabatabaei, N., Blaabjerg, F., Kurt, E., Eds.; Springer International Publishing: Cham, Switzerland, 2017; Volume 37, pp. 629–655. ISBN 978-3-319-49874-4. [Google Scholar]
- Saenz-Aguirre, A.; Fernandez-Gamiz, U.; Zulueta, E.; Ulazia, A.; Martinez-Rico, J. Optimal wind turbine operation by artificial neural network-based active gurney flap flow control. Sustainability 2019, 11, 2809. [Google Scholar] [CrossRef]
- Islam, M.; Ting, D.S.-K.; Fartaj, A. Desirable airfoil features for smaller-capacity straight-bladed VAWT. Wind Eng. 2007, 31, 165–196. [Google Scholar] [CrossRef]
- Bianchini, A.; Balduzzi, F.; Ferrara, G.; Ferrari, L. Critical analysis of dynamic stall models in low-order simulation models for vertical-axis wind turbines. Energy Procedia 2016, 101, 488–495. [Google Scholar] [CrossRef]
- Fernandez-Gamiz, U.; Gomez-Mármol, M.; Chacón-Rebollo, T. Computational modeling of gurney flaps and microtabs by POD method. Energies 2018, 11, 2091. [Google Scholar] [CrossRef]
- Holst, D.; Balduzzi, F.; Bianchini, A.; Church, B.; Wegner, F.; Pechlivanoglou, G.; Ferrari, L.; Ferrara, G.; Nayeri, C.N.; Paschereit, C.O. Static and dynamic analysis of a NACA 0021 airfoil section at low reynolds numbers based on experiments and computational fluid dynamics. J. Eng. Gas Turbines Power 2019, 141. [Google Scholar] [CrossRef]
- Balduzzi, F.; Holst, D.; Melani, P.F.; Wegner, F.; Nayeri, C.N.; Ferrara, G.; Paschereit, C.O.; Bianchini, A. Combined numerical and experimental study on the use of Gurney flaps for the performance enhancement of NACA0021 airfoil in static and dynamic conditions. In Proceedings of the ASME Turbo Expo, London, UK, 22–26 June 2020. [Google Scholar]
- Bianchini, A.; Balduzzi, F.; Ferrara, G.; Ferrari, L. A computational procedure to define the incidence angle on airfoils rotating around an axis orthogonal to flow direction. Energy Convers. Manag. 2016, 126, 790–798. [Google Scholar] [CrossRef]
- Bianchini, A.; Balduzzi, F.; Ferrara, G.; Persico, G.; Dossena, V.; Ferrari, L. A critical analysis on low-order simulation models for darrieus vawts: How much do they pertain to the real flow? J. Eng. Gas Turbines Power 2019, 141. [Google Scholar] [CrossRef]
- Balduzzi, F.; Bianchini, A.; Maleci, R.; Ferrara, G.; Ferrari, L. Critical issues in the CFD simulation of Darrieus wind turbines. Renew. Energy 2016, 85, 419–435. [Google Scholar] [CrossRef]
- Menter, F.R. Two-equation eddy-viscosity turbulence models for engineering applications. AIAA J. 1994, 32, 1598–1605. [Google Scholar] [CrossRef]
- Balduzzi, F.; Bianchini, A.; Ferrara, G.; Ferrari, L. Dimensionless numbers for the assessment of mesh and timestep requirements in CFD simulations of Darrieus wind turbines. Energy 2016, 97, 246–261. [Google Scholar] [CrossRef]
- Bianchini, A.; Balduzzi, F.; Ferrara, G.; Ferrari, L. Aerodynamics of Darrieus wind turbines airfoils: The impact of pitching moment. J. Eng. Gas Turbines Power 2017, 139. [Google Scholar] [CrossRef]
- Lazzaro, D.; Montefusco, L.B. Radial basis functions for the multivariate interpolation of large scattered data sets. J. Comput. Appl. Math. 2002, 140, 521–536. [Google Scholar] [CrossRef]
- Golub, G.H.; Loan, C.F.V. Matrix Computations; JHU Press: Baltimore, MD, USA, 2013; ISBN 978-1-4214-0794-4. [Google Scholar]
- Buliński, Z.; Nowak, A.J.; Šarler, B. Numerical Experiments with the Local RBF Collocation; International Conference on Computational Experimental Engineering and Science Special Symposium on Meshless Methods ICCES MM: Dubrovnik, Croatia, 2006. [Google Scholar]
© 2020 by the authors. Licensee MDPI, Basel, Switzerland. This article is an open access article distributed under the terms and conditions of the Creative Commons Attribution (CC BY) license (http://creativecommons.org/licenses/by/4.0/).