Abstract
Small Darrieus vertical-axis wind turbines (VAWTs) have recently been proposed as a possible solution for adoption in the built environment as their performance degrades less in complex and highly-turbulent flows. Some recent analyses have even shown an increase of the power coefficient for the large turbulence intensities and length scales typical of such environments. Starting from these insights, this study presents a combined numerical and experimental analysis aimed at assessing the physical phenomena that take place during the operation of a Darrieus VAWT in turbulent flows. Wind tunnel experiments provided a quantification of the performance variation of a two-blade VAWT rotor for different levels of turbulence intensity and length scale. Furthermore, detailed experiments on an individual airfoil provided an estimation of the aerodynamics at high turbulence levels and low Reynolds numbers. Computational fluid dynamics (CFD) simulations were used to extend the experimental results and to quantify the variation in the energy content of turbulent wind. Finally, the numerical and experimental inputs were synthetized into an engineering simulation tool, which can nicely predict the performance of a VAWT rotor under turbulent conditions.
1. Introduction
1.1. Impact of Turbulence in New Wind Energy Applications
The installation of small wind turbines in built environments is being studied by the scientific community to complement wind energy conversion in large wind farms with a distributed generation. Smaller rotors positioned at the top of tall buildings could theoretically exploit a higher zone of the wind profile (more energetic) without the need for tall towers. The delocalized generation would also allow the production of energy where it is needed, saving transportation costs and contributing to the sustainable design of new buildings [1]. The real feasibility of this scenario, however, still needs to be proved in terms of energy conversion efficiency and social acceptance [2].
From a more technical point of view, the main challenge is the complexity of urban flows. The terrain presents high roughness, with the displacement height often at the level of the building heights themselves [3]. In addition, the flow reaching the rotors is often modified by the interaction with multiple obstacles of different shapes and permeability, e.g., upstream buildings or street furniture. All these effects result in mean wind speeds significantly lower than those available in the countryside areas [4], and poorer flow quality in terms of skew angles [4], fluctuations and, in the end, of high values of turbulence [5], which is one of the preeminent characteristics of urban flows. Turbulence in these contexts is characterized not only by high intensities, but also by large length scales [6]. This kind of turbulence is then quite different with that usually considered both in the experimental testing of airfoils or turbine prototypes and in the design phase using either engineering models or computational fluid dynamics (CFD) [7]. Experimental evidence suggests, however, that it can play a relevant role in the effective turbine operation in terms of increase of fatigue, unpredictability of energy production, or influence on stall conditions [8].
1.2. Evidence of VAWT Behaviour in Turbulent Flows
Vertical-axis wind turbines (VAWTs), especially with the Darrieus configuration, are often suggested as a possible alternative to conventional horizontal-axis wind turbines (HAWTs) for power production in small-sized applications, and especially in the aforementioned peculiar conditions found in the urban environment [2]. Despite the lower nominal efficiency with respect to HAWTs, this research trend is connected to the inherent advantages of the Darrieus concept: the omnidirectionality with respect to the wind direction (so that no yaw system is needed [9]), the possibility of putting the generator on the ground, the low noise emissions [10], and the good performance in case of misaligned (skewed) flows thanks to an increased virtual swept area [11]. In addition, Darrieus VAWTs are often preferred to other turbine layouts in view of an integration with the landscape of populated areas, since they are commonly perceived as aesthetically more pleasant by people [12]. Up to now, the study of turbulence effects on Darrieus VAWTs has been based on little field data correlating the performance of installed turbines with the on-site wind turbulence measured by a meteorological station. These studies often draw unclear and contradictory conclusions, since the effects of turbulence are said to be positive [13,14], negative [15,16], or velocity-dependent [17]. The difficulty of properly acquiring experimentally the inflow condition in a real urban environment suggests that detailed laboratory measurements are needed in order to reproduce in an accurate and repeatable way the turbine power curves and wake characteristics in turbulence. Nevertheless, replicating the urban flow characteristics inside a wind tunnel is not an easy task. In fact, most of existing experimental facilities are designed for aeronautical purposes and, thus, have a very low background turbulence intensity (Iu < 1%). This value is far from the turbulence intensity typically found within a built environment, which is typically higher than 10% [5]. In addition, the characteristic integral length scales (Lux, indication of the size of the most energetic eddies) are quite large, with values of Lux in the order of 1 m [6]. As one may argue, these values are barely replicable in wind tunnels of limited dimensions: large ones are therefore needed. This latter characteristic is also motivated by the need of limiting the blockage effect inside the tunnel, which could be responsible of creating an interference that may deform the expected wind conditions during turbine operation [18].
As a result, only few studies on the influence of turbulence on VAWT performance in wind tunnels have been carried out so far; in all cases, physical grids were used to increase turbulence in the test section. Regarding power generation, [19] measured a slight increase of the power coefficient for a five-bladed Darrieus turbine, while [20] performed a full set of experiments regarding the interaction between turbulent flows and an H-Darrieus, and despite detecting a very large increase of the power produced, they could not retrieve the complete power curves. The influence of turbulence in the wake was studied by [21] for a five-bladed VAWT, recording better self-starting capabilities and a lower speed deficit in the far-wake; [22] also recorded faster wake recovery for a three3-bladed VAWT. The combination of the two features (turbine performance and wake recovery) was measured by [23,24] for a two-bladed Darrieus, also concluding that turbulence enhanced turbine production and wake recovery. The impact of turbulence was also studied in the past at a structural level [25], to understand the dynamic response of the rotors to gusts. Numerical studies were also presented, using different levels of fidelity ranging from engineering models [26] to U-RANS CFD [27]. However, very often the studies seem to lack extensive validation or a deep understanding of the involved physics.
1.3. Research Outline
The present study is aimed at understanding the different physical phenomena stimulating the enhancement of the aerodynamic power output of Darrieus VAWTs in turbulent flows. In particular, focus is given to the case of medium-small machines, where the Reynolds numbers are sufficiently low to induce the presence of transition on the airfoils.
The starting point of the analysis is represented by the experimental tests of [23], which demonstrated a strong enhancement of the power output as the turbulence intensity of the wind tunnel flow is increased. In the study, some conjectures were made on the reasons underlying this evidence, but no demonstration was available at that time. Later, in [7] the same case study was tested with a dedicated CFD approach (discussed in the following Section 2), showing that one of the contributions to the power enhancement is indeed represented by the higher energy content in the turbulent wind in comparison to a uniform one. Starting from this background, in the present work we quantify the aerodynamic efficiency improvement taking place on the airfoils working in cycloidal conditions at low Reynolds numbers and high turbulence. This represents the second key element contributing to the overall physics. To this end, both dedicated wind tunnel measurements and CFD calculations were performed in the framework of the activity. Finally, efforts were made in trying to synthetize the results into proper corrections and best practices to be included in a state-of-the-art engineering model for the simulation of Darrieus turbines based on the blade element momentum (BEM) theory in order to better estimate the actual performance in turbulent conditions.
2. Energy Content of Turbulent Wind: Evidence from Recent CFD Simulations
An important effort has been devoted in recent years to increase the accuracy of CFD simulations for the prediction of the performance of Darrieus wind turbines. To this end, a variety of approaches have been proposed, ranging from detailed unsteady Reynolds-averaged Navier–Stokes (U-RANS) approaches (e.g., [28,29,30,31]) to more advanced Detached Eddy Simulation (DES) [32] or Large Eddy Simulation (LES) approaches [33]. These latter approaches however, often require enormous calculation costs, which are often prohibitive, leading the researchers to compromises that often do not ensure fully reliable results. A recent study on the effects of turbulence on Darrieus VAWTs is reported in [7]. In this work, a new method to reproduce with a U-RANS approach the turbulence conditions typically found in wind energy applications (in terms of realistic scales of turbulence intensity and length scale) was developed. An innovative user-defined function was developed to assign a randomly variable velocity inlet boundary conditions able to create flow structures having a prescribed length scale; additionally, numerical settings have been tuned so as to allow the correct inflow turbulence level, controlling the numerical dissipation due to the U-RANS approach.
The authors then applied the method to the case study of [23] (see Figure 1), which also represents the one used in the present work, showing that an increase of the turbine performance was indeed achieved. In particular, the impact of the flow macrostructures on the turbine was analyzed as well as the contraction effect on the wake apparent in Figure 1.
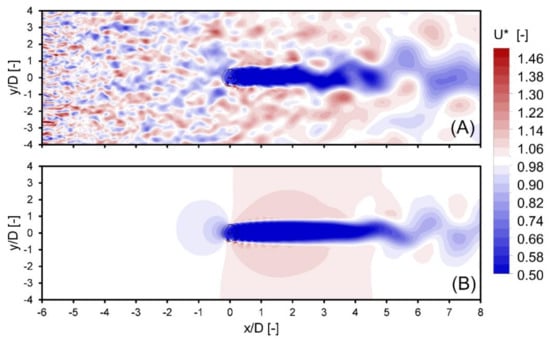
Figure 1.
Computed contours for the dimensionless streamwise velocity: (A) turbine simulation with turbulence, and (B) turbine simulation without turbulence.
Upon examination of the simulation data, the turbine performance increase was connected to two main phenomena:
- An improved stall resistance of the airfoils thanks to the turbulent flow, particularly relevant for small Reynolds numbers;
- An increase of the kinetic energy of the flow due to the macro-turbulence and to the exponential relationship that exists between wind energy content and wind speed.
The first phenomenon was not addressed in [7], and it will represent the key element of the present study. The second one was instead somehow quantified, and it is briefly reported here since it is pivotal for the correct understanding of the present approach. In particular, if a turbulent velocity profile can be reasonably characterized as a randomly fluctuating one around the mean flow speed (see Figure 2), its energy content has to be scaled with the cube of the speed itself, thus leading in general to higher energy levels in turbulent wind with respect to a uniform one. In detail, an equivalent velocity to be considered to reflect the energy potential can be defined as in Equation (1), where E is the wind specific energy content of the turbulent flow, ρ is the air density:
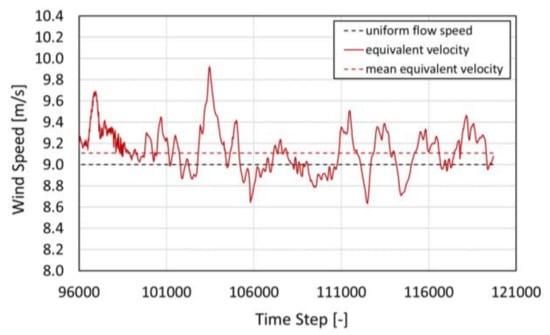
Figure 2.
Comparison between a uniform wind speed, a real fluctuating one and its equivalent speed as in Equation (1).
The same authors, however, also pointed out that the flow macrostructures corresponding to the turbulence length scale typical of wind energy applications generate a non-periodic fluctuation of the relative speed oncoming on the airfoils in cycloidal motion onboard a Darrieus turbine. This, in turn, generates a variation of the local tip-speed ratio (TSR), which is defined as in Equation (2):
It has to be stressed that these fluctuations happen in very short times, which are generally much lower than those required by the regulation system to act. The turbine revolution speed ω can then reasonably be considered as constant. The effect of the above is that it is indeed true that energy content is increased, but it is also true that it is extracted with a lower efficiency, as the optimal TSR is never maintained, as illustrated in Figure 3.
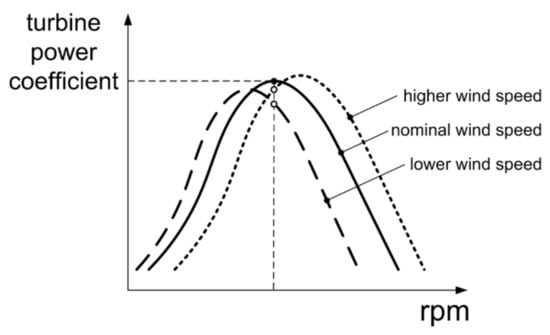
Figure 3.
Schematic representation of the variation of turbine power coefficient due to a local variation of the incoming wind velocity at a fixed revolution speed.
As a result, in [7] a performance increase lower than that theoretically predictable based on Equation (1) was found. In any case, both targets were much lower than the experimental evidence on [23]. This was connected to the possible increase of low Reynolds airfoils’ aerodynamics in turbulent wind, which are addressed instead in the following of the present study.
3. Experimental Tests
In the framework of the present work, two types of experimental tests were carried out. The most important ones were focused on reproducing correctly the turbulence levels of interest inside a wind tunnel [33] and on assessing the impact of turbulence on a two-blade small Darrieus VAWT [23]. These tests have been already presented in relevant technical papers: they will be then only briefly recalled here to give the reader a complete overview on the broad results of the entire research program. In addition, however, detailed measurements of isolated airfoils in turbulent conditions were repeated recently. The scope of these additional tests was to quantify the effect of turbulence on stall delay and maximum lift-to-drag ratio enhancement, in order to obtain a new set of aerodynamic polars for use in engineering simulation models.
3.1. Wind Tunnel Tests of the Turbine
The research on the turbine performance was carried out in the wind tunnel of CRIACIV, which is an Inter-University Research Consortium for Building Aerodynamics and Wind Engineering clustering eight Italian Universities. The laboratory hosting the open-circuit, boundary layer wind tunnel (Figure 4a) is located in Prato (Italy). The tunnel has a total length of about 22 m, including a nozzle at the inlet (characterized by a contraction ratio of 4.2 after the honeycomb) and a T-diffuser at the outlet. The test section has a rectangular shape and it is 2.42 m wide and 1.60 m high. Thanks to the possibility of changing both the speed of the motor driving the fan and the pitch of its blades, the flow velocity inside the section can be varied almost continuously up to approximately 30 m/s. The normal free-stream turbulence intensity in the tunnel is around 0.7% [34]. In preparation to the tests carried out for the present study, the growth of the freestream turbulence was obtained by means of squared-mesh wooden grids placed in development zone of the wind tunnel (see Figure 4a). To verify the flow conditions during the acquisitions with the turbine installed in the tunnel (Figure 4b), a single-component hot-wire probe was used to determine the spectral properties of the turbulence induced by the wooden grid and the homogeneity of the flow. The model used for the study is a two-blade, H-type Darrieus turbine having a diameter D = 0.5 m and a frontal area A = 0.4 m2. Blades are made of a single NACA0018 airfoil and feature a constant chord c = 0.05 m; they are connected to the rotating shaft by two inclined struts per blade (see Figure 4b). Due to the small size of the rotor, revolution speeds (and thus centrifugal loads) were high (around 1200 rpm) in order to achieve significant Reynolds numbers.
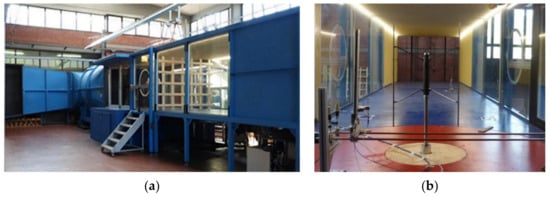
Figure 4.
(a) Wind tunnel with a wooden grid for turbulence generation installed; (b) analyzed wind turbine.
As a consequence, the rotor was manufactured using carbon-epoxy composite [35] to ensure high-quality mechanical properties. The chosen turbulent conditions for the experimental campaign are presented in Table 1. These values represent a compromise between the levels found in urban environments [4,5] and the size limitations of the wind tunnel, as explained in [34]. A uniform wind speed profile with a mean of 9 m/s was chosen as a benchmark as it allowed the widest range of rotational speeds in the turbine prototype available and a clear comparison between the different levels of turbulence.

Table 1.
Tests conditions reproduced during experiments.
3.2. Experimental Airfoil Polars
In order to emphasize the impact of turbulence on the polar curves of the airfoil an additional experimental campaign was performed in the wind tunnel of the FLOW (Fluid Dynamic and Thermodynamics) research group at the Vrije Universiteit Brussel (Belgium). This boundary layer wind tunnel has a length of 11 m and a test section with 1.04 m of height and 2 m width. Its maximum wind speed is 20 m/s and its base turbulence level is 0.5%. As in the previous experiments, the turbulence was increased by using wooden grids and the wind speed was set in order to match the mean Reynolds numbers experienced by the VAWT blades over a rotation. In this case only two flow conditions were tested: smooth flow (Iu = 0.5%) and high turbulence (Iu = 9.5%).
The blade tested was a NACA0018 adapted to the virtual camber effect that the blade experiences while rotating in VAWTs of high c/R ratio (equal to 0.2 in the present case), as it is described in [36]. A 20 cm chord model was built by laser cutting and gluing together wooden aerofoil sections. The airfoil was mounted on an aerodynamic balance to record the forces acting on it, and endplates where added to avoid 3-D effects. The setup can be observed in Figure 5.
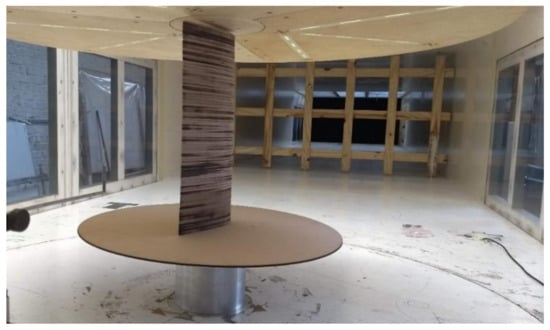
Figure 5.
Airfoil model mounted inside the FLOW wind tunnel, with the turbulence grid installed in the background.
3.3. Main Results
The main experimental results for the turbine have been presented in [23]. Measured power curves are also reported here for completeness to help the validation of the numerical approach developed in this work. In particular, Figure 6 reports the power coefficient variation of the turbine as a function of the TSR and the turbulence characteristics in terms of intensity and length scale. As discussed, a clear improvement of the power coefficient has been noted when increasing the turbulence, with a slight (and constant) shift of the curve peak at a lower tip-speed ratio.
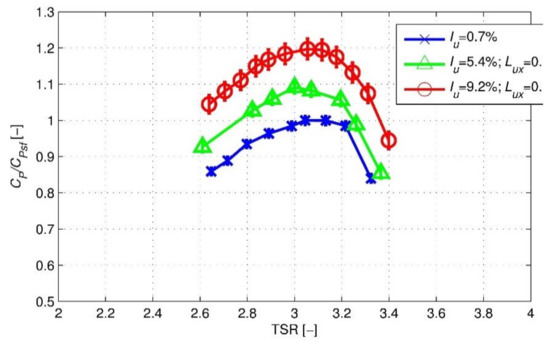
Figure 6.
Power curves obtained with the VAWT under different turbulence conditions, normalized with the optimum CP in smooth flow.
Focusing instead on the results of the measurements of the airfoil, which are an innovative contribution of the present study, Figure 7 reports the measured lift and drag polars for the virtually cambered airfoil at a Reynolds number of 80 k. Upon examination of the results, it is apparent that—for this low-Re condition—the attended performance increase was achieved, obtaining a constantly lower drag, a maximum lift coefficient increase of about 13% and a delay of the static stall angle of attack of approximately 6°. It is also worth noticing that the slope of the lift curve decreases somewhat. This is probably due to the fact that the laminar flow present along the blade in smooth flow conditions ensures a more intense pressure gradient in comparison to what happens in turbulent flow, where transition takes place earlier. The error bars in Figure 7 (note that only a few were included not to compromise readability) represent the uncertainty related to the calibration error of the balance (at 95% confidence level).
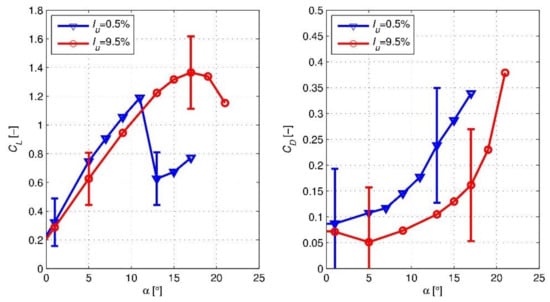
Figure 7.
Experimental polars for the virtually cambered airfoil at Re = 80 k.
The error bars are especially large for the drag coefficient. Therefore, the authors double-checked the results by calculating the drag curve also by means of a measurement of the velocity deficit in the wake as in [37]: these measurements showed good agreement with those taken with the balance. The data in Figure 7 is sufficiently robust and significant for the scope of the work.
4. CFD Modeling
Since the experimental measurements under high turbulence inflow conditions were carried out for a single wind tunnel velocity, the lift and drag polars were “extended” by means of a dedicated numerical campaign. A wider range of Reynolds numbers is indeed necessary when using lift and drag polars in a low-order simulation tool for predicting the turbine performance in case of a turbulent inflow. To this end, a high-fidelity CFD simulation model was first calibrated against measurements obtained in wind tunnel laboratory experiments at a Reynolds number of Re = 80 k. Then, the calibrated model was exploited to assess the expected polars at the Reynolds number relevant for the present application.
4.1. Numerical Setup and Validation
The numerical simulations presented in this paper were performed using the commercial CFD software ANSYS® FLUENT® [38]. The solver-setting process for the numerical solutions involved the use of a two-dimensional unsteady Reynolds-averaged Navier–Stokes (U-RANS) approach with a pressure-based formulation of the solver and a Coupled algorithm for the pressure-velocity coupling. The second order upwind discretization scheme was used for momentum, energy, and turbulence parameters, and the pressure interpolation was second order. As far as the turbulence settings are concerned, the Transitional κ-ω SST (Shear Stress Transport) model was adopted for predicting the transition between laminar to turbulent flow of the boundary layer. The choice was related to three different requirements:
- The need of a Low-Re wall treatment in order to resolve the boundary layer down to the viscous sub-layer;
- The need of capturing the laminar-turbulent transition region due to working conditions characterized by low Reynolds number and high inflow turbulence levels;
- The higher suitability of ω-based models for boundary layer flows with adverse pressure gradient and separation.
It has to be noted that in case of a three-equation U-RANS simulation characterized by an elevated level of turbulence intensity, the dominant turbulent parameter is the turbulence intensity itself. Therefore, the length scale ultimately affects the rate of decay of the turbulence intensity, while having a negligible impact on the turbulent shear stress [7].
The computational domain is an open-field type having an overall extent of 60 chords and a width of 40 chords to avoid any blockage effect on the blade profile. A Dirichlet boundary condition was employed to prescribe a uniform velocity profile at the inlet boundary. The operating pressure input is set at the outlet boundary as the static pressure of the environment. The blade surface is modeled using the standard smooth no-slip wall. To replicate the conditions of the experiments, the turbulent intensity was specified at the inlet boundary in order to obtain a turbulence level (after the intrinsic decay along the domain) of roughly 9.5% at the blade location. Among the different levels tested for the turbine (Figure 6), the selection of the highest one was motivated by the fact that effects are expected to be more visible and less affected by the possible uncertainty of the CFD approach. The application of the transitional turbulence model used in the URANS approach is in fact critical in case of very low turbulence levels and Reynolds numbers.
A grid independence test was carried out for different mesh sizes in order to define the optimum mesh for the best tradeoff between accuracy and fast computation. The convergence study was performed considering three different grids. Due to the Low-Re number wall treatment, the size of the wall-adjacent cell for all meshes was defined such as to satisfy the requirement of the dimensionless wall distance (y+) lower than ~1. The baseline coarse mesh was defined by adopting a discretization of the airfoil surface with 750 nodes, thus obtaining a size of 1.6 × 10⁵ cells in the whole domain. The medium and fine meshes were defined by progressively doubling the overall elements count. In particular, the fine mesh was featuring 1500 nodes on the blade and 6.8 × 10⁵ domain cells. The error in the estimation of lift and drag coefficients at Re = 80 k between the medium and fine mesh was lower than 0.2%. Therefore, the medium mesh featuring 1100 nodes on the blade and 3.3 × 10⁵ domain cells, whose details are shown in Figure 8, was adopted for all of the computations presented in the paper. The core region of the flow is discretized by means of an unstructured triangular mesh, with a clustering of the mesh elements in airfoil walls. An O-grid of quadrilateral elements was used around the blade, with an extrusion of 40 layers off the wall to guarantee a sufficient boundary layer resolution.
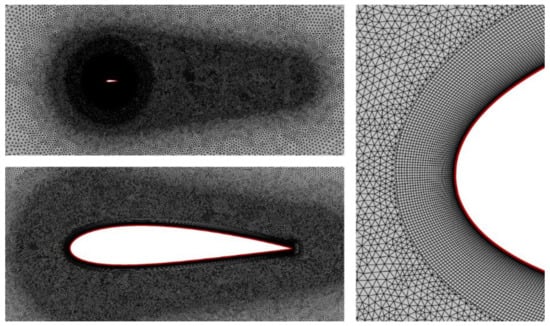
Figure 8.
Computational grid used for the airfoil polars calculations.
As a result, Figure 9 shows the comparison between the experimental polars for the airfoil tested at Re = 80 k with a high turbulence flow and those resulting from the CFD simulations of the current study in the same flow conditions. The validity of the CFD approach is clearly confirmed, since measurements and numerical results are in good agreement. The CFD model is able to properly capture the trends of lift and drag coefficients as well as the maximum values, although a 1 degree shift of the static stall location between the experimental and the simulated curves can be observed.
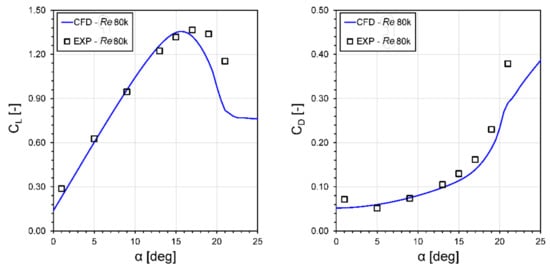
Figure 9.
Comparison between CFD and experimental polars with a high turbulence flow.
4.2. Numerical Polars
The calibrated CFD model was then used to assess the influence of the Reynolds number in case of a high turbulence flow. The tested Re values were selected in order to cover the operating conditions of the study case VAWT for all of the analyzed TSRs. Figure 10 and Figure 11 report the lift and drag polars for both positive and negative incidence angles starting from the lowest simulated Reynolds number (i.e., 40 k) up to the highest value of 160 k, with a step of 20 k. The lift increase, delay in stall angle and drag reduction is clearly visible from the CFD results, due to the higher resistance to flow separation as the Reynolds number is increased. Such behavior can be noticed by analyzing the flow field around the blade at 15° angle of attack for different Reynolds values, as shown in Figure 12: as the freestream velocity increases, the high vorticity region on the suction side due to separation is reduced and the flow tends to be more attached to the blade.
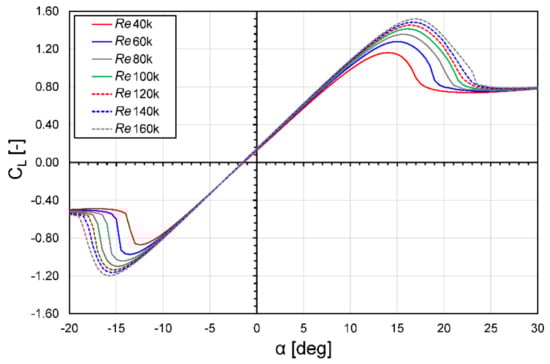
Figure 10.
Lift polars for different Reynolds values with a high turbulence flow.
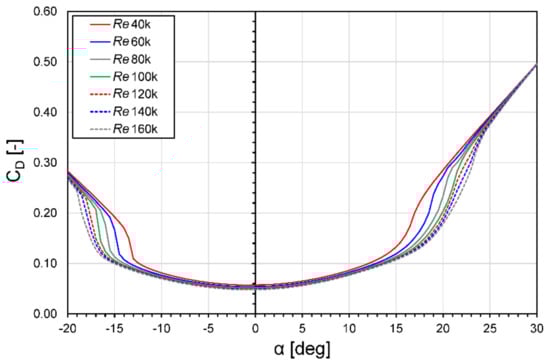
Figure 11.
Drag polars for different Reynolds values with a high turbulence flow.
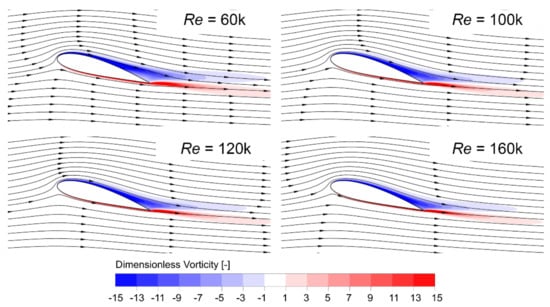
Figure 12.
Vorticity contours and velocity streamlines around the blade at 15° incidence for different Reynolds.
5. Synthesis of the Effects into the BEM Modeling
Finally, to prove that the two investigated key phenomena, i.e., the increased energy content and the improved airfoil performance at low Re in the turbulent wind, are indeed responsible for the increase of the power coefficient under turbulent conditions, they have been combined into an engineering Blade Element Momentum (BEM) model. It is well known that this theory is, on the one hand, able to deliver sufficiently reliable results in terms of overall performance, while providing, on the other hand, scarce definition of the torque profile during the revolution and of the flow field past the turbine [39]. In the perspective of the present study, however, the use of a simple BEM model (although making use of the most advanced features presently available for this theory) was thought to be of particular interest to test the impact of the discussed phenomena. More specifically, the claimed result is that a proper combination of corrections for the energy content in the flow and for the airfoil polars can accurately predict the turbine performance variation in turbulent flows even with a very simple theory.
5.1. Setup
The VARDAR code of the Università degli Studi di Firenze (Italy) [39] has been used for the analysis. The prediction capabilities of this research code have been validated over the last ten years on a variety of small H-Darrieus turbines, proving its high accuracy in comparison to other existing codes. The BEM formulation inside the VARDAR code is based on an improved version of a Double Multiple Streamtubes Approach with Variable Interference Factors originally proposed by Prof. Paraschivoiu in [9]. With respect to the “standard” formulation, the Glauert’s correction for high-induction cases based on recent experimental data has been implemented. To increase the accuracy in predicting VAWT aerodynamics, several sub-models have been embedded within the code, including the corrections to account for the finite aspect ratio of the blades using the Lanchester–Prandtl model, the parasitic torque of the struts, and the streamtube expansion model presented in [9], although the impact of this on the simulation of small turbines like the one investigated in this work is negligible, as discussed in [34]. Furthermore, based on recent findings about the aerodynamics of airfoils in cycloidal motion, specific corrections are included to correct airfoil polars in order to account for flow curvature effects, i.e., the virtual camber effect [36] and the virtual incidence [40]. Another important additional feature recently included in the code is the polar smoothing procedure discussed in [41]. Finally, several dynamic stall models are included, i.e., those proposed by Gormont, Berg, Strickland, and Paraschivoiu [9]; in the present study, Berg’s one with a calibration factor of 30 has been used.
According to the discussed hypotheses, the CFD-based airfoil polars presented in Section 4 (obtained for a turbulence intensity of 9.5%) have been used in the present study, along with an average wind speed corrected by Equation (1) in comparison to experiments, equal to 9.2 m/s.
5.2. Results
Figure 13 displays the comparison between the measured increase of the power curve of the turbine (i.e., the power coefficient divided by the optimum one in smooth flow) and that obtained by means of the BEM approach.
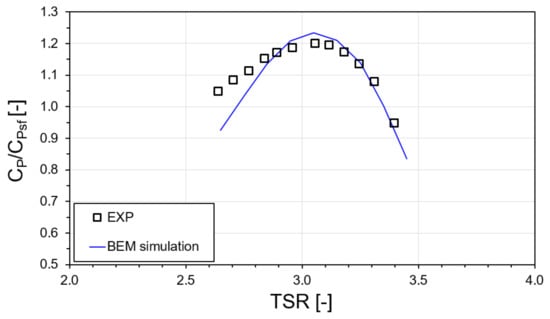
Figure 13.
Comparison between the experimental turbine power curve (in dimensionless form) in turbulence and the predictions using the VARDAR code: the BEM code is run with the airfoil polars obtained for a 9.5% turbulence condition and at the equivalent wind speed of 9.2 m/s.
Upon examination of the figure, it is apparent that even a very simple model like the BEM one, if properly accounting for the analyzed phenomena, was able to nicely predict the overall tendency of the performance variation of the turbine, especially in terms of the maximum power coefficient increase. The numerical trend slightly anticipates the curve peak, probably due to the fact that the performance of real airfoils in motion could be slightly lower than that predicted via CFD. Additionally, the numerical curve is a slightly steeper than the experimental one. It also has to be remembered that the left-hand side of the curve is notably affected by dynamic stall, which could be further affected by turbulence, being barely reproducible with the engineering models embedded in the BEM code.
Overall, however, it is worth remarking that being able to estimate the power coefficient variation increase in turbulence with a simple engineering tool has to be considered like a very promising result. This also proves that, as hypothesized, the two discussed phenomena (more energized flow and better airfoil performance) impact consistently on the overall physics.
6. Conclusions
In this study, different techniques and data types were combined together to prove that two main physical phenomena concur in defining the performance increase (testified by unique experimental wind tunnel data reproducing realistic turbulence features) of small Darrieus turbines in turbulent flows.
The first one, assessed by means of detailed CFD simulations of the rotor, is the higher energy content in the turbulent wind, which induces a slight power surplus. This is, however, limited by the fact that the turbine constantly operates at a non-optimal tip-speed ratio, depending on the flow macrostructures that enter the turbine instant by instant. Overall, an equivalent wind speed can be defined.
The second one—which is thought of major relevance in case of small turbines—is the improved response of the airfoils in terms of delayed stall angle and increased lift-to-drag ratio. This second phenomenon has been verified with dedicated experimental tests in the wind tunnel, which also allowed for the calibration of a CFD tool to virtually replicate the polars.
Finally, the two elements have been combined into a state-of-the-art BEM code, which was able —despite its simplicity—to nicely predict the turbine behavior, thus suggesting that the two highlighted phenomena are really playing a major role in defining the aerodynamic behavior and energy conversion capability of small Darrieus vertical axis wind turbines in turbulent flows.
Future work will be devoted to providing an on-field validation to prove the feasibility of small Darrieus VAWTs in turbulent sites. In particular, gaining a better understanding of the discussed phenomena could lead in the near future to design strategies for small rotors specifically tailored to maximize the performance in the turbulent flows that are typical, for example, of the urban environment.
Author Contributions
Conceptualization: A.B. and F.B.; Methodology: A.B., F.B. and M.Z.; Software: A.B. and F.B.; Experiments: A.C.M., T.D.T. and G.B.; Validation: A.C.M.; Formal Analysis: A.B.; Investigation: A.B., F.B. and M.Z.; Resources: M.C.R., G.B. and G.F.; Data Curation: A.C.M., M.Z. and F.B.; Writing—Original Draft Preparation: M.Z., F.B. and A.B.; Writing—Review and Editing: T.D.T.; Visualization: F.B.; Supervision: T.D.T., M.C.R., G.B., G.F. and A.B.; Project Administration: M.C.R., G.B. and G.F.; Funding Acquisition: T.D.T., M.C.R. and G.B. All authors have read and agreed to the published version of the manuscript.
Funding
The experimental campaigns are part of the European Innovative Training Network (ITN) AEOLUS4FUTURE “Efficient Harvesting of the Wind Energy”. The project is funded by the Horizon 2020 Research and Innovation program under the Marie Skłodowska-Curie grant agreement no. 643167.
Acknowledgments
Thanks are due to all the staff of the CRIACIV wind tunnel in Prato for the support during the wind tunnel tests of the turbine. The authors would like also to acknowledge the VUB Bachelor student Julen Echeverria for the help in the construction of the airfoil model for polars in turbulence.
Conflicts of Interest
The authors declare no conflict of interest.
References
- Mertens, S. Wind Energy in the Built Environment Concentrator Effects of Buildings; Multi Science: Essex, UK, 2006. [Google Scholar]
- Balduzzi, F.; Bianchini, A.; Carnevale, E.; Ferrari, L.; Magnani, S. Feasibility analysis of a Darrieus vertical-axis wind turbine installation in the rooftop of a building. Appl. Energy 2012, 97, 921–929. [Google Scholar] [CrossRef]
- Balduzzi, F.; Bianchini, A.; Ferrari, L. Microeolic turbines in the built environment: Influence of the installation site on the potential energy yield. Renew. Energy 2012, 45, 163–174. [Google Scholar] [CrossRef]
- Drew, D.; Barlow, J.; Cockerill, T. Estimating the potential yield of small wind turbines in urban areas: A case study for Greater London, UK. J. Wind. Eng. Ind. Aerodyn. 2013, 115, 104–111. [Google Scholar] [CrossRef]
- Janajreh, I.; Su, L.; Alan, F. Wind energy assessment: Masdar City case study. Renew. Energy 2013, 52, 8–15. [Google Scholar] [CrossRef]
- Dallman, A.R. Flow and Turbulence in Urban Areas. Ph.D. Thesis, University of Notre Dame, Notre Dame, IN, USA, 2013. [Google Scholar]
- Balduzzi, F.; Zini, M.; Ferrara, G.; Bianchini, A. Development of a Computational Fluid Dynamics Methodology to Reproduce the Effects of Macroturbulence on Wind Turbines and Its Application to the Particular Case of a VAWT. J. Eng. Gas Turbines Power 2019, 141, 111010–111022. [Google Scholar] [CrossRef]
- Lubitz, W.D. Impact of ambient turbulence on performance of a small wind turbine. Renew. Energy 2014, 61, 69–73. [Google Scholar] [CrossRef]
- Paraschivoiu, I. Wind Turbine Design: With Emphasis on Darrieus Concept; Presses inter Polytechnique: Montréal, QC, Canada, 2002. [Google Scholar]
- Mohamed, A. Aero-acoustics noise evaluation of H-rotor Darrieus wind turbines. Energy 2014, 65, 596–604. [Google Scholar] [CrossRef]
- Bianchini, A.; Ferrara, G.; Ferrari, L.; Magnani, S. An Improved Model for the Performance Estimation of an H-Darrieus Wind Turbine in Skewed Flow. Wind. Eng. 2012, 36, 667–686. [Google Scholar] [CrossRef]
- Cooper, P. Development and Analysis of Vertical-Axis Wind Turbines; WIT Press Ltd.: Billerica, MA, USA, 2010; Volume 1, pp. 277–302. [Google Scholar]
- Möllerström, E.; Ottermo, F.; Goude, A.; Eriksson, S.; Hylander, J.; Bernhoff, H. Turbulence influence on wind energy extraction for a medium size vertical axis wind turbine. Wind. Energy 2016, 19, 1963–1973. [Google Scholar] [CrossRef]
- Bertenyi, T.; Wickins, C.; McIntosh, S. Enhanced Energy Capture Through Gust-Tracking in the Urban Wind Environment. In Proceedings of the 48th AIAA Aerospace Sciences Meeting Including the New Horizons Forum and Aerospace Exposition, Orlando, FL, USA, 4–7 January 2010. [Google Scholar] [CrossRef]
- Pagnini, L.C.; Burlando, M.; Repetto, M.P. Experimental power curve of small-size wind turbines in turbulent urban environment. Appl. Energy 2015, 154, 112–121. [Google Scholar] [CrossRef]
- Kooiman, S.J.; Tullis, S. Response of a Vertical Axis Wind Turbine to Time Varying Wind Conditions found within the Urban Environment. Wind. Eng. 2010, 34, 389–402. [Google Scholar] [CrossRef]
- Lee, K.-Y.; Tsao, S.-H.; Tzeng, C.-W.; Lin, H.-J. Influence of the vertical wind and wind direction on the power output of a small vertical-axis wind turbine installed on the rooftop of a building. Appl. Energy 2018, 209, 383–391. [Google Scholar] [CrossRef]
- Dossena, V.; Persico, G.; Paradiso, B.; Battisti, L.; Dell’Anna, S.; Brighenti, A.; Benini, E. An Experimental Study of the Aerodynamics and Performance of a Vertical Axis Wind Turbine in a Confined and Unconfined Environment. J. Energy Resour. Technol. 2015, 137, 051207. [Google Scholar] [CrossRef]
- Miau, J.J. Wind Tunnel Study on Aerodynamic Performance of Small Vertical-Axis Wind Turbines; Cheng Kung University: Tainan, Taiwan, 2012. [Google Scholar]
- Ahmadi-Baloutaki, M.; Carriveau, R.; Ting, D.S.-K. Performance of a vertical axis wind turbine in grid generated turbulence. Sustain. Energy Technol. Assess. 2015, 11, 178–185. [Google Scholar] [CrossRef]
- Peng, H.; Lam, H. Turbulence effects on the wake characteristics and aerodynamic performance of a straight-bladed vertical axis wind turbine by wind tunnel tests and large eddy simulations. Energy 2016, 109, 557–568. [Google Scholar] [CrossRef]
- Hohman, T.; Martinelli, L.; Smits, A.J. The effects of inflow conditions on vertical axis wind turbine wake structure and performance. J. Wind. Eng. Ind. Aerodyn. 2018, 183, 1–18. [Google Scholar] [CrossRef]
- Carbò Molina, A.; Massai, T.; Balduzzi, F.; Bianchini, A.; Ferrara, G.; De Troyer, T.; Bartoli, G. Combined experimental and numerical study on the near wake of a Darrieus VAWT under turbulent flows. J. Phys. Conf. Ser. 2018, 1037, 072052. [Google Scholar] [CrossRef]
- Carbò Molina, A.; De Troyer, T.; Massai, T.; Vergaerde, A.; Runacres, M.C.; Bartoli, G. Effect of turbulence on the performance of VAWTs: An experimental study in two different wind tunnels. J. Wind. Eng. Ind. Aerodyn. 2019, 193, 103969. [Google Scholar] [CrossRef]
- Malcolm, D. Dynamic response of a darrieus rotor wind turbine subject to turbulent flow. Eng. Struct. 1988, 10, 125–134. [Google Scholar] [CrossRef]
- Brahimi, T.; Paraschivoiu, I. Darrieus Rotor Aerodynamics in Turbulent Wind. J. Sol. Energy Eng. 1995, 117, 128–136. [Google Scholar] [CrossRef]
- Ahmedov, A.; Ebrahimi, K.M. Numerical Modelling of an H-type Darrieus Wind Turbine Performance under Turbulent Wind. Am. J. Energy Res. 2017, 5, 63–78. [Google Scholar] [CrossRef]
- Balduzzi, F.; Bianchini, A.; Maleci, R.; Ferrara, G.; Ferrari, L. Critical issues in the CFD simulation of Darrieus wind turbines. Renew. Energy 2016, 85, 419–435. [Google Scholar] [CrossRef]
- Balduzzi, F.; Bianchini, A.; Ferrara, G.; Ferrari, L. Dimensionless numbers for the assessment of mesh and timestep requirements in CFD simulations of Darrieus wind turbines. Energy 2016, 97, 246–261. [Google Scholar] [CrossRef]
- Bianchini, A.; Balduzzi, F.; Bachant, P.; Ferrara, G.; Ferrari, L. Effectiveness of two-dimensional CFD simulations for Darrieus VAWTs: A combined numerical and experimental assessment. Energy Convers. Manag. 2017, 136, 318–328. [Google Scholar] [CrossRef]
- Rezaeiha, A.; Montazeri, H.; Blocken, B. Characterization of aerodynamic performance of vertical axis wind turbines: Impact of operational parameters. Energy Convers. Manag. 2018, 169, 45–77. [Google Scholar] [CrossRef]
- Dessoky, A.; Bangga, G.; Lutz, T.; Krämer, E. Computational Study Using DDES with Higher Order Scheme Modeling to Predict Darrieus VAWT Noise Mechanisms. In New Results in Numerical and Experimental Fluid Mechanics XII; Springer Science and Business Media LLC: Berlin/Heidelberg, Germany, 2019; Volume 142, pp. 807–818. [Google Scholar]
- Patil, R.; Daróczy, L.; Janiga, G.; Thévenin, D. Large eddy simulation of an H-Darrieus rotor. Energy 2018, 160, 388–398. [Google Scholar] [CrossRef]
- Carbó Molina, A.; Bartoli, G.; De Troyer, T. Generation of Uniform Turbulence Profiles in the Wind Tunnel for Urban VAWT Testing. In Wind Energy Exploitation in Urban Environment; Battisti, L., Ricci, M., Eds.; Springer International Publishing: Cham, Switzerland, 2018. [Google Scholar] [CrossRef]
- Vergaerde, A.; De Troyer, T.; Carbò Molina, A.; Standaert, L.; Runacres, M. Design, manufacturing and validation of a vertical-axis wind turbine setup for wind tunnel tests. J. Wind. Eng. Ind. Aerodyn. 2019, 193, 103949. [Google Scholar] [CrossRef]
- Rainbird, J.M.; Bianchini, A.; Balduzzi, F.; Peiró, J.; Graham, M.; Ferrara, G.; Ferrari, L. On the influence of virtual camber effect on airfoil polars for use in simulations of Darrieus wind turbines. Energy Convers. Manag. 2015, 106, 373–384. [Google Scholar] [CrossRef]
- Schlichting, H. Boundary Layer Theory; McGraw Hill: New York, NY, USA, 1979. [Google Scholar]
- Fluent Theory Guide; Release 19; Ansys Inc.: Canonsburg, PA, USA, 2018.
- Bianchini, A.; Balduzzi, F.; Ferrara, G.; Persico, G.; Dossena, V.; Ferrari, L. A Critical Analysis on Low-Order Simulation Models for Darrieus Vawts: How Much Do They Pertain to the Real Flow? J. Eng. Gas Turbines Power 2018, 141, 011018. [Google Scholar] [CrossRef]
- Bianchini, A.; Balduzzi, F.; Ferrara, G.; Ferrari, L. Virtual incidence effect on rotating airfoils in Darrieus wind turbines. Energy Convers. Manag. 2016, 111, 329–338. [Google Scholar] [CrossRef]
- Marten, D.; Bianchini, A.; Pechlivanoglou, G.; Balduzzi, F.; Nayeri, C.; Ferrara, G.; Paschereit, C.O.; Ferrari, L. Effects of Airfoil’s Polar Data in the Stall Region on the Estimation of Darrieus Wind Turbine Performance. J. Eng. Gas Turbines Power 2016, 139, 022606. [Google Scholar] [CrossRef]


© 2020 by the authors. Licensee MDPI, Basel, Switzerland. This article is an open access article distributed under the terms and conditions of the Creative Commons Attribution (CC BY) license (http://creativecommons.org/licenses/by/4.0/).