Abstract
While the vast majority of the wind energy market is dominated by megawatt-size wind turbines, the increasing importance of distributed electricity generation gives way to small, personal-size installations. Due to their situation at relatively low heights and above-ground levels, they are forced to operate in a low energy-density environment, hence the important role of rotor optimization and flow studies. In addition, the small wind turbine operation close to human habitats emphasizes the need to ensure the maximum reliability of the system. The present article summarizes a case study of a small wind turbine (rated power 350 W @ 8.4 m/s) from the point of view of aerodynamic performance (efficiency, flow around blades). The structural strength analysis of the blades milled for the prototype was performed in the form of a one-way Fluid–Structure Interaction (FSI). Blade deformations and stresses were examined, showing that only minor deformations may be expected, with no significant influence on rotor aerodynamics. The study of an unorthodox material (PA66 MO polyamide) and application of FSI to examine both structural strength and blade deformation under different operating conditions are an approach rarely employed in small wind turbine design.
1. Introduction
Although the increasing importance of wind energy in the global energy market (see, e.g., [1]) is mainly due to large-scale installations, Small Wind Turbines (SWTs) are also an important player in this field. This includes prosumer applications (e.g., in hybrid installations [2]), isolated sites operation (for example, to power transmitter stations or remote islands [3]), and multi-rotor array applications (a substitute for the single, big-size rotor [4]). This article presents the outcomes of a case study of an SWT fit for prosumer suburban application in European wind conditions.
1.1. Small Wind Turbines—Interest and Research
Nordic Folkecenter for Renewable Energy regularly publishes The Small Wind Turbine catalogue, the 8th edition of which brought together 104 companies from 28 countries, a total of 302 models of the rated power below 50 kW [5]. Publications such as the Small Wind Guidebook by WINDExchange (supported by the US Department of Energy and National Renewable Energy Association (NREL)) give guidelines about how to estimate whether or not an SWT is fit for a particular location and application and how to choose a proper solution for particular demands and needs [6]. SWTs in urban applications are one of the key interests of programs like the Intelligent Energy–Europe and Horizon 2020 Energy Efficiency.
Stathopoulos et al. [7], in their review of urban SWT technologies, argue that, although Vertical-Axis Wind Turbines (VAWTs) tend to be quieter and visually pleasant, the Horizontal-Axis Wind Turbines (HAWTs) remain a preferred choice for urban applications. This is because VAWTs remain commercially less cost-efficient than HAWTs. The authors also stress the importance of reliable data on urban aerodynamics the more that these wind conditions tend to be more capricious and characterized by a high level of turbulence intensity due to obstructions. The latter is extensively discussed by Anup et al. [8], who stress the need to conceive particular standards pertaining to SWTs, as those referring to big-scale machines may not reproduce the adverse wind conditions correctly. The authors discuss the influence of stochastic flow phenomena on the power outcome and wind turbine loading, which leads to increased fatigue load and underline the need for the structural analysis of wind turbine rotors by means of numerical codes such as Fatigue, Aerodynamics, Structures and Turbulence (FAST). Mechanical analysis of wind turbine blades is also important from the point of view of their inertia. Pourrajabian et al. [9] optimized the wooden blade geometry using genetic algorithms, in order to maximize rotor efficiency while preserving blade loadings in a safe range and ensure low blade inertia for low cut-in wind speed. The authors concluded that not every timber may be successfully used over a wide spectrum of velocity and identified alder as a preferable choice for wooden SWT blades.
Contemporary computational methods offer the possibility to couple high-order simulation of fluid flow and structural response in the Fluid–Structure Interaction (FSI) approach. A one-way FSI is an operation of checking deformation once the whole fluid flow simulation is executed. In a two-way approach, in each coupling iteration of fluid flow simulation, the deformations of the structure are being calculated and according to it—fluid mesh is changing its shape [10,11]. In either case, the simulation requires a significant computational effort, hence its main interest is in case of large-scale wind turbines (see, e.g., [12]). Lee et al. [13] used a one-way FSI model in their NREL Phase VI [14] small HAWT structural studies. The authors claim that the deformation of the tested rotor blades is mainly due to operating conditions (stall, etc.) and not elevated wind speed. FSI also proved important input and validation data for simpler, Blade Element-Momentum theory-based computations. FSI computations are also crucial in the process of developing completely new SWT designs, such as VAWT with morphing blades by MacPhee and Beyene [15]. The authors claimed that the controllably deformable blades enabled an increase in efficiency by as much as 9.6% with respect to fully rigid ones.
SWTs, studied at Institute of Turbomachinery of Lodz University of Technology, incorporate both experimental [16] and numerical [17] research. The increasing use of new manufacturing technologies in SWT studies and prototype manufacturing [18] makes it essential to ensure rotor blade integrity and safe operation. In the current article, the authors summarize the outcomes of a one-way FSI case study of a Generative Urban Small Turbine (GUST) horizontal-axis SWT prototype (see Chapter 2). The research was performed in order to check the blade behavior and performance in different wind conditions, ranging from normal operation to extreme working and static loads, hoping to see if the resulting deformations (twisting, axial displacement) are a serious threat to blade performance. It is also important to find the blade regions most susceptible to load concentrations and compare them with the material strength parameters (see Table 1). To the knowledge of the authors, this kind of analysis is rarely performed for SWTs in general, and for the unorthodox selected material in particular.

Table 1.
Blade and material properties.
1.2. Basic Mathematical Formulations
In this article, the dimensionless analysis of wind turbines is employed [19]. The non-dimensional rotational speed (Tip-Speed Ratio, TSR) is defined as:
with ω—wind turbine rotational speed, R—rotor radius, and V—the reference wind speed. In order to present the wind turbine efficiency, the power coefficient Cp is introduced, as follows:
with P—wind turbine power and ρ—fluid density. Lastly, pressure coefficient cpress relates static pressure p to the dynamic pressure, as:
2. Object of the Study
The rotor is a three-bladed GUST HAWT. This small wind turbine has a nominal power 350 W at a wind velocity of 8.4 m/s [20]. The blades are of variable chord and twist angle (Figure 1) and are constructed upon NREL S826 and S834 airfoils [21]. The examined rotor radius R is equal to 0.8 m, which is the same as that used in experimental investigation used as a reference. For wind speed V = 8.4 m/s, at optimum TSR = 5, the local Reynolds number (at each blade station, thus taking chord length as a characteristic dimension) is of an order of magnitude of 1.2 × 10⁵.
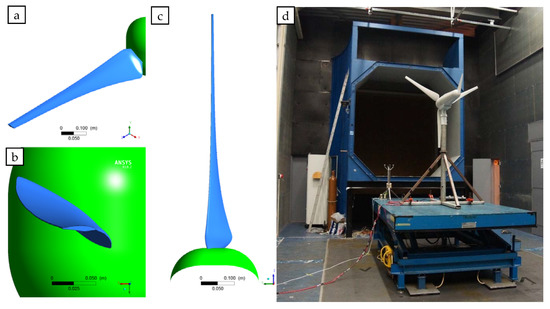
Figure 1.
Blade geometry (left): (a) general view; (b) top view; (c) leading edge and suction side; and (d) wind turbine prototype during wind tunnel testing (own materials).
The material which was used to produce the prototype blades was Polyamide PA66 MO as an optimal choice between stiffness, allowable stresses, manufacturability, and price. The material was bought in sheets with dimensions 90 × 610 × 2000 mm and blades were milled on CNC machine. The material properties of this material, necessary for structural analysis, are grouped in Table 1. Since the blade was machined from a uniform piece of material, in the structural simulation, an isotropic material model is assumed.
3. Methodology
The simulation is performed using the commercial numerical simulation software ANSYS 18.0. Within the Workbench package ANSYS CFX was one-way coupled with ANSYS Structural (for mechanical analysis). The complete rotor geometry and domain encompassing it are discretized in the approach known as the Fully-resolved Rotor Model (FRM) [22]. The flow is assumed to be periodic, so only one-third of the rotor (one blade, 120° section) is considered.
3.1. Preprocessing
The overview of the considered geometry is visible in Figure 2. Two domains were distinguished in order to represent the fluid flow: rotor domain, in the form of a flat cylinder in which blade and hub are modelled, and stationary domain, which encompasses the former. In between the two domains, an interface is placed to permit the exchange of data. There is no relative movement between domains since the problem is considered as steady state. Instead, the frozen rotor model is employed, where the relative orientation of the components across the interface remains fixed along with the calculations and the flow from one component to the next changes the frame of reference [23]. The steady-state approach was chosen, as the simulation is performed under uniform, time-independent inflow conditions and one-way FSI. The transient analysis would require numerical and time resources prohibitively large for this—initial—phase of computations. The rotational velocity ω is imposed on the particles flowing through the rotor domain—analyzed cases are seen in Figure 4. The values of ω mimic those set in the benchmark experiment, performed independently by team GUST at TU Delft Open Jet Facility wind tunnel [24]. The experimental investigations were not a part of this study, and their results were made available as reference values at the courtesy of the GUST team. The authors estimate that the relative error of the experimental results is in range of 5%.
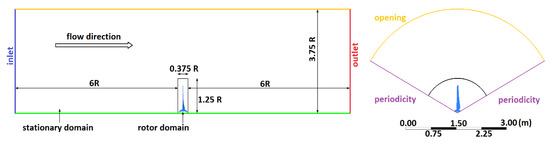
Figure 2.
Side and front view of the analyzed problem geometry (elements are in scale).
Both domains were discretized together using tetrahedral, unstructured mesh (Figure 3) in ANSYS Mesher software. Refinement was performed in the rotor vicinity in order to better model the expected high gradients within the flow. The inflation layer was created around blades and hub surfaces to ensure a full resolution of boundary layer flow. The resulting mesh size is 10.8 × 10⁶ nodes and 22.8 × 10⁶ elements.
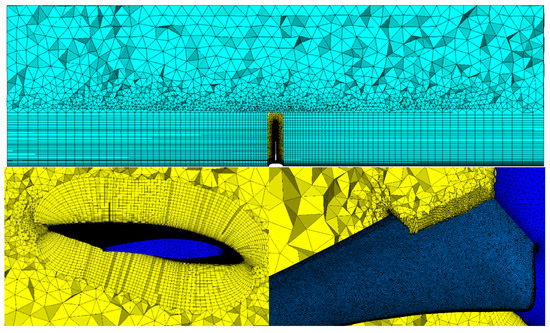
Figure 3.
Mesh cross-section views: global (top) and around blade and hub (bottom).
Boundary conditions (see Figure 2 and Table 2) were set in order to mimic the outdoor wind turbine operation. The reference pressure was set to 1 atm (101,325 Pa). Chosen turbulence closure was k-ω SST with a standard set of coefficients, as this model proved trustworthy in previous wind turbine applications [22,23]. The considered flow medium (air) density ρ = 1.185 kg·m−3 and dynamic viscosity is 1.831 × 10⁻⁵ kg·m−1·s−1. The fluid is considered to be an incompressible (Ma < 0.3) ideal gas. Double precision, the fully coupled pressure-based solver was used, and the resolved equations involved flow continuity, momentum, and total energy conservation.
Table 2.
Flow simulation boundary conditions.
3.2. Solution and Convergence
A rudimentary numerical verification of the model was performed in order to check the correctness of the calculation. The tests were performed for V = 12 m/s and TSR = 5.
During the mesh independence study, the results obtained with the primary grid were compared with a reference grid, with approximately 75% more elements and nodes. Selected variables were compared between these two cases: torque in the axis of rotation (relative error δ ≈ 0.5%) and flapwise bending moment (δ < 0.1%), as well as the axial force (δ ≈ 0.6%). The relative error in the rotor power was of the order of magnitude 10−3. The mesh quality was further assessed from the point of view of boundary layer flow solution correctness. The dimensionless distance y+ is the standard means for this verification. For turbulence closures incorporating the k-ω model for boundary layer flow, this parameter should be kept at level y+ < 3 [23], guaranteeing that the model will be able to correctly depict the velocity profile in the immediate vicinity of the wall. In the considered case, the mesh was inflated from the blade surface to ensure the proper transition of the element size. The differences in y+ values for the two meshes turned out to be more evident, with the average value on the blade surface being approximately 10.8 for the primary and 2.2 for reference mesh. For the latter grid, the highest values of y+ were identified near the blade tip, thus having only very little influence on the overall rotor performance. On the other hand, for the primary mesh, the local increase in y+ was observed in the flow separation region at both sides of the blade, which has a chief influence on the blade performance. This flaw of the primary mesh can significantly deteriorate the model fidelity, especially at lower wind speeds. Followed by this reasoning was the choice of the reference mesh for the actual studies.
The simulation convergence was evaluated based on the attained (normalized) level of residuals. For the momentum equations, this was approximately 3 × 10⁻⁵, for the continuity equation 3 × 10⁻⁶, for turbulent quantities transport equations 7 × 10⁻⁵ (k), and for 1 × 10⁻⁵ (ω). These values were deemed satisfactory to consider the solution as converged.
3.3. Fluid Flow Simulation Results
The first aspect of the performed results postprocessing was an analysis of the power output. In Figure 4 simulation (squares) and experiment (circles) results are compared for the same working points (V and TSR). A systemic error is noticeable, with the numerical results being approximately 120–140 W lower than experimental ones. While the current study is mostly dedicated to FSI investigation, these discrepancies may result in underestimation of actual aerodynamic loads and need addressing, for example, as a guideline for future works.
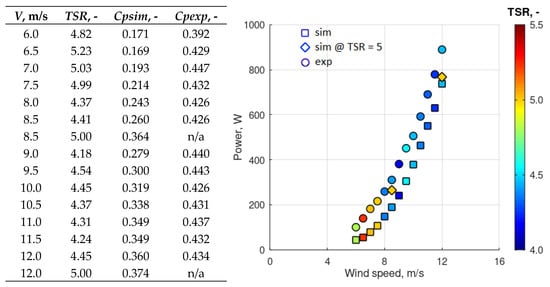
Figure 4.
Analyzed cases and power obtained at different wind speeds and Tip-Speed Ratio (TSR).
An important factor influencing the results are the simplifications of the numerical model. Firstly, the simulation performed in a steady-state mode may not entirely adequately depict the complex helical tip vortex wake structure, leading to modification in the induced velocities. This is further altered by the frozen rotor scheme–the most closely depicting the real flow, yet still simplifying it. For the full resolution of these flow phenomena, an unsteady model would be required. However, this was deemed prohibitively expensive in terms of computational resources and will be examined in the future, possibly with a two-way FSI. Another sources of error may be the size of the simulation domains (especially the one encompassing the rotor), and the fact that just 1/3 of the problem is being resolved. While this was done according to the standard procedures, these elements may influence the pressure fields, especially in the places where high gradients occur. The influence of this aspect was previously observed, also for rotor actuator models [22] and may be also connected with data transmission through interfaces.
In all, the obtained results may lead to a conclusion that the numerical model has the tendency to underestimate the aerodynamic loads. However, the performed structural assessment (Chapter 4) shows that the estimated stresses are well within the material flexural strength limit, and the deformations are very small, so even if a safety factor is taken into account, these observations will remain valid.
On a more general note, it is also visible how the flow is influenced by the relatively low Reynolds number phenomena: at lower wind speeds the rotor needs to turn at higher TSR in order to remain close to performance peaks. This becomes less evident as the wind speed increases, at which point, in experimental investigations, aeroelastic effects may start to play an important role.
In addition to cases mimicking experimental results, the simulation was also performed for design TSR = 5 at V = 8.4 m/s (rated wind speed) and 12 m/s (diamonds in Figure 4). This was done to assess the loads acting on the blade and provide data for further FSI simulation. The pressure fields on the blade are visible in Figure 5, providing input data for mechanical analysis. Special interest must be paid to the tip region, as in there the visibly high-pressure gradients between the two sides of the blade contribute to increased mechanical loads.
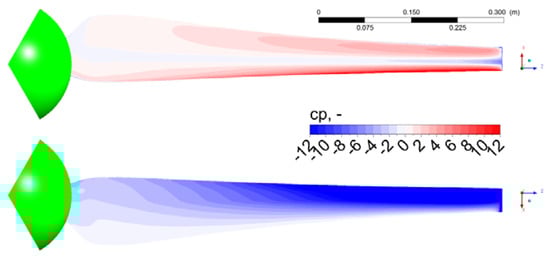
Figure 5.
Pressure coefficient distribution at blade pressure (top) and suction (bottom) side (V = 12 m/s, TSR = 5).
Lastly, a general overview of the flow around the blade is visible in Figure 6. No boundary layer separation is visible whatsoever, suggesting that the wind turbine operates in pre-stall conditions. Quite visibly, the flow speed increases along with radius and it is fair to say that near the blade tip it is almost 3 times higher than at the bottom.
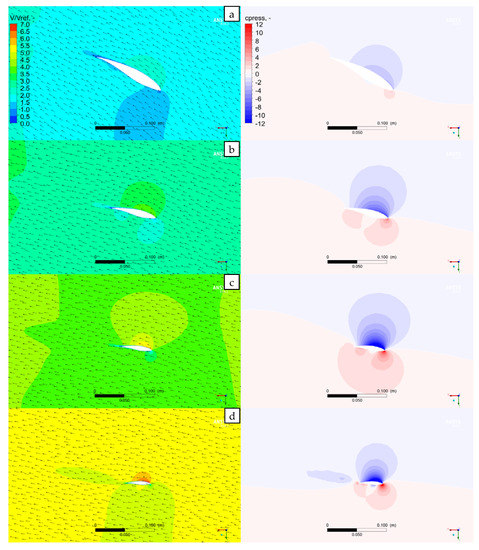
Figure 6.
Normalized velocity (Vref = 12 m/s, TSR = 5) contours and vectors (left) and pressure coefficient contours (right) at r/R equal to (a) 0.25, (b) 0.5, (c) 0.75, and (d) 0.9875.
4. Fluid–Structure Interaction—Structural Assessment
The next step of the study covers the structural assessment of the blade and the entire wind turbine. Under inspection will be the taken stresses and deformations. The evaluation of stresses appearing in the material allows assessing the safety of the structure—whether the structure will not start to crack or creep. Deformations, meaning tip deflections and cross-sectional twist, provide information about potential changes of the airflow around the blade.
It is important to underline that the FSI simulations receive relatively little attention for SWTs of 1-kW power range since their blades are usually less prone to rupture than those of megawatt-size machines (due to, for instance, more uniform rotor disc loading). The current study shows that the FSI successful application due to two chief aspects: to ensure that the applied, unorthodox material can withstand severe loads, and to try to estimate the influence of blade deformation due to the aerodynamic loads and check if this is a major concern for this size of machines.
4.1. Operational Cases and Boundary Conditions
The turbine is designed to operate in the wind speed range varying from 6 to 12 m/s. However, the numerical tests were also performed for velocities above this range, in extreme cases, for the structural strength evaluation. Four particular wind cases were investigated: the maximum thrust operation at normal operation, overload condition (twice the normal wind speed), and extreme loads (V = 42 m/s) for two rotor modes: working and stopped. Extreme working load corresponds to the point just before stopping the turbine, while static corresponds to when the turbine has stopped. Overload conditions correspond to the case between the upper limit of operational condition (max thrust) and extreme loads. Each of these cases corresponds to different flow parameters given in Table 3.
Table 3.
Load cases under inspection in structural analysis.
The blade of the wind turbine is subjected to two types of loads: pressure from flowing fluid and centrifugal forces. Therefore, in the case of the analyzed blade, following loads and boundaries are assumed (see Figure 7): fixed support at the beginning of the blade – in the place where the blade is in contact with the hub (A); the rotational velocity of the blade enabling to calculate deformations due to centrifugal forces (B); pressure fields imported from fluid flow simulation (C, see exemplary imported pressure in Figure 8).
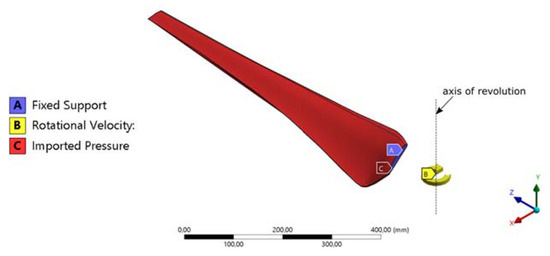
Figure 7.
Applied loads and boundary conditions.
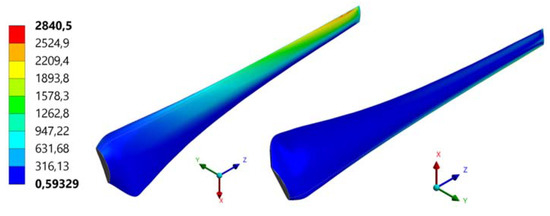
Figure 8.
Map of imported pressure on the pressure and suction sides of the blade (results in [Pa]).
4.2. Mesh Creation and Choice
Wind turbine blades, under operation, are mainly subjected to bending and torsion. To capture these phenomena correctly, proper structural mesh must be prepared. The analyzed blade is a sweepable body, making it possible to only use solid hexahedron elements instead of tetrahedrons. The body was meshed using ANSYS Solid 185 elements with eight nodes with three degrees of freedom at each node (translations in all directions). Moreover, the body is going to be subjected to bending, which means that at least three elements through the thickness are necessary to capture the stresses properly. For the mesh convergence study, four meshes are prepared—the mesh operations and sizings are as follows (see Figure 9):
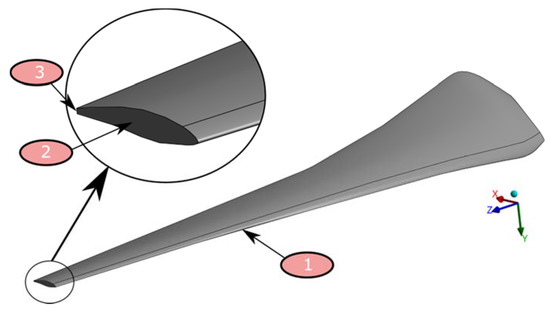
Figure 9.
Mesh operations on the blade.
- Sweep method—this mesh parameter forces the software to sweep the elements across the whole length of the blade;
- Face sizing—face sizing of the cross-section enables to create required size element throughout the thickness of the blade;
- Edge sizing of the trailing edge is set in order to obtain in this place at least three elements throughout the blade thickness.
Four meshes under inspection are denoted as I, II, III, and IV. First, three meshes differ only by means of the sizing of elements. In mesh IV, additionally, the bias in the length of the blade direction is applied. The mesh parameters for these densities are presented in Table 4. The cross-sections of the blades for meshes II, III, and IV are the same. The comparison of these cross-sections with a cross-section of the mesh I is presented in Figure 10.
Table 4.
Mesh sizing.
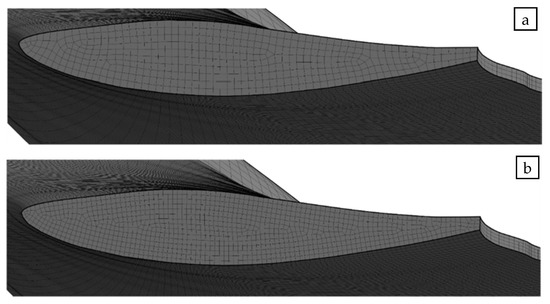
Figure 10.
Comparison of blade grids in cross-sections in meshes (a) II, III, IV, and (b) I.
Mesh convergence study has been performed for maximal thrust case (wind speed equal to 12 m/s and TSR = 5). The criteria for investigating these three meshes are as follows:
- Maximal deflection of the blade tip δ—see the map of vertical deflections in Figure 11;
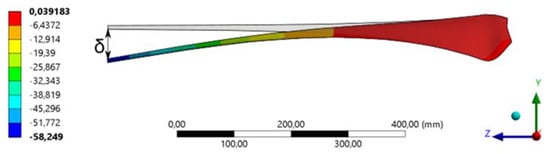 Figure 11. Blade tip deflection δ (in mm).
 - Maximal equivalent stress in the blade σmax—see the map of equivalent stresses in Figure 12;
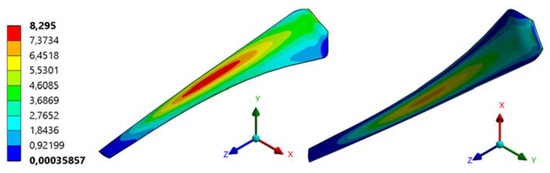 Figure 12. Map of equivalent (von Mises) stresses appearing in the blade σmax (in MPa).
 - The maximal angle of additional, deformation blade twist Δβ—see Figure 13.
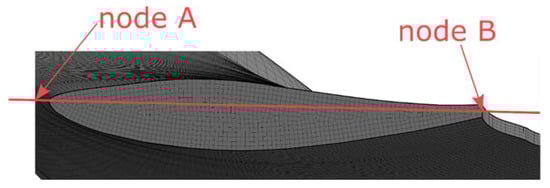 Figure 13. Control line passing through the leading and trailing edge of the blades for determining blade tip twist.
The last parameter, which is the twist of the blade due to deformation (in addition to the design section twist), must be quantified manually by means of comparing coordinates of the nodes before and after deformation. It is determined for the blade tip, as the highest angular deformations of the blade appear there. Coordinates of the leading edge node with coordinates of the mid-node at the trailing edge are being extracted from the software and twist in blade-tip cross-section plane is being calculated.
Based on the coordinates of points A and B, a twisting of the blade tip is determined. A line is traced through points at the blade tip leading edge (A) and trailing edge (B). The angle of inclination of this line with respect to the rotor plane of rotation may be computed using simple mathematical transformations, both before and after the deformation. A difference between these two values, Δβ, is a measure of the deformation twist angle of the blade due to deformation.
A summary of all three examined parameters is shown in Table 5. It is visible that all mesh densities are providing the results, which are in agreement with each other in terms of the deformations—both total deflections and deformation twist angles are comparable to each other for all structural meshes (the relative difference is not higher than 2%). The situation is similar when talking about the convergence of the value of allowable stress—the relative differences between two diverging results are not exceeding the value of 2%.
Table 5.
Mesh convergence study results.
4.3. Stresses and Deformations—Discussion
The structural assessment of the wind turbine has been performed on structural mesh no. III as the mesh with the smallest number of elements and fulfilling all convergence criteria. For all considered cases, tip deflection, maximal equivalent stresses and deformation twist have been calculated using one-way coupling FSI. The data are presented in Table 6. Moreover, tip deflections and maximal equivalent stresses appearing in the structure as the function of wind speed and TSR are presented in Table 6, respectively.
Table 6.
Tip deflection, maximal equivalent stresses, and deformation twist for all considered cases (mesh III).
From the point of view of this study, a very significant parameter is the deformation twist of the blade. The value of this parameter strongly affects the efficiency of the turbine, as it results in operation of the airfoil in adverse, out-of-design conditions. If Δβ is too high, a stall may occur and provoke efficiency drop. In this case, however, the study proves that the angular deformation of the blade should not have a significant influence on the rotor efficiency. Numerical tests had shown that considered structure is not twisting more than 0.05°, which is a very good result, indicating that the consecutive blade sections are well in their operation regions. The total deflection of the blade is not playing a significant role because the total area of the blade is almost constant. Summing up, according to these results, it can be stated that deformations of the blade will not affect its operation.
The last parameters to be analyzed are equivalent stresses (Von Mises). In the case of the blades, the highest stresses are appearing in the middle of the length of the blade and near connection with the hub. The flexural strength of Polyamide PA66 MO is equal to 109 MPa. This value is not exceeded for any of the considered cases, meaning that the turbine is structurally safe.
5. Conclusions
The article summarizes the observations made in frames of a numerical study of a small HAWT performance. The simulation was based on the reference experiment, performed on a prototype in wind tunnel conditions. The results of fluid flow assessment prove to underestimate the HAWT performance, which was attributed to the simplifications of the model, but a satisfactory qualitative agreement is found between simulation and experiment nonetheless.
Furthermore, thanks to one-way coupling FSI, it was possible to perform a structural assessment of the turbine. Firstly, stresses occurring in the blade during different operational load cases were inspected. The study proved that the structural integrity of CNC-milled blades is not threatened in its operating regions, and there are still high safety margins. Next, the study of deformations delivered an overview of potential blade twisting and bending due to the experienced loads. Under normal operating conditions of the assessed wind turbine, these additional deformations turned out to be negligible, with very little to no harm to blade aerodynamics.
The study proved that—in the context of small wind turbines—the FSI analysis may be an interesting choice not only for the strength analysis of non-orthodox materials but may also try to help estimate the influence of the blade deformation on rotor performance. Future plans include extending the simulation towards transient investigations in order to examine the fatigue influence on the blade endurance.
Author Contributions
Data curation, M.L. and P.C.; Investigation, P.C.; Supervision, D.O.; Writing – original draft, M.L., P.C. and D.O. All authors have read and agreed to the published version of the manuscript.
Funding
The investigations have been performed under the research project POWR.03.02.00-00-I042/16-00 of the National Centre for Research and Development.
Acknowledgments
The authors would like to thank the GUST team for sharing the experience and data collected during the TU Delft Open Jet Facility wind turbine prototype testing.
Conflicts of Interest
The authors declare no conflict of interest.
Nomenclature
| FRM | Fully-resolver Rotor Model | |
| FSI | Fluid–Structure Interaction | |
| GUST | Generative Urban Small Turbine | |
| HAWT | Horizontal-Axis Wind Turbine | |
| NREL | National Renewable Energy Laboratory | |
| SST | Shear Stress Transport (turbulence model) | |
| SWT | Small Wind Turbine | |
| VAWT | Vertical-Axis Wind turbine | |
| Cp | - | Power coefficient |
| E | GPa | Young modulus |
| Ma | - | Mach number |
| P | W | Wind turbine power |
| R | m | Rotor radius |
| TI | % | Turbulence intensity |
| TSR | - | Tip-Speed Ratio |
| U | MPa | Tensile strength |
| V | m/s | (Reference) wind speed |
| cpress | - | Pressure coefficient |
| m | kg | (Blade) mass |
| p | Pa | Pressure |
| y+ | - | Dimensionless distance |
| Δβ | deg | Maximal angle of blade twist due to deformation |
| δ | mm | Maximal deflection of the blade tip |
| ν | - | Poisson’s ratio |
| ρ | kg/m3 | Density |
| σmax | MPa | Maximal equivalent stress in the blade |
| ω | rad/s | Rotational speed |
References
- BP Plc. BP Statistical Review of World Energy 2019; BP Plc: London, UK, 2019. [Google Scholar]
- Ma, T.; Javed, M.S. Integrated sizing of hybrid PV-wind-battery system for remote island considering the saturation of each renewable energy resource. Energy Convers. Manag. 2019, 182, 178–190. [Google Scholar] [CrossRef]
- Neto, P.B.L.; Saavedra, O.R.; Oliveira, D.Q. The effect of complementarity between solar, wind and tidal energy in isolated hybrid microgrids. Renew. Energy 2020, 147, 339–355. [Google Scholar] [CrossRef]
- Jamieson, P. Multi Rotor Solution for Large Scale Offshore Wind Power. In Proceedings of the EERA Deepwind 2017, Trondheim, Norway, 18–20 January 2017. [Google Scholar]
- Folkecenter for Renewable Energy. Catalogue of Small Wind Turbines (under 50 kW); Folkecenter Print; Folkecenter for Renewable Energy: Hurup Thy, Denmark, 2016. [Google Scholar]
- WINDExchange. WINDExchange, Small Wind Guidebook; US Department of Energy, Office of Energy Efficiency and Renewable Energy: Washington, DC, USA, 2020.
- Stathopoulos, T.; Alrawashdeh, H.; Al-Quraan, A.; Blocken, B.; Dilimulati, A.; Paraschivoiu, M.; Pilay, P. Urban wind energy: Some views on potential and challenges. J. Wind Eng. Ind. Aerodyn. 2018, 179, 146–157. [Google Scholar] [CrossRef]
- Anup, K.C.; Whale, J.; Urmee, T. Urban wind conditions and small wind turbines in the built environment: A review. Renew. Energy 2019, 131, 268–283. [Google Scholar]
- Pourrajabian, A.; Dehghan, M.; Javed, A.; Wood, D. Choosing an appropriate timber for a small wind turbine blade: A comparative study. Renew. Sustain. Energy Rev. 2019, 100, 1–8. [Google Scholar] [CrossRef]
- Glück, M.; Breuer, M.; Durst, F.; Halfmann, A.; Rank, E. Computation of fluid–structure interaction on lightweight structures. J. Wind Eng. Ind. Aerodyn. 2001, 89, 1351–1368. [Google Scholar] [CrossRef]
- Löhner, R.; Haug, E.; Michalski, A.; Muhammahd, B.; Drego, A.; Nanjundaiah, R.; Zarfam, R. Recent advances in computational wind engineering and fluid–structure interaction. J. Wind Eng. Ind. Aerodyn. 2015, 144, 14–23. [Google Scholar] [CrossRef]
- Wang, L.; Quant, R.; Kolios, A. Fluid structure interaction modelling of horizontal-axis wind turbine blades based on CFD and FEA. J. Wind Eng. Ind. Aerodyn. 2016, 158, 11–25. [Google Scholar] [CrossRef]
- Lee, K.; Huque, Z.; Kommalapati, R.; Han, S.-E. Fluid-structure interaction analysis of NREL phase VI wind turbine: Aerodynamic force evaluation and structural analysis using FSI analysis. Renew. Energy 2017, 113, 512–531. [Google Scholar] [CrossRef]
- Hand, M.M.; Simms, D.A.; Fingersh, L.J.; Jager, D.W.; Cotrell, J.R.; Schreck, S.; Larwood, S.M. Unsteady Aerodynamics Experiment Phase VI: Wind Tunnel Test Configurations and Available Data Campaigns; National Renewable Energy Laboratory: Golden, CO, USA, 2001.
- MacPhee, D.W.; Beyene, A. Fluid–structure interaction analysis of a morphing vertical axis wind turbine. J. Fluid Struct. 2016, 60, 143–159. [Google Scholar] [CrossRef]
- Lipian, M.; Dobrev, I.; Karczewski, M.; Massouh, F.; Jozwik, K. Small wind turbine augmentation: Experimental investigations of shrouded- and twin-rotor wind turbine systems. Energy 2019, 186, 115855. [Google Scholar] [CrossRef]
- Kulak, M.; Lipian, M.; Zawadzki, K. Investigation of performance of Small Wind Turbine blades with winglets. Int. J. Numer. Method Heat 2020, in press. [Google Scholar] [CrossRef]
- Lipian, M.; Kulak, M.; Stepien, M. Fast Track Integration of Computational Methods with Experiments in Small Wind Turbine Development. Energies 2019, 12, 1625. [Google Scholar] [CrossRef]
- Burton, T.; Jenkins, N.; Sharpe, D.; Bossanyi, E. Wind Energy Handbook, 2nd ed.; John Wiley & Sons, Ltd.: Chichester, West Sussex, UK, 2011. [Google Scholar]
- Grapow, F.; Raszewska, D.; Skalski, R.; Czarnecki, J.; Telega, K.; Miller, M.; Rogowski, P.; Prociow, M. Small wind, big potential: HAWT design case study. MATEC Web Conf. 2018, 234, 01005. [Google Scholar] [CrossRef][Green Version]
- Kadrowski, D.; Kulak, M.; Lipian, M.; Stepien, M.; Baszczynski, P.; Zawadzki, K.; Karczewski, M. Challenging low Reynolds—SWT blade aerodynamics. MATEC Web Conf. 2018, 234, 01004. [Google Scholar] [CrossRef]
- Lipian, M.; Karczewski, M.; Jozwik, K. Analysis and comparison of numerical methods for design and development of small Diffuser-Augmented Wind Turbine (DAWT). In Proceedings of the IECON 2016—42nd Annual Conference of the IEEE Industrial Electronics Society, Florence, Italy, 23–26 October 2016. [Google Scholar]
- Ansys CFX, Release 18.0, Help System, Book: CFX; ANSYS, Inc.: Canonsburg, PA, USA, 2017.
- Open Jet Facility, TU Delft. Available online: https://www.tudelft.nl/lr/organisatie/afdelingen/aerodynamics-wind-energy-flight-performance-and-propulsion/facilities/low-speed-wind-tunnels/open-jet-facility/ (accessed on 23 February 2020).


© 2020 by the authors. Licensee MDPI, Basel, Switzerland. This article is an open access article distributed under the terms and conditions of the Creative Commons Attribution (CC BY) license (http://creativecommons.org/licenses/by/4.0/).