1. Introduction
When the flapping airfoil/wing mechanism was unveiled as a thrust production system, the scientific community foresaw the possibility to investigate new aerodynamic phenomena and develop newer systems that could improve substantially the way airplanes fly nowadays, which is today still rather conservative [
1]. However, in the first part of the 20th Century, very little effort was made in terms of understanding and exploiting the aerodynamics of living beings.
Animals such as insects [
2], birds, small fishes, and even the big blue whale are equipped with a spectacular propulsion system that was subjected to natural selection processes over millions of years, which inevitably offers a significant advantage [
3,
4].
Based on the phenomena seen in Nature, Micro Aerial Vehicles (MAVs) and Nano Aerial Vehicles (NAVs) with indispensable civil and military applications such as surveillance, espionage, atmospheric weather monitoring, and catastrophe relief purposes [
5] are being developed to offer undeniable maneuverability and efficiency at lower length scales. The most advanced MAVs related research projects define these vehicles as vehicles with no length, width, or height larger than 15 cm, as declared in a Defense Advanced Research Projects Agency (DARPA) program [
6].
The flapping airfoil was firstly studied by Knoller and Verein [
7] and Betz [
8] that found that while plunging an airfoil, an effective angle of attack, which changes sinusoidally over time, would be created. As a result, an oscillatory aerodynamic force normal to the relative velocity was generated which could be decomposed in lift and thrust forces. Katzmayr [
9] experimentally verified the Knoller–Betz effect in an interesting way, by placing a stationary airfoil into a sinusoidal wind stream and measuring an average thrust.
However, the Knoller and Betz theory was only based on the airfoil motion and did not account for the vorticity shed downstream of the airfoil. Thus, later in 1935, Kármán and Burgers [
10] successfully explained theoretically the thrust generation mechanism based on the vortex shedding on the downstream side of the airfoil and the orientation of the wake vortices, identifying the typical von Kármán vortex street which is always associated with the production of drag or an averaged jet-like flow that generates a propulsive force explained by Newton’s third law of motion.
All these concepts were further studied by Freymuth [
11] using flow visualization of both plunging and pitching motions. Firstly, studying the aerodynamics of plunging and pitching airfoils offered a better understanding regarding the flutter and gust-response effects, which are based only on the analysis of the lifting forces [
12,
13]. Oscillating airfoils also opened new ways to study the impact of the dynamic stall on helicopter and propeller blades performance and how impactful is the wake created by a foregoing blade on the following blades [
14].
Plunging airfoils have been also analyzed by Lai and Platzer [
15], Lewin and Haj-Hariri [
16], and Young [
17], where the wake structures were intensively studied, such as the vortex-pair shedding that represents the transition from the drag producing wake to the thrust producing inverted von Kármán vortex street. Young and Lai [
18] concluded that this type of wake structure was caused by the interaction between bluff-body type natural shedding from the trailing edge and the motion of the airfoil and, more recently, Andersen et al. [
19] suggested that a drag-thrust transition wake showing a two-vortex pair configuration per oscillation period is a characteristic of low frequencies and high amplitudes oscillations.
The plunging motion was further investigated by Young and Lai [
20,
21] who found the impact of the several parameters governing this problem, especially the Strouhal number, which showed that maximum thrust and optimum efficiency take place at the near dynamic stall boundary. However, for lower Reynolds numbers, the problem becomes more complicated because efficient lift and thrust generation is achieved by shedding the leading-edge vortex [
22].
Interested in finding which flying conditions animals operate in, Taylor et al. [
23] dedicated their studies to forty-two species of birds, bats, and insects in cruise flight and verified that these creatures fly within a limited range of Strouhal numbers between 0.2 and 0.4. Hence, this parameter is a possible indicator of the flapping conditions that provide the most efficient flight, being essential to characterize the flight of several natural flyers, regardless of their scale.
Natural flyers use these forces effectively where thrust and lift production means that energy is transferred from the wings to the fluid. However, the study of oscillating airfoils has undergone a drastic shift when researchers identified the potential of flapping airfoils to extract energy from the flow field [
24]. Studies on energy harvesting efficiency over oscillating airfoils revealed that a harvester could achieve maximum efficiency of about 30% on sinusoidal motion for
1000 and 40% to 50% on nonsinusoidal motion; other efficiency-enhancing mechanisms might include corrugations at the foil surface, its structural flexibility, and multiple foil configuration [
25] such as the parallel foil configuration numerically investigated in [
26].
Introducing structural flexibility, as studied by Zhu et al. [
27], the airfoil shows a superior capability regarding energy extraction when comparing to the rigid case. The same conclusion is obtained by Jeanmonod and Olivier [
28], who firmly stated that a foil with constant mechanical properties in the chordwise direction is far from being an optimal solution, demonstrating that a flexible plate can extract double the power of a rigid structure.
Another way to improve extraction efficiency can also be achieved by creating an effective camber which will produce a lift enhancement that is associated with the output power. This concept was studied by Bouzaher et al. [
29], who added a Gurney flap at the trailing-edge that when synchronized with the flapping motion at a
1100 created this virtual camber that improved the output power. The lift production can be further improved by controlling the development of the leading-edge vortex than, when attached to the airfoil surface, contributed to the improvement in lift generation which brings once again an increase in the energy harvesting magnitude [
24]. The same concept may be applied for thrust enhancement where camber morphing also reveals the potential to maximize the ratio of thrust to lift of flapping airfoils in several flight conditions [
30].
Recently, Xia et al. [
31] presented a wide range review on the fluid dynamics of flapping foils/wings where the authors reviewed the effects of some key parameters such as the Reynolds number, reduced frequency, and flapping amplitude. In addition, the intricacies of this problem are explored and the main challenges are identified, such as, highly efficient thrust mechanism, 3D flow control methods, and types of motion.
Regarding the type of motion, Boudis et al. [
32] conclude that the sinusoidal waveform appears to favor the maximum propulsive efficiency notwithstanding the fact that nonsinusoidal trajectories can offer undeniable improvements, offering an increase up to 110% in terms of thrust production. At a Reynolds number of 5000, Dash et al. [
33] also studied the influence of the airfoil motion concluding that, when at high frequencies, the thrust performance can be recovered when tweaking the effective angle of attack profile to a different type of wave, such as the square waveform.
The present work studied numerically the flapping airfoil problem, in particular, the plunging motion which has not been yet subjected to sufficiently detailed studies when compared with the combined plunging and pitching. Hence, the present work aims at studying the influence of flight velocity, the motion’s frequency, and amplitude to fulfill this gap and help to understand the generation of thrust and what combinations in the operating domain are energetically adequate to a vehicle that uses the flapping mechanism as its mean of motion.
2. Methodology
The numerical methodology adopted for this paper is presented in this section. Firstly, the Reynolds-averaged Navier–Stokes (RANS) equations are selected as the governing equations, due to the unsteadiness of the current problem and the inherent turbulent phenomena seen in nature. The continuity and momentum averaged equations are written in a Cartesian tensor form as (e.g., ANSYS [
34] or Lopes et al. [
35]):
and
respectively.
The usage of an averaged formulation of the Navier–Stokes equations calls for the necessity of selecting a turbulence model that will model the velocity fluctuations as a function of the mean velocity field typically recurring to the Boussinesq hypothesis.
In the turbulence modeling field, some authors have studied the effectiveness of some turbulent models in representing the flow characteristics, but at the same time, some of the published research from other authors assumes the flow around flapping airfoils to be laminar. The Shear-Stress Transport
model was selected to access its capability in predicting the flow surrounding a plunging airfoil since it shows a superior capability in representing the flow surrounding oscillatory airfoils [
35].
In this study, the symmetrical airfoil NACA0012 is being used to simulate the plunging motion and analyze the flow configurations created by it. The airfoil’s motion is described by the equation
and its velocity is given by
where
A and
f are respectively the motion’s amplitude and frequency, respectively.
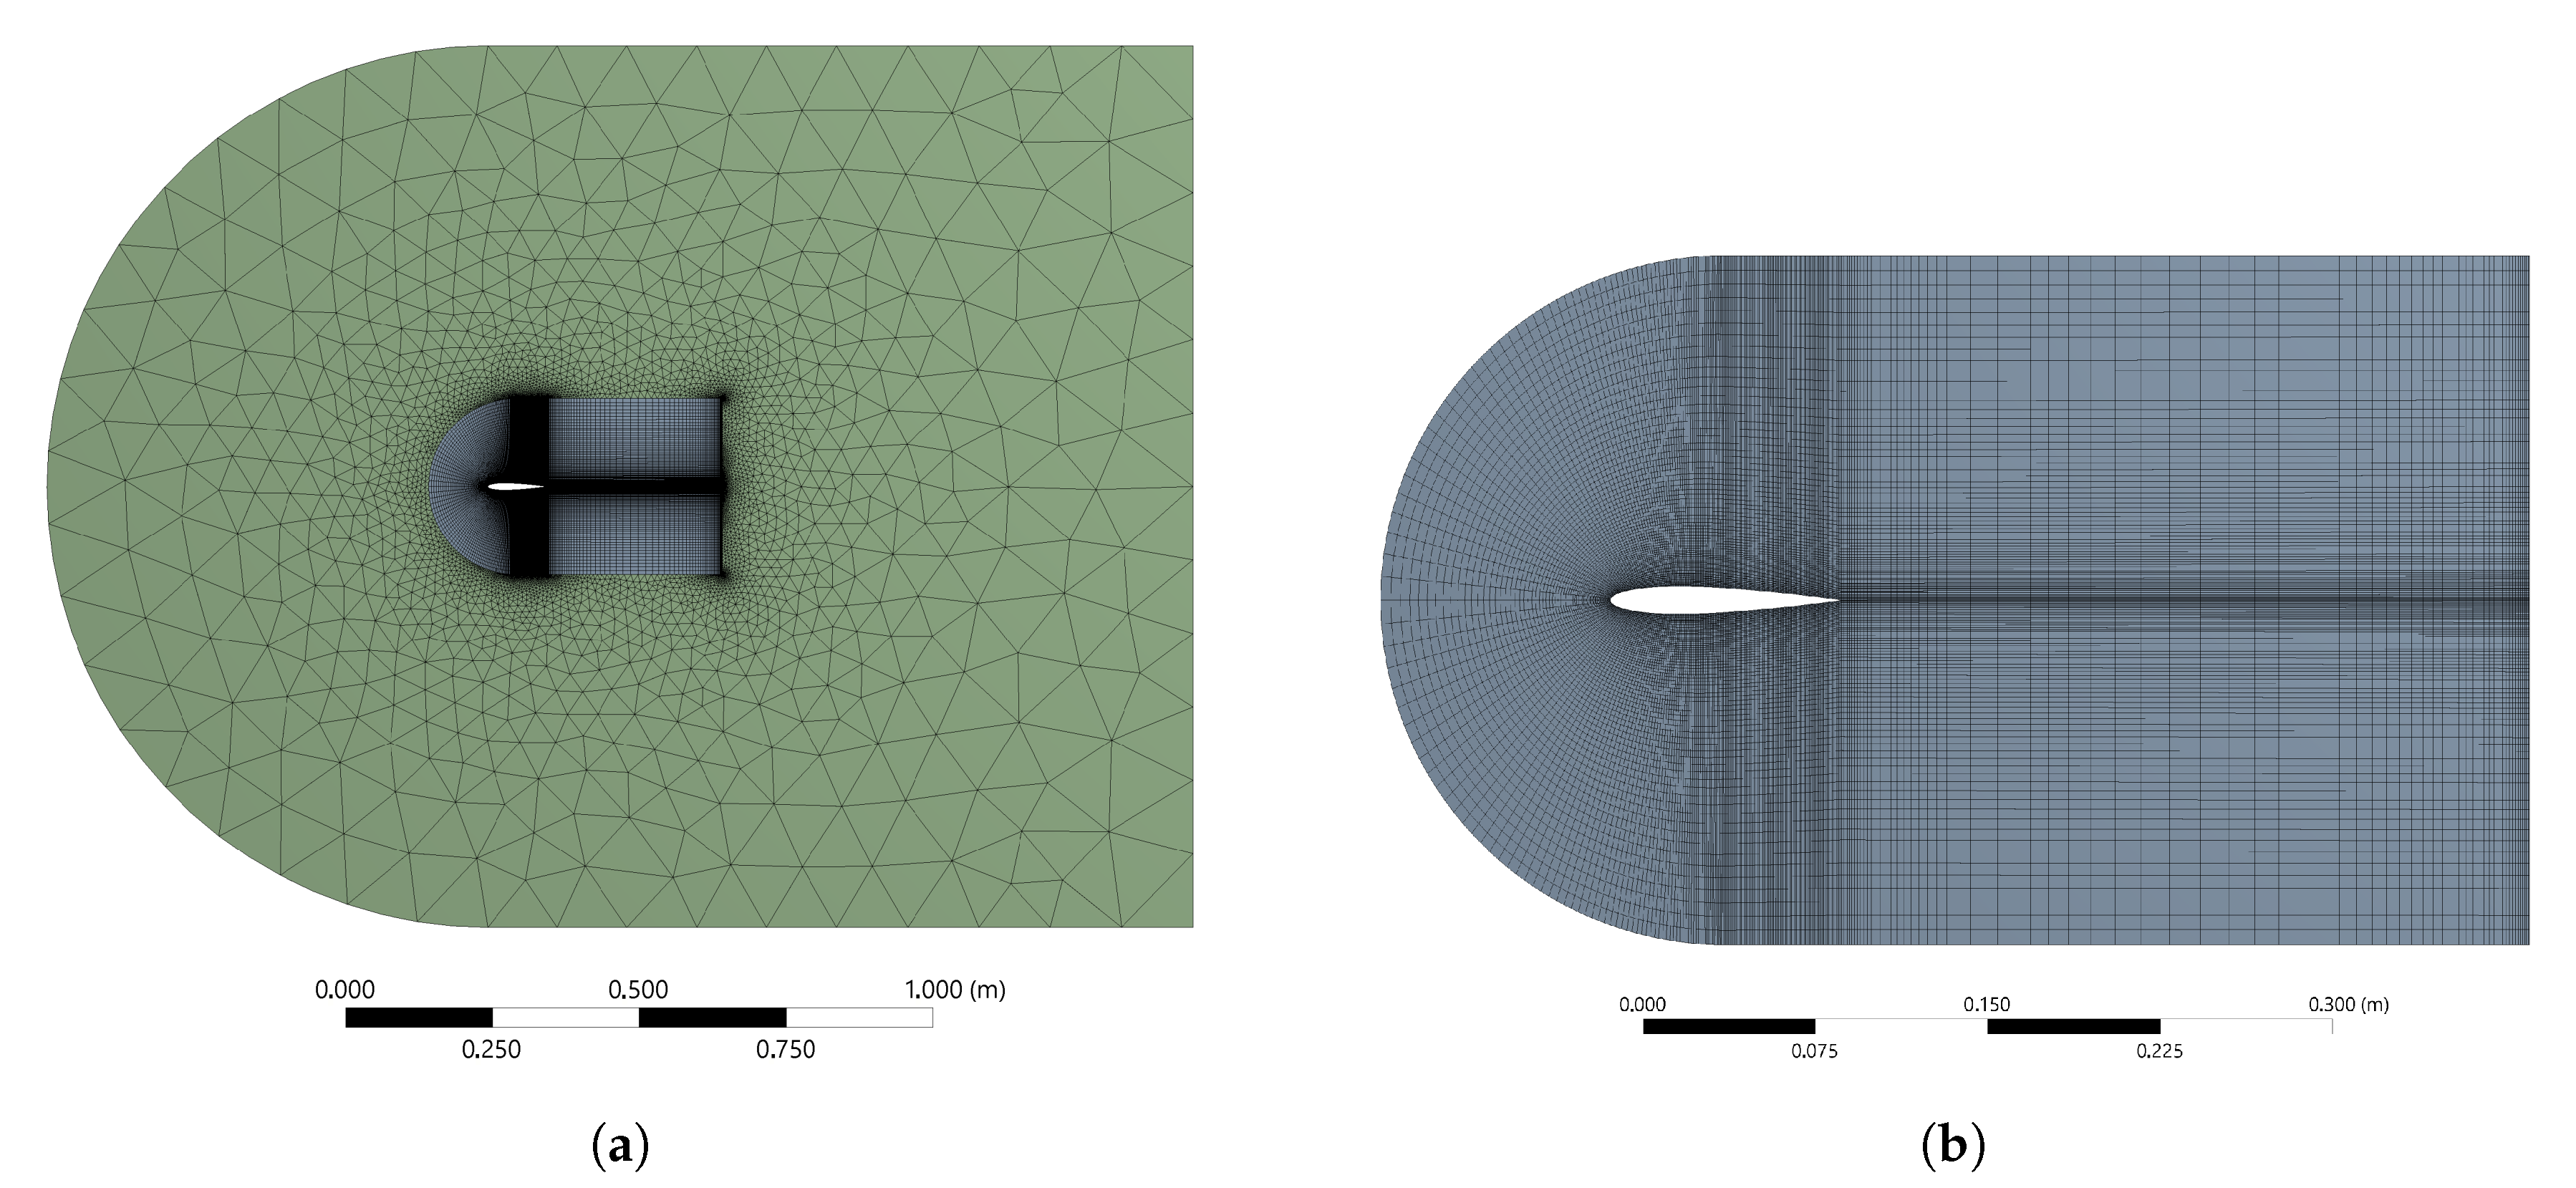
Simulations were carried out using ANSYS Fluent with a mesh (
Figure 1a) containing two main zones, which allowed the creation of a structured mesh around the airfoil (
Figure 1b) and an unstructured grid in the airfoil’s far-field. This mesh design effectively reduced the computational demand and time since only the outside part of the mesh was subjected to mesh update calculations such as deformation and remeshing.
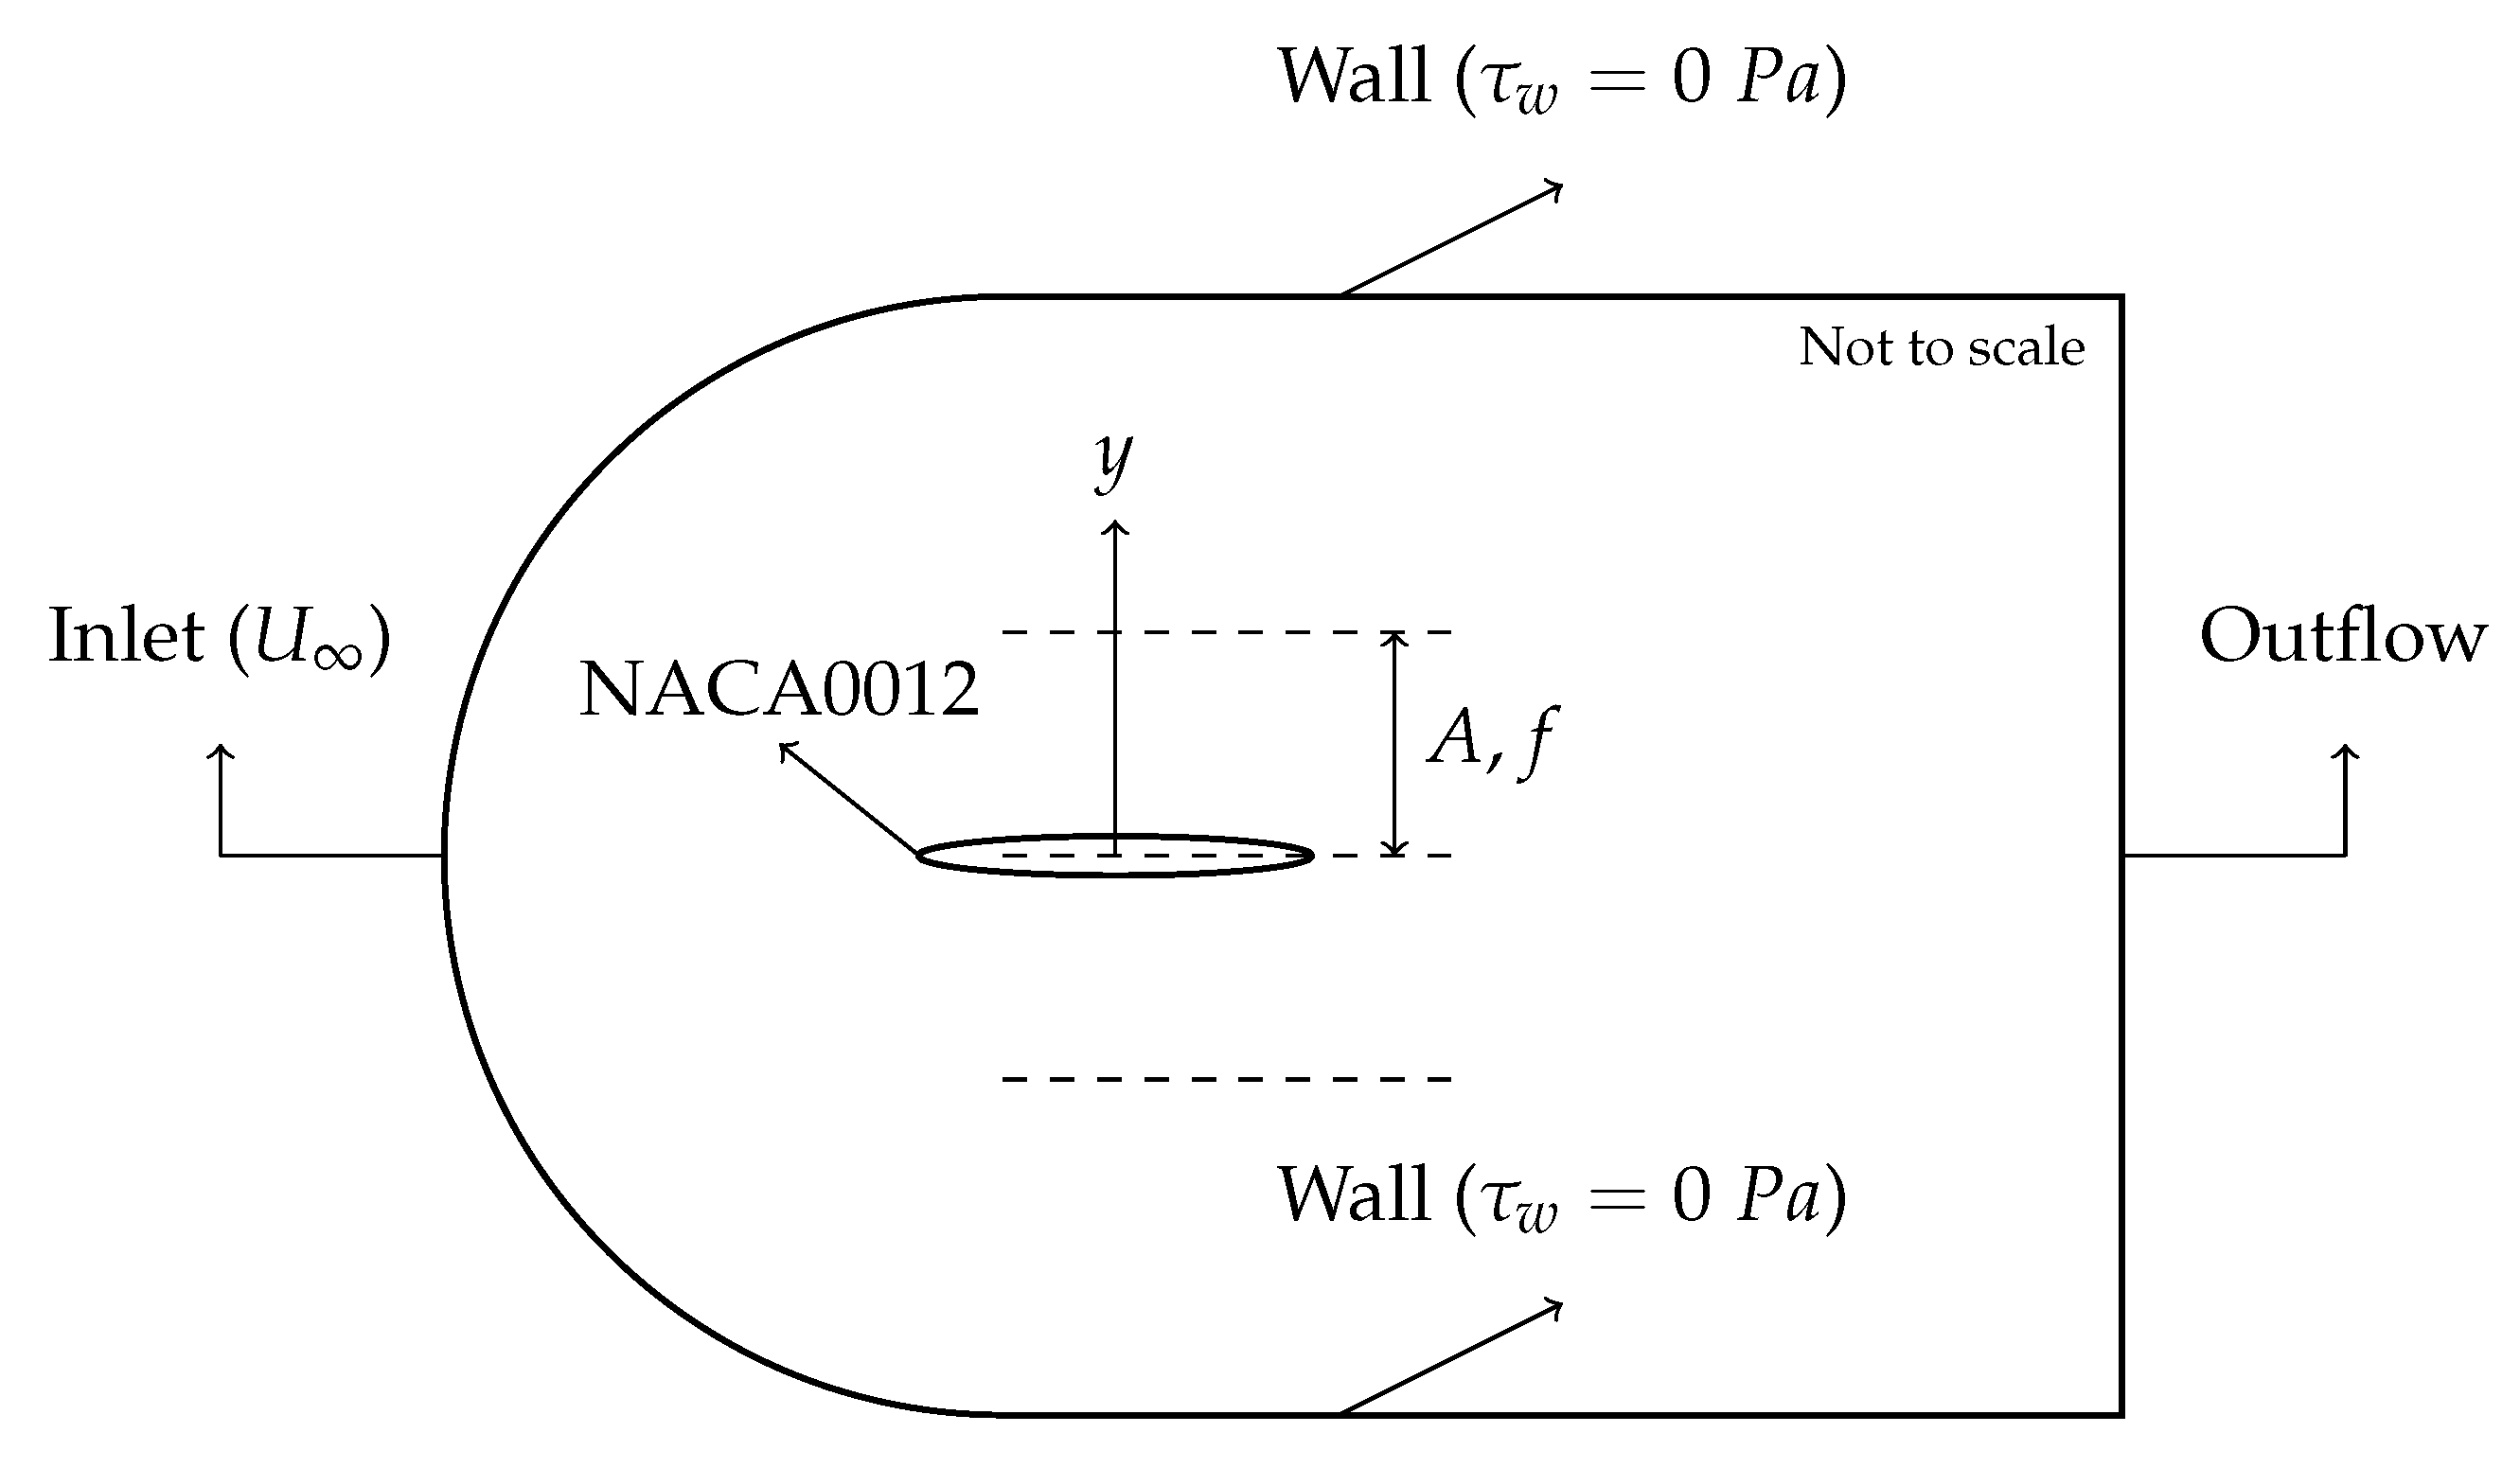
The computational domain boundaries consisting of an inlet, an outlet, upper and lower walls, and the airfoil, is represented in
Figure 2. The inlet was subjected to an inlet velocity boundary condition where the flow velocity was prescribed. On the outlet, the outflow boundary condition was applied, which is an extrapolation of the calculated variables on the interior. The remaining boundaries are walls, although with different characteristics, since the airfoil is treated as a wall where the no-slip condition is imposed, and the upper and lower walls are considered to have no shear stress which removes the boundary layer effects.
The Least Squares Cell-Based scheme was selected as the gradients evaluation method, PREssure STaggering Option (PRESTO!) was chosen as the pressure interpolation arrangement, and the momentum, turbulent kinetic energy, and specific dissipation rate equations were discretized in a 2D space using the second-order accurate QUICK scheme. Regarding the transient formulation and knowing beforehand that the dynamic mesh feature was activated, the first order implicit method (in time) was the only scheme available. The pressure-velocity coupling algorithm used is the Pressure-Implicit with Splitting of Operators (PISO) that is highly recommended for all transient flow calculations.
After each initialization, the mesh was adapted to ensure that was between 0 and 1 (values up to 5 were acceptable), since when using the turbulence model, it is fundamental to guarantee that the effects of the flow close to the walls are well resolved. Due to the boundary conditions, solution initialization and nonlinearity, which characterizes the Navier–Stokes equations, it was observed that the flow configuration would stabilize after analyzing at least five periods, always maintaining all residuals below .
The processing and analysis of the data (drag and lift coefficients exported during simulations) were made recurring to in-house C-programs, whose aim was to obtain the averaged aerodynamic coefficients and propulsive efficiency.
As mentioned before, the flapping mechanism is typically correlated with thrust production since it can, in some conditions, positively change the wake momentum and because of that, it is important to evaluate not only the generated force but also the propulsive efficiency which is the ratio between the generated power,
, and the power supply is given by
. The propulsive efficiency is then defined as
where
and
In these two last equations,
is the mean thrust coefficient,
is the drag coefficient,
is the lift coefficient, and
is the mean power coefficient, which are parameters vastly used by researchers to evaluate the aerodynamic performance [
24].
The influence of the mentioned parameters will be evaluated using the typical dimensionless quantities for a flapping airfoil: the reduced frequency,
k, the nondimensional amplitude,
h, Strouhal number,
, and the Reynolds number,
, shown in
Table 1 (see [
31] for details). The variables
,
,
,
c,
f, and
A are the inlet speed, air density, air dynamic viscosity, aerodynamic chord, motion frequency, and amplitude, respectively, all in SI units.
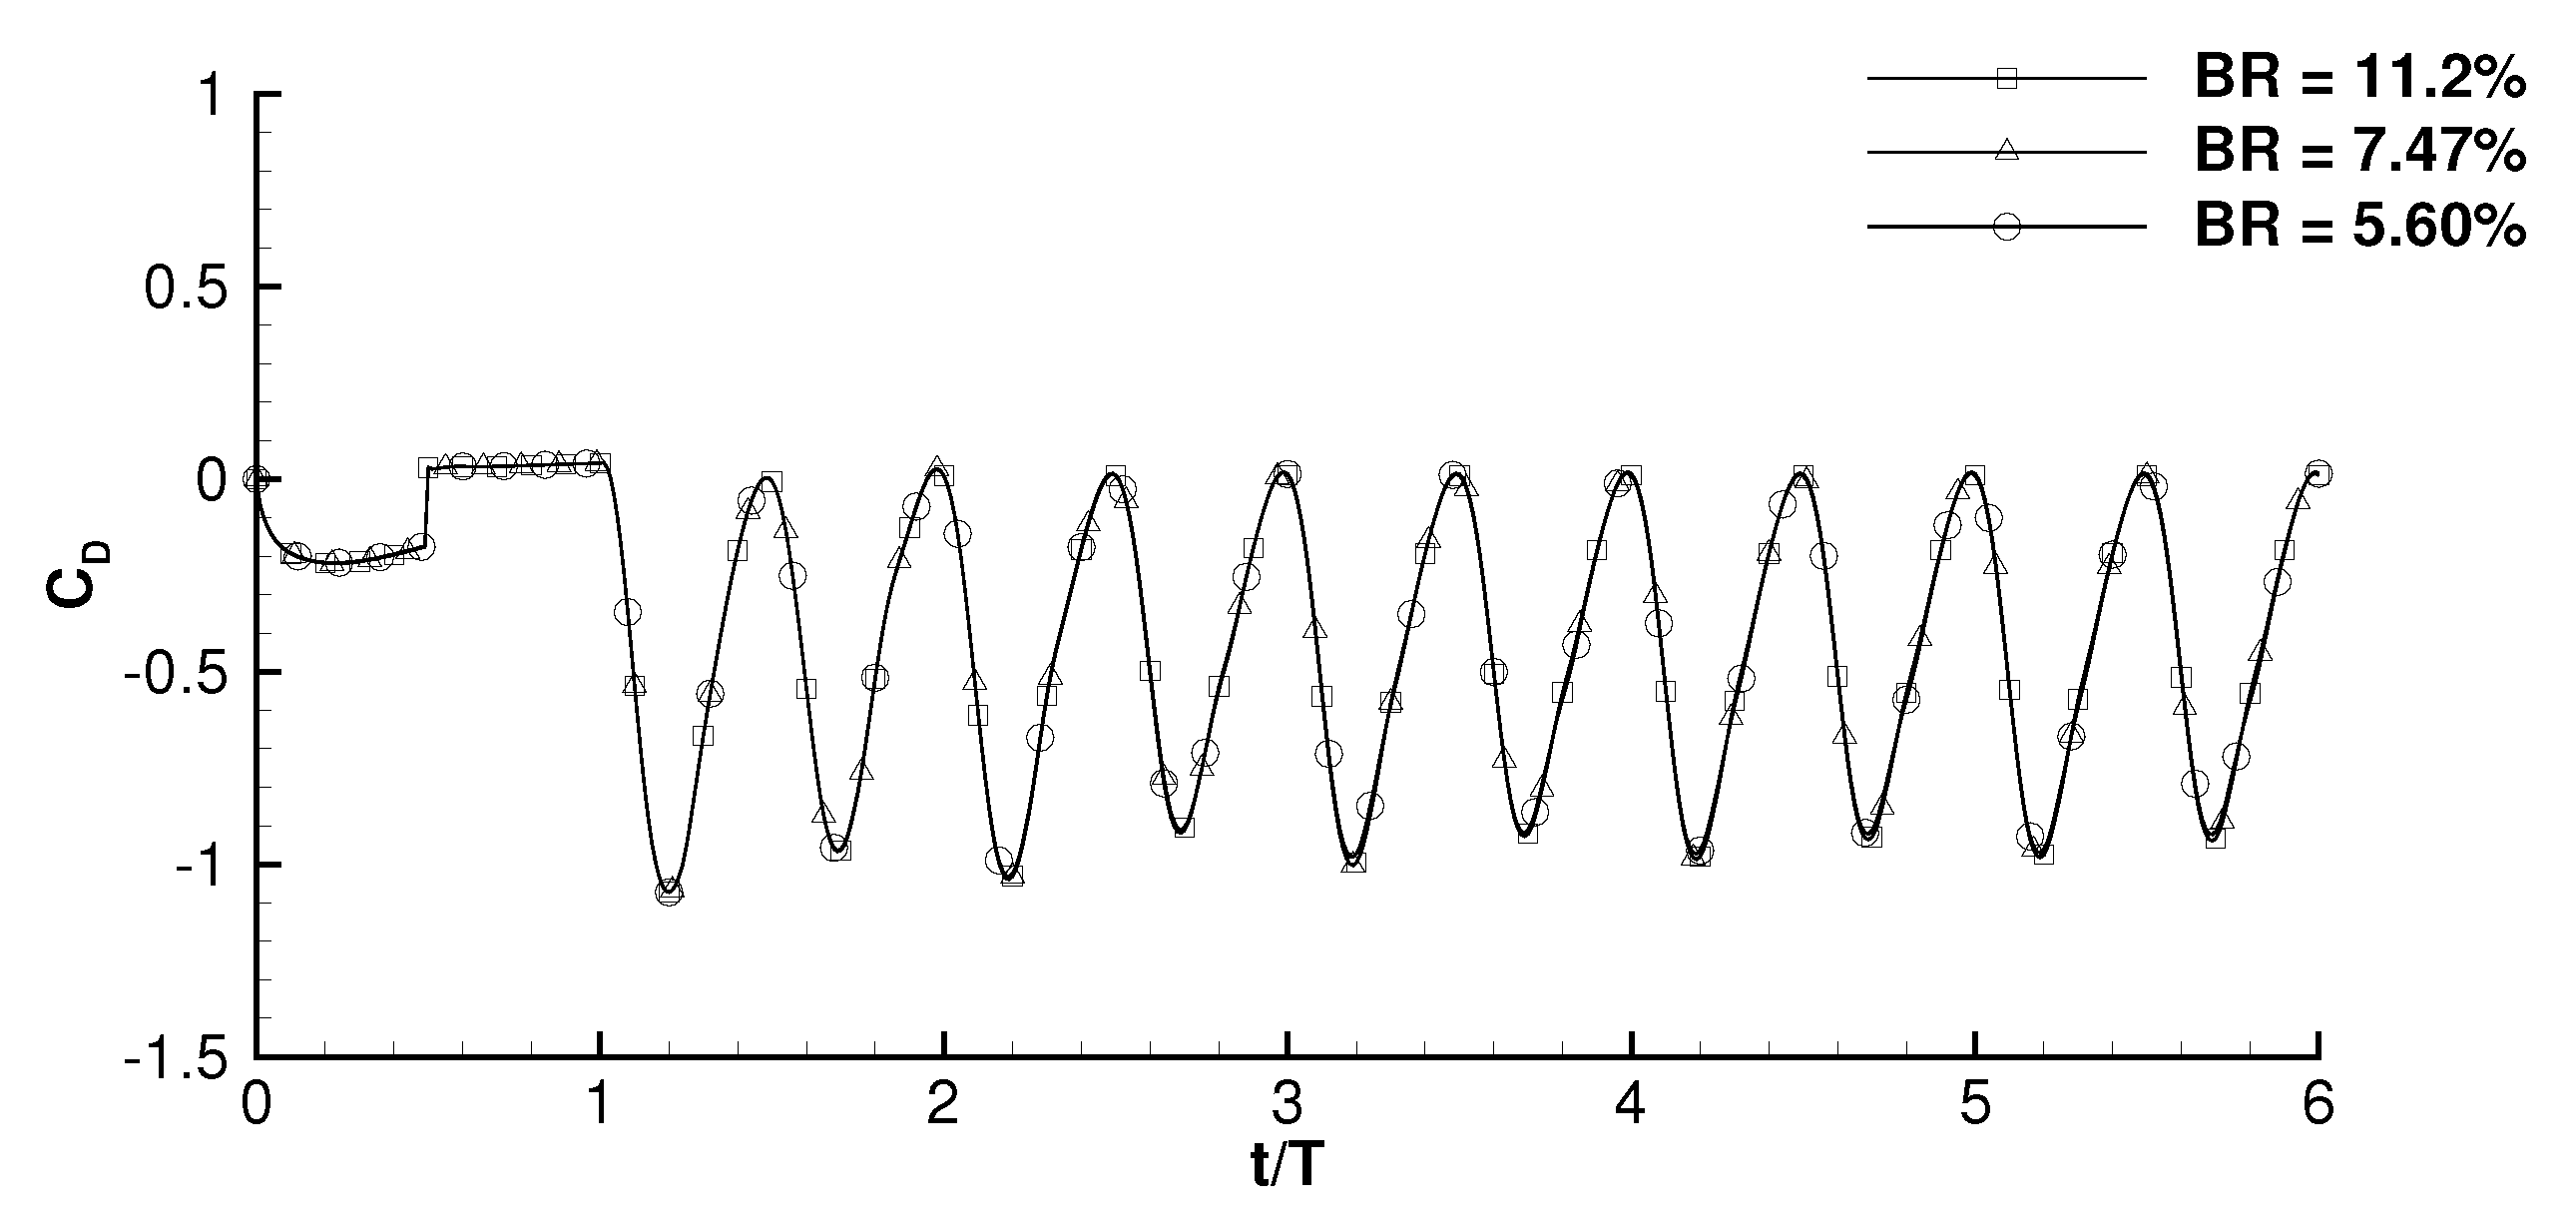
The numerical validation started by performing a boundary location, mesh, and time step independence studies for a Reynolds number of 17,000, a nondimensional amplitude of
, and a reduced frequency of
. The boundary location study, presented in
Figure 3, focused on the analysis of the blockage ratio influence on the drag coefficient over time. In this paper, the blockage ratio,
, was defined as being the ratio between the wake dimension and the inlet height, and it is seen that no considerable influence is seen for the different cases tested.
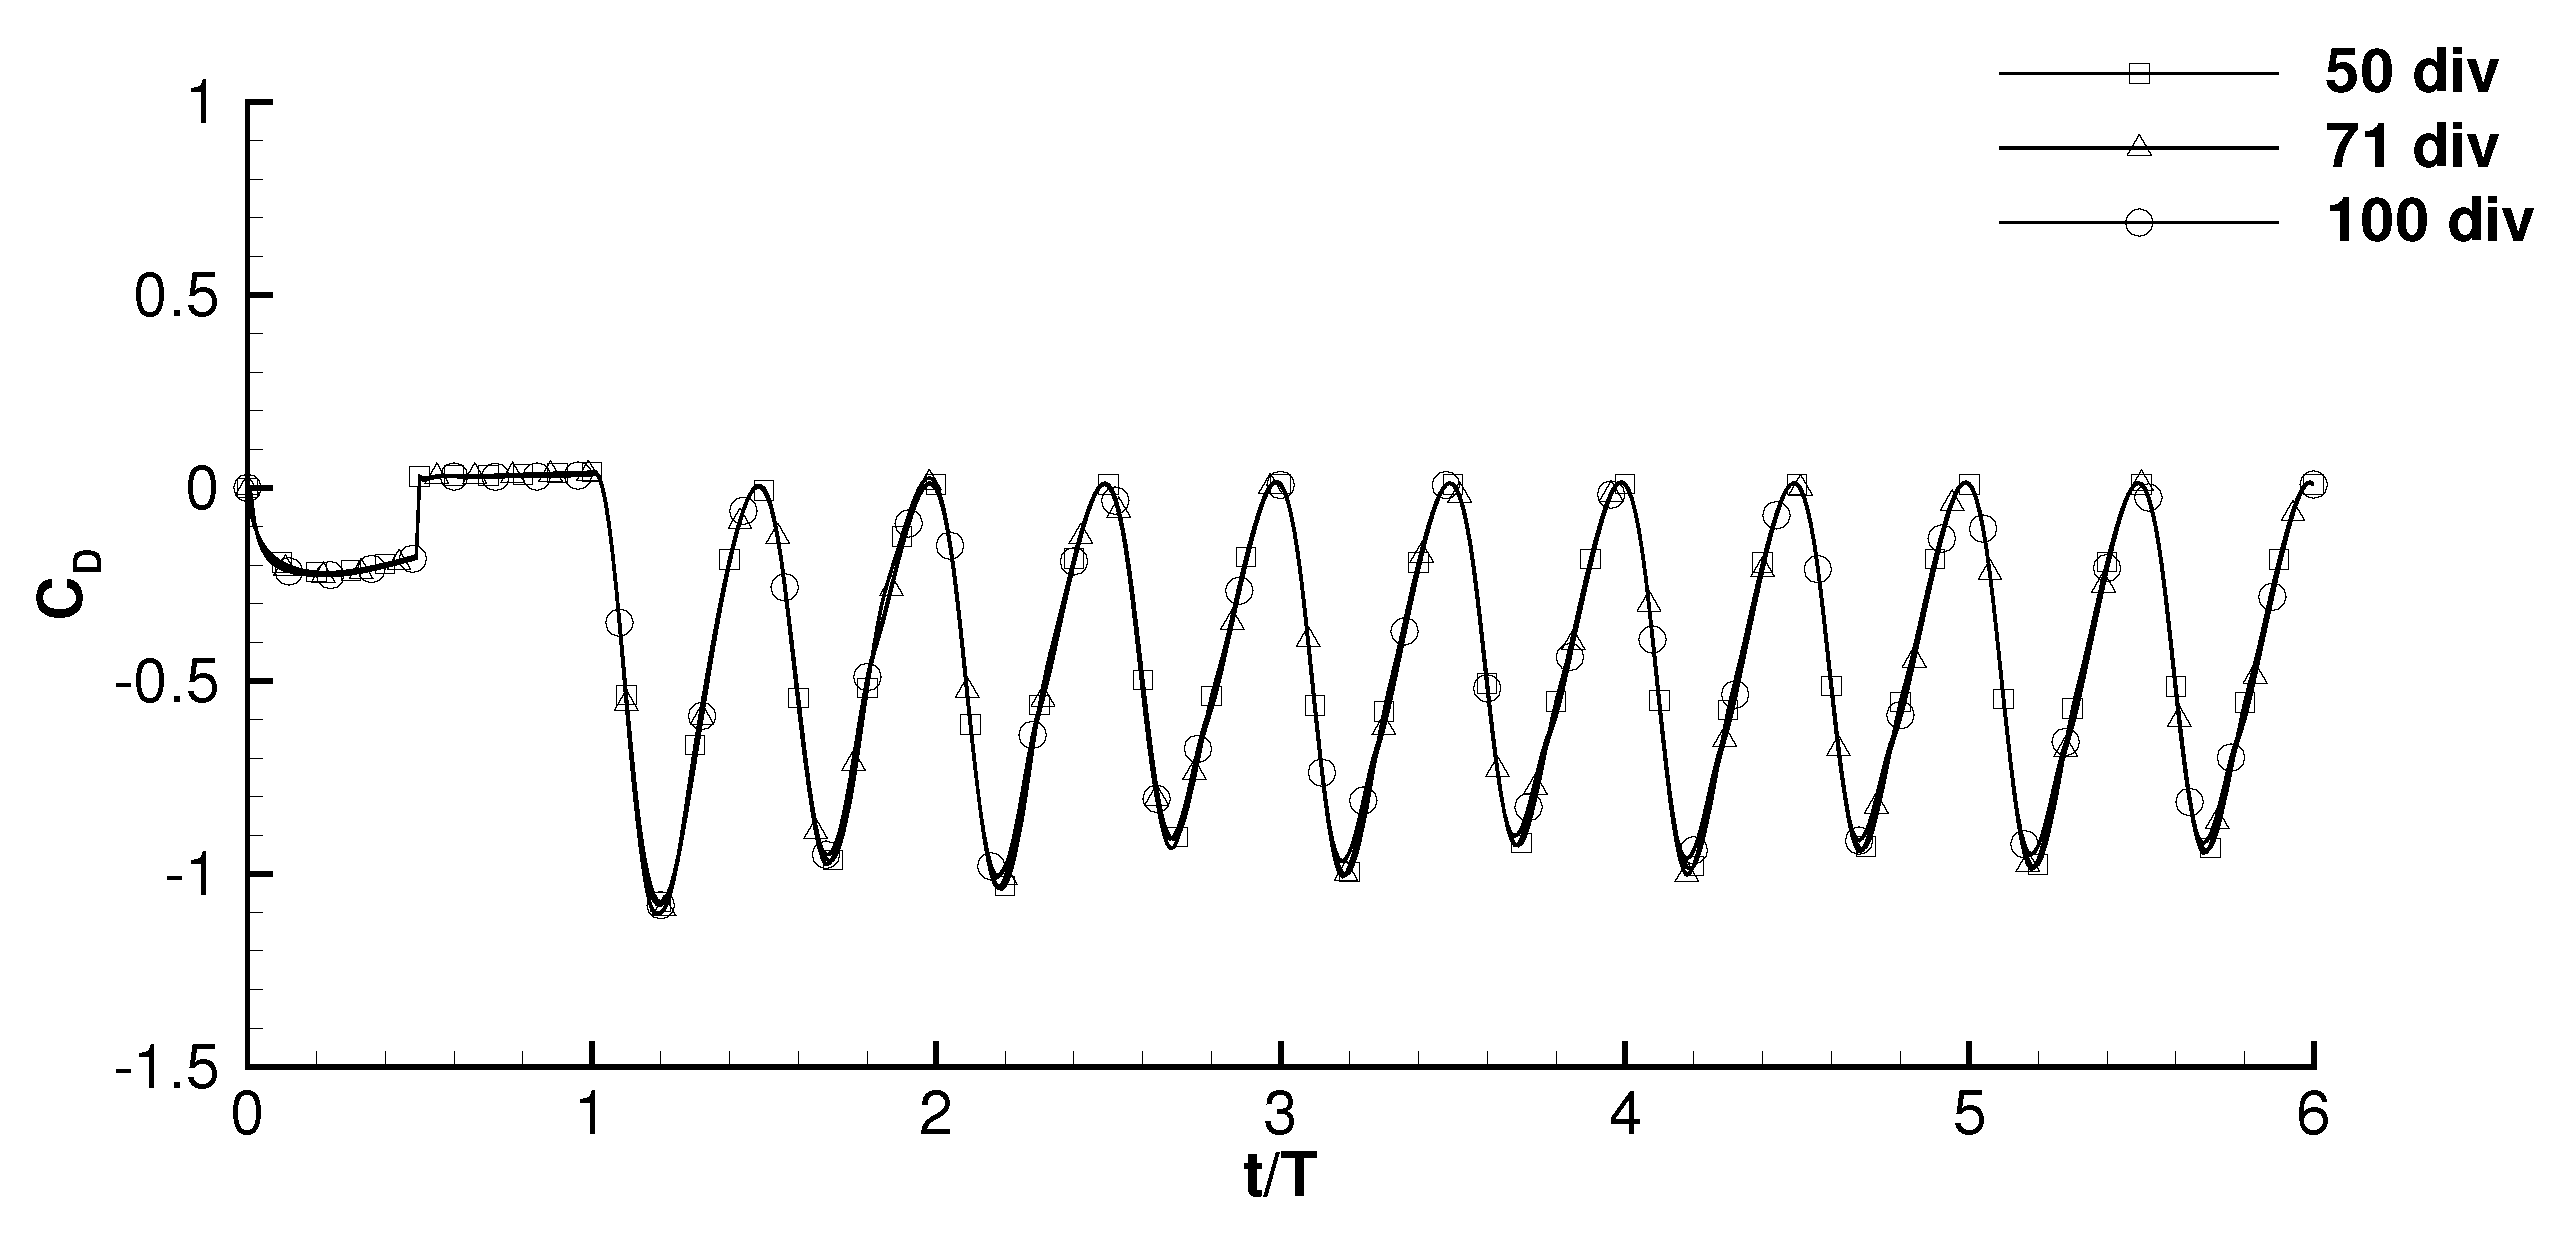
The mesh independence study was conducted through the refinement of the internal zone of the mesh into several divisions (50, 71, and 100 divisions), as shown in
Figure 4. It can be concluded that the mesh with 71 internal divisions holds an independent result that corresponds to a global mesh with 62,469 cells/52,394 nodes.
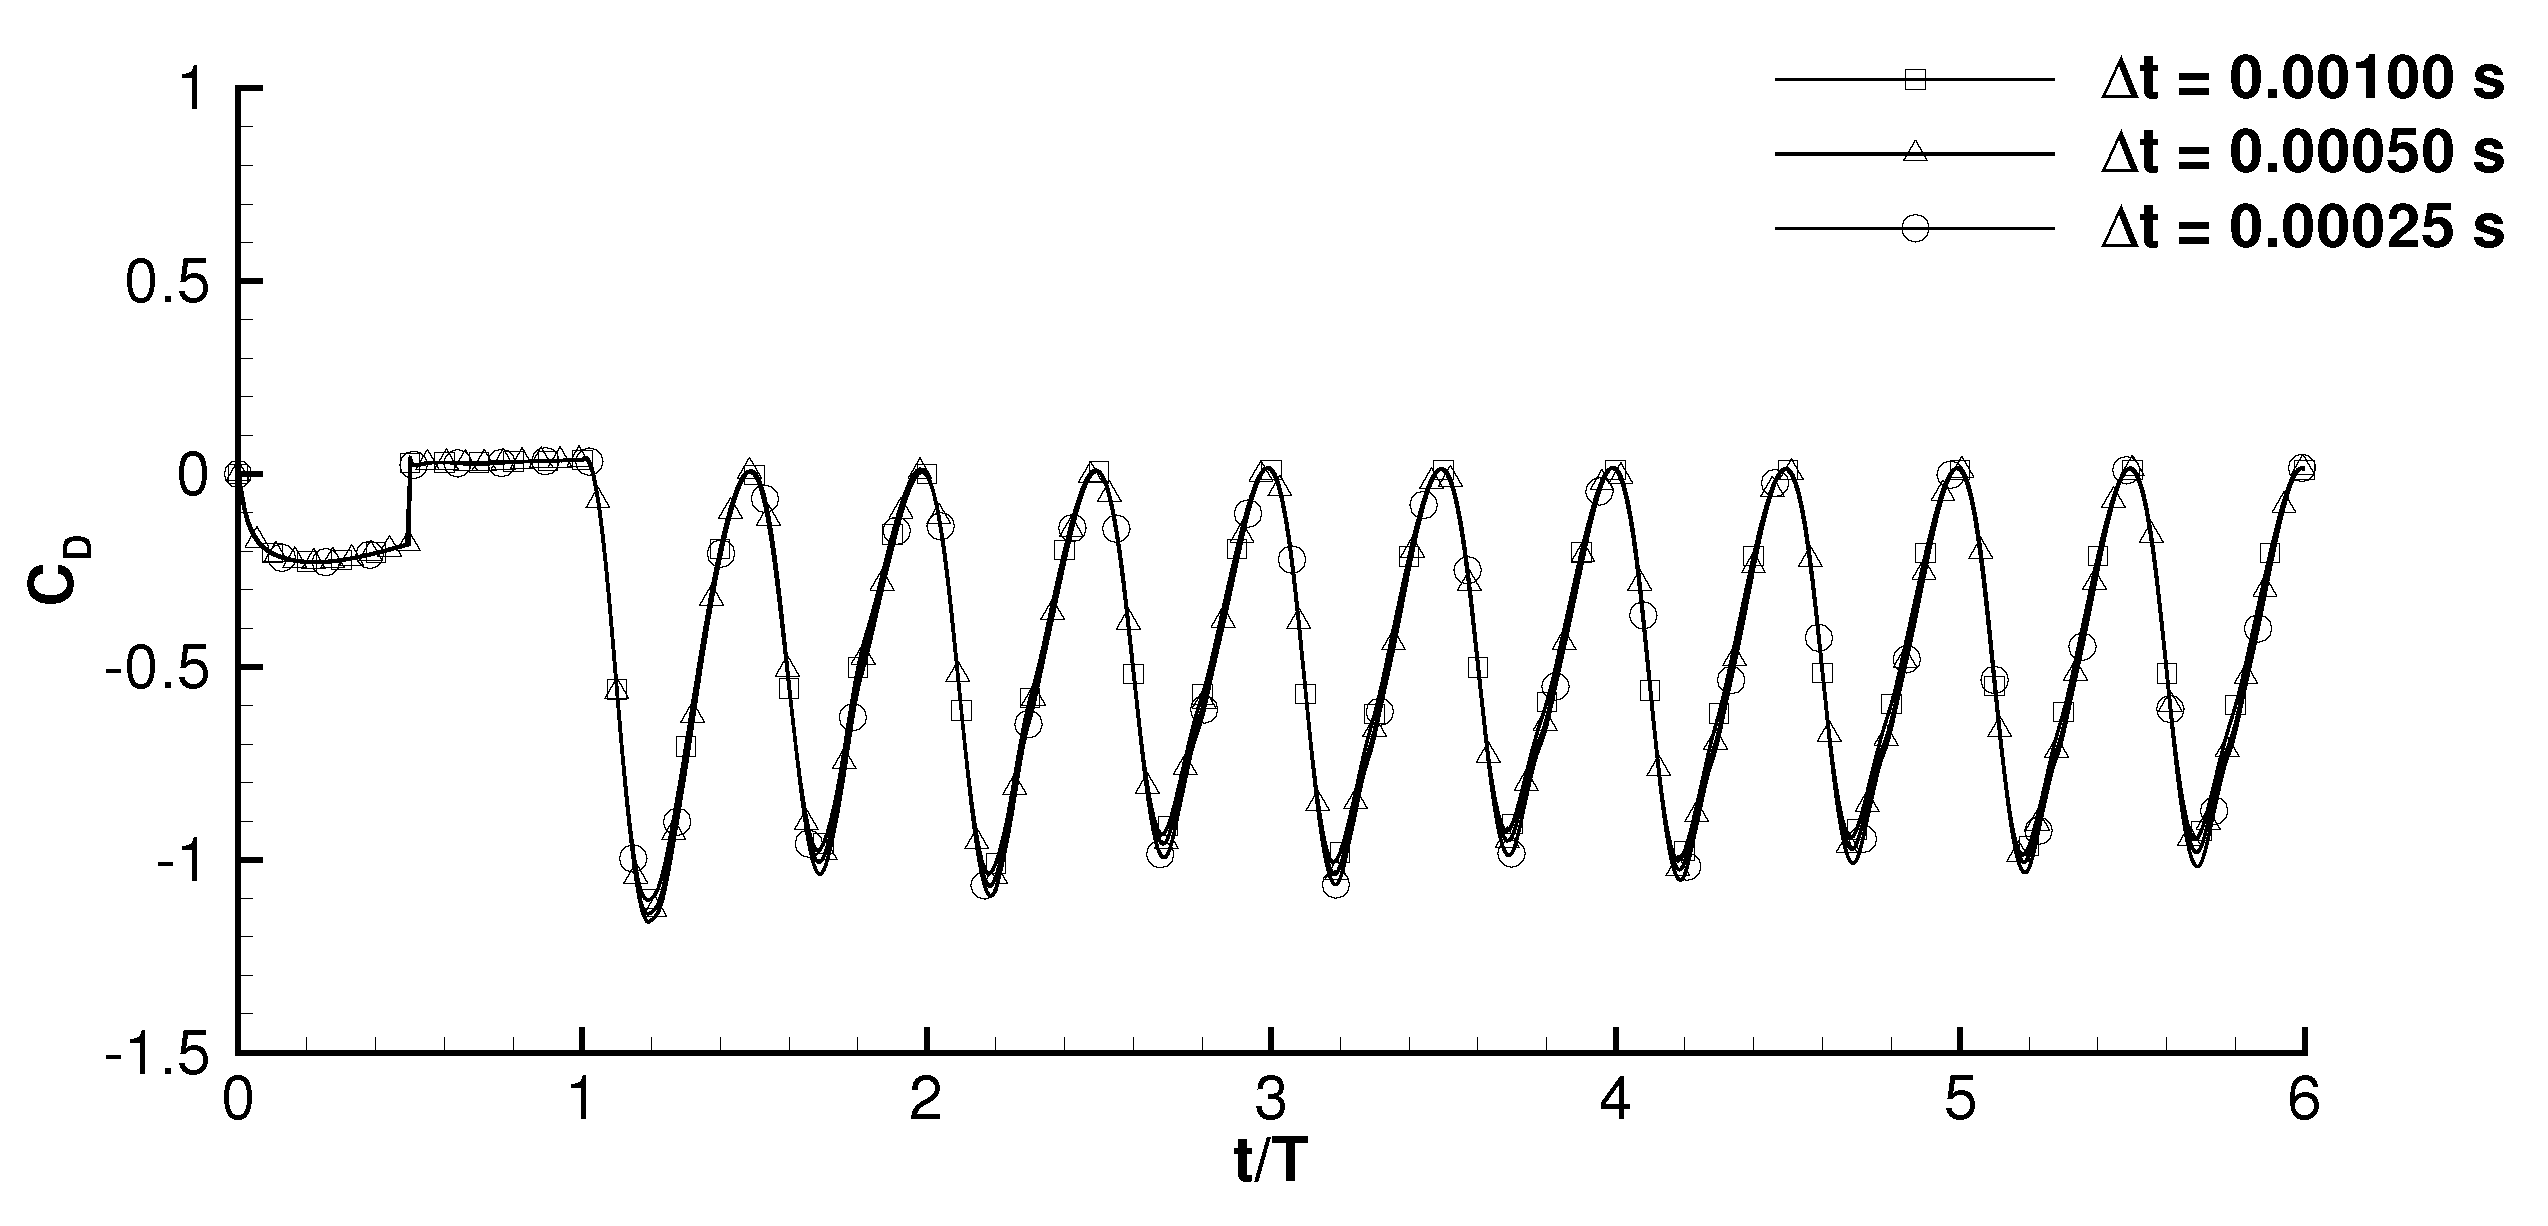
The last phase focuses on the independence of the time step and for this study, three time steps were considered, calculated as
,
, and
where
T is the motion period.
Figure 5 shows that a valid result is obtained for 200 points per oscillation period.
3. Results
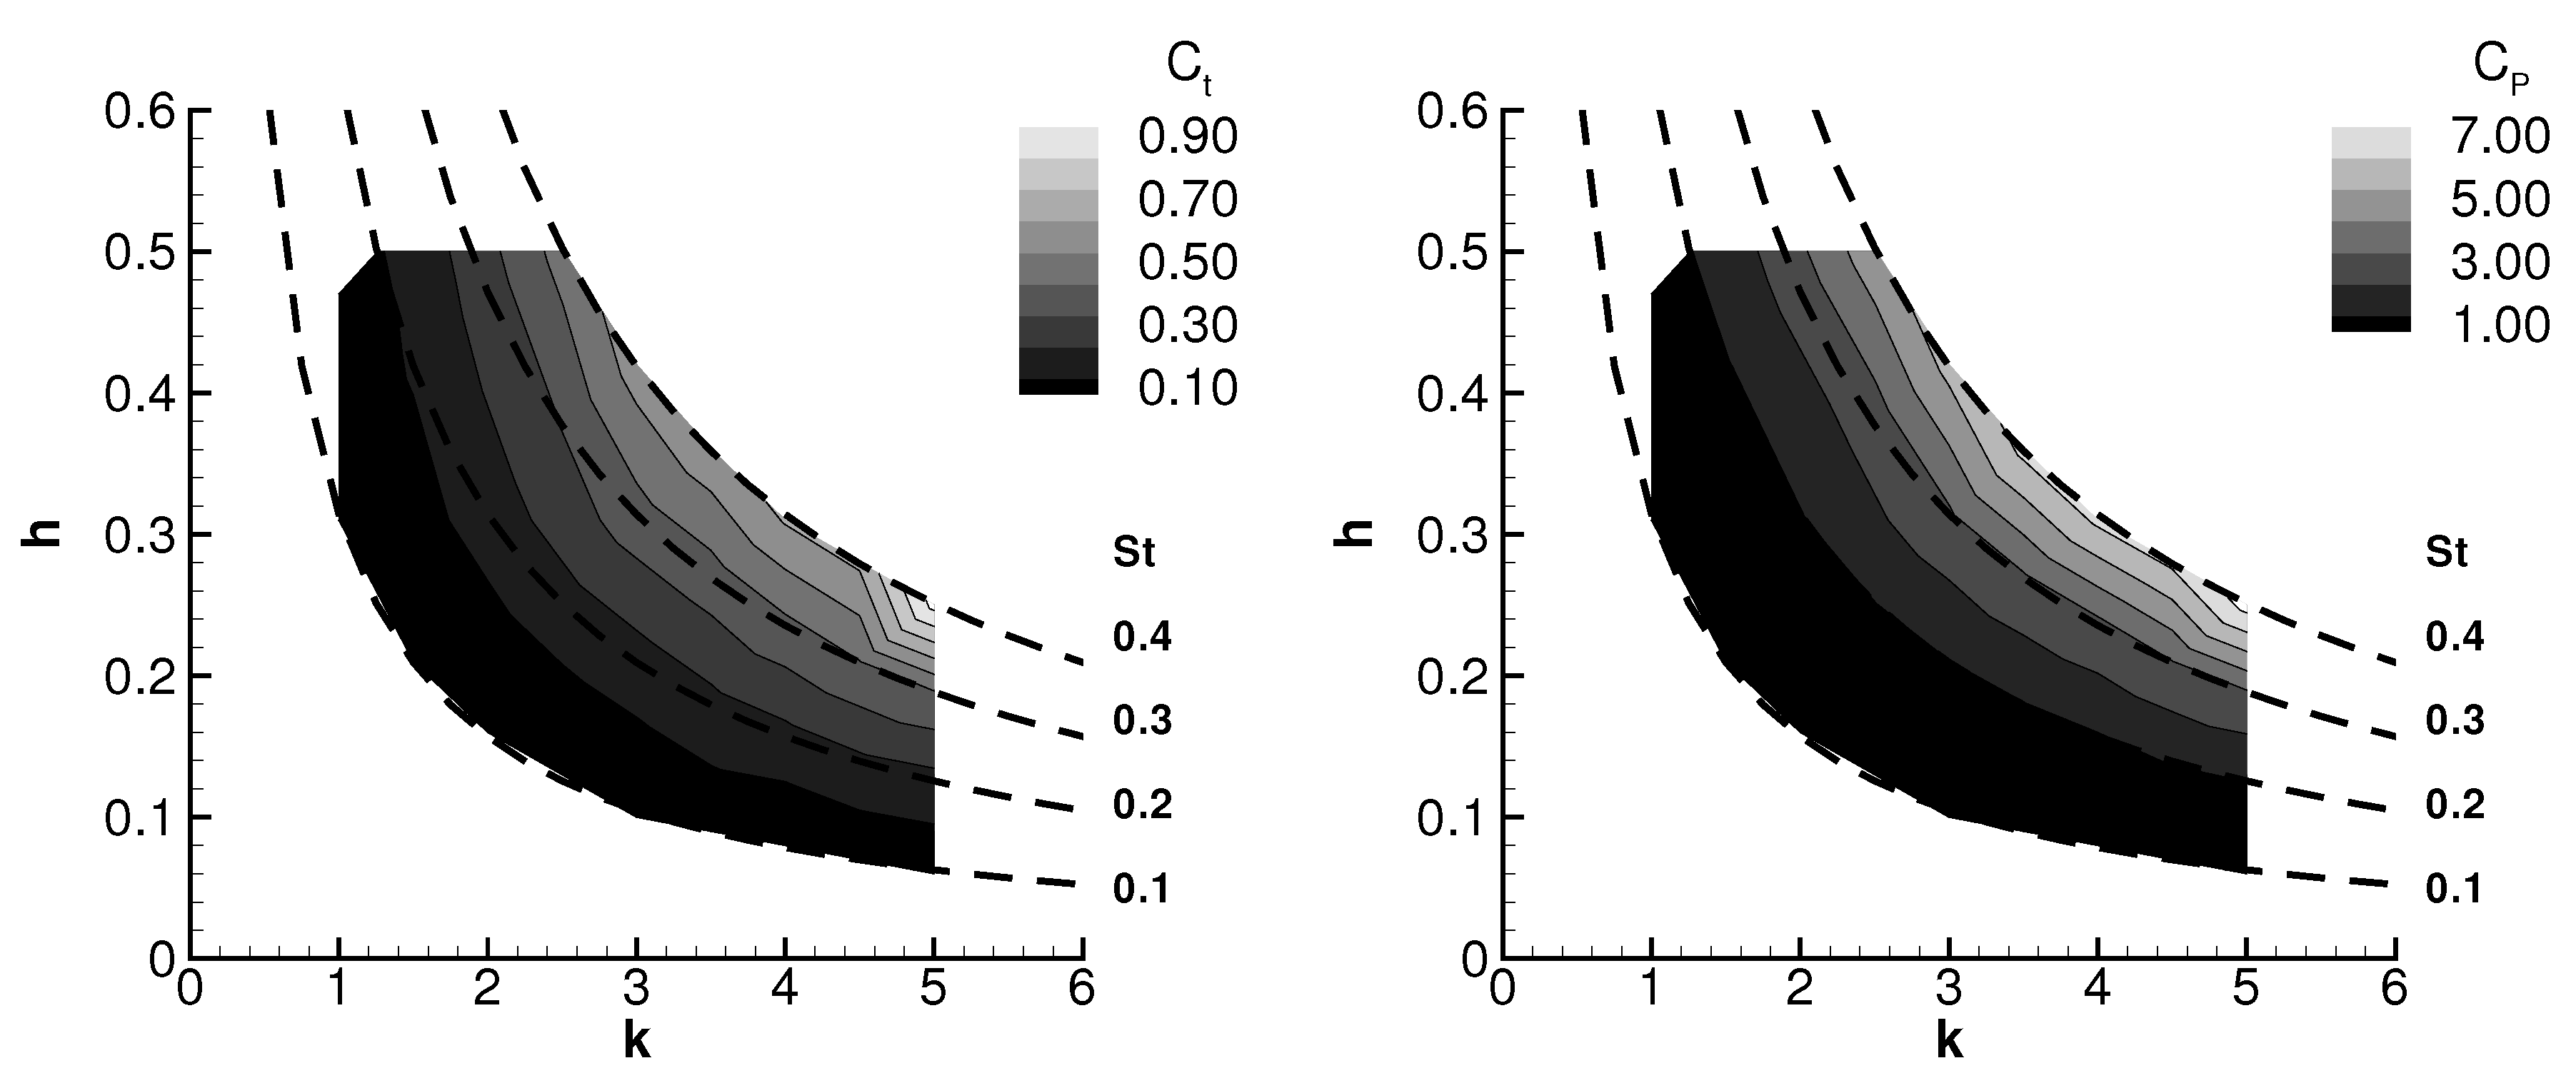
This section shows the results concerning the influence of Reynolds number, motion’s amplitude, frequency, and the Strouhal number on the flapping mechanism. Graphics of thrust and power coefficients, as well as propulsive efficiency, will be shown as functions of these relevant parameters. The pure plunging NACA0012 airfoil was firstly tested with a 8500 with , , and h never surpassing .
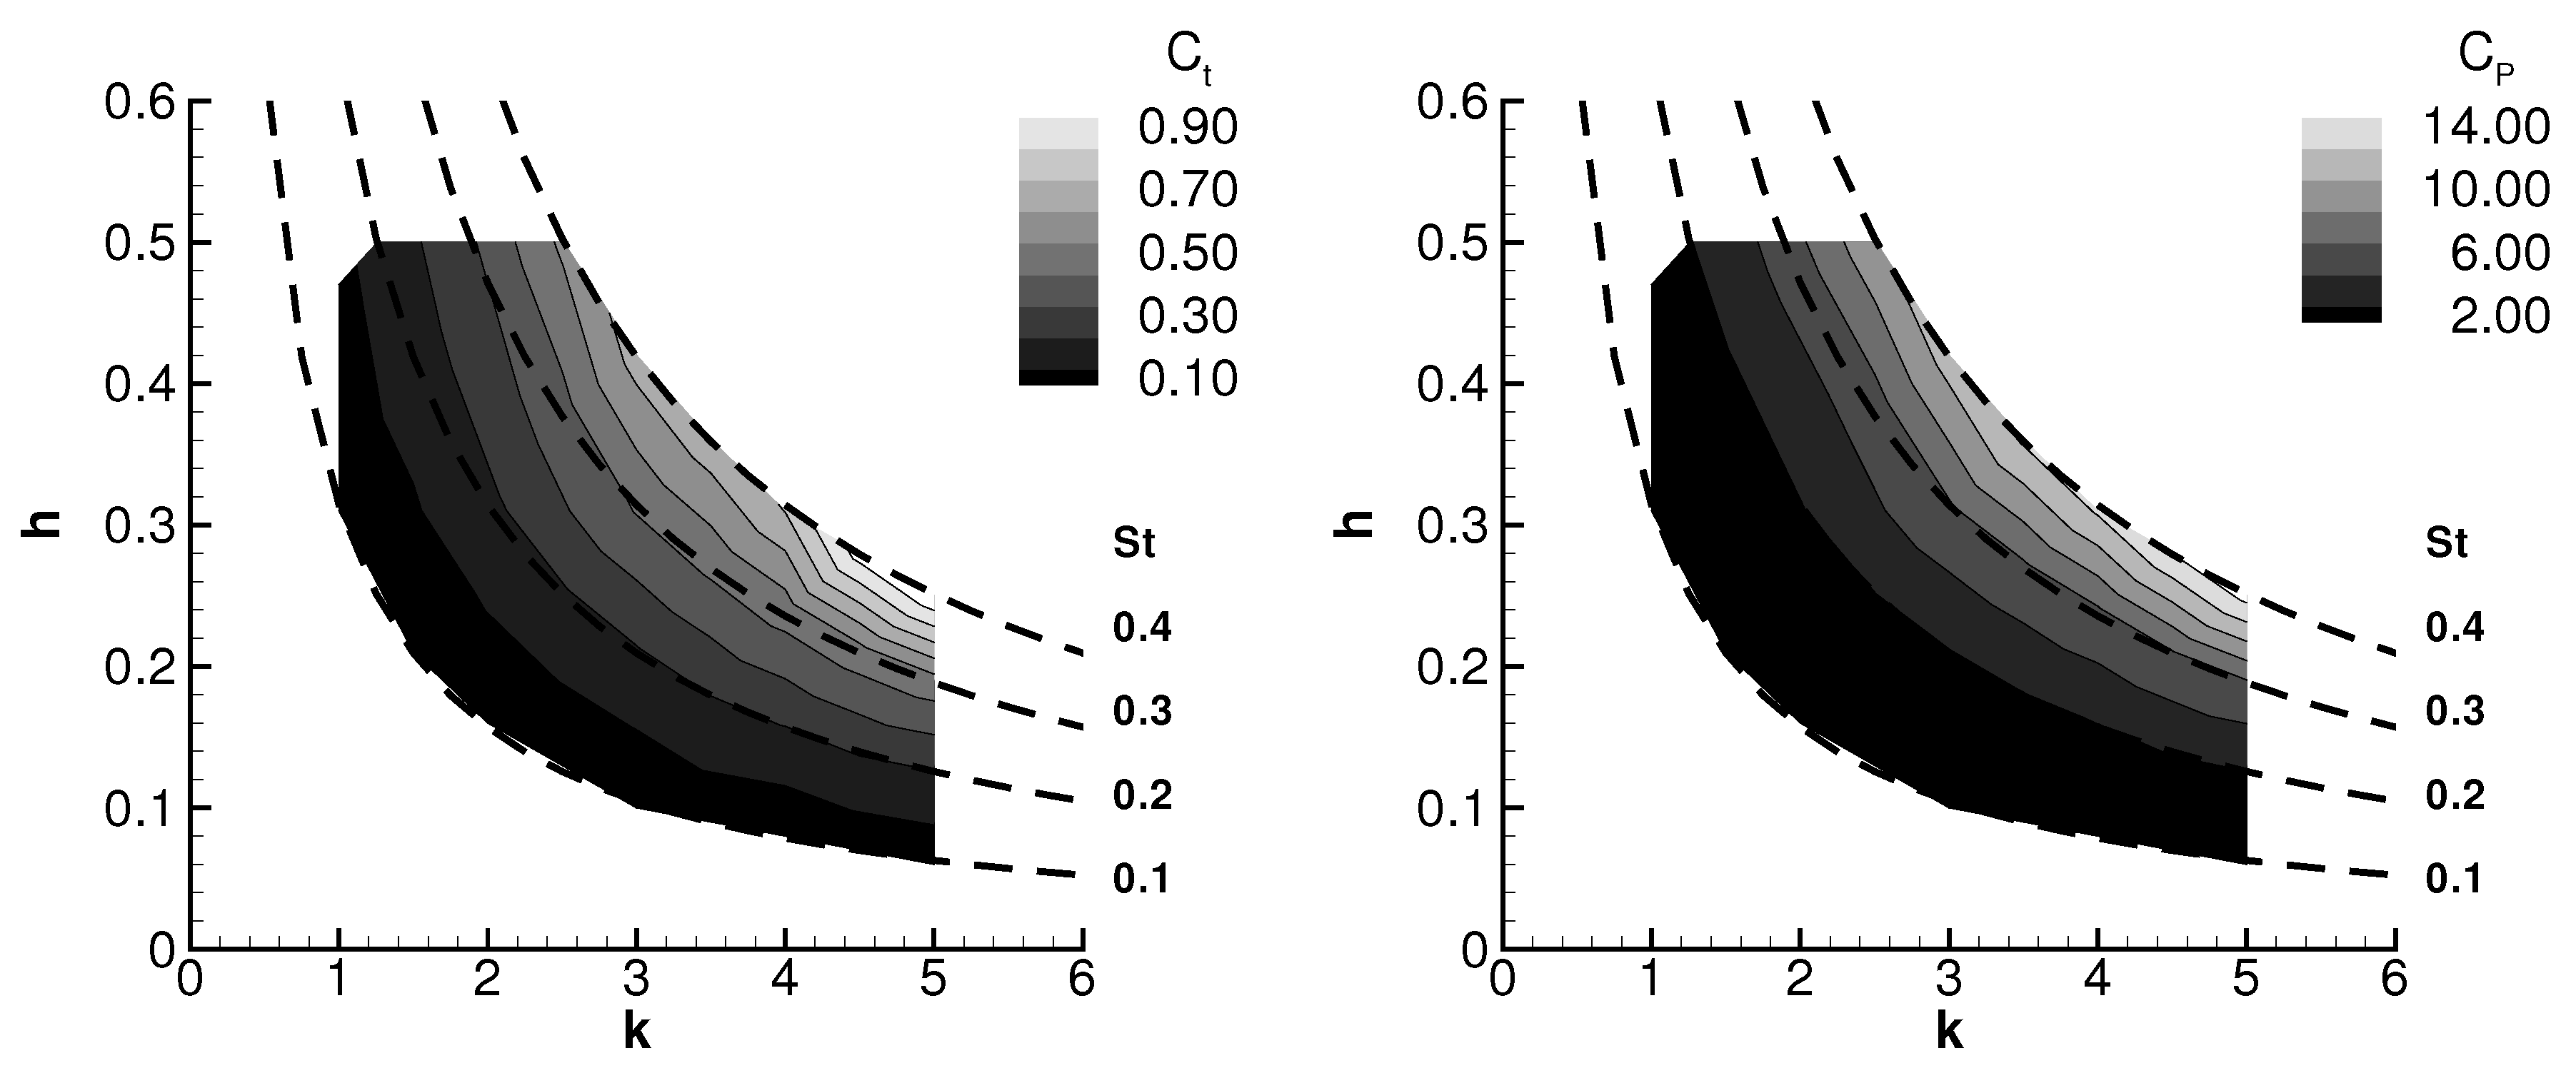
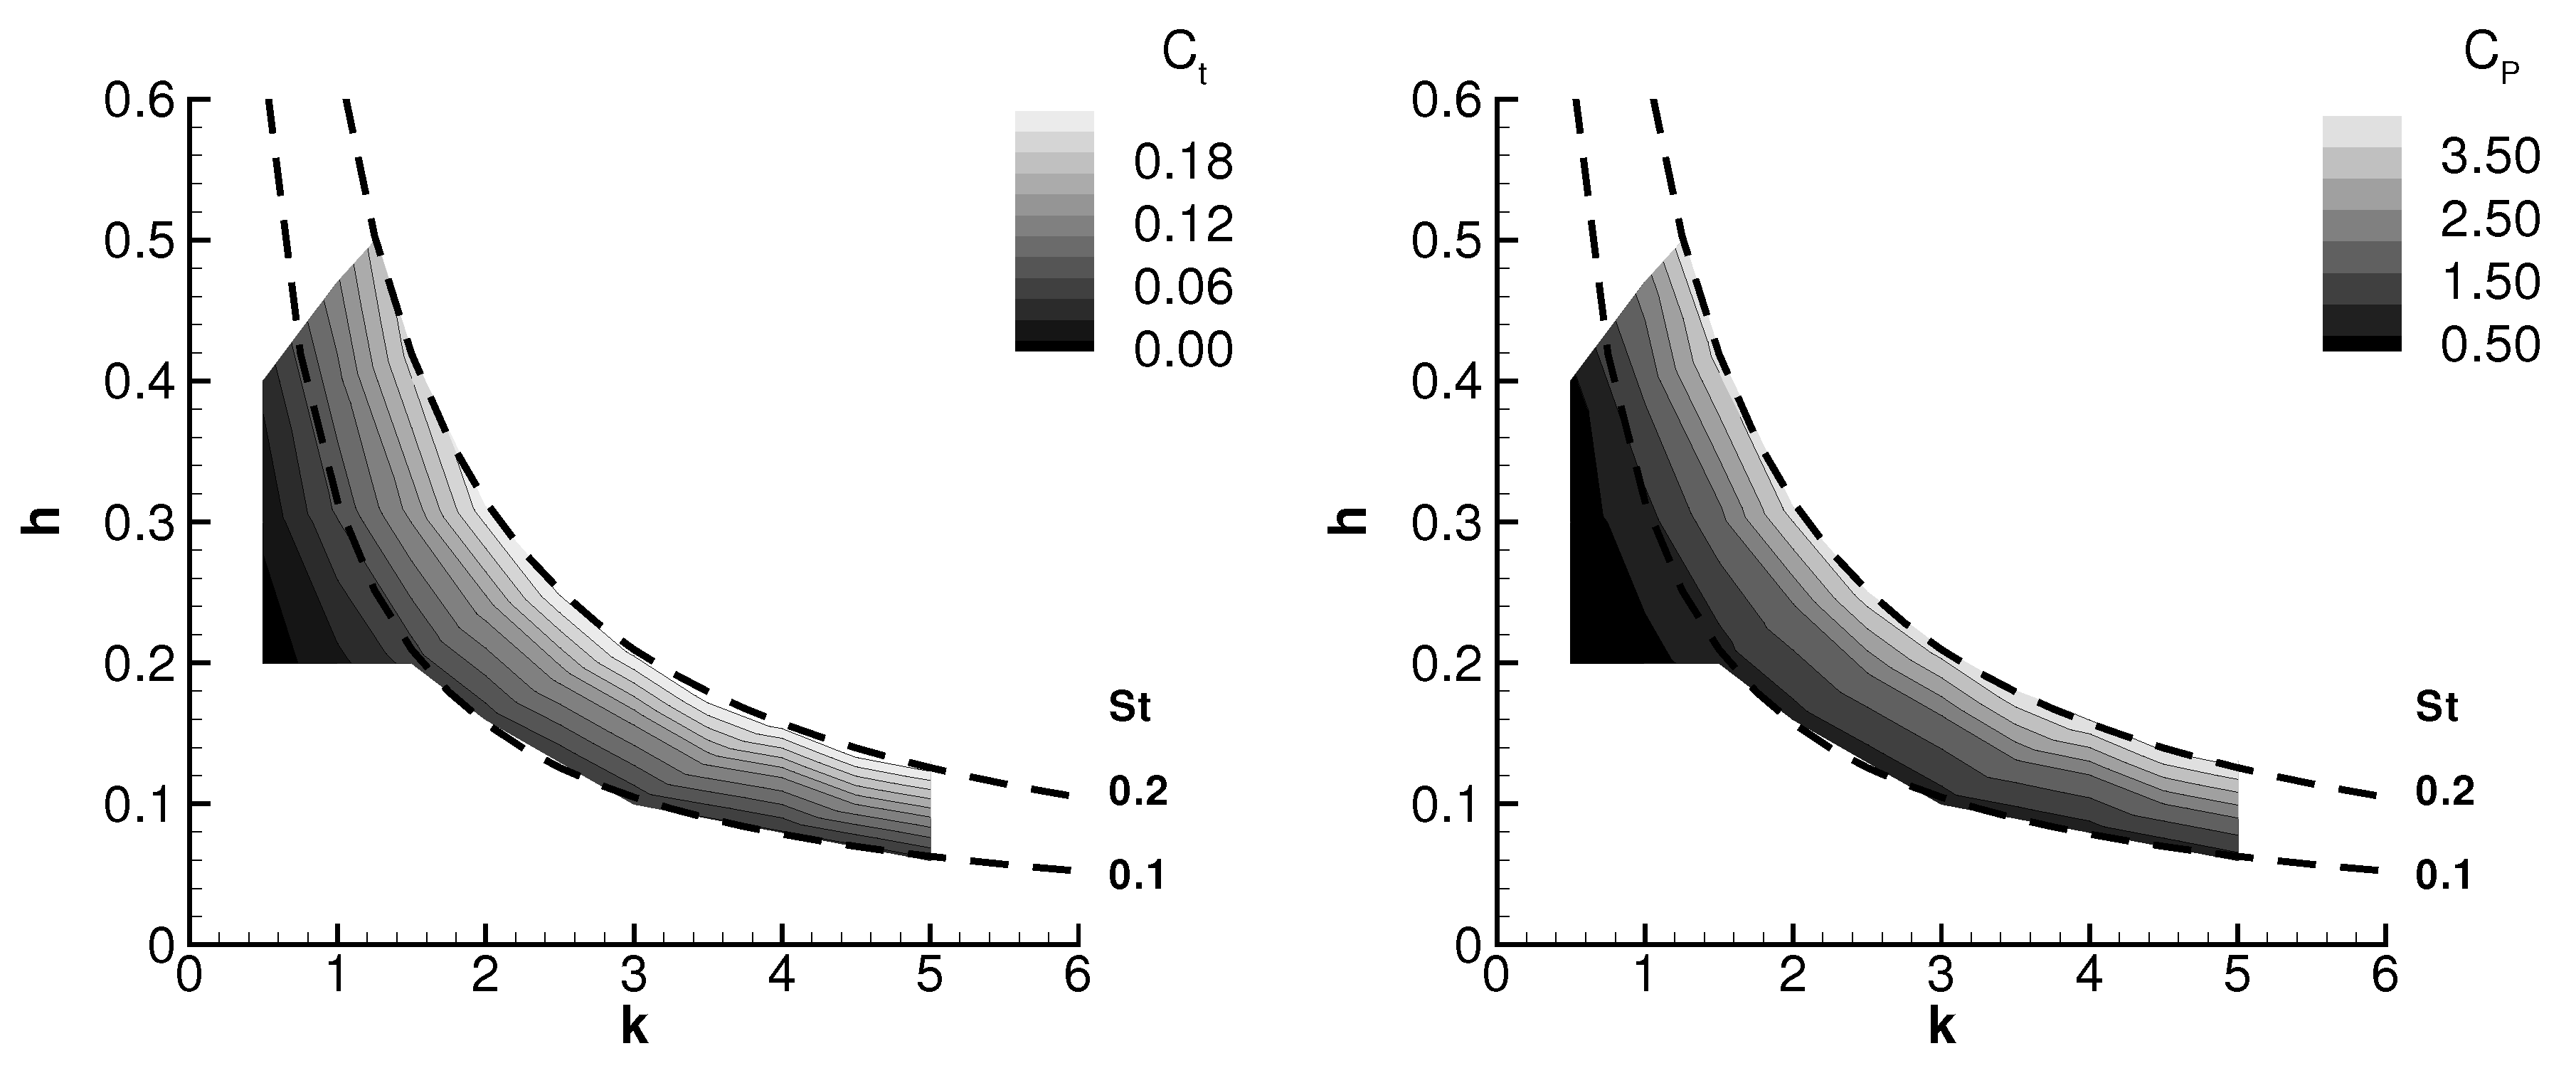
In
Figure 6, the thrust coefficient is shown in the
plane. In the contour plot, it is noteworthy that the
value is growing faster than the Strouhal number with respect to
k, a phenomenon that becomes evident for a nondimensional amplitude higher than
. The same behavior is not exhibited by the power coefficient, which has its isolines almost parallel to the ones that represent a constant Strouhal number.
It is important to note that there is an intimate relationship between the Strouhal number and the maximum effective angle of attack to which the airfoil is subject, so it is expected that the required power () and the maximum angle of attack also have one.
Regarding the influence of the Strouhal number on the thrust and power coefficients, the following correlations are obtained:
with
. The coefficient of correlation for the
approximation is under 0.90 which once again reinforces the fact that the isolines of the thrust coefficient are not entirely parallel.
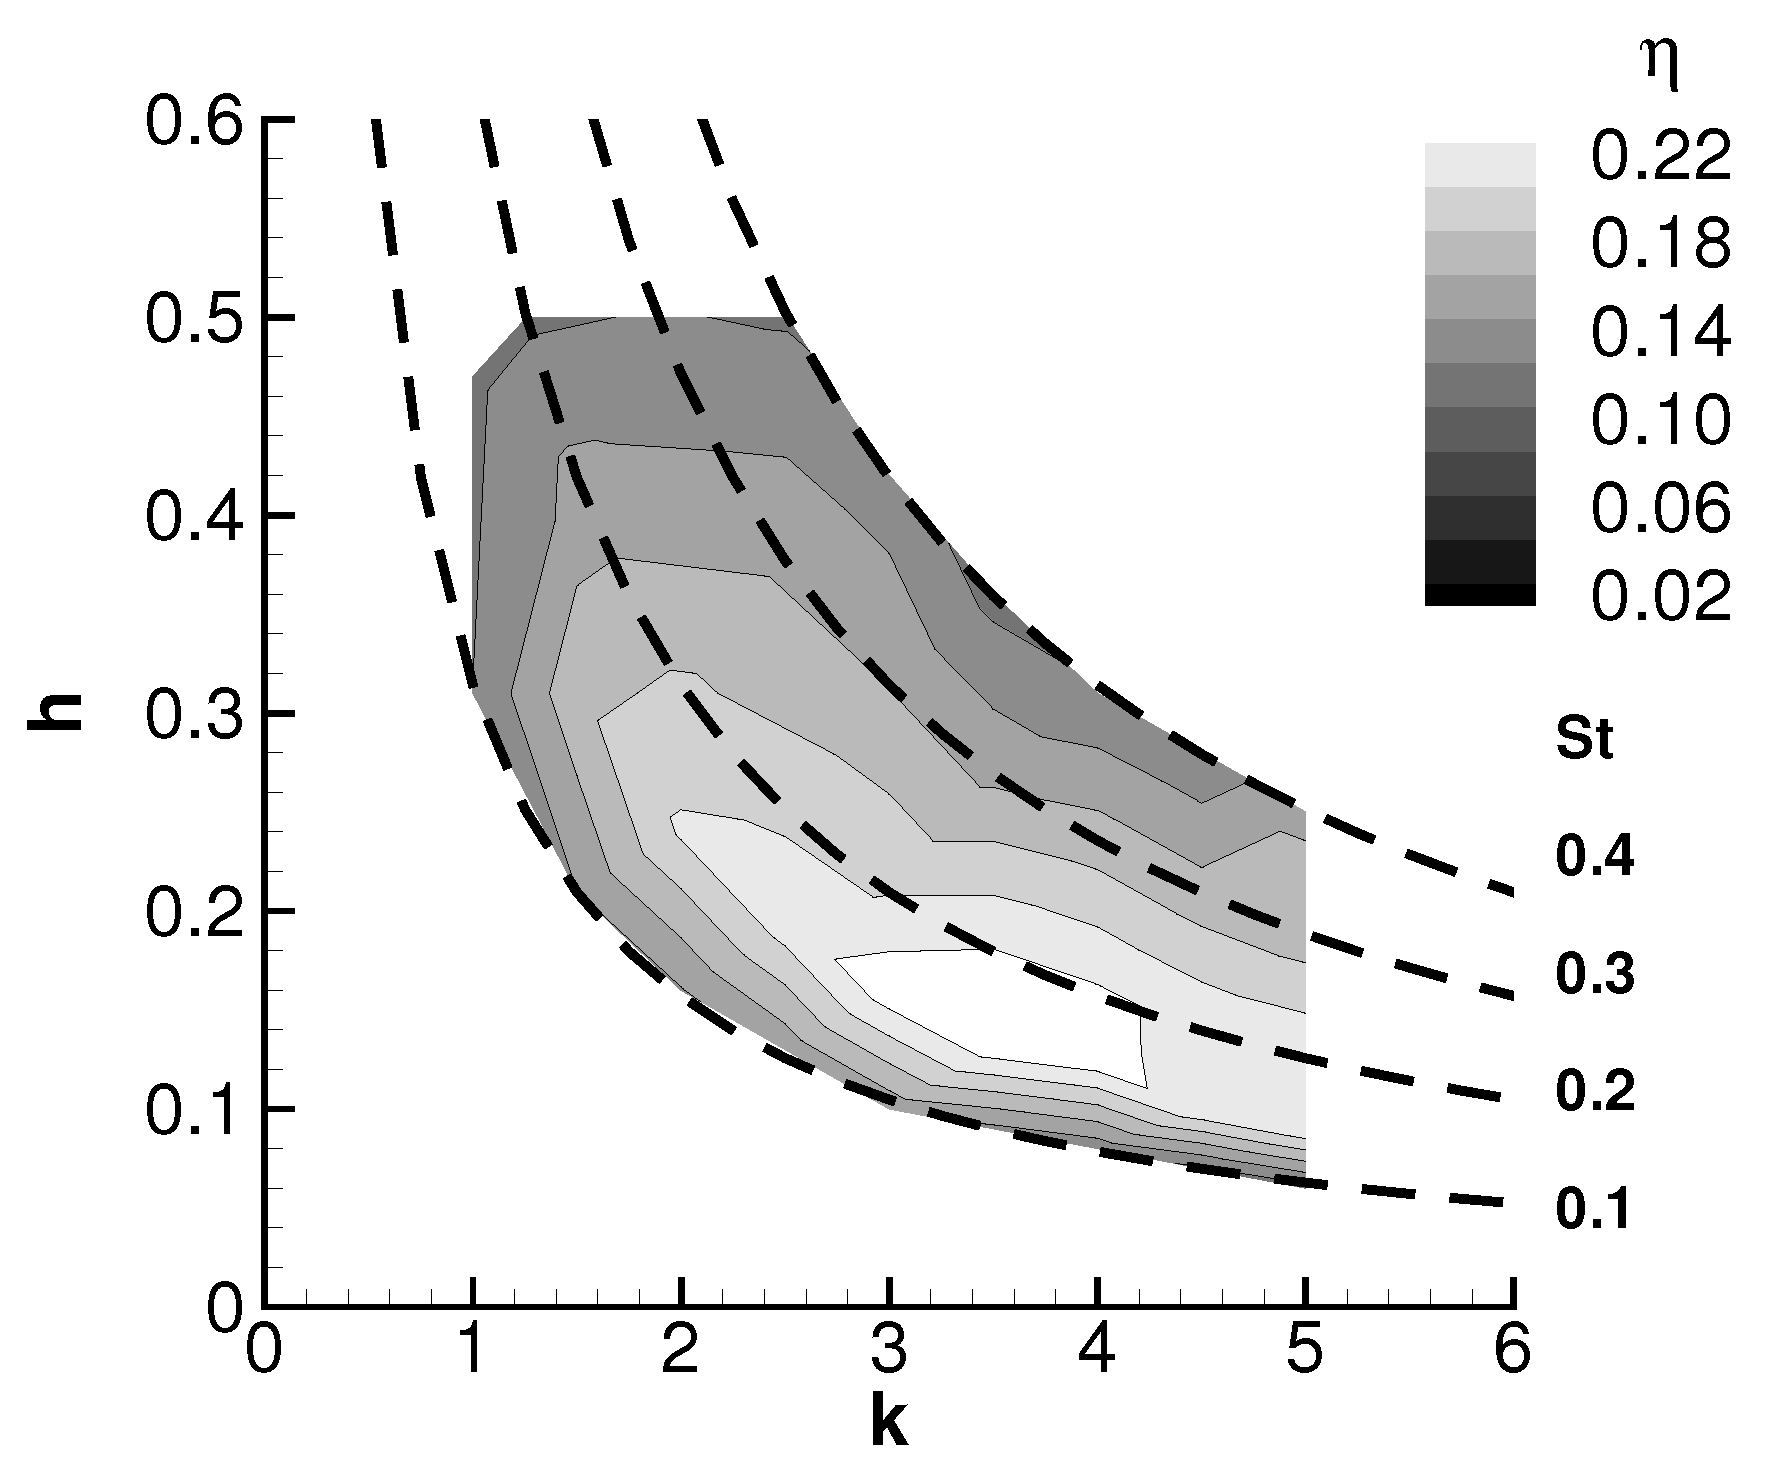
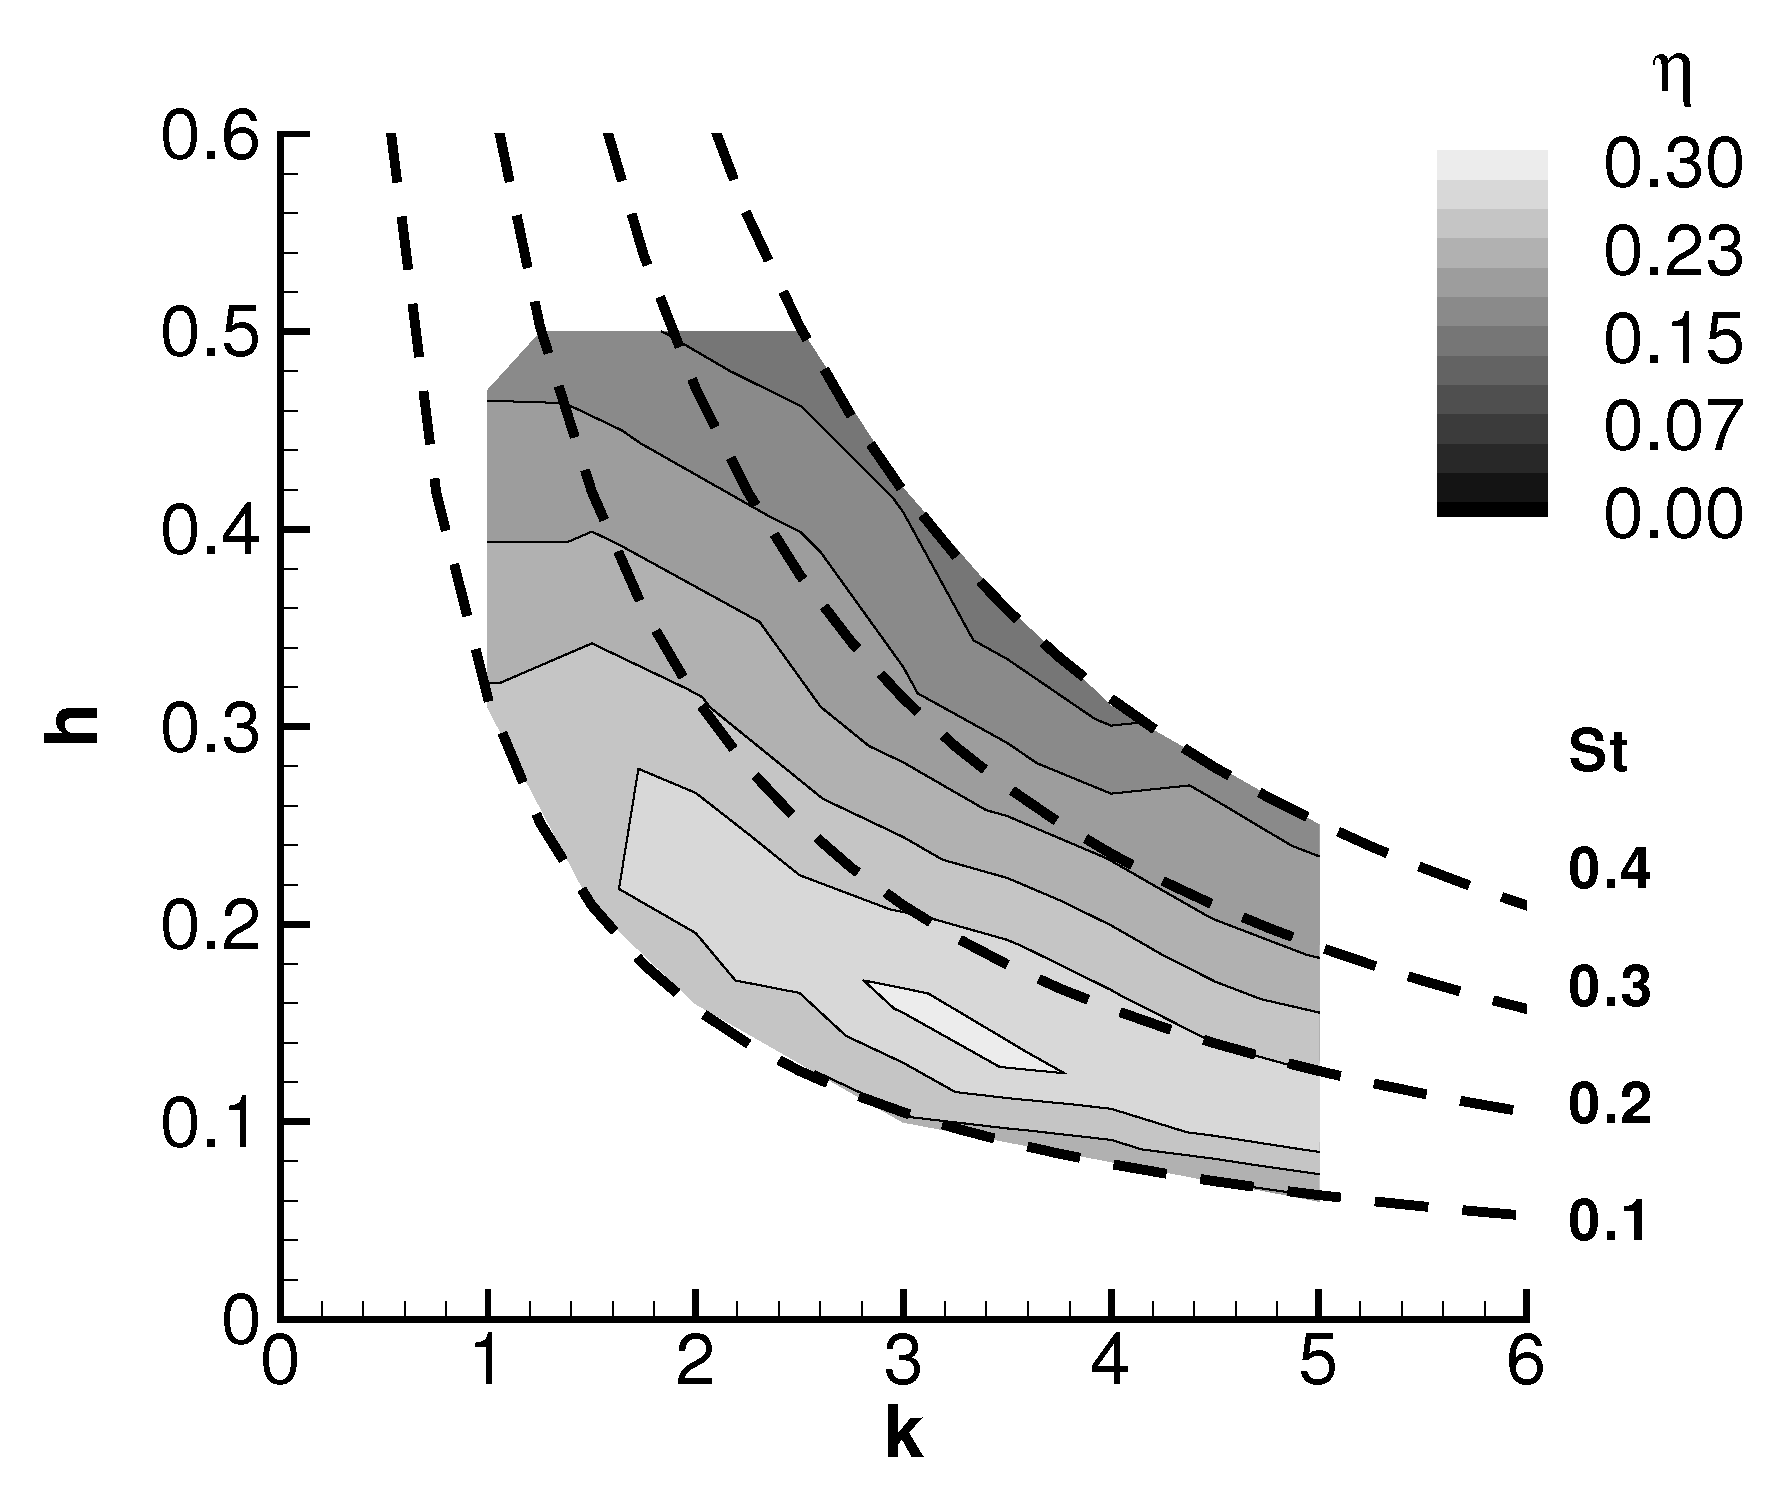
The consolidation of
and
results in the propulsive efficiency shown in
Figure 7, which has a peculiar distribution in the
plane since it does not depend only on the reduced frequency or nondimensional amplitude alone but rather on the combination of both. Thus, the maximum efficiency region is encountered in the vicinity of a Strouhal number of
that unfortunately is incompatible with the maximum thrust coefficient area, reaching a maximum value of
.
This, and the following propulsive efficiency graphics, are important to understanding how the energy given to the system is converted into the production of thrust (propulsive power) by an airfoil performing the plunging movement. Although it is already known that this sinusoidal movement may not represent the most efficient motion, it is nevertheless interesting to understand the regions where there is an optimal conversion of the input given to the system.
The airfoil was also tested with a Reynolds number of 17,000, keeping the previously mentioned parameters in the same range. The results show a similar distribution of the thrust coefficient, power coefficient (
Figure 8), and propulsive efficiency, shown in
Figure 9.
In respect to the influence of the Strouhal number on the thrust and power coefficients for a Reynolds number of 17,000, the following correlations were obtained:
with
.
The propulsive efficiency increase is the major difference, which may indicate that the plunging movement tends to be more efficient at higher Reynolds numbers.
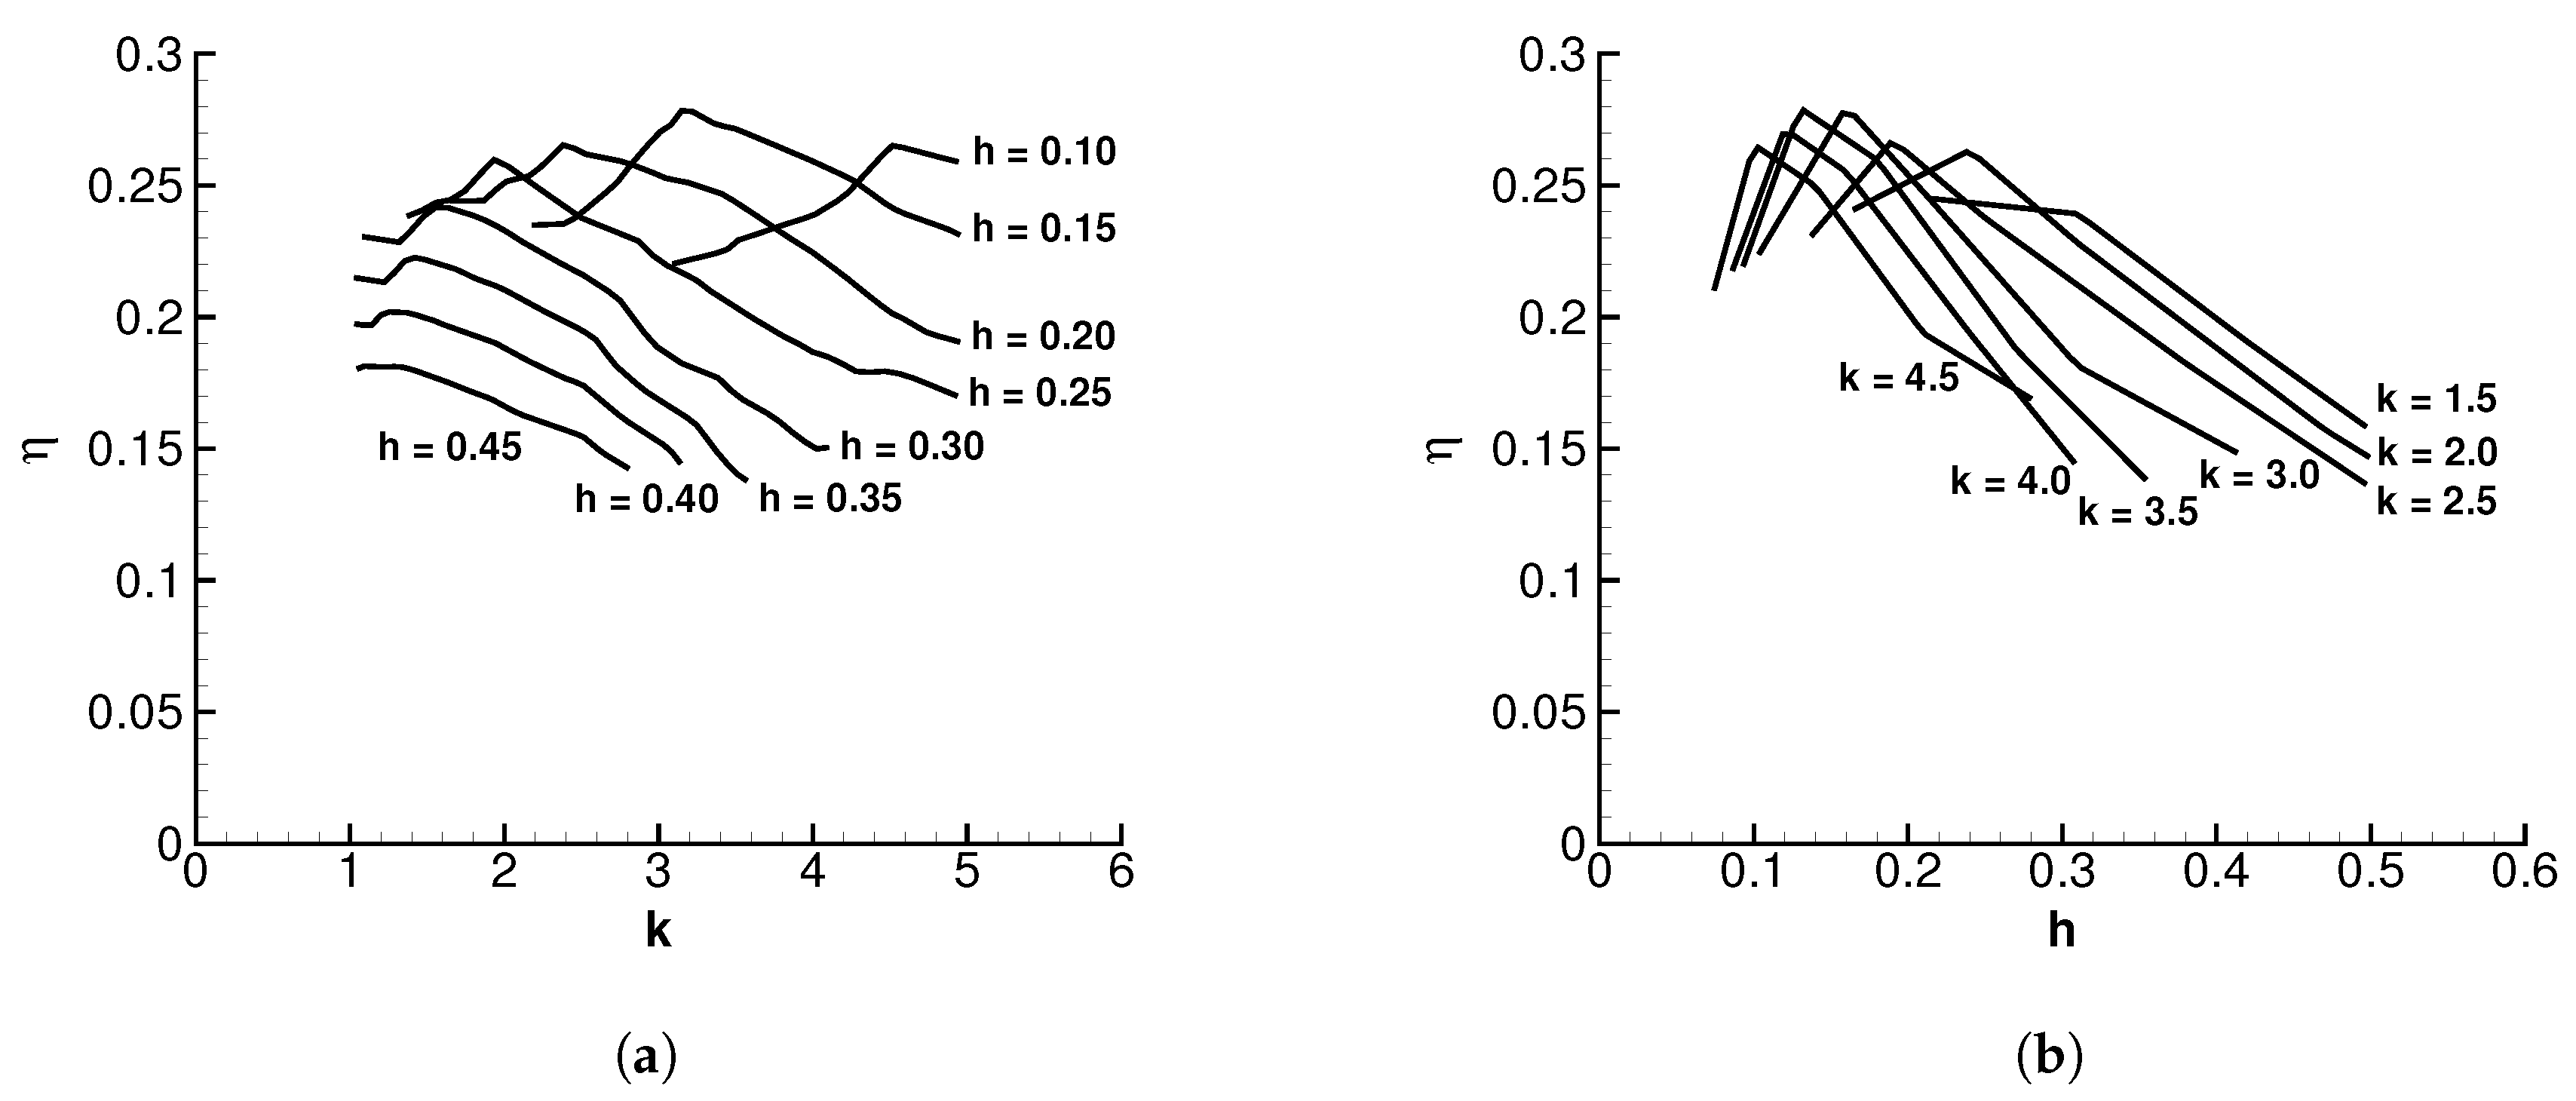
In order to better interpret the evolution of propulsive efficiency for this specific case, propulsion efficiency curves are presented in
Figure 10, considering the dimensionless amplitude (
Figure 10a) and reduced frequency (
Figure 10b) constant. When looking at the graphics, it is possible to verify that the maximum propulsive efficiency reached occurs at higher reduced frequencies when the dimensionless amplitude decreases. Regarding the graphic on the right, similar behavior is verified, since the highest propulsive efficiencies are detected at the highest reduced frequencies and lowest dimensionless amplitudes. However, a deeper comparison between both graphs concludes that the conversion of the required energy associated with the movement into propulsive energy is highly sensitive to the change in the nondimensional amplitude when a constant reduced frequency is considered, as observed by the higher slopes verified in the graphic on the right.
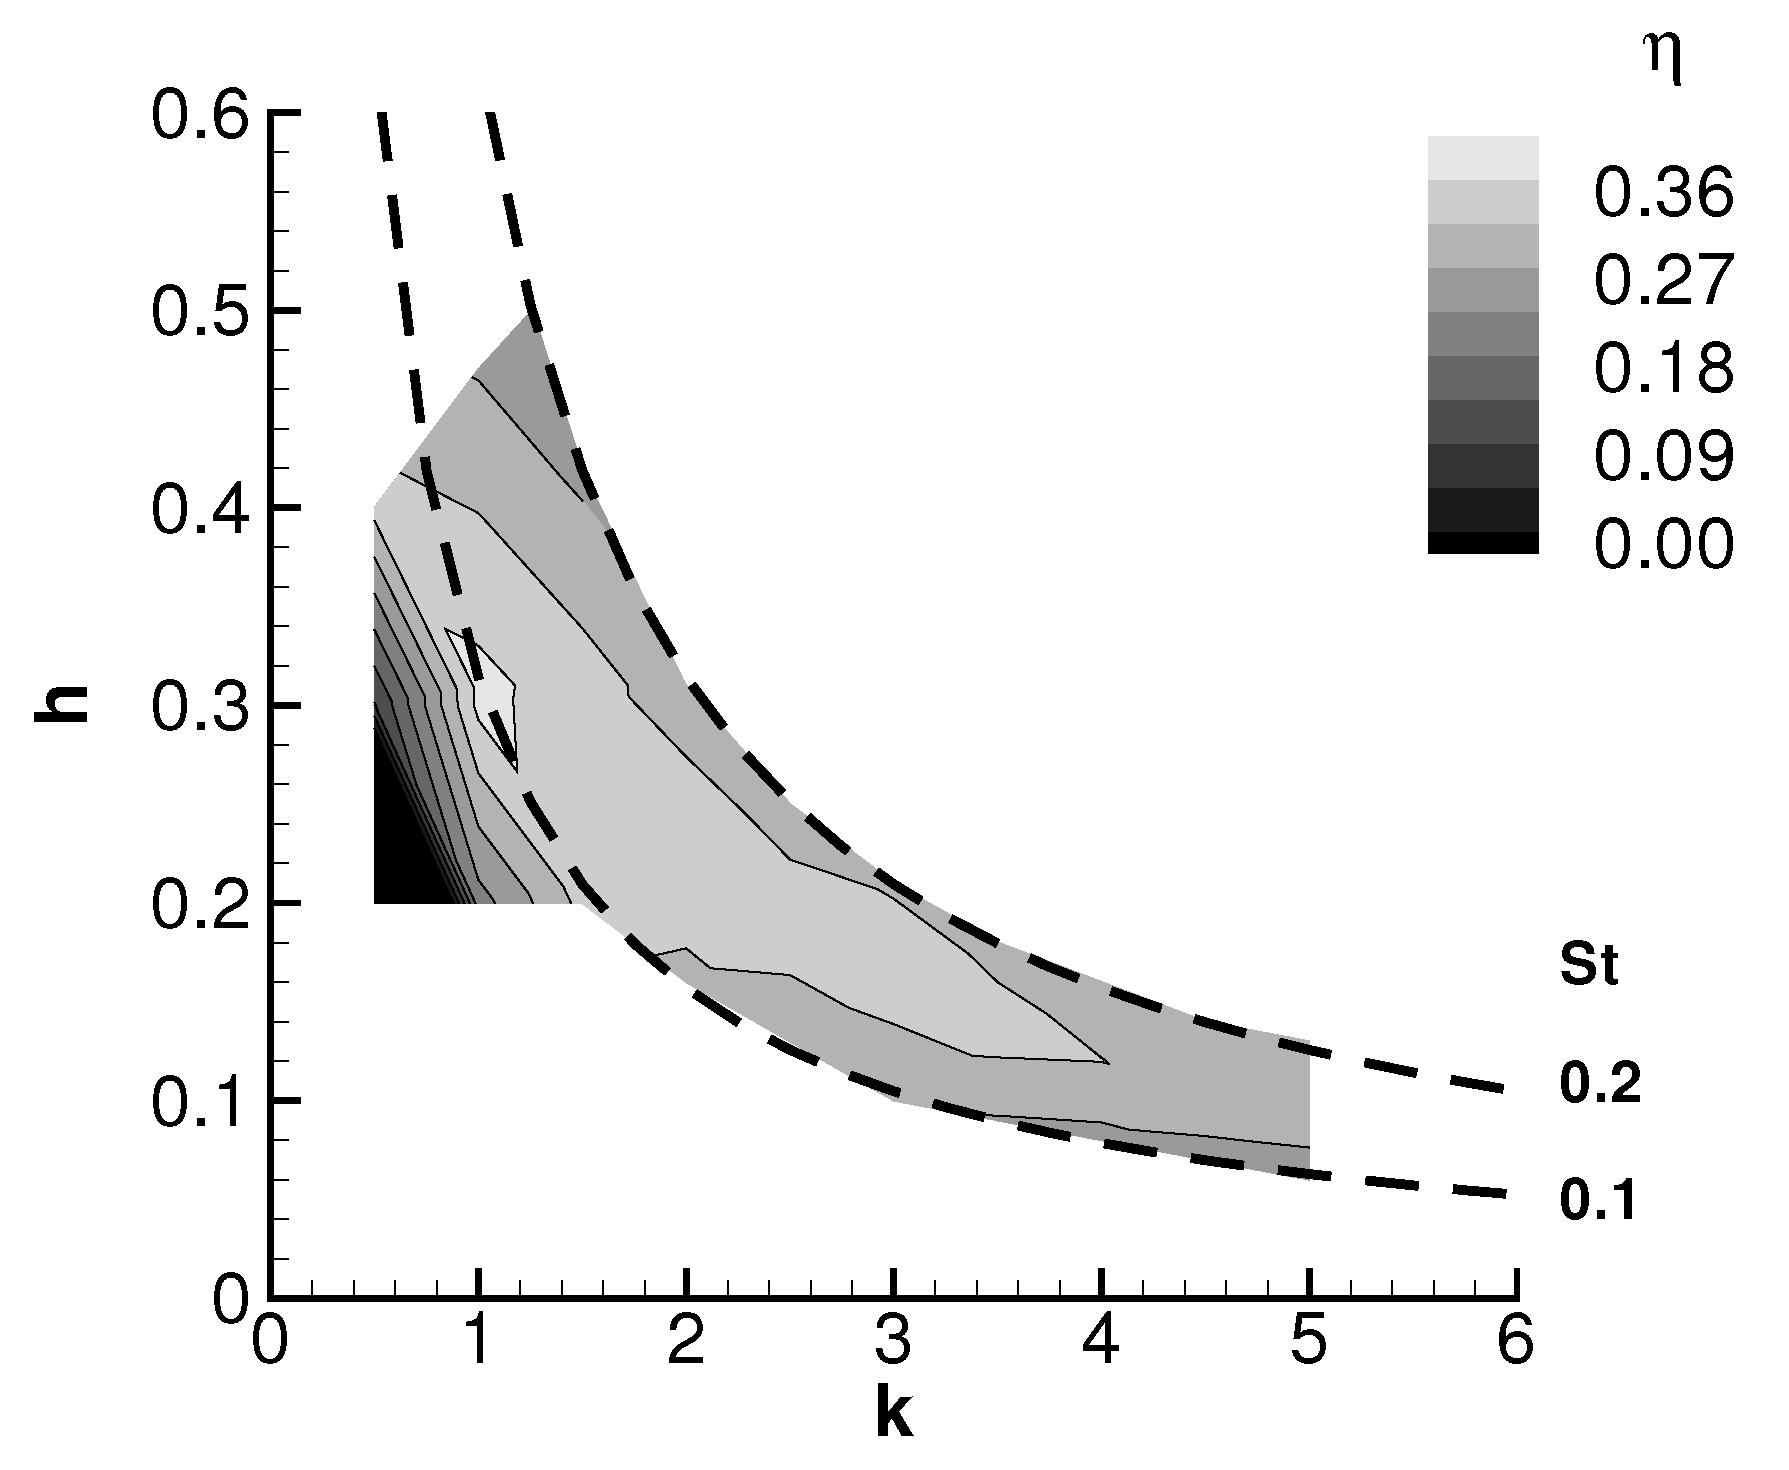
The Reynolds number was further increased to a maximum tested value of 34,000 (
Figure 11). In this operating regime, the upper limit of the Strouhal range was limited to 0.2 since no clear advantage was seen in terms of achieving better aerodynamic performance. At this operating condition, an interesting fact is that the thrust coefficient isolines become equidistant to the constant
curves. In this situation, it becomes evident that the isolines of
,
, and
are all doubtlessly parallel. Due to this turn of events, the maximum propulsive efficiency region was translated to the left, as seen in
Figure 12 and, because of that, an additional zone (
) was considered to understand the aerodynamic performance in low reduced frequencies.
The influence of the Strouhal number on the thrust and power coefficients for the actual number of Reynolds is also studied, obtaining the correlations:
with
. The coefficient of determination regarding the
approximation improved
in comparison with the previously tested numbers of Reynolds, which corroborates the fact that the isolines of
became parallel with the Strouhal number.
Overall, from a Reynolds number of 8500 to 34,000, the propulsive efficiency increased in comparison to the previous cases, which again suggests that the pure plunging motion is favored while operating at relatively high Reynolds numbers. Although animals use plunging and pitching combined, the results presented in this section are very much in concordance with what is seen in nature, considering that smaller animals tend to operate at high reduced frequencies and low nondimensional amplitudes. In comparison, bigger animals do the exact opposite.
4. Conclusions
Nature has been the main source of concepts that inspire the systems developed by engineers who, since the beginning of time, understood that it is powered by evolution mechanisms that tend to offer optimized solutions regarding the environmental conditions. These mechanisms directly affect animals, from the smallest insect to the big blue whale, that over millions of years, made them very well adapted to their habitat and to the way they move.
In this work, the flapping airfoil problem was investigated, utilizing a NACA0012, by studying the influence of several parameters such as motion frequency and amplitude, the Reynolds number, and the Strouhal number. Thrust, lift, and power coefficients, as well as the propulsive efficiency, were the selected parameters to analyze the aerodynamic performance.
The results indicate that the power coefficient isolines demonstrated to be almost parallel to the hyperbolas representing constant Strouhal numbers, a phenomenon not verified for the thrust coefficient, except for the 34,000 case. It was also seen that higher frequencies and amplitudes propitiate higher thrust forces as well as required power while, in terms of propulsive efficiency, for the 8500 and 17,000 cases, higher reduced frequencies and lower amplitudes are preferred and for the 34,000 case, higher amplitudes and lower reduced frequencies are favored. The results highlight that although a constant gives an infinity of combinations , it is seen as an interesting parameter that offers some correlations about the aerodynamic performance, especially at higher Reynolds numbers.
The physical phenomena underlying the flapping airfoil and flapping wing mechanisms were extensively studied in recent years, which resulted in a greater insight regarding the thrust generation. Nevertheless, much more investigation is needed to efficiently develop and produce vehicles with these propulsive systems for any stage of flight. Ways to improve knowledge should be focused on testing different geometries in order to understand how geometrical parameters such as the aerodynamic chord, camber, and thickness can influence the aerodynamic performance. Another way to boost the bio-inspired design is on the materials side, seeking innovative and different properties (flexibility, porosity) that may improve the flapping mechanism and bring us closer to developing animal-like propulsive/lifting systems and structures.


