Article

Reduction of Cold-Start Emissions for a Micro Combined Heat and Power Plant

by
Tammo Zobel
1,*,
Christian Schürch
2,
Konstantinos Boulouchos
2 and
Christopher Onder
1
1
Institute for Dynamic Systems & Control, ETH Zurich, Sonneggstrasse 3, 8092 Zurich, Switzerland
2
Aerothermochemistry and Combustion Systems Laboratory, ETH Zurich, Sonneggstrasse 3, 8092 Zurich, Switzerland
*
Author to whom correspondence should be addressed.
Energies 2020, 13(8), 1862; https://doi.org/10.3390/en13081862
Submission received: 26 February 2020 / Revised: 29 March 2020 / Accepted: 7 April 2020 / Published: 11 April 2020

Abstract

:
Decentralized power generation by combined heat and power plants becomes increasingly popular as a measure to advance the energy transition. In this context, a substantial advantage of small combined heat and power plants is based on the relatively low pollutant emissions. However, a large proportion of the pollutant emissions is produced during a cold-start. This fact is not reflected in governmental and institutional emission guidelines, as these strongly focus on the emission levels under steady-state conditions. This study analyzes the spark advance, the reference air/fuel ratio and an electrically heated catalyst in terms of their potential to reduce the cold-start emissions of a micro combined heat and power plant which uses a natural gas fueled reciprocating internal combustion engine as prime mover and a three-way catalytic converter as aftertreatment system. Based on these measures, control approaches were developed that account for the specific operating conditions of the class of small combined heat and power plants, e.g., full-load operation and flexible, demand-driven runtimes. The experimental data demonstrates that even solutions with marginal adaptation/integration effort can reduce cold-start emissions to a great extent.

1. Introduction

In recent years, the energy sector has been experiencing an increasing diffusion of renewable energy sources, e.g., solar or wind, that contribute to the electricity grid [1]. These sources are strongly dependent on environmental factors, such as local weather phenomena. Therefore, their contribution is prone to fluctuations which could result in local grid instabilities [2]. In this context, decentralized power generation with combined heat and power (CHP) units becomes increasingly popular. On the one hand, such plants feature a very high energy efficiency by simultaneously generating thermal and electric power as close as possible to the demand site. On the other hand, CHPs can offer power balancing services to stabilize the electricity grid [3,4]. In addition, particularly for CHPs of the mini and micro power class (<50 k W el), there is a tendency towards a more demand-driven operation based on the actual energy consumption [5,6,7,8,9]. However, both the power balancing services and the demand-driven operation lead to more frequent start-ups of the plant and thus to an increasing number of cold-start processes. Research in the automotive sector has widely shown that cold-start procedures cause a high share of the total pollutant emissions of a system with an internal combustion engine (ICE) [10,11,12,13,14]. As mini and micro CHPs (mCHP) generally feature low pollutant emissions under steady-state conditions, an increasing number of cold-starts would mitigate this property to a great extent.
In this paper, we investigate strategies to reduce the share of pollutant emissions emitted by an mCHP during the cold-start phase. The mCHP is conceptually based on a full-load operation of a one-cylinder internal combustion engine which is fueled by natural gas and utilizes a conventional three-way catalytic converter (TWC) as an aftertreatment system. In this context, we focus on the pollutants nitric oxide (NO) and nitrogen dioxide (NO2), in the following jointly considered as NOx, as well as carbon monoxide (CO). These are already regulated by several emission regulations for stationary energy generation units. Additionally, we consider the total hydrocarbon emissions (THC), because they expected to be regulated in future amendments. As a reference, we employ emission directives that are widely accepted in Europe, the Technical Instructions on Air Quality Control (Germany, herein referred to as TA-Luft) [15] and the Swiss Clean Air Act (Luftreinhalte-Verordnung, Switzerland, herein referred to as LRV) [16].
Recent research on reciprocating internal combustion engines has proven that the cold-start emissions of a system with a TWC as an aftertreatment system can be reduced by either of two approaches [17]:
  • Strategies that reduce the raw emissions originating from the combustion of the air-fuel mixture inside the cylinder. Such strategies can be either mechanical measures, e.g., the design of in-cylinder components or valves, or the application of combustion control approaches.
  • Strategies that accelerate the heat-up process of the TWC until it reaches a specific light-off temperature. Only after TWC light-off, THC, CO and NOx are significantly converted. Again, such strategies may utilize either specific hardware components or dedicated combustion control techniques that, in this case, generate high exhaust gas temperatures.
Numerous approaches have been described in the literature that fall within these categories. They range from dedicated control systems (e.g., for the ignition timing [18], the air/fuel ratio (AFR) [19,20] and the charge motion [21,22]) via controlled hardware solutions (e.g., electrically-heated catalysts [23], secondary air injection solutions [24] and exhaust gas recirculation [25]) to uncontrolled auxiliary devices (e.g., latent-heat storage [26]). However, the majority of combined heat and power plants is fueled by natural gas or liquefied petroleum gas rather than by gasoline or diesel. Furthermore, the operating scheme greatly differs from the automotive context, e.g., full-load and constant speed operation.
Therefore, within this study, we adapt existing approaches to the distinct features of combined heat and power plants and experimentally investigate their impact on the cold-start emissions. We focus on solutions that can be realized by the CHP manufacturer. As the engine is typically obtained by a third-party manufacturer, we thus do not consider any engine component design solutions. However, interfaces for applying certain combustion control techniques are usually provided in order to coordinate all subsystems to achieve a desired plant characteristic. We chose to develop strategies based on variations in the ignition timing as well as in the reference air/fuel ratio and we subsequently investigate their potential to reduce the cold-start emissions of an mCHP. Both concepts are software-based and therefore require only a marginal adaptation/integration effort. As a third solution, we investigate the effect of an electrically-heated catalyst (EHC). This device is typically mounted directly in front of the TWC where it heats up the exhaust gas, thereby accelerating the heat-up process of the TWC.
The paper is structured as follows: Section 2 provides details on the mCHP test bench used in this study. Section 3 sheds light on the emission reduction principles for the concepts selected. On this basis, the strategic control approaches are derived. Section 4 provides details on the underlying test procedure. In Section 5, the experimental results are presented, compared, and evaluated on the basis of a set of criteria.

2. Test Bench Setup

The mCHP system under consideration was explicitly developed to simultaneously provide low pollutant emissions, a high efficiency, and a high flexibility. It utilizes a 1-cylinder engine fueled by natural gas with a displacement volume of 325 cm3. The engine is always operated at full load, driving an asynchronous generator to generate electrical energy. The exhaust gas aftertreatment system is realized by a three-way catalytic converter, which requires that the engine is operated at near-stoichiometric conditions [27]. Compliance with this requirement is ensured by means of a widerange O2-sensor upstream of the TWC, a switch-type O2-sensor downstream of the TWC, and a dedicated control system for the air/fuel ratio. Further details on the latter will be provided in Section 3. The TWC is mounted at a distance of about d T W C > 1.3   m from the engine. This specification resulted from a simulation-based optimization process of the volumetric efficiency of the engine as well as of the gas oscillation dynamics. It thus was a fixed design requirement. To utilize the hot exhaust gas in the context of the combined heat and power process, a tailored exhaust gas heat exchanger is installed downstream of the TWC. This ensures a heat transfer between the exhaust gas and the hydraulic heating circuit. Thus, the hot exhaust gas is cooled, effectively heating the water in the heating circuit which can subsequently be used as thermal energy. Moreover, the input water to this heat exchanger is provided at the lowest system temperature. This ensures that condensing technology can be utilized, which further increases the thermal efficiency. The exhaust gas exits the system at a temperature of about ϑ 80 C . Figure 1 schematically shows the layout of the airpath with the EHC. For reasons of clarity, further components and systems of the mCHP and of the data acquisition setup that do not affect the scope of this research, i.e., the pollutant emission behavior, were omitted.

3. Strategic Approaches

This section presents the main dependencies of the produced pollutant emissions on the ignition timing, the reference air/fuel ratio, and the EHC. Subsequently, the experimentally investigated strategies are derived. With the ignition timing and the air/fuel ratio, two purely software-based strategies are examined. As a hardware solution, the impact of an electrically-heated catalyst (EHC) is explored.

3.1. Ignition Timing

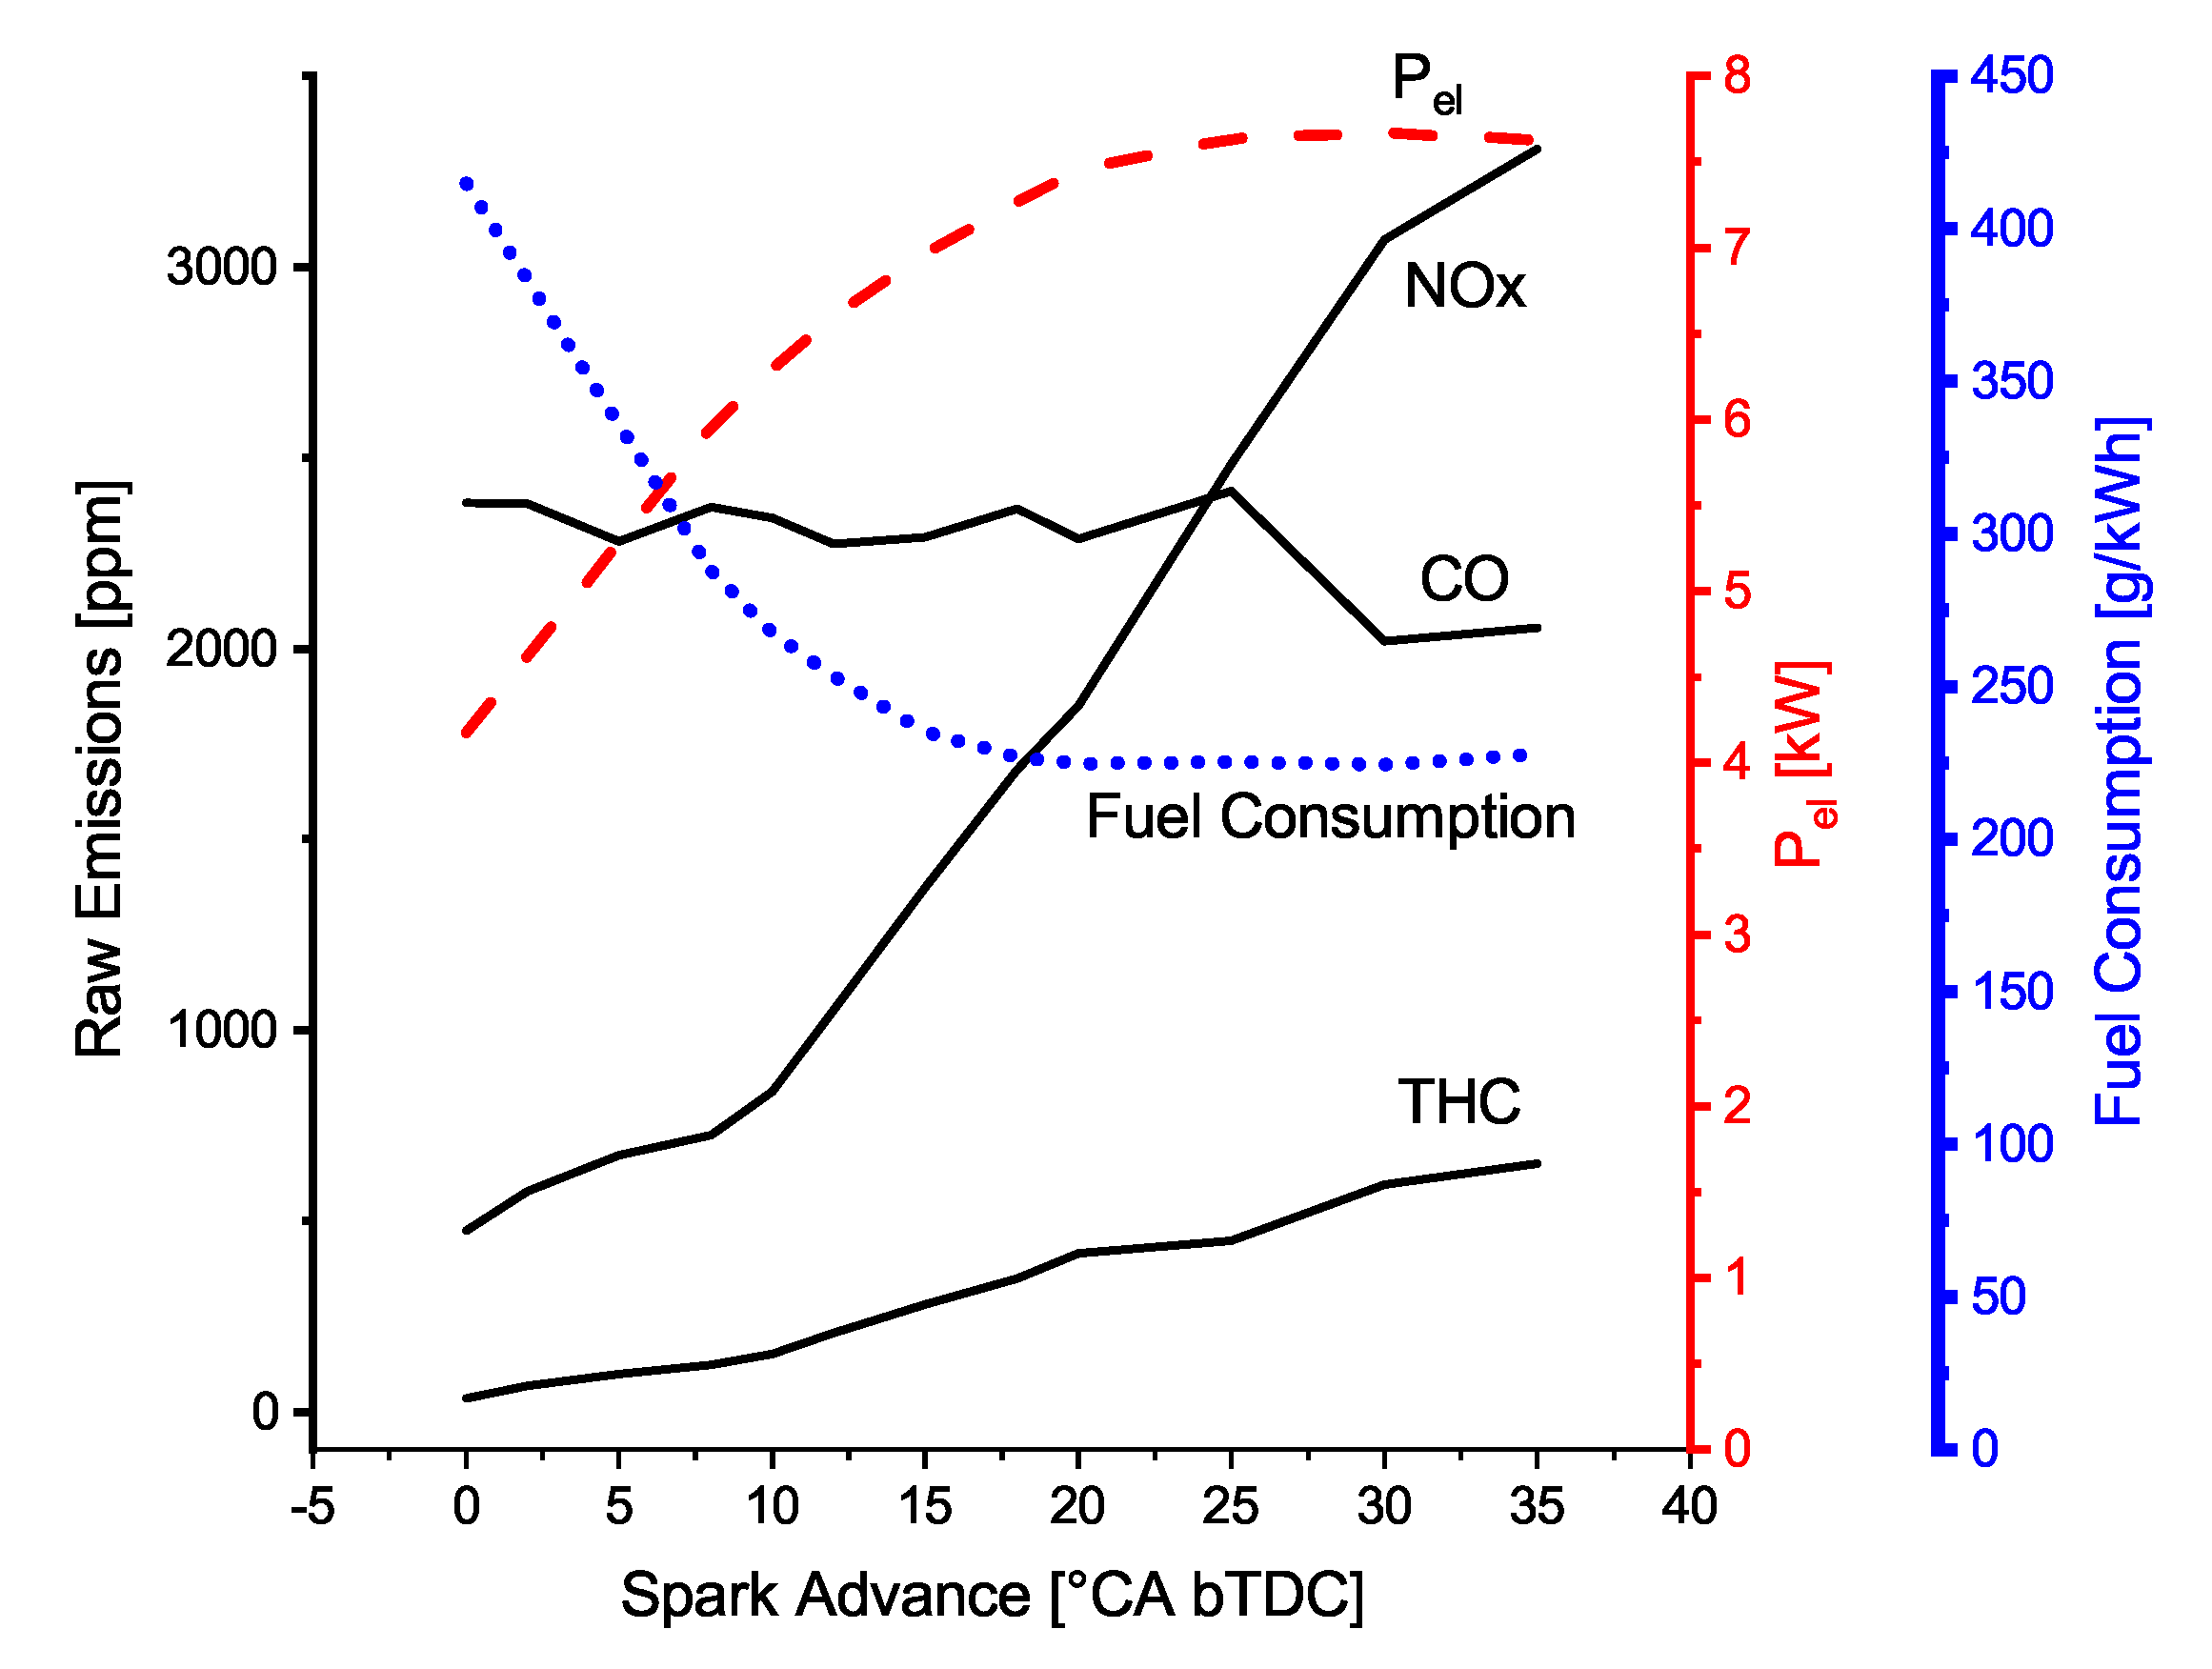
The ignition timing plays an important role for the control of an internal combustion engine. It significantly affects the thermodynamic properties of the overall combustion process and therefore has to be carefully controlled in order to yield a desired engine behavior [27]. In particular, the ignition timing substantially changes the pressure and temperature characteristics inside the cylinder which, in turn, leads to a high impact on basic engine properties such as fuel consumption, mechanical efficiency, and the formation of pollutants [27,28,29,30]. It is generally specified by defining the spark event to occur at a specific crank angle ζ during the engine cycle and is expressed in relation to the top dead center (TDC) of the engine. Positive values of ζ are defined as a spark advance (SA), as the spark occurs before the piston reaches the physical TDC during the compression phase. Accordingly, negative values of ζ indicate a spark retardation (SR), i.e., the spark event occurs after the piston reaches the physical TDC. Alternatively, the ignition timing can be expressed in crank angle degrees before TDC ( CA bTDC) or crank angle degrees after TDC ( CA aTDC) respectively. In most applications, the spark is advanced. This is because the mechanical efficiency reaches its maximum at a specific ignition angle ζ > 0 ° CA (bTDC), commonly referred to as Maximum Brake Torque (MBT) timing. With this SA, the corresponding center of combustion (COC) is usually located at around 6°–10° CA (aTDC), i.e., the piston just started moving downwards and the combustion energy can be optimally converted into rotational energy. In contrast, the minimum in fuel consumption does not emerge at MBT timing [27]. The choice of the SA value thus represents a tradeoff between mechanical efficiency and fuel consumption. Figure 2 displays the effect of the SA on the electrical power and the fuel consumption as well as on the emissions of NOx, THC and CO for the engine described in Section 2. In this context, as the engine is operated under full load at all times, the electrical output power of the mCHP serves as a valid substitute for the mechanical efficiency.
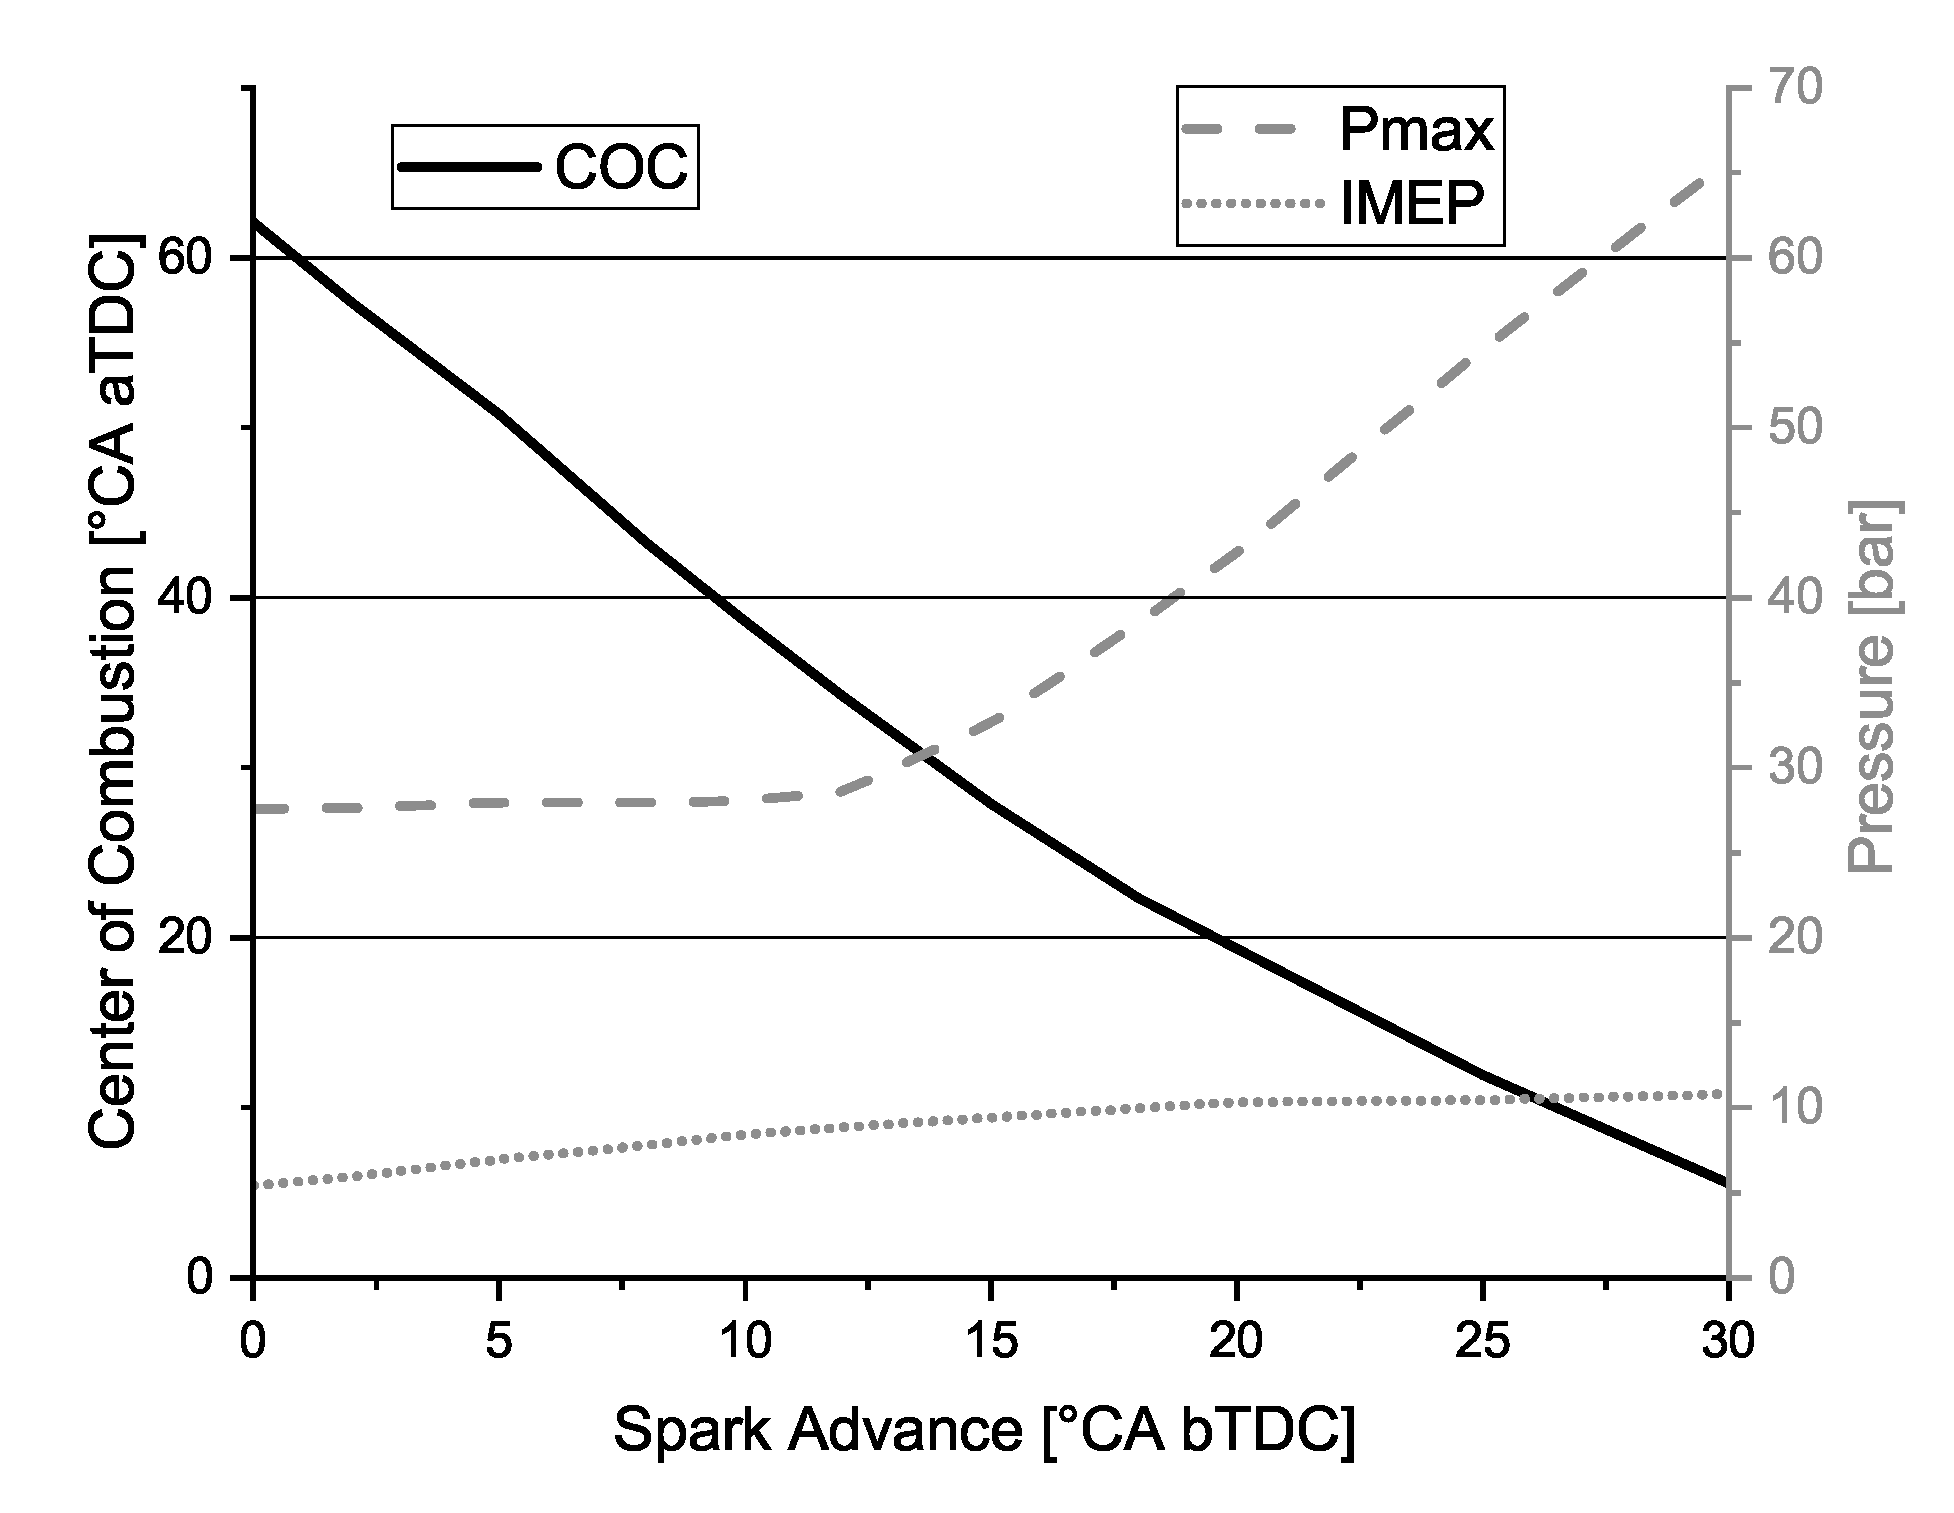
The underlying effect of the SA on the formation of pollutant emissions is closely connected to the heat release and pressure characteristics inside the combustion chamber. Figure 3 shows a measurement of the maximum in-cylinder pressure, as well as the COC for different spark advance values. A decreasing SA value, i.e., a spark event that occurs later than the MBT timing, leads to a lower peak cylinder pressure and a shift of the COC to a later point in the combustion cycle. The combustion process is therefore prolonged but less intensive. This results in lower burnt-gas temperatures and thus in lower levels of the NOx formation rate. The formation of total hydrocarbon emissions (THC) shows a similar dependency. At a later ignition angle, the maximum in-cylinder temperature is reached at a later point in the combustion process, due to the lower peak pressure and prolonged heat release. Thermodynamically, this favors post-combustion oxidization processes of the fuel–air mixture residuals that have been previously pushed into crevices of the combustion chamber during high pressure conditions. As this unburned fuel–air mixture is the main source of unburned hydrocarbon emissions, the improved conditions for post-combustion oxidization leads to reduced levels of raw THC emissions. In addition, the exhaust gas temperature exiting the engine is significantly higher, which contributes to an accelerated heat-up of the exhaust path and consequently to a reduced time until TWC light-off. In contrast, at stoichiometric conditions carbon monoxide is not significantly affected by the SA setting, because there is enough O2 present to oxidize the vast majority of the CO. However, due to frozen equilibrium concentrations of CO, CO2 and O2, a certain amount of CO is still present in the exhaust gas upstream of the TWC.
Strategically, a shift of the SA from MBT timing to later ignition angles is an appropriate measure to both reduce the raw engine-out emissions and to accelerate the heat-up process of the TWC during the cold-start phase. However, a later SA results in less electrical power produced by the mCHP (Figure 2). Hence, adjustments to the ignition timing, in the following referred to as SA strategy, are carried out up to the point at which the TWC operates in steady-state. The threshold is set to ϑ T W C 600 C , because at lower temperatures temporary emission peaks emerge for all pollutant species due to the step change from a late SA back to MBT timing. Above this threshold, similar peaks are not observable.
The control strategy for the SA up to this threshold was experimentally evaluated. The SA was varied between 0° and 30° CA (bTDC). For initial spark advances of ζ 5 ° CA, the air/fuel mixture could not be ignited for near-stoichiometric air/fuel ratios. Furthermore, for SA values of ζ < 10 ° CA (bTDC), the engine-out temperature exceeded ϑ E n g _ o u t 800 C in less than 1 min . Due to material restrictions on engine and exhaust path components, we constrained the engine-out temperature to ϑ E n g _ o u t 780 C by introducing a feedback controller that increases the SA for as long as this constraint is violated and holds the commanded value of SA as soon as ϑ E n g _ o u t falls below 780 C . Since the engine-out exhaust gas temperature only rises during warm-up, the control action is similar to ramp/soak controllers. Although the SA is shifted up to ζ = 11 ° CA within 30 s , we chose to set the value of the SA at startup to ζ s t a r t = 8 ° CA (bTDC) for two reasons. First, the fuel–air mixture could be reliably ignited. Second, as Table 1 shows, the mean engine-out emissions for the first 30 s of a startup are significantly lower.

3.2. Air/Fuel Ratio Control Strategy

Similarly to the ignition timing, the air/fuel ratio is one of the most significant parameters that influences the entire engine performance, e.g., power output, fuel consumption or pollutant emissions. For this reason, it has been a research focus for several decades in the context of internal combustion engines [31,32,33]. For reasons of clarity, in the following sections the term air/fuel ratio (AFR) is used to denote the equivalence air/fuel ratio, commonly referred to aslambda ( λ ). Due to its widespread impact, the choice of the AFR setpoint is subject to the conflicting goals of fuel consumption and power output, i.e., in the context of combined heat and power plants, of the electrical power generated. The lowest fuel consumption for the engine under consideration is achieved at λ = 1.03 , whereas the maximum electrical output power is achieved at λ = 0.99 . However, within this λ -range, both the electrical output power and the fuel consumption vary by maximally 2 % . For this reason, both performance measures are not further considered for the AFR setpoint strategy, such that the focus is set only on the reduction of the pollutant emissions.
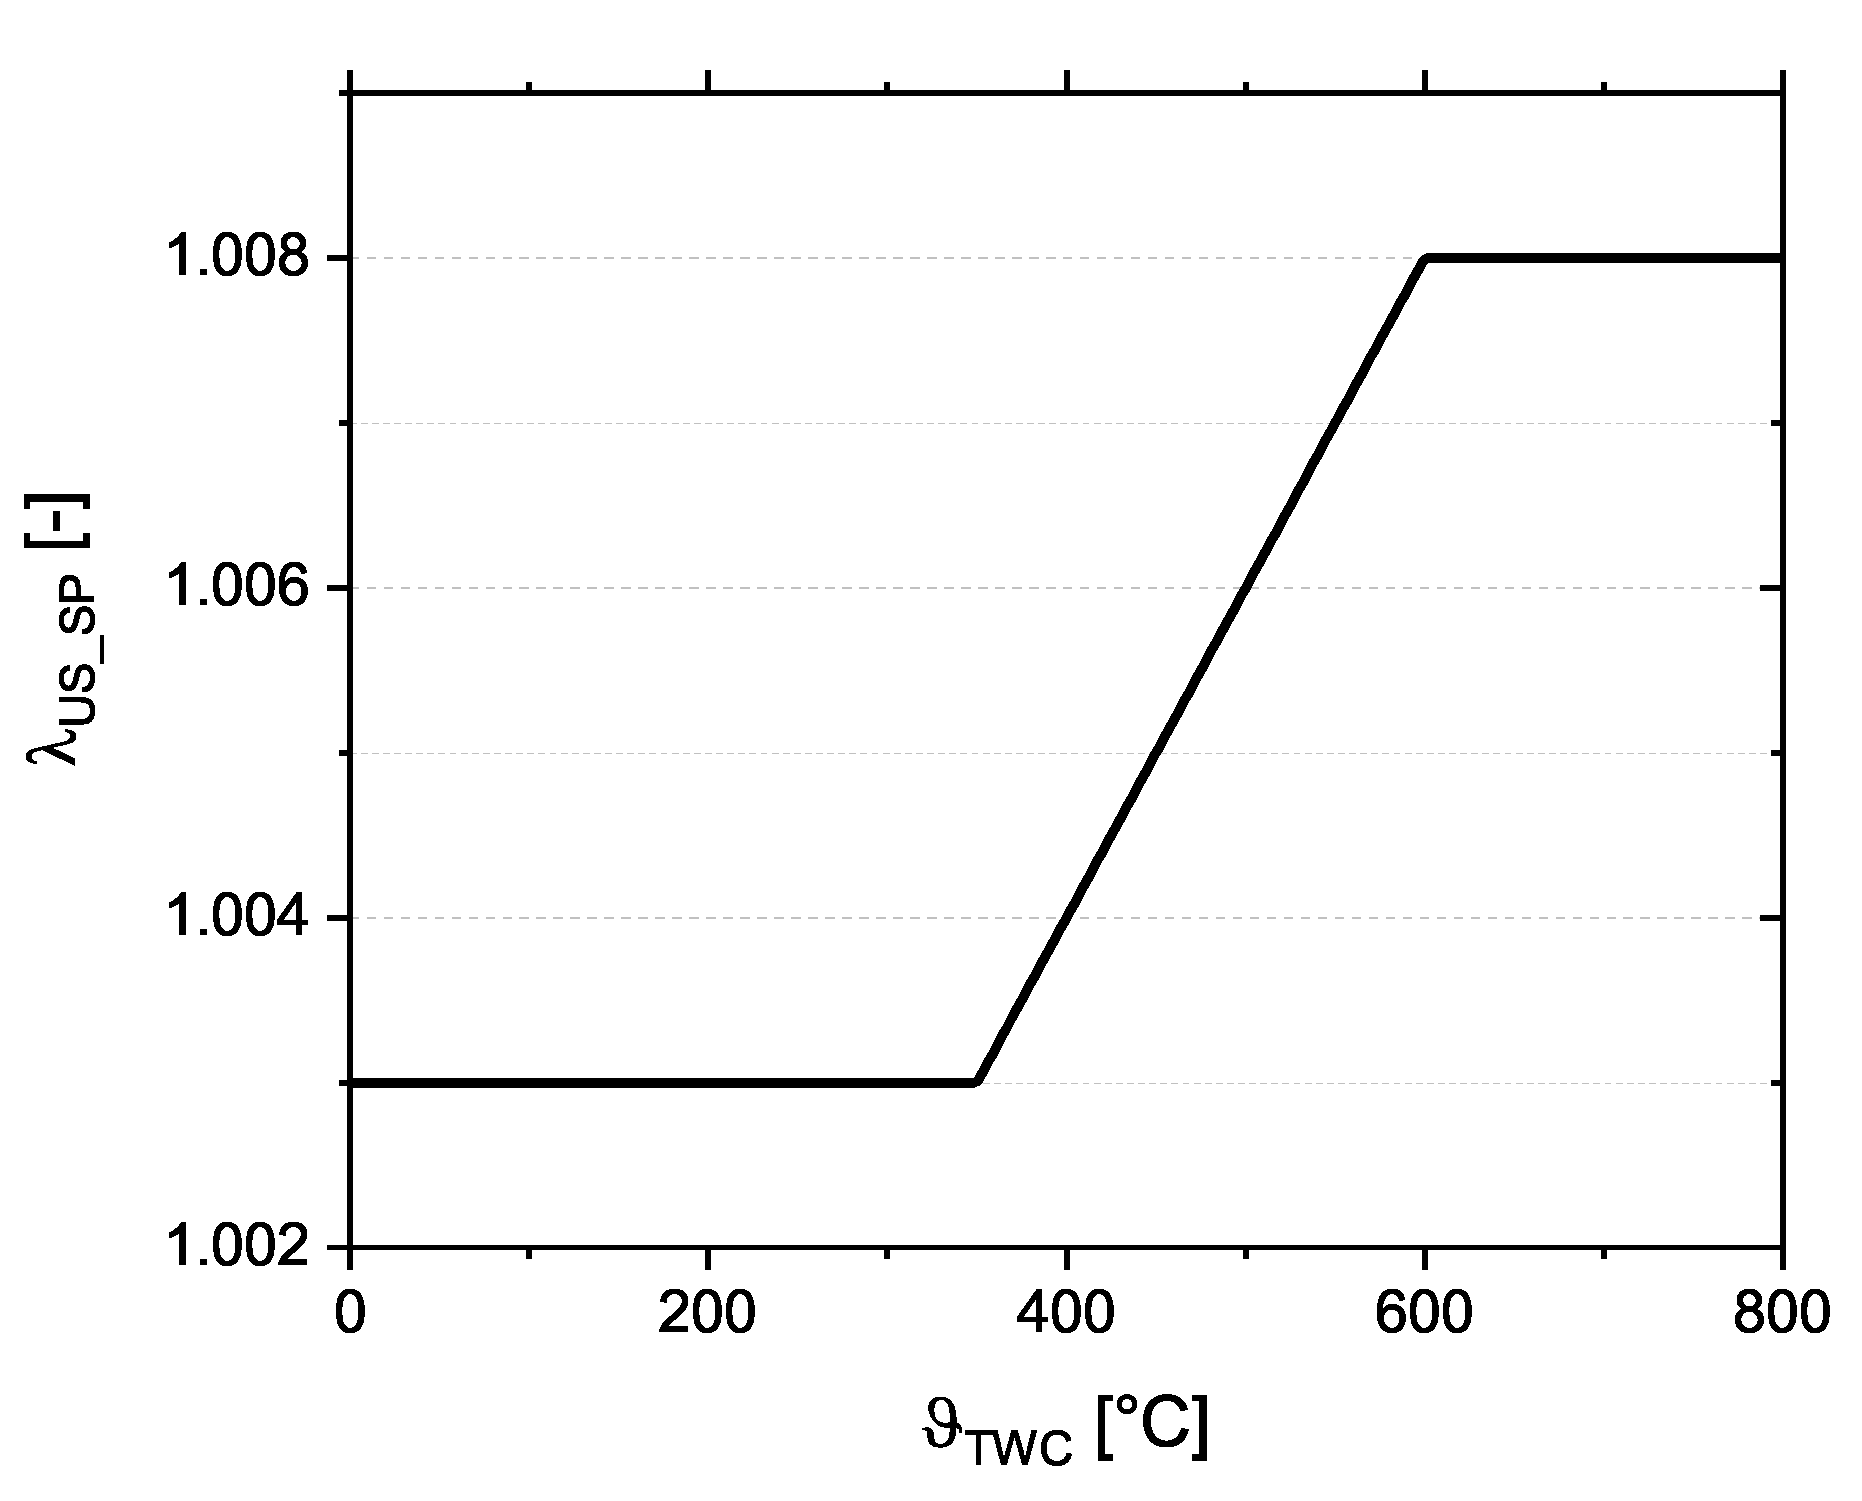
As specified in Section 2, the system utilizes a three-way catalytic converter as an aftertreatment system. Such catalysts reach their maximum conversion potential in a narrow region around stoichiometric conditions at λ = 1 [27]. In general, an AFR controller ensures that the actual AFR stays in this region. For the system investigated here, a cascaded control structure was chosen for the AFR controller (Figure 4). It utilizes a widerange O2 sensor upstream and a switchtype O2 sensor downstream of the TWC. Two corresponding PI-controller ensure that the respective setpoints are precisely tracked. In this scheme, the output of the downstream λ controller generates the setpoint for the upstream λ controller. This is suitable to account for drift in the widerange O2 sensor as well as for the natural deterioration in the conversion rate of the TWC. However, during a cold-start procedure and the corresponding TWC warm-up phase, the signal of the downstream O2 sensor fluctuates until the TWC reaches about ϑ T W C = 600 C . This is due to the constantly changing availability of O2. However, the downstream λ controller remains disabled until the TWC reaches ϑ T W C = 600 C , as below this threshold the TWC is still in transient operation which leads to fluctuations of the amount of O2 in the exhaust path. As a results, the signal of the downstream O2 sensor also fluctuates. For this reason the strategy to reduce the cold-start emissions by means of the air/fuel ratio, subsequently referred to as AFR strategy, is therefore based solely on adjusting the setpoint of the upstream λ controller during the TWC warm-up.
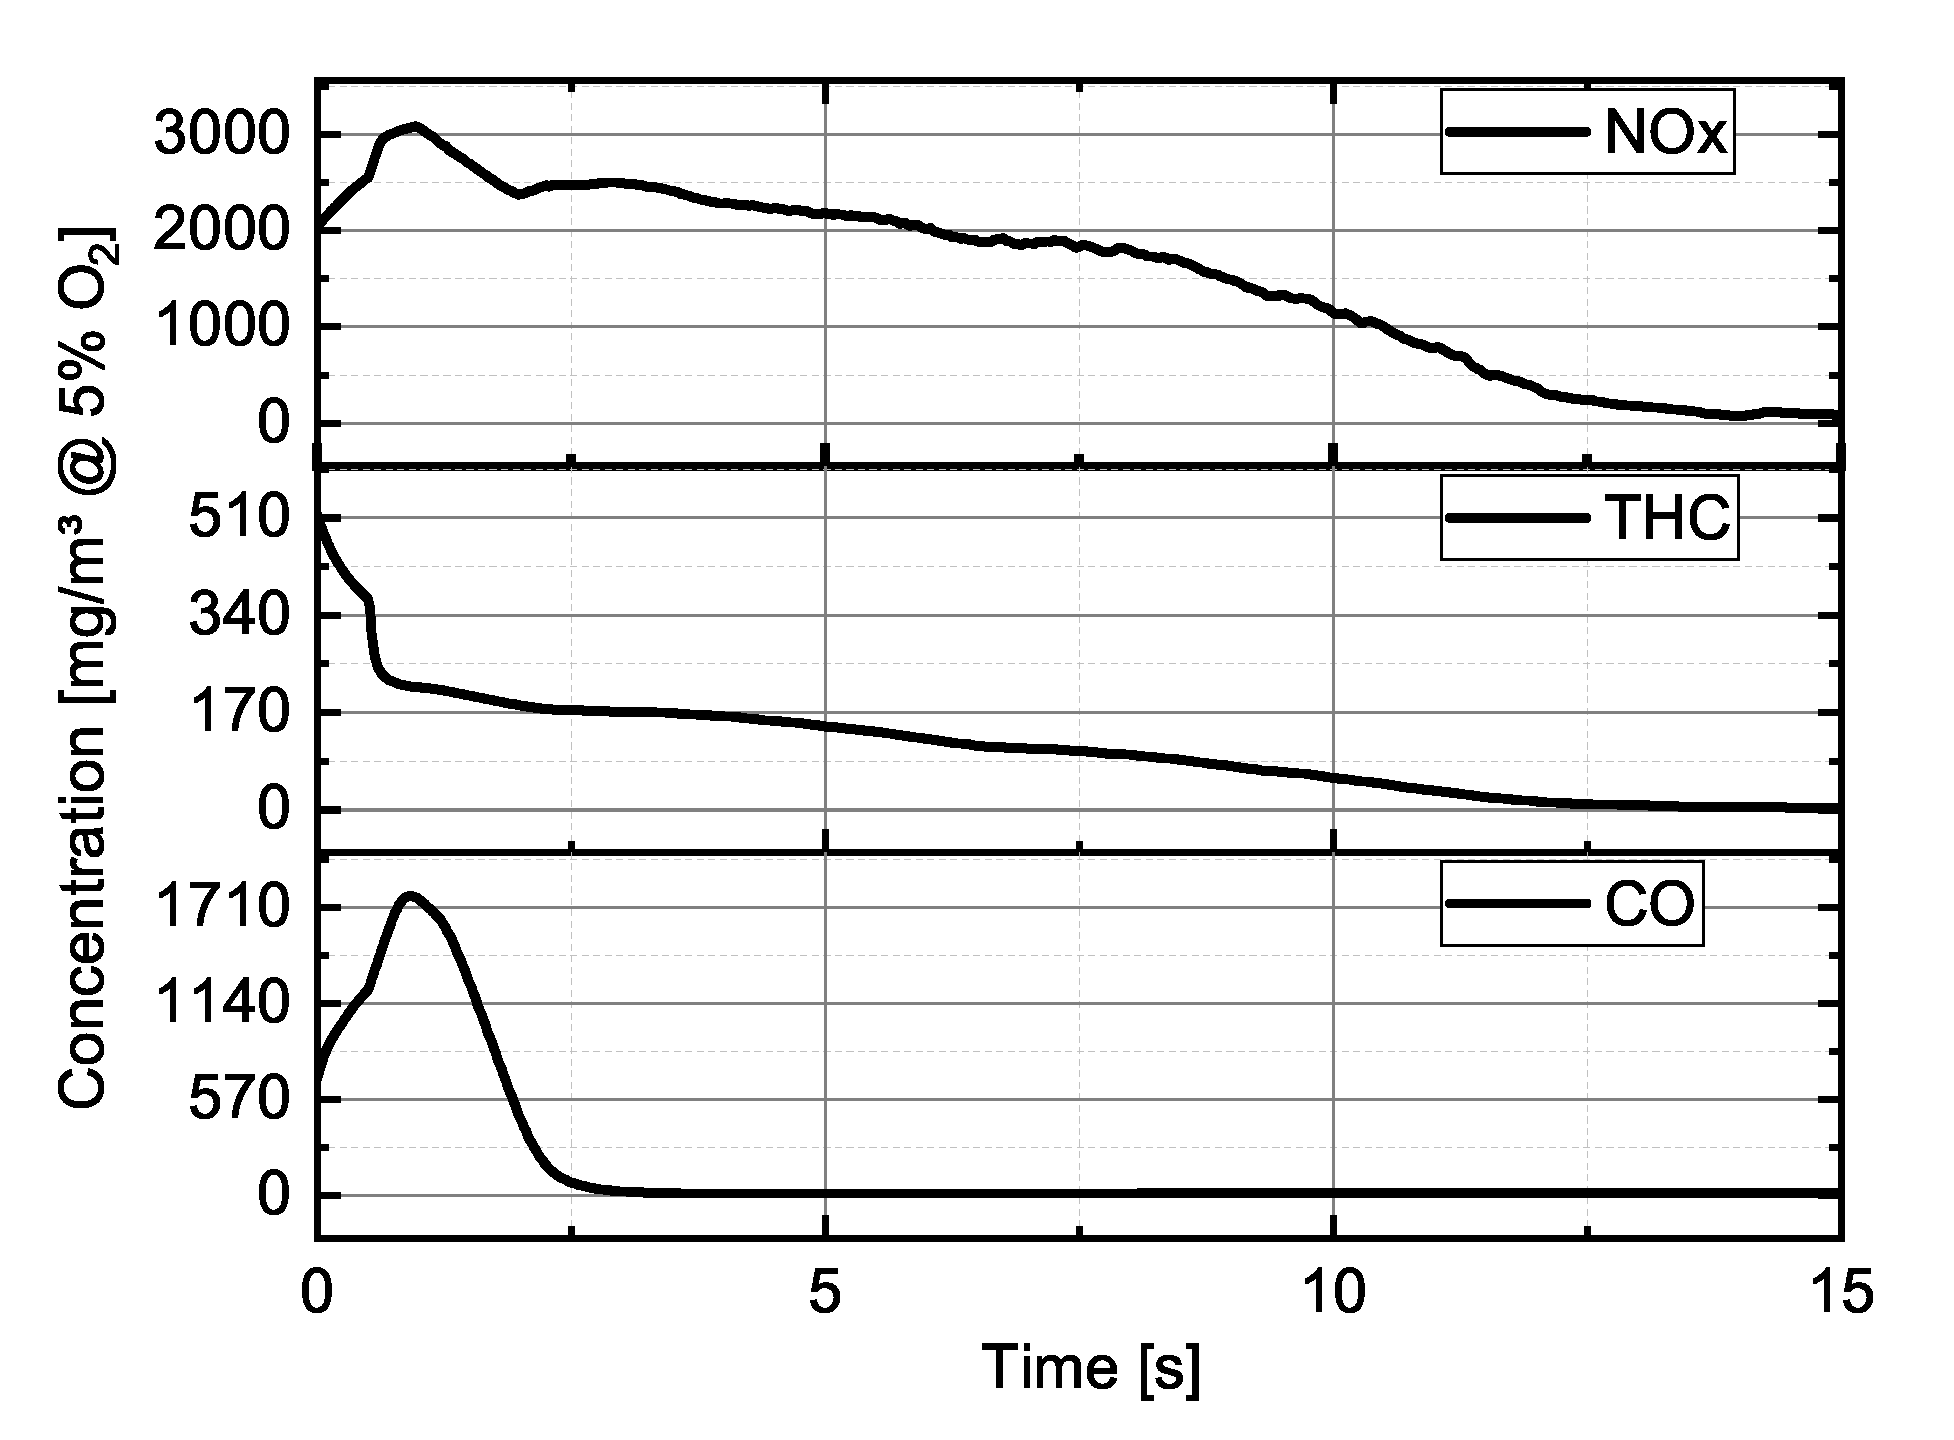
For the system investigated, the lowest pollutant emission concentrations under steady-state conditions are achieved at the setpoint λ U S _ S S = 1.008 ( c N O x = 12 mg/m 3 , c T H C = 3 mg/m 3 , c C O = 25 mg/m 3 , with all concentrations related to 5% O2 in the dry flue gas). The AFR strategy is therefore constrained to set the λ reference to λ U S _ S S = 1.008 at ϑ T W C = 600 C . This also represents the final point for this strategy, as the system is then operated in steady-state with an enabled downstream λ controller. For two reasons, we decided to initiate the strategy at a slightly richer fuel–air mixture than λ U S _ S S . First, as Figure 5 shows, a cold-start with λ U S _ S P = λ U S _ S S generates higher concentration levels of NOx than of CO and THC. In conjunction with the fact that emission limits for NOx are more stringent than for CO, this justifies the shift to a richer mixture. Second, the mCHP is switched off by disconnecting the asynchronous generator from the grid and simultaneously closing the fuel valve. The engine then coasts to a standstill, effectively pumping pure air through the exhaust path and thus loading the O2 storage of the TWC. This is also the case for the subsequent startup as the enabled generator drags the engine up to ω e n g 3000 rpm before the ignition is enabled and the fuel valve is opened. Thus, the O2 storage of the TWC is assumed to be filled at this point. Therefore, the startup can be initiated at slightly richer conditions because enough oxygen is available to account for increased raw emissions of CO and THC. However, the available oxygen in the TWC decreases gradually. A switch from the slightly richer λ U S _ S t a r t u p to λ U S _ S S is thus not suitable because λ U S _ S t a r t u p eventually produces increasing raw emissions of CO, whereas λ U S _ S S produces high levels of NOx. Thus, for this investigation, we implemented a trajectory that, starting from a certain value λ U S _ S t a r t u p , increases the setpoint until it reaches λ U S _ S S at ϑ T W C = 600 C . This trajectory does not enable an optimal conversion for all states of the TWC during warm-up. However, it can be implemented in a straightforward feedback control scheme that depends on the TWC temperature. Moreover, the CO emissions in the exhaust gas decrease much faster because the oxidization of carbon monoxide in the TWC takes place at significantly lower temperatures than the oxidization of unburned hydrocarbons or the reduction of nitrogen oxide. This fact can be used to balance the trajectory such that slightly increased levels of CO are accepted in favor of low NOx emissions during the TWC warm-up.
To define the final strategy, the actual value of λ U S _ S t a r t u p = 1.003 was determined experimentally with the aim of achieving the minimum combined mass for all pollutants considered for the first 7 min of a startup. Below λ U S _ S P = 1.003 the CO emissions increase significantly, whereas the NOx emissions do not further decrease. Above λ U S _ S P = 1.003 the NOx emissions rise substantially. Although the CO emissions decrease, the increase in NOx emissions is much higher. For the final AFR strategy, the setpoint is therefore set to λ U S _ S t a r t u p = 1.003 at startup and gradually increased to λ U S _ S S = 1.008 depending on the temperature of the TWC (Figure 6). The continuous increase of the setpoint was implemented in order to operate the catalyst in a quasi-stationary state, thus keeping transient conversion dynamics due to stepwise setpoint changes as low as possible.

3.3. Electrically Heated Catalyst

The concept of electrically heated catalysts (EHC) gained attention in the automotive research sector due to the introduction of ever more stringent emission limits by governmental institutions in the late 1990s [34,35]. Since then, its impact on the reduction of cold-start emissions has been widely studied and confirmed for road vehicle engines [36,37]. The EHC used in this study consists of a coated heating plate which in this case is powered by a 12 V direct voltage source and acts as an ohmic resistance. The metal carrier of the EHC is located immediately downstream of this heating plate. Its shell is made of stainless steel. Thus, the EHC can be directly welded to an existing exhaust path.
The primary concept of an EHC is to accelerate the heat-up process of the TWC until it reaches its light-off temperature. As a secondary effect, oxidation reactions on the coated heating plate occur earlier than in conventional catalytic converters. This generates oxidation heat which additionally heats up the TWC. Another advantage is the fact that the metal carrier of the EHC has a lower thermal mass than that of the ceramic-based automotive catalysts. However, the cell density is significantly smaller. Therefore, the vast majority of the pollutant conversion still occurs inside the main TWC.
In this study an EHC with a nominal electric power of 700 W is mounted immediately upstream of the main TWC (Figure 1). The criteria for enabling and disabling the EHC are constrained due to hardware limitations. First, a heat-up of the EHC is only allowed in the presence of exhaust gas flow. Second, operating the EHC has to be stopped once the temperature of the exhaust gas entering the EHC ϑ E H C u s exceeds 700 C . Therefore, the EHC is activated as soon as the mCHP is switched on and is disabled when ϑ E H C u s 700 C . In order to compare the results and draw valid conclusions, a second criterion is set to disable the EHC once the exhaust gas temperature immediately downstream of the TWC reaches ϑ E H C d s 600 C . This criterion ensures that the EHC is also switched off in cases where the exhaust gas temperature does not exceed 700 C , i.e., the first criterion would not trigger a deactivation. The threshold is set to ϑ E H C d s = 600 C , as above this threshold the TWC operates at its steady-state conversion rate such that a further operation does not create any additional benefit. Table 2 summarizes the operational criteria of the EHC.
Hereafter, the application of the EHC is not referred to as an equivalent strategy to the spark retardation and the air/fuel ratio setpoint trajectory, as it is either enabled for a specified fraction of the cold-start process or it is disabled entirely. All main strategies are investigated with both enabled and disabled EHC (see Section 4).

4. Experimental Procedure

The experimental investigation spans four base strategies. In the reference case REF, both the spark advance and the AFR setpoint are set to their steady-state values, i.e., ζ = 30 ° CA (bTDC) and λ U S _ S P = 1.008 . In case AFR, only the AFR strategy developed for the AFR setpoint trajectory is activated. Similarly, in case SA, only the spark advance controller is activated. The fourth test case COMB is the combination of the AFR and AFR strategies, i.e., both the AFR setpoint strategy and the SA controller are activated. All test cases are performed with both disabled and enabled EHC, further denoted as XEHC with X R E F , A F R , S A , C O M B , resulting in a total of eight test cases. A summary of the described test setup is shown in Table 3. In order to reduce the measurement variance, every case was tested three times and the results were subsequently averaged.
The experiment procedure consisted of the startup and the subsequent warm-up process and lasted 60 min . The initial temperatures of components and fluids were ensured to be in the range of 25 C ± 5 C . During runtime, the pollutant volume concentrations, temperatures, chemical input power, as well as electrical and thermal power were logged with a sampling rate of 1 Hz . The mass concentration per volume (in [mg/m 3 @ 5% O2]) as well as the accumulated pollutant mass (in [mg]) were calculated for every data point by means of the pollutant volume concentrations measured, the fuel mass flow and the air/fuel ratio.

5. Results and Discussion

In order to compare the effectiveness of the different strategies for reducing the cold-start pollutant emissions, the results are discussed with respect to the following measures:
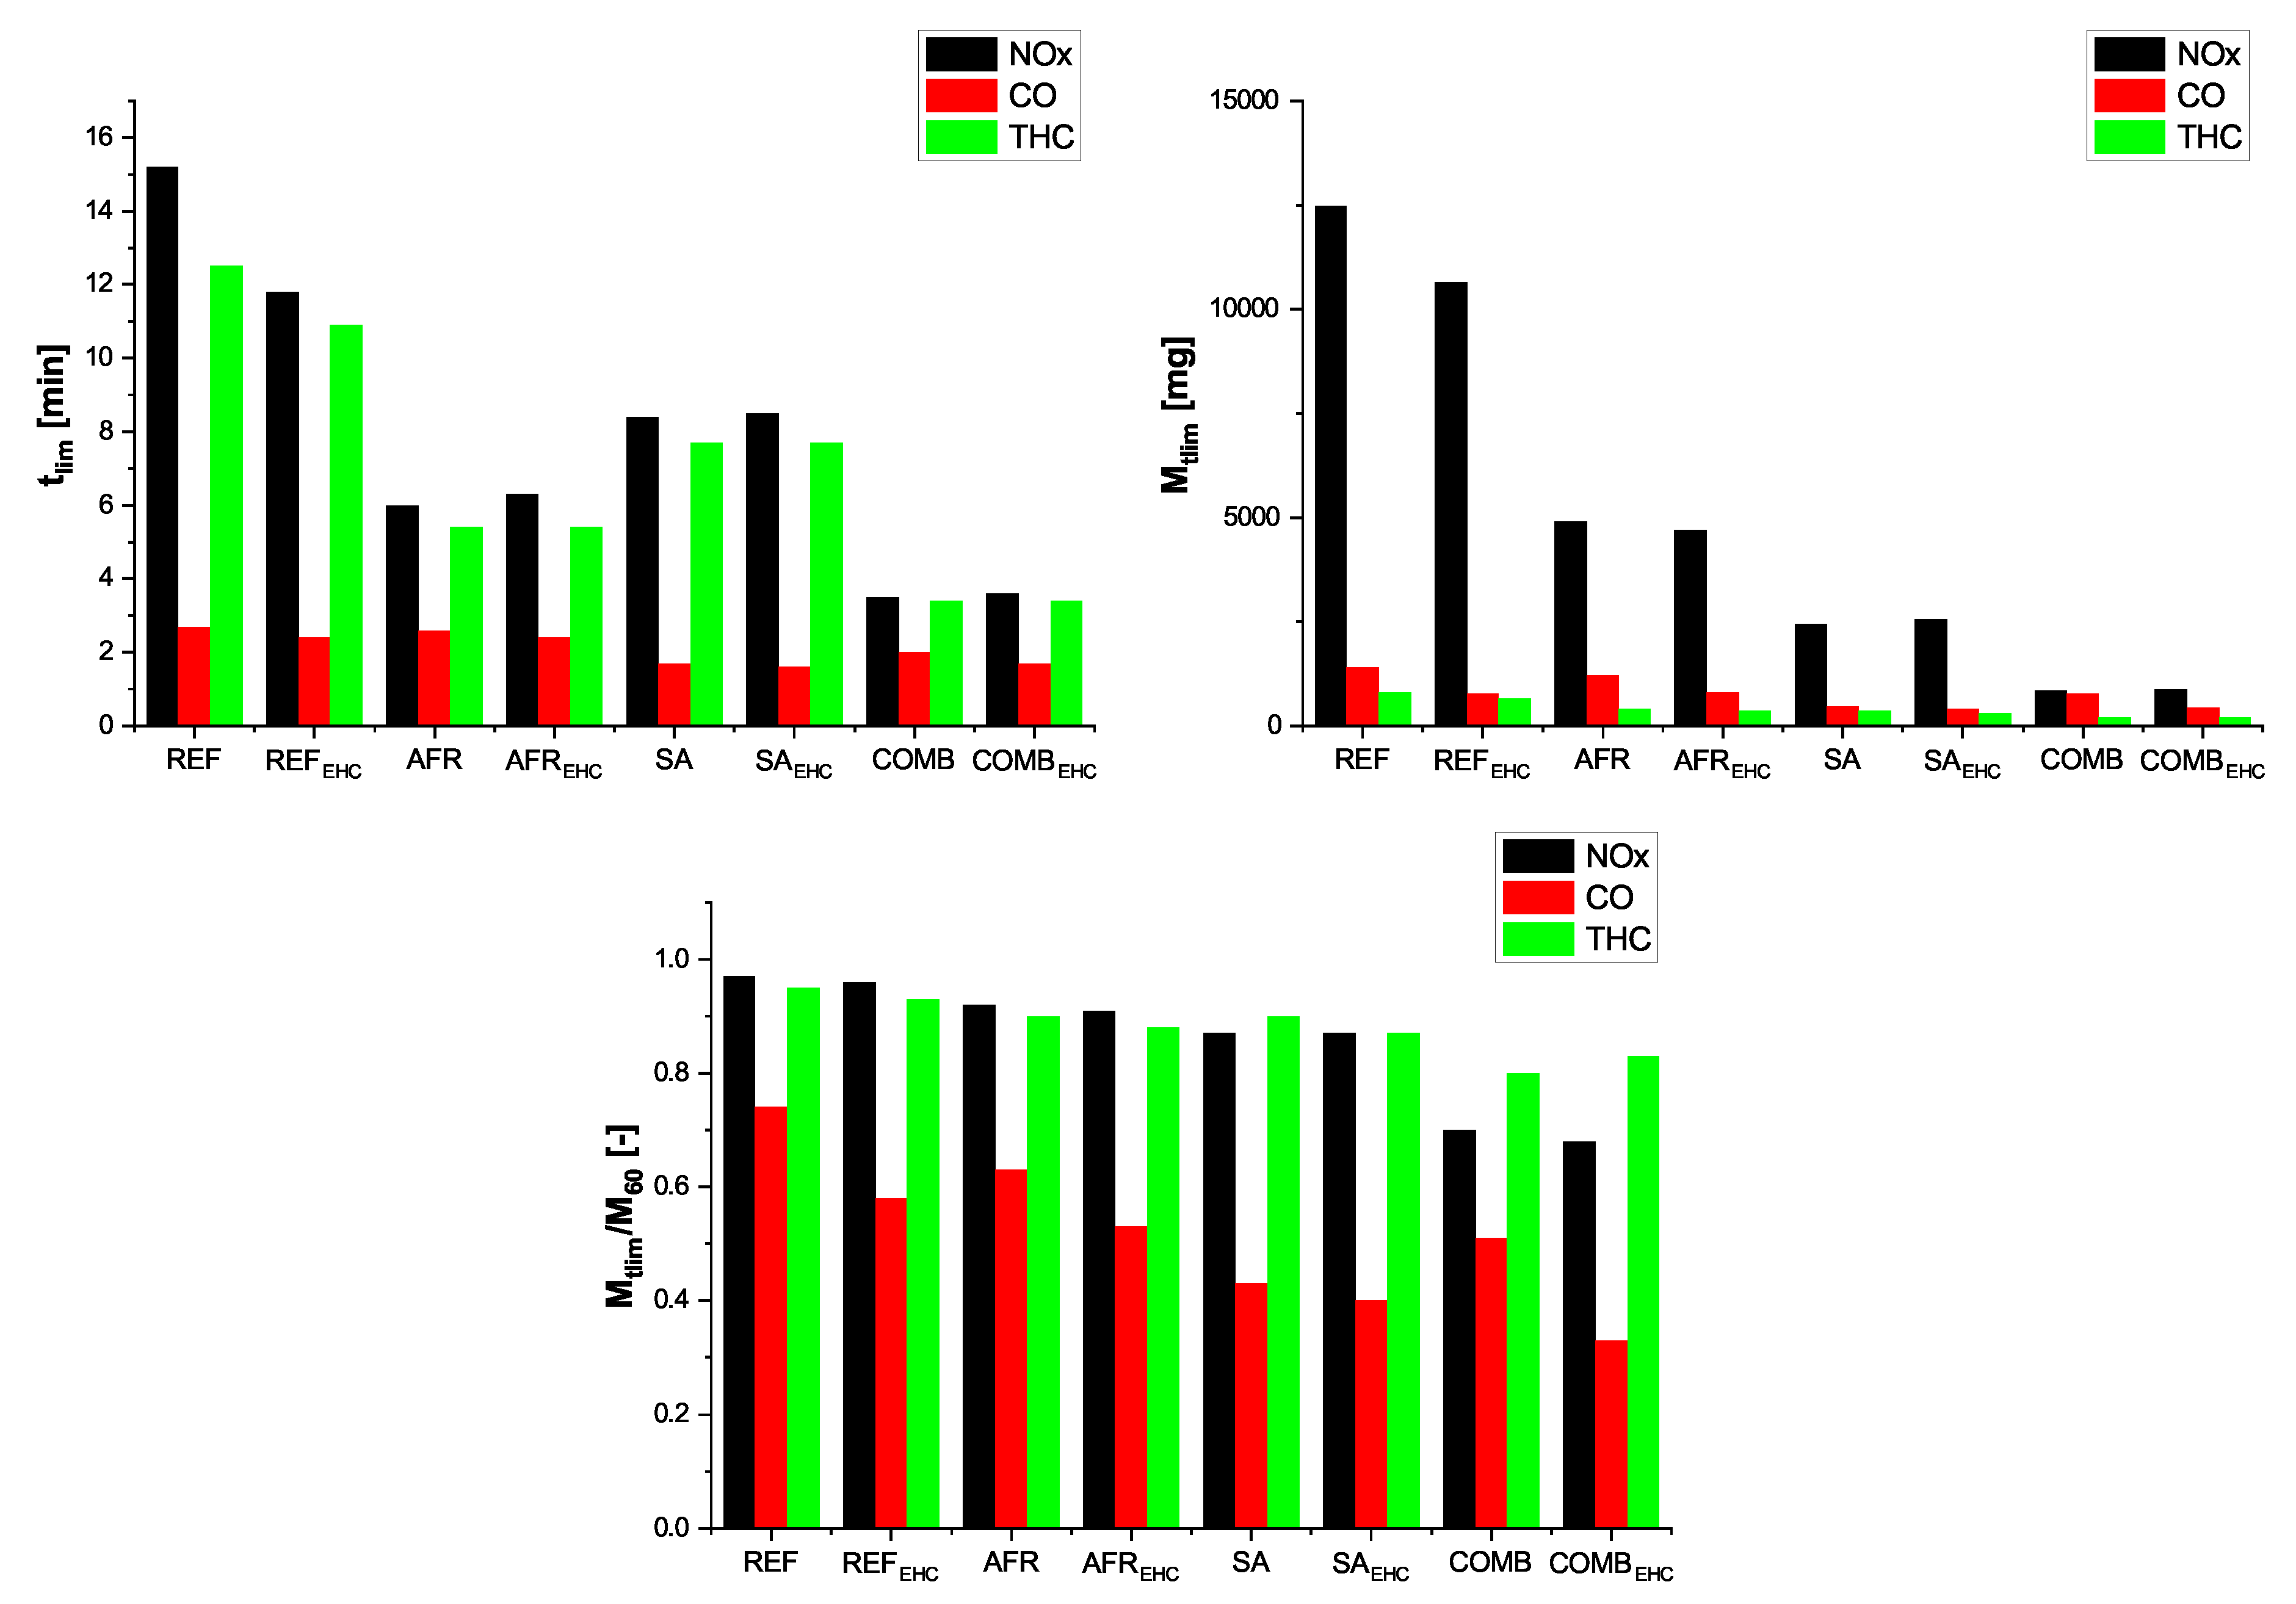
  • Time t l i m in [ min ] until a quasi-stable conversion rate is reached. In the following discussion this condition is assumed to be fulfilled as soon as the mass concentration falls below 50 m g / m 3 at 5 % O 2 for CO and NOx, and below 10 m g / m 3 at 5 % O 2 for THC.
  • The mean emission concentration over the entire cold-start duration in [ m g / m 3 at 5 % O 2 ].
  • The cumulated emission mass for the entire cold-start in [ m g ]
  • The specific emission mass with respect to the electrical energy produced in [ m g / k W / h ]
The strategies investigated are compared to the reference case, i.e., the case with MBT timing at a spark advance ζ = 30 CA ( bTDC ) , an AFR setpoint of λ U S _ S P = λ U S _ S S = 1.008 , and a disabled EHC.
Figure 7 shows an excerpt of the evolution of the emission concentrations of NOx, THC and CO during a cold-start procedure with respect to time. Each of the strategies shows a different influence on the emission characteristics. First, the impact of the EHC is only significant for the reference case REF as well as the CO emissions of the remaining cases. This fact suggests that the EHC accelerates the TWC warm-up such that pollutant emissions are effectively converted earlier than with a disabled EHC. However, the application of the SA and AFR strategies outperforms the effect of the EHC on the emissions of NOx and THC. The remaining influence on the CO emissions results from the fact that, in contrast to the conversion of THC and NOx, CO is already oxidized at TWC temperatures as low as 150 C –250 C . This effect is observable throughout the entire set of strategies. Second, the application of the SA strategy reduces the overall concentration levels for all pollutants and simultaneously shifts the peak in mass concentration to earlier points in time for CO and NOx. Third, in contrast to the SA strategy, the AFR strategy causes a change in the overall characteristic. Figure 7 shows that the concentration level for case AFR is almost identical to the reference case during the first two minutes. However, it follows a pronounced dip in the NOx and THC concentrations between 2.5 min to 5 min . This dip also exists in case COMB and can therefore be attributed to the application of the AFR strategy. As both effects, the reduced pollutant emissions level due to the SA strategy and the characteristic drop in THC and NOx emissions due to the AFR strategy can be observed in case COMB, we conclude that the AFR and SA strategies do not interfere or interact, but superimpose with each other.
Figure 8 shows t l i m , the accumulated emission mass in [mg] from startup until t l i m as well as the cumulated emission mass until t l i m relative to the cumulated emission mass for the entire cold-start procedure of 60 min for all cases. In this context, t l i m acts as a measure of how quickly each emissions concentration decreases, whereas M t l i m represents the total emission mass during this time frame. The value of M t l i m M 60 indicates how much of the total emission mass is produced during t l i m , thus highlighting the significance of the emission behavior during the cold-start phase. The time t l i m is generally very short for CO and varies in a narrow range of 1.6 min (case SAEHC) to 2.7 min (case REF). For the emissions of THC and NOx, a more clear distinction between the strategies is observed. The maximum reduction occurs for the case COMB where the value of t l i m amounts to 3.4 min (THC) and 3.5 min (NOx), respectively. This result represents the maximum relative reductions compared to the case REF of about 73 % (THC) and 77 % (NOx). Notably, the case AFR seems to bring the emissions below the threshold for t l i m more quickly than the case SA. However, the emission mass M t l i m is lower for the case SA. This confirms the assumption made at the beginning of the chapter that the AFR strategy changes the temporal characteristic of the emission reduction. In contrast, the SA strategy reduces the raw engine out emissions and accelerates the TWC warm-up. Thus the overall level of emission concentrations is reduced and conversion effects in the TWC start earlier.
The value of M t l i m represents the cumulated emission mass for each individual case, i.e., until the respective t l i m . Calculating the cumulated emission mass for each case until t l i m R E F (15.2 min , 2.7 min and 12.5 min for NOx, CO and THC, respectively) sheds light on the emission mass reduced compared to the reference case. In case COMB the largest relative reduction in emission mass can be achieved with 93 % (NOx), 74 % (THC) and 27 % (CO). The ratio M t l i m M 60 represents the share of the emission mass released during the cold-start phase, i.e., during t l i m , relative to the emission mass released during an operation of 60 min . Figure 8 shows that these values decrease from 97% (NOx), 975% (THC) and 74% (CO) for the reference case down to 70% (NOx), 83% (THC) and 51% (CO) for case COMB. This demonstrates that the cold-start emissions are still dominant, but that the large disparity to the steady-state emissions could be attenuated by applying the strategies developed. The EHC shows little influence on the pollutant emissions compared to the strategies applied. However, CO is converted earlier, i.e., at lower temperatures, inside the TWC than NOx and THC [27]. As the EHC is switched on at startup, its additional heat energy accelerates the warm-up of the TWC such that there is a positive effect on the reduction of CO emissions. However, the effects of the SA strategy to reduce the raw engine out emissions and accelerate the TWC warm-up due to higher exhaust gas temperatures surpasses the effect of the EHC, thereby mitigating its benefits to a large extent.
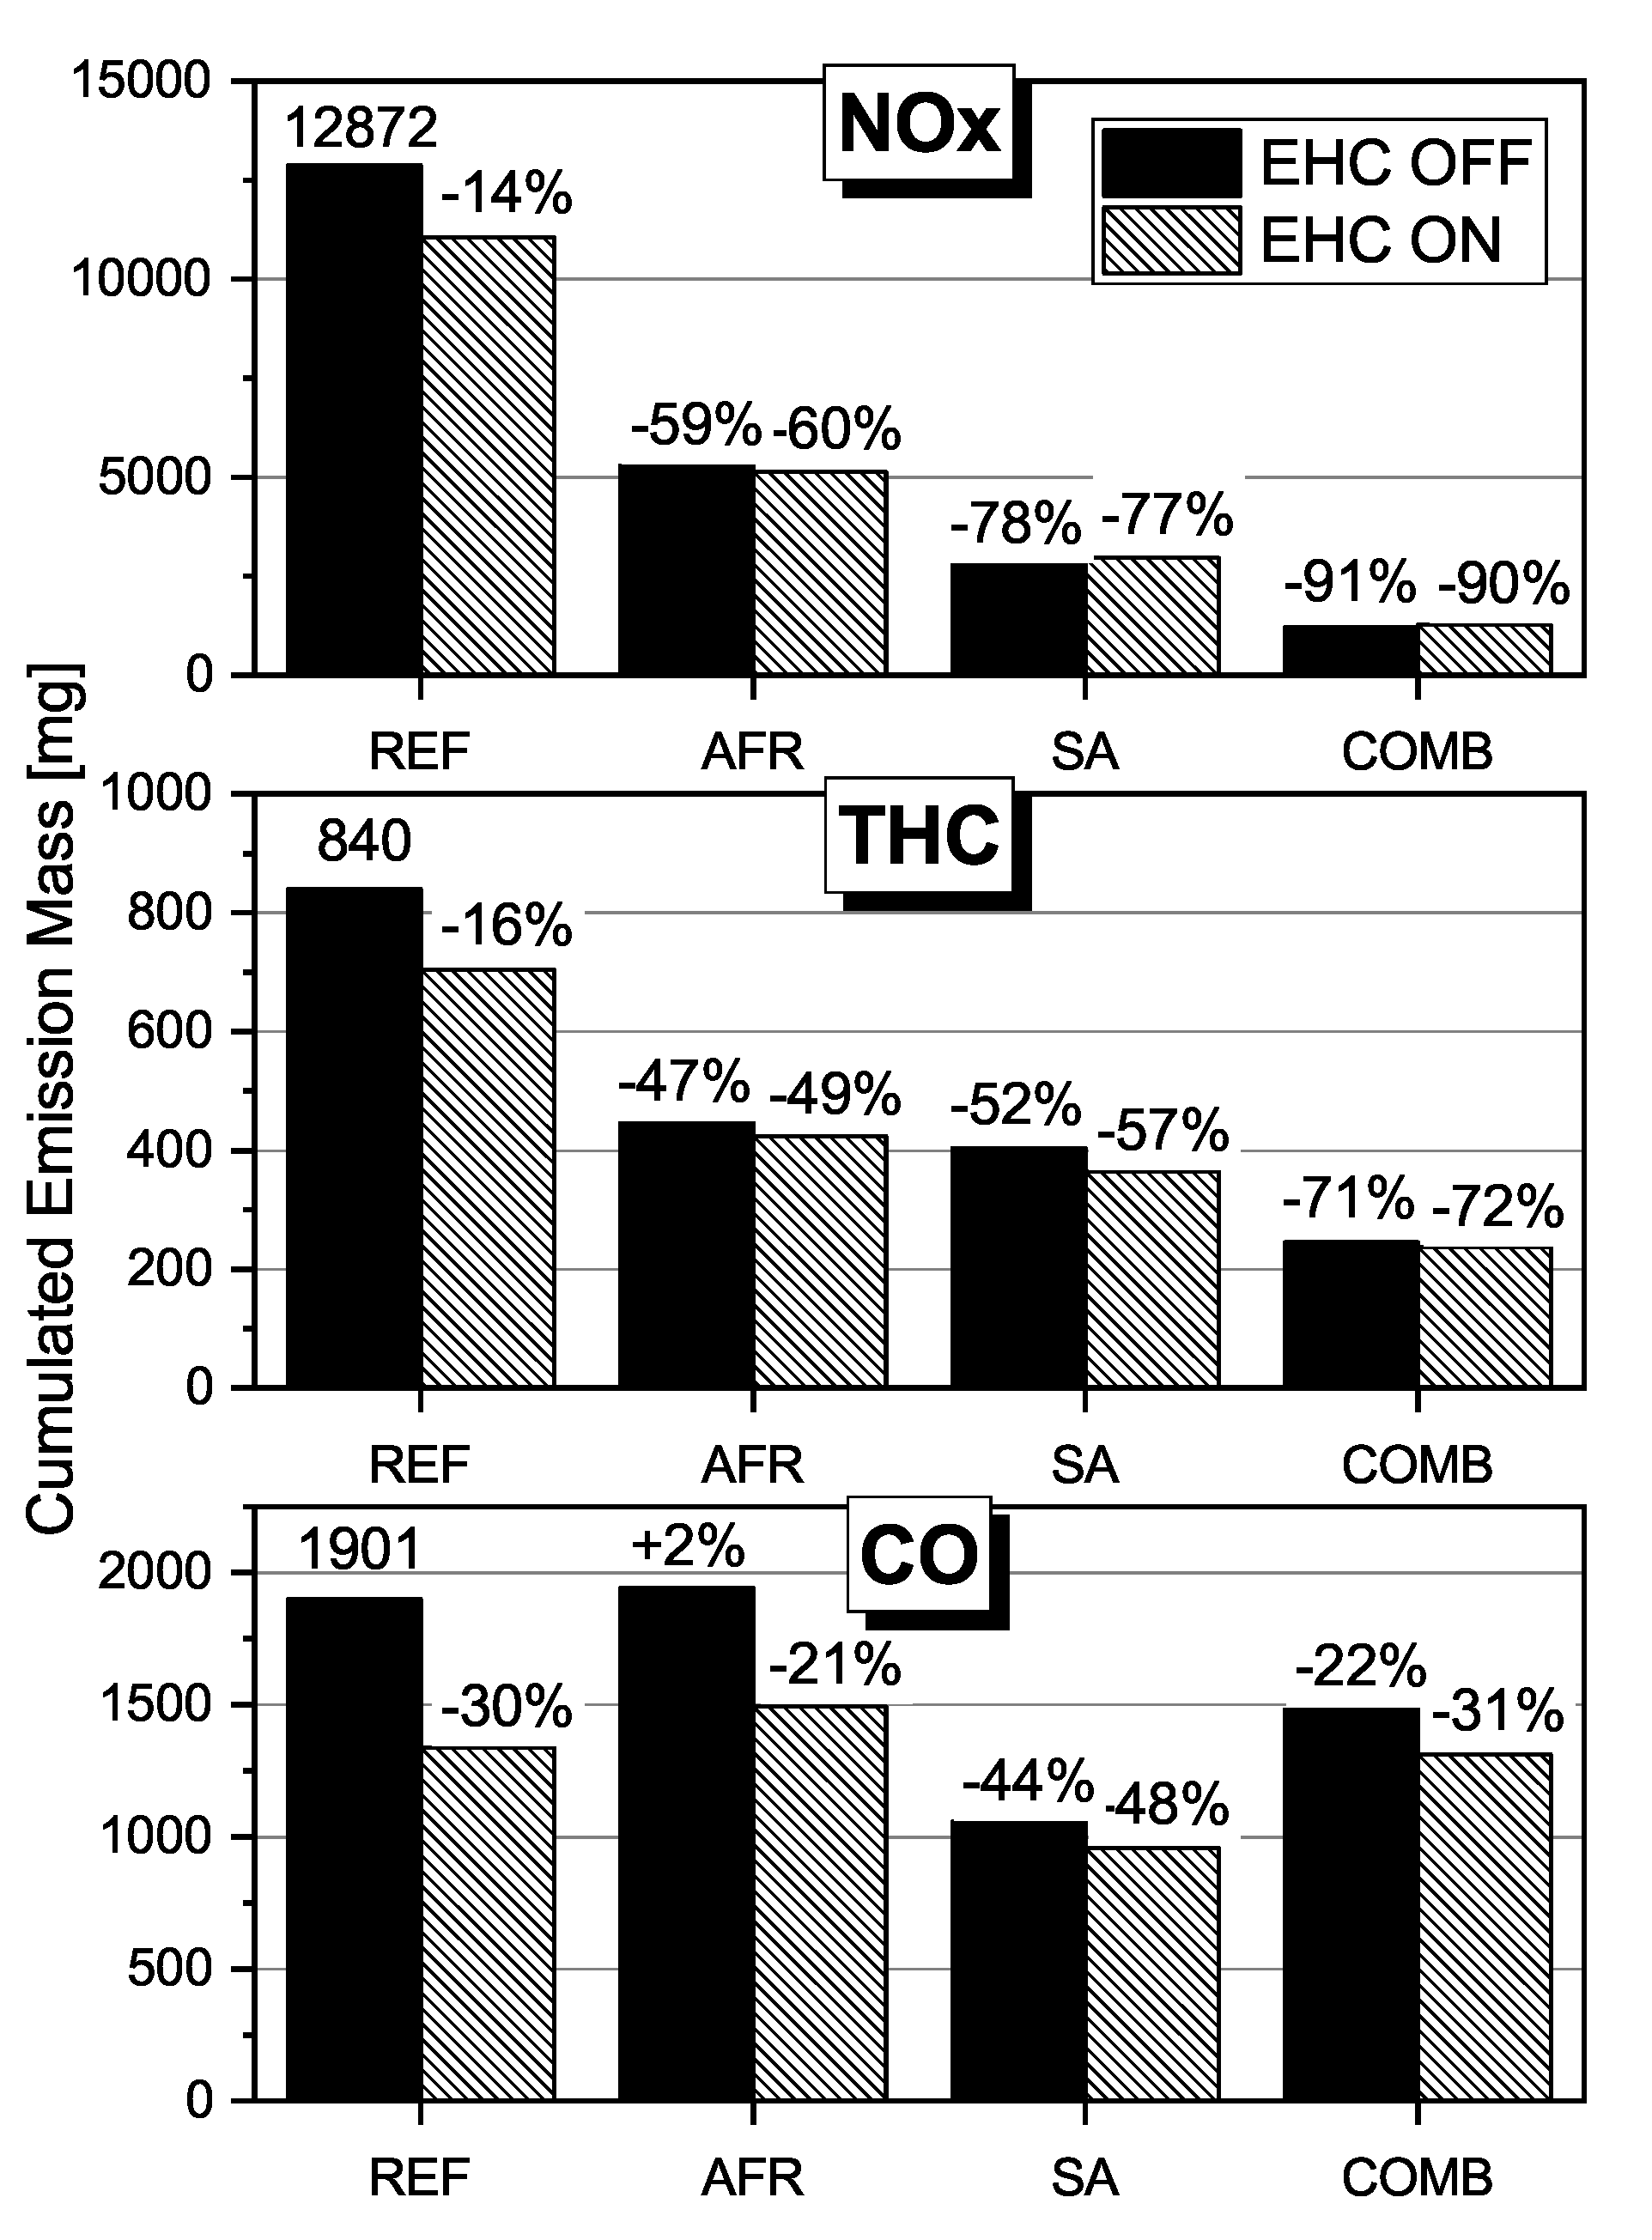
Figure 9 shows the accumulated emission masses M 60 for the entire cold-start procedure of a duration of 60 min . The relative reductions compared to the reference case are nearly identical to the results obtained until t l i m . This confirms that t l i m is a valid criterion for evaluating the effectiveness of a cold-start strategy. As before, the most substantial improvement (case COMB) is achieved in the reduction of the NOx emissions where a total of 91% less emission mass was released to the environment. This strategy also reduces the THC mass released by about 71%. Both the significant decrease in NOx mass produced and the reduction of THC emissions can be attributed (1) to lower raw emissions and a faster warm-up of the TWC (SA strategy) and (2) to the adaption of the exhaust gas composition to the state of the TWC and therefore a substantially lower t l i m (AFR strategy).
The electric power output is an important benchmark for comparing combined heat and power plants. Particularly in the mini and micro power classes, losses of several hundreds of W el in electrical power potentially create large differences in terms of electrical efficiency and subsequently the efficiency of the entire plant. The developed SA strategy and the EHC are two approaches that directly affect the electrical output power of the mCHP. The SA strategy leads to a loss in electrical power by about 6%, whereas enabling the EHC results in a reduced electrical power by about 9% for the time of activation. Figure 10 shows the calculated energy-specific pollutant masses. For the reference case with EHC, REFEHC, the increase in specific emissions due to EHC operation is only observable during the first 8 min . Once the EHC is disabled after approximately 10 min , the specific emissions of the case REFEHC are already lower than those of the case REF. As both produce about the same level of raw engine-out emissions, this reduction can be attributed to the faster warm-up of the catalyst due to EHC operation. In case of late spark timing, the peak value of the specific emissions of the case SA is 56% lower than in the reference case. As t l i m is also reduced drastically, the positive effect on the reduction of pollutant emissions due to late spark timing exceeds by far the drawback of the loss in electrical power.
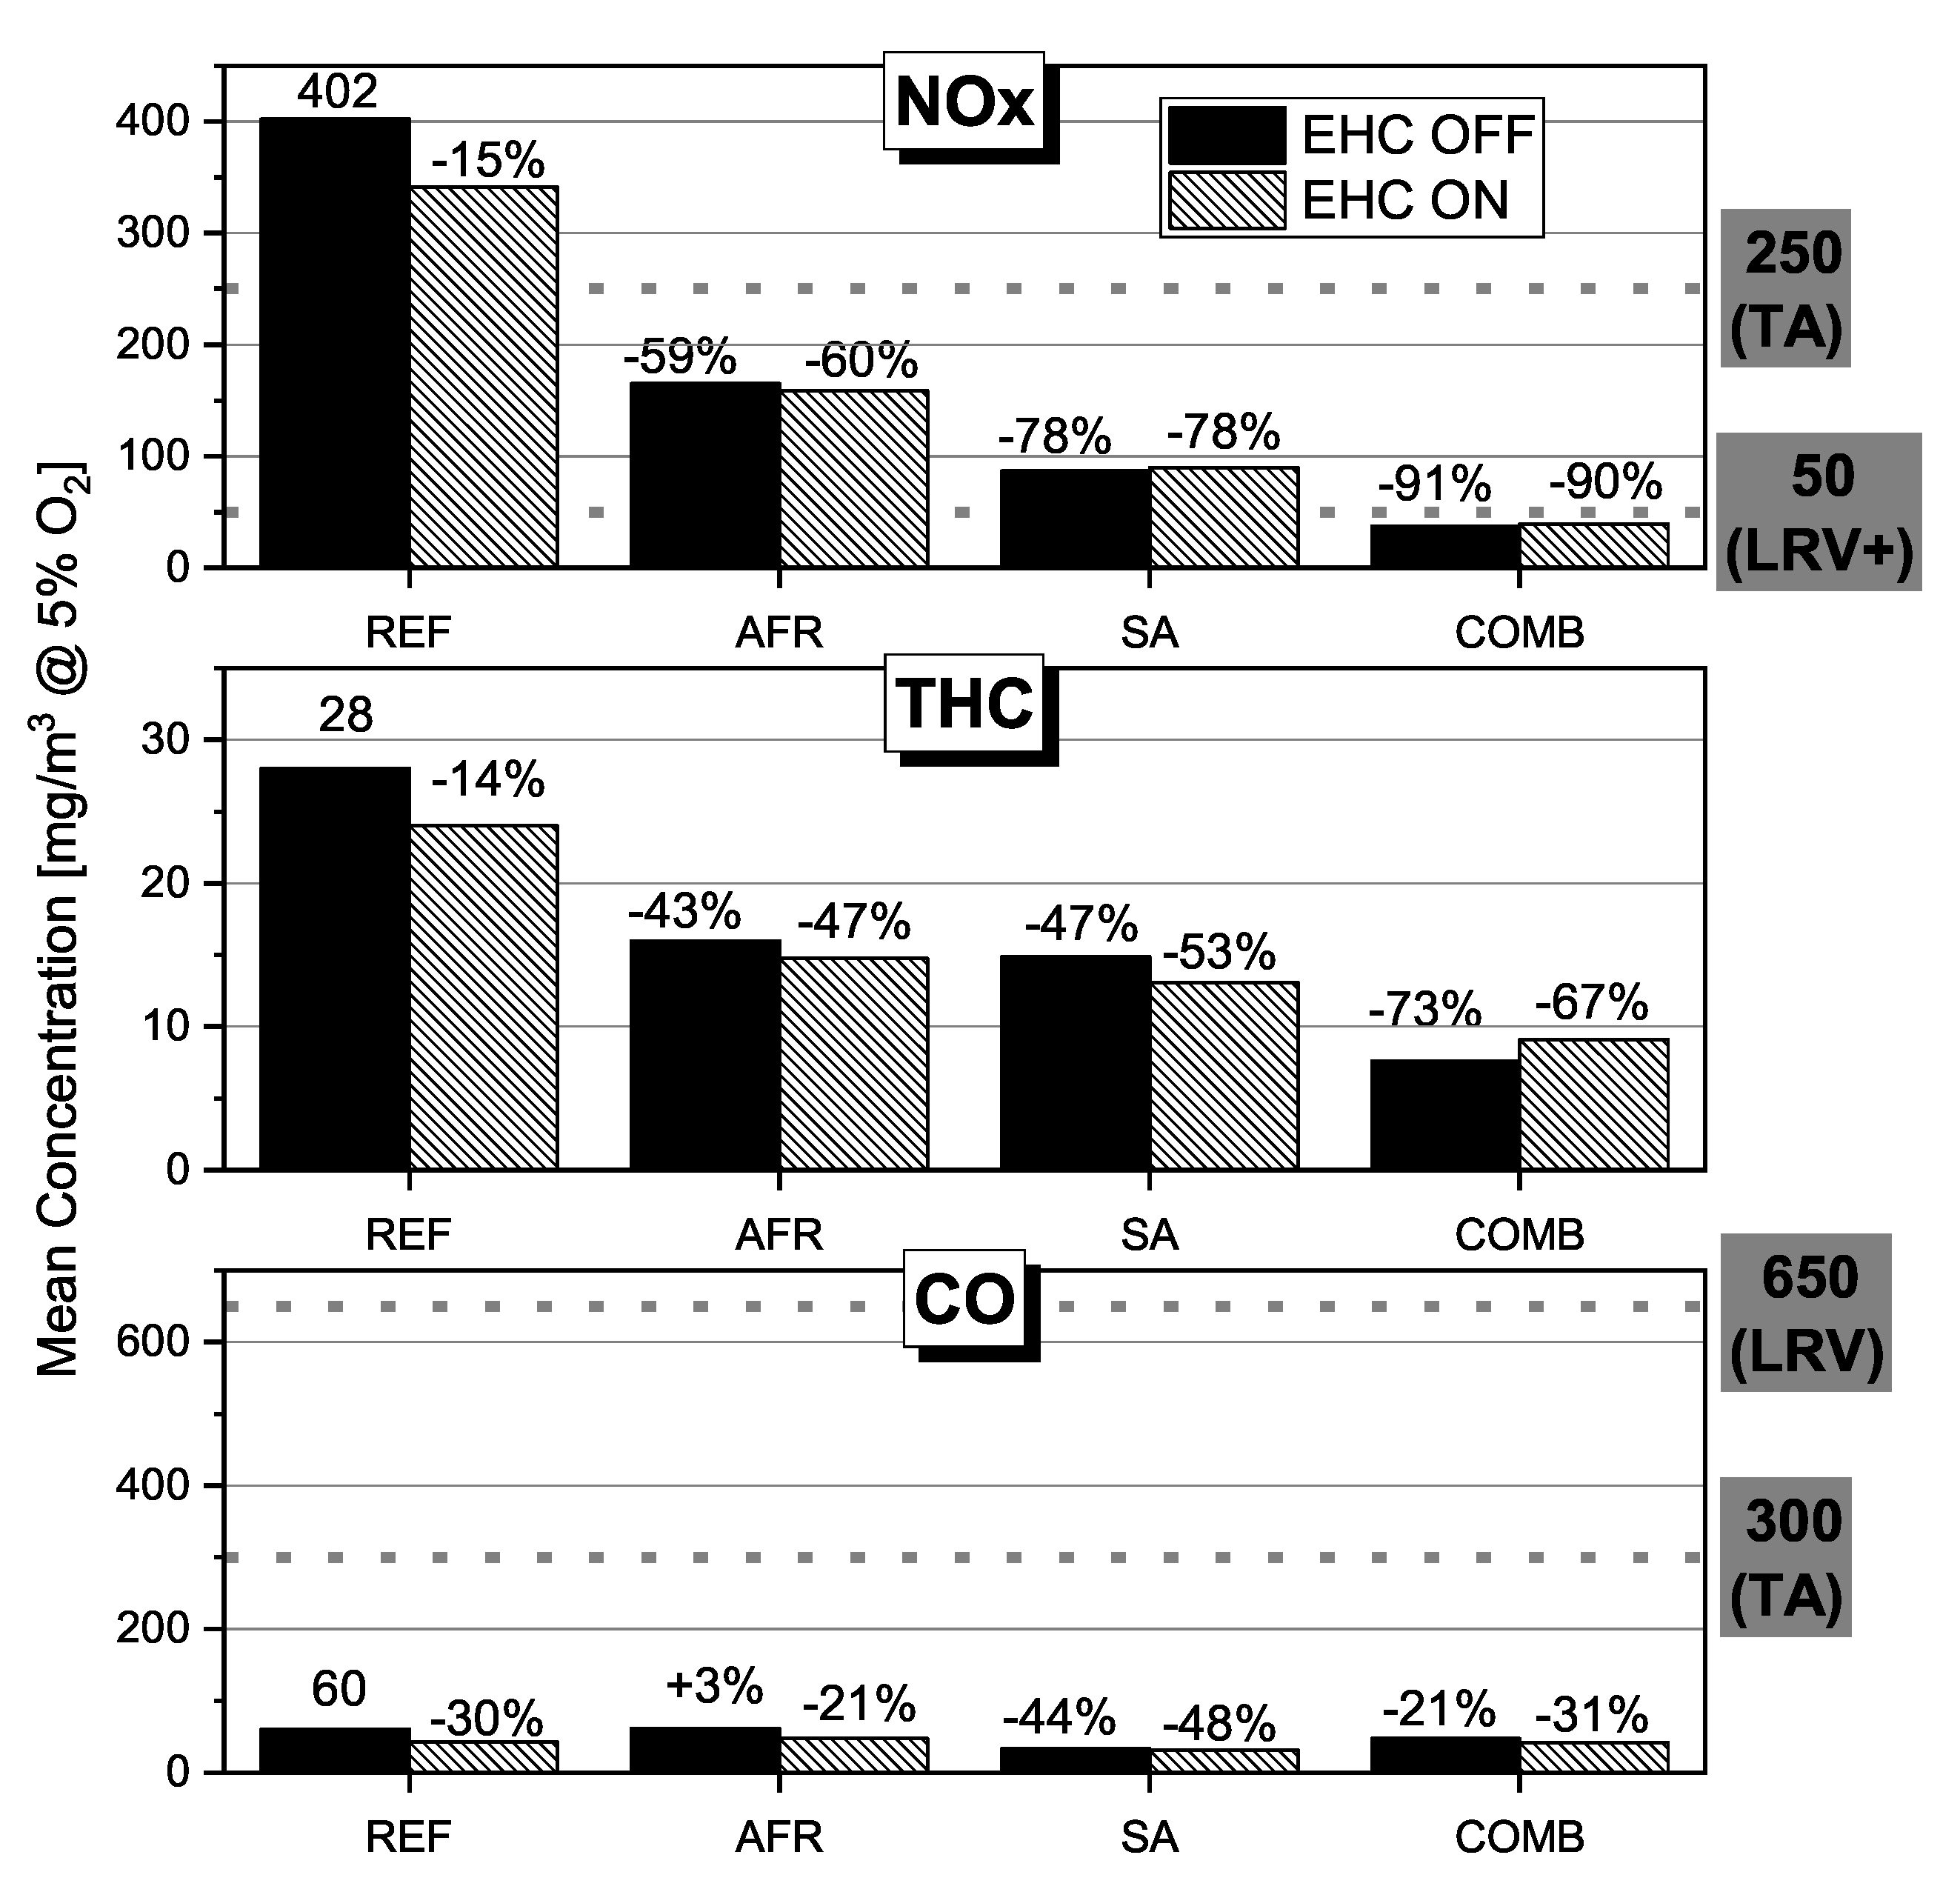
To place these results into context with the legal framework for pollutant emissions permitted, Figure 11 shows the mean emission concentrations for the entire cold-start procedure. Additionally, the legal limits in effect for Germany (TA [15]) and Switzerland (LRV [16]) are listed. These limits are defined for steady-state operation with a warm TWC. Furthermore, in the case of NOx emissions, the considerably stricter Swiss city limit of 50 mg/m 3 [38], denoted as LRV+, is specified instead of the limit that is set in the federal regulation (LRV). The CO concentrations are far below the regulatory limits for all cases. As of 2020, THC emissions are not regulated. However, as the best case (COMB) produces a mean concentration of just 8 mg/m 3 during the cold-start procedure and of about 3 mg/m 3 during steady-state operation, these emission levels are likely to meet future regulations. The most substantial reduction concerns the NOx emissions. This is reflected in Figure 11 in a reduction of about 91%. Therefore, with the most profitable case COMB, the mCHP investigated emits a mean NOx concentration during a cold-start procedure that falls below the strict limit LRV+ of 50 mg/m 3 that is effective for steady-state conditions.
For the system under consideration, the THC emissions produced are almost exclusively unburned methane (CH4), which is a greenhouse gas (GHG). A common method to evaluate the environmental impact of these GHG emissions is to convert the THC emissions, which in this context are presumed to be pure CH4 emissions, to CO2 equivalents and compare them to the unavoidable CO2 emissions resulting from the sheer combustion of fuel. For this comparison, a mean fuel mass flow of 0.48 g / s is assumed. Multiplied by a specific mass of CO2 of 2.75 k g CO2/ k g CH4 this results in a production rate of CO2 of 1.32 g / s . A second multiplication by the time period considered ( t l i m or 60 min) yields the CO2 mass due to fuel combustion. The equivalent CO2 mass is calculated with the cumulated THC-emission for the same two time periods, until t l i m and for the entire test procedure of 60 min, respectively (see Figure 8 and Figure 9). The CO2 equivalence factor used in this context is the global warming potential (GWP) of CH4 over 100 years (GWP = 34) [39]. Table 4 lists the calculated results with respect to the time period used. The equivalent CO2 mass from the CH4 emissions, i.e., THC emissions, amounts to a maximum of about 3.2 % (case AFR) and to a minimum of 1.7 % (case SAEHC) of the CO2 mass due to fuel combustion during the time period t l i m . However, as t l i m is different for each case (see Figure 8), it is more reasonable to compare the strategies with the uniform operating time of 60 min. For this time basis, the CO2 equivalent of the CH4 emissions constitutes from 0.6 % (case REF) down to 0.2 % (case COMB and COMBEHC). These shares are very low such that the global warming effect due to emission of a CO2 equivalent can be deemed negligible. Even when using the higher GWP of CH4 for a horizon of 20 years (GWP = 86) [39], the minimum and maximum values increase to just 8.1 % and 4.3 % for t l i m and 1.5 % and 0.5 % for t 60 , respectively. Therefore, the THC emissions due to cold-start operation do not significantly enlarge the environmental footprint of the mCHP under consideration. However, the strategies investigated contribute to reduce these emissions even further.
To summarize the system-level results of this study, we can state that a combination of the SA and AFR strategies bears great potential to reduce the pollutant emissions released during a cold-start. However, an application of an electrically heated catalyst cannot be recommended, because of a high price and relatively small benefit compared to both software-based control solutions. The SA strategy is found to be defined by system boundaries. In general, the spark advance should be as low as possible, i.e., the gas mixture should be ignited very late in the compression phase because our results show that the degree of emission reduction justifies the loss in mechanical power. However, the lower bound for the spark advance at engine start is defined by either knocking constraints or combustion instabilities which lead to misfires or even an unsuccessful engine start. As a late ignition generates very high exhaust gas temperatures, temperature constraints on the exhaust path material define the further course of the spark advance trajectory during the warm up process. We recommend to end the SA strategy as soon as the TWC reaches its steady-state operation temperature, i.e., set the ignition timing to MBT timing to maximize the power output of the CHP. The AFR strategy is flanked on one end by the optimal steady-state reference air/fuel ratio that generates the lowest steady-state pollutant emissions. The exact value has to be calibrated. On the other end the AFR strategy is defined by a reference air/fuel ratio setpoint at startup. This value leaves some flexibility depending on the application. In our study, we chose this value to generate a little higher CO emissions in favor of very low NOx emissions, as there are more stringent limits on nitrogen oxide emissions in most regulations. This guideline can be adapted to CHPs with a similar operation during startup and coasting modes which are characterized by pure air being pumped through the exhaust path such that the O2 storage of the TWC is filled to capacity. The results further show that the CO2 equivalence of the methane slip during a cold-start is negligible compared to the CO2 mass due to sheer combustion.

6. Conclusions

Concerning mini and micro combined heat and power plants, a shift to a more demand-driven, flexible operation is underway which increases the share of cold-start procedures. As CHPs with an internal combustion engine emit a very large fraction of the total pollutant emissions produced during the cold-start phase, these flexible operating schemes would significantly enlarge the environmental footprint. In this study, we developed strategies for the spark advance, the reference air/fuel ratio as well as an electrically heated catalyst and experimentally investigated their influence on the cold-start emissions of a micro combined heat and power plant. The results show that particularly the combination of a spark advance and a reference air/fuel ratio strategy bears great potential to reduce the pollutant emissions during the cold-start phase. In total, reductions by up to 91% compared to a reference case with optimal steady-state settings are achieved. For the tested mCHP, the mean pollutant emission levels during a cold-start fall even below the regulatory limits that apply for steady-state conditions. Although the determined boundary values are system specific, the proposed procedure to set up the strategies is generic for CHPs with an internal combustion engine as prime mover and a TWC as aftertreatment system. Additionally, the modular structure allows for selective deactivation of a strategy if necessary, e.g., when grid stabilization services that require a maximum electrical power output are requested, the SA strategy can be disabled. In sum, the proposed strategic approaches represent very effective and cost-efficient solutions that require much less calibration effort than model-based variants.

Author Contributions

Conceptualization, T.Z. and C.S.; methodology, T.Z. and C.S.; software, T.Z. and C.S.; validation, T.Z. and C.S.; formal analysis, T.Z. and C.S.; investigation, T.Z. and C.S.; resources, K.B. and C.O.; data curation, T.Z. and C.S.; writing—original draft preparation, T.Z.; writing—review and editing, T.Z., C.S., K.B. and C.O.; visualization, T.Z.; supervision, K.B. and C.O.; project administration, C.S., K.B. and C.O.; funding acquisition, K.B. and C.O. All authors have read and agreed to the published version of the manuscript.

Funding

This research was funded by the Swiss Federal Office of Energy (Grant Nos. SI/501278-01 and SI/501300-01).

Conflicts of Interest

The authors declare no conflict of interest.

Abbreviations

The following abbreviations are used in this manuscript:
AFRAir/Fuel Ratio
aTDCafter Top Dead Center
bTDCbefore Top Dead Center
CACrank Angle
CHPCombined Heat and Power
COCCenter of Combustion
DSDownstream
EHCElectrically Heated Catalyst
ICEInternal Combustion Engine
LRVLuftreinhalte-Verordnung
MBTMaximum Brake Torque
mCHPMicro Combined Heat and Power
SASpark Advance
SPSetpoint
SRSpark Retardation
SSSteady-state
TDCTop Dead Center
THCTotal Hydrocarbons
TWCThree Way Catalytic Converter
USUpstream

Appendix A

Table A1. Data of measurement systems.
SpeciesVendorTypeMeasurement PrincipleRangeAccuracy (2 σ )
Exhaust gas analysis  
NOxEco PhysicsCLD82Mhrk1Chemiluminescence Detection5000 ppm0.05‰ of range
HCABBAO 2000—MultiFID14Flame Ionization Detection5000 ppm 0.5 % of range
CO2ABBAO 2000—Uras26Non Dispersive Infrared Spectrometry16% 0.2 % of range
COlowABBAO 2000—Uras26Non Dispersive Infrared Spectrometry1000 ppm 0.2 % of range
COhighABBAO 2000—Uras26Non Dispersive Infrared Spectrometry10% 0.2 % of range
O2ABBAO 2000—Magnos206Paramagnetic Oxygen Sensor25%25 ppm
Fuel mass flow measurement
CH4BronkhorstEL-Flow SelectThermal Flow Metering1.2–60 ln/min (slm) 0.5 % of meas. value + 0.1 % of range

References

  1. Abolhosseini, S.; Heshmati, A.; Altmann, J. A Review of Renewable Energy Supply and Energy Efficiency Technologies; IZA Discussion Papers; Institute for the Study of Labor (IZA): Bonn, Germany, 2014; Volume 8145. [Google Scholar]
  2. Kroposki, B. Integrating high levels of variable renewable energy into electric power systems. J. Mod. Power Syst. Clean Energy 2017, 5, 831–837. [Google Scholar] [CrossRef] [Green Version]
  3. Kumbartzky, N.; Schacht, M.; Schulz, K.; Werners, B. Optimal operation of a CHP plant participating in the German electricity balancing and day-ahead spot market. Eur. J. Oper. Res. 2017, 261, 390–404. [Google Scholar] [CrossRef]
  4. Vögelin, P.; Georges, G.; Noembrini, F.; Koch, B.; Boulouchos, K.; Buffat, R.; Raubal, M.; Beccuti, G.; Demiray, T.; Panos, E.; et al. System Modelling for Assessing the Potential of Decentralised biomass-CHP Plants to Stabilise the Swiss Electricity Network with Increased Fluctuating Renewable Generation; Technical Report; Bundesamt für Energie: Bern, Switzerland, 2016. [Google Scholar]
  5. Vögelin, P.; Georges, G.; Boulouchos, K. Design analysis of gas engine combined heat and power plants (CHP) for building and industry heat demand under varying price structures. Energy 2017, 125, 356–366. [Google Scholar] [CrossRef]
  6. Domínguez-Muñoz, F.; Cejudo-López, J.M.; Carrillo-Andrés, A.; Gallardo-Salazar, M. Selection of typical demand days for CHP optimization. Energy Build. 2011, 43, 3036–3043. [Google Scholar] [CrossRef]
  7. Cho, H.; Luck, R.; Eksioglu, S.D.; Chamra, L.M. Cost-optimized real-time operation of CHP systems. Energy Build. 2009, 41, 445–451. [Google Scholar] [CrossRef]
  8. Levihn, F. CHP and heat pumps to balance renewable power production: Lessons from the district heating network in Stockholm. Energy 2017, 137, 670–678. [Google Scholar] [CrossRef]
  9. Barbieri, E.S.; Spina, P.R.; Venturini, M. Analysis of innovative micro-CHP systems to meet household energy demands. Appl. Energy 2012, 97, 723–733. [Google Scholar] [CrossRef]
  10. Reiter, M.S.; Kockelman, K.M. The problem of cold starts: A closer look at mobile source emissions levels. Transp. Res. Part D Transp. Environ. 2016, 43, 123–132. [Google Scholar] [CrossRef] [Green Version]
  11. Gao, J.; Tian, G.; Sorniotti, A.; Karci, A.E.; Palo, R.D. Review of thermal management of catalytic converters to decrease engine emissions during cold start and warm up. Appl. Therm. Eng. 2019, 147, 177–187. [Google Scholar] [CrossRef]
  12. Liu, Q.; Liu, J.; Fu, J.; Li, Y.; Luo, B.; Zhan, Z.; Deng, B. Comparative study on combustion and thermodynamics performance of gasoline direct injection (GDI) engine under cold start and warm-up NEDC. Energy Convers. Manag. 2019, 181, 663–673. [Google Scholar] [CrossRef]
  13. Zhu, G.; Liu, J.; Fu, J.; Xu, Z.; Guo, Q.; Zhao, H. Experimental study on combustion and emission characteristics of turbocharged gasoline direct injection (GDI) engine under cold start new European driving cycle (NEDC). Fuel 2018, 215, 272–284. [Google Scholar] [CrossRef]
  14. Dardiotis, C.; Martini, G.; Marotta, A.; Manfredi, U. Low-temperature cold-start gaseous emissions of late technology passenger cars. Appl. Energy 2013, 111, 468–478. [Google Scholar] [CrossRef]
  15. German Federal Ministry for the Environment. Erste Allgemeine Verwaltungsvorschrift zum Bundes– Immissionsschutzgesetz—Technische Anleitung zur Reinhaltung der Luft [Online]. 2002. Available online: http://m.bmu.de/fileadmin/Daten_BMU/Download_PDF/Luft/taluft_engl.pdf (accessed on 10 October 2019).
  16. The Swiss Federal Council. Ordinance on Air Pollution Control (OAPC) [Online]. 1985. Available online: https://www.admin.ch/opc/en/classified-compilation/19850321/index.html (accessed on 17 March 2019).
  17. Hedinger, R.; Elbert, P.; Onder, C. Optimal cold-start control of a gasoline engine. Energies 2017, 10, 1548. [Google Scholar] [CrossRef] [Green Version]
  18. Guerra, R.F.; Gallo, W.L.R. Ignition Timing as a Strategy to Reduce Spark-Ignition Engine Emissions in the Cold Phase. In Proceedings of the SAE International, 22nd SAE Brasil International Congress and Display, São Paulo, Brasil, 7–9 October 2013. [Google Scholar]
  19. Nakayama, Y.; Maruya, T.; Oikawa, T.; Fujiwara, M.; Kawamata, M. Reduction of Emission from VTEC Engine During Cold-Start Condition. SAE Trans. 1994, 103, 737–746. [Google Scholar]
  20. Leisenring, K.; Samimy, B.; Rizzoni, G. IC Engine Air/Fuel Ratio Feedback Control During Cold Start. SAE Trans. 1996, 105, 427–437. [Google Scholar]
  21. Lee, D.; Heywood, J.B. Effects of Charge Motion Control During Cold Start of SI Engines. In Powertrain & Fluid Systems Conference and Exhibition; SAE International: Warrendale, PA, USA, 2006. [Google Scholar]
  22. Cedrone, K.; Cheng, W. Using Valve Timing and Exhaust Back Pressure to Improve Catalyst Warm-Up Time; SAE Technical Paper; SAE International: Warrendale, PA, USA, 2013; Volume 11. [Google Scholar]
  23. Bhaskar, K.; Govindan, N.; Sampath, S. Experimental Investigation On Cold Start Emissions Using Electrically Heated Catalyst In A Spark Ignition Engine. Int. J. Autom. Mech. Eng. 2010, 2, 105–118. [Google Scholar] [CrossRef]
  24. Lee, D.; Heywood, J.B. Effects of Secondary Air Injection During Cold Start of SI Engines. SAE Int. J. Eng. 2010, 3, 182–196. [Google Scholar] [CrossRef] [Green Version]
  25. Peng, H.; Cui, Y.; Shi, L.; Deng, K. Effects of exhaust gas recirculation (EGR) on combustion and emissions during cold start of direct injection (DI) diesel engine. Energy 2008, 33, 471–479. [Google Scholar] [CrossRef]
  26. Korin, E.; Reshef, R.; Tshernichovesky, D.; Sher, E. Reducing cold-start emission from internal combustion engines by means of a catalytic converter embedded in a phase-change material. Proc. Inst. Mech. Eng. Part D J. Autom. Eng. 1999, 213, 575–583. [Google Scholar] [CrossRef]
  27. Guzzella, L.; Onder, C. Introduction to Modeling and Control of Internal Combustion Engine Systems; Springer Science & Business Media: Berlin, Germany, 2010. [Google Scholar]
  28. Shivaprasad, K.V.; Chitragar, P.R.; Nayak, V.; Kumar, G.N. Influence of spark timing on the performance and emission characteristics of gasoline–hydrogen-blended high-speed spark-ignition engine. Int. J. Ambient Energy 2017, 38, 605–612. [Google Scholar] [CrossRef]
  29. Lawankar, S.M.; Dhamande, D.L.P.; Khandare, D.S.S. Experimental study of effect of ignition timing and compression ratio on NOx emission of LPG fuelled engine. Int. J. Sci. Eng. Res. 2012, 3. [Google Scholar]
  30. Awad, O.I.; Ali, O.M.; Mamat, R.; Abdullah, A.A.; Najafi, G.; Kamarulzaman, M.K.; Yusri, I.M.; Noor, M.M. Using fusel oil as a blend in gasoline to improve SI engine efficiencies: A comprehensive review. Renew. Sustain. Energy Rev. 2017, 69, 1232–1242. [Google Scholar] [CrossRef] [Green Version]
  31. Ebrahimi, B.; Tafreshi, R.; Masudi, H.; Franchek, M.; Mohammadpour, J.; Grigoriadis, K. A Systematic Air-fuel Ratio Control Strategy for Lean-burn SI Engines. IFAC Proc. Vol. 2012, 45, 296–301. [Google Scholar] [CrossRef]
  32. Tomforde, M.; Drewelow, W.; Schultalbers, M. Air-fuel ratio control with respect to oxygen storage dynamics. In Proceedings of the 16th International Conference on Methods & Models in Automation & Robotics, Miedzyzdroje, Poland, 22–25 August 2011; pp. 242–247. [Google Scholar]
  33. Lauber, J.; Guerra, T.; Dambrine, M. Air-fuel ratio control in a gasoline engine. Int. J. Syst. Sci. 2011, 42, 277–286. [Google Scholar] [CrossRef]
  34. Pfalzgraf, B.; Otto, E.; Wirth, A.; Küper, P.F.; Held, W.; Donnerstag, A. The System Development of Electrically Heated Catalyst EHC for the LEV and EU-III Legislation. SAE Trans. 1995, 104, 777–787. [Google Scholar]
  35. Kubsh, J.E.; Brunson, G.W. EHC Design Options and Performance; SAE Technical Paper; SAE International: Warrendale, PA, USA, 1996. [Google Scholar]
  36. Kim, C.H.; Paratore, M.; Gonze, E.; Solbrig, C.; Smith, S. Electrically Heated Catalysts for Cold-Start Emissions in Diesel Aftertreatment; SAE Technical Paper; SAE International: Warrendale, PA, USA, 2012. [Google Scholar]
  37. Ning, J.; Yan, F. Temperature Control of Electrically Heated Catalyst for Cold-start Emission Improvement. IFAC Papers OnLine 2016, 49, 14–19. [Google Scholar] [CrossRef]
  38. Stadtrat der Stadt Zürich. Reglement zum Massnahmenplan Luftreinhaltung 2011 der Stadt Zürich [Online]. 2011. Available online: https://www.stadt-zuerich.ch/portal/de/index/politik_u_recht/stadtrat/geschaefte-des-stadtrates/stadtratsbeschluesse/2011/Dez/StZH_StRB_2011_1588.html (accessed on 13 August 2019).
  39. Myhre, G.; Shindell, D.; Breon, F.M.; Collins, W.; Fuglestvedt, J.; Huang, J.; Koch, D.; Lamarque, J.F.; Lee, D.; Mendoza, B.; et al. Anthropogenic and natural radiative forcing. In Climate Change 2013: The Physical Science Basis. Contribution of Working Group I to the Fifth Assessment Report of the Intergovernmental Panel on Climate Change; Cambridge University Press: Cambridge, UK, 2013; pp. 659–740. [Google Scholar]
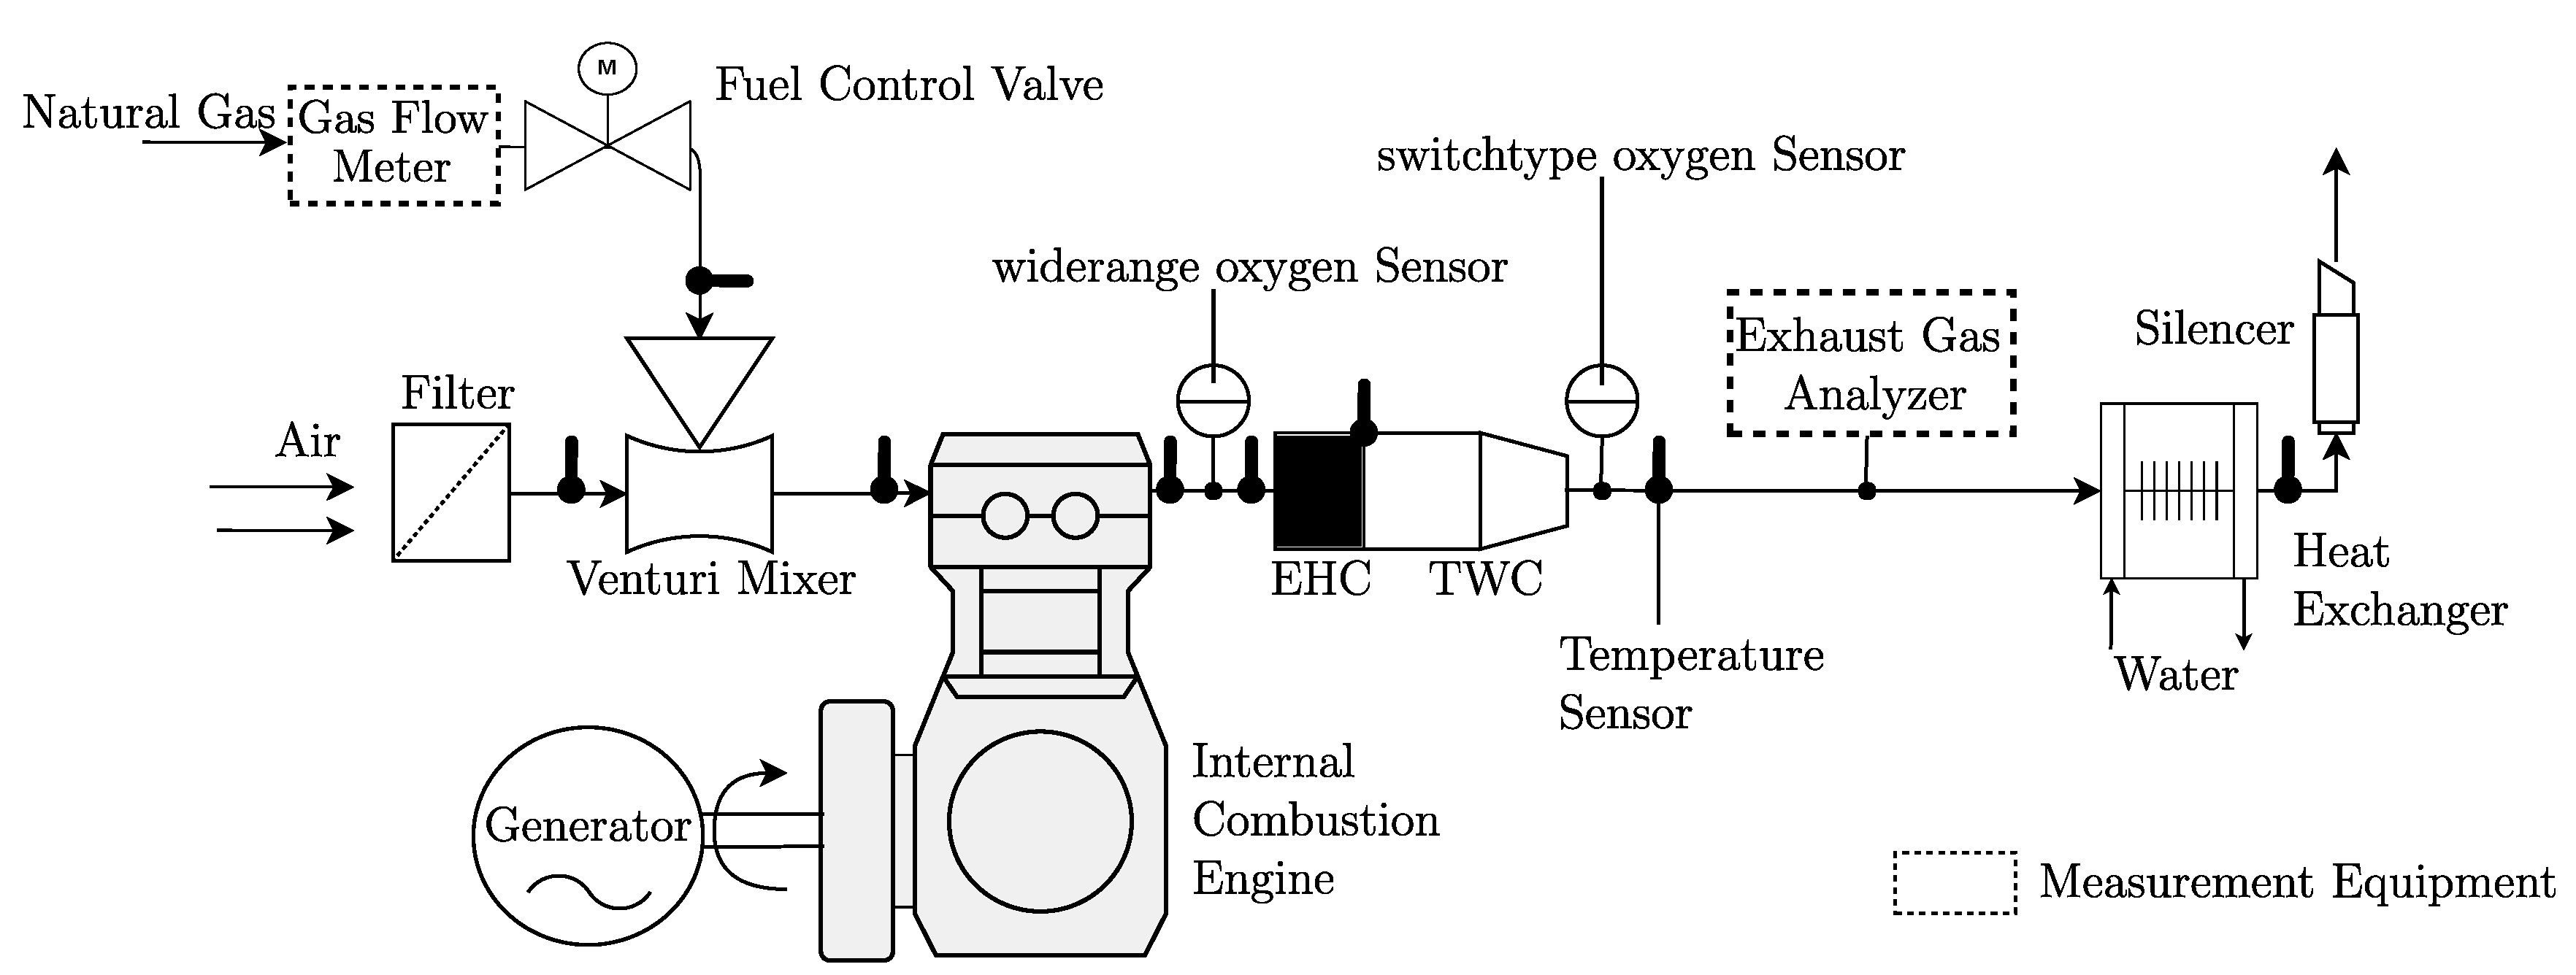
Figure 1. Schematic representation of the airpath; data of measurement equipment in Table A1 of Appendix A.
Energies 13 01862 g001
Figure 2. Raw pollutant emissions, electrical power and fuel consumption as a function of the spark advance (equivalence air/fuel ratio λ = 1 ).
Energies 13 01862 g002
Figure 3. Center of combustion and maximum cylinder pressure as a function of the spark advance.
Energies 13 01862 g003
Figure 4. Cascaded air/fuel ratio control.
Energies 13 01862 g004
Figure 5. Downstream emission concentrations with respect to time for the reference case ( λ U S _ S P = λ U S _ S S ).
Energies 13 01862 g005
Figure 6. Trajectory for λ U S _ S P based on the temperature of the TWC ϑ T W C .
Energies 13 01862 g006
Figure 7. Pollutant concentration with respect to time for first 15 min of a cold-start procedure.
Energies 13 01862 g007
Figure 8. The variable t l i m denotes the time until the emission concentration falls below 50 mg/m 3 (NOx and CO) and 10 mg/m 3 (THC), while M t l i m represents the accumulated mass during t l i m . The ratio M t l i m M 60 represents the share of M t l i m in the total emission mass produced during 60 min .
Energies 13 01862 g008
Figure 9. Cumulated emissions with respect to reference case for entire cold-start procedure.
Energies 13 01862 g009
Figure 10. Specific emission masses with respect to the electrical energy generated.
Energies 13 01862 g010
Figure 11. Mean emission concentrations with respect to reference case and legislation limits for the entire cold-start procedure.
Energies 13 01862 g011
Table 1. Mean engine raw emissions as a function of the spark advance for first 30 s after start of ignition.
ConcentrationSpark Advance [CA bTDC]
8101215
NOx [ppm]72583110511371
THC [ppm]122150205280
CO [ppm]2369234222742290
Table 2. Criteria for EHC application.
ϑ EHCds [ C] ϑ EHCus [ C]
EHC ON<600<700
EHC OFFotherwiseotherwise
Table 3. Case overview
Strategy
CaseSAAFREHC
REF
REFEHC
SA
SAEHC
AFR
AFREHC
COMB
COMBEHC
Table 4. Comparison of equivalent CO2 emissions to unavoidable CO2 emissions due to combustion for two separate time periods (GWP = 34).
Case t lim t 60
MCH4 [g]MCO2eq [kg]MCO2 [kg] M CO 2 eq M CO 2 [ % ] MCH4 [g]MCO2eq [kg]MCO2 [kg] M CO 2 eq M CO 2 [ % ]
REF0.80.02720.992.7 0.80.02724.750.6
REFEHC0.70.02380.862.8 0.70.02384.750.5
AFR0.40.01360.433.2 0.40.01364.750.3
AFREHC0.40.01360.433.2 0.40.01364.750.3
SA0.40.01360.612.2 0.40.01364.750.3
SAEHC0.30.01020.611.7 0.40.01364.750.3
COMB0.20.00680.272.5 0.20.00684.750.2
COMBEHC0.20.00680.272.5 0.20.00684.750.2