Article

Neutral Current Reduction in Three-Phase Four-Wire Distribution Feeders by Optimal Phase Arrangement Based on a Full-Scale Net Load Model Derived from the FTU Data

1
The Institute of Nuclear Energy Research, Taoyuan 325, Taiwan
2
Department of Industrial Education and Technology, National Changhua University of Education, Changhua 500, Taiwan
*
Authors to whom correspondence should be addressed.
Energies 2020, 13(7), 1844; https://doi.org/10.3390/en13071844
Submission received: 5 March 2020 / Revised: 29 March 2020 / Accepted: 8 April 2020 / Published: 10 April 2020

Abstract

:
An increase in the neutral current results in a malfunction of the low energy over current (LCO) protective relay and raises the neutral-to-ground voltage in three-phase, four-wire radial distribution feeders. Thus, the key point for mitigating its effect is to keep the current under a specific level. The most common approach for reducing the neutral current caused by the inherent imbalance of distribution feeders is to rearrange the phase connection between the distribution transformers and the load tapped-off points by using the metaheuristics algorithms. However, the primary task is to obtain the effective load data for phase rearrangement; otherwise, the outcomes would not be worthy of practical application. In this paper, the effective load data can be received from the feeder terminal unit (FTU) installed along the feeder of Taipower. The net load data consisting of customers’ power consumption and the power generation of distributed energy resources (DERs) were measured and transmitted to the feeder dispatch control center (FDCC). This paper proposes a method of establishing the equivalent full-scale net load model based on FTU data format, and the long short-term memory (LSTM) was adopted for monthly load forecasting. Furthermore, the full-scale net load model was built by the monthly per hour load data. Next, the particle swarm optimization (PSO) algorithm was applied to rearrange the phase connection of the distribution transformers with the aim of minimizing the neutral current. The outcomes of this paper are helpful for the optimal setting of the limit current of the LCO relay and to avoid its malfunction. Furthermore, the proposed method can also improve the three-phase imbalance of distribution feeders, thus reducing extra power loss and increasing the operating efficiency of three-phase induction motors.

1. Introduction

The three-phase, four-wire radial type primary feeders are widely used in Taiwan and other countries to supply single- and three-phase loads simultaneously, and this is one of the significant causes of load imbalance between three phases. Therefore primary feeders often have unbalanced systems wherein the greater the system imbalance, the poorer the power quality produced. For example, the voltage unbalance leads to zero- and negative-phase sequence voltages which, in turn, can reduce the torque output of three-phase induction motors and increase extra power loss [1,2,3]. The zero-sequence current flow into the neutral wire will not only cause the unexpected trip of the LCO protective relay or zero-sequence relay [4,5,6], but also increase the neutral-to-ground voltage and interfere with the communication system.
For the past few decades, the common method used for reducing the neutral current in passive distribution networks and improving the three-phase unbalance is by rephasing via artificial intelligence (AI) algorithms and expert systems. Tu and Tsai [7] proposed an improved bacterial foraging algorithm (IBFO) to solve the optimal phase combination problem with the aim of minimizing the line loss within 24 intervals. Meanwhile, Chen and Cherng [8] used the genetic algorithm (GA) to find the optimal phase arrangement of distribution transformers connected to a primary feeder in order to improve system unbalance and reduce power loss. Huang et al. [9] proposed the immune algorithm (IA) for phase balancing, and its objective function was formulated by unbalanced phase current, customer service interruption cost, and labor cost. To improve system unbalance, Hooshmand and Soltani [10] presented the bacterial foraging (BF) oriented by particle swarm optimization (PSO) algorithm (BF-PSO) for phase rearrangement in radial and meshed distribution networks. Arias [11] used a hybrid method to load balancing in a three-phase distribution system by integer linear programming and Branch and Bound algorithm, and the outcomes demonstrated that it could decrease unbalance by more than 10%. Lin et al. [12] proposed the heuristic rules adopted by distribution engineers in the expert system for solving the rephasing problem of laterals and distribution systems.
These aforementioned studies did not investigate the impact of the penetration of distributed energy resources (DERs) for phase rearrangement on the passive distribution networks. The high penetration of DERs in passive distribution networks results in active networks and more complex planning and operation of active distribution networks. Among the factors affecting system imbalance, the increase in the neutral current affects not only the network topologies, unbalance transformer structures, three-phase capacitor banks, load characteristics, and load transfer, but also the installed capacity, historical power generation, and type of DERs. Therefore, the DERs have been considered in phase rearrangement studies in recent years. For example, Soltani et al. [13] modeled the hourly wind power and load in the scenario-based method, and used the fuzzy multi-objective phase balancing based on the θ -modified bat algorithm to solve the rephasing problem. Peng et al. [14] proposed a new multi-objective molecular differential evolution algorithm for phasing balancing in a distribution network with distributed generations. A loop power controller was adopted in another study for complex power control that would allow the incorporation of photovoltaic power generation in the feeder load balancing [15]. These studies prominently investigated the optimal phase arrangement problem of incorporating the load and DERs simultaneously. The outcomes of the optimal phase arrangement scheme could not consider just a single point time solution due to the time variance of loads and DERs.
Consequently, regardless of whether there are more effective AI algorithms adopted for solving the optimal phase arrangement problems, the key for practical application is the correct and effective load; otherwise, these findings from past studies will only be applicable for operation reference. The rephasing work of power companies is dependent on the regular investigation of the neutral current record log from distribution dispatch and control center (DDCC), which is fetched by FTU, or after the network reconfiguration has been performed [16]. Although most of the phase rearrangement studies are focused on the efficiency and performance of their proposed solution algorithms, they actually lack detailed explanations of the actual considerations on how often the rephasing work should be done and the duration of load data.
In this paper, a full-scale load model of the FTU-derived data is proposed for reducing the neutral current by optimal phase arrangement according to the monthly regular rephasing work of Taipower distribution networks. The rest of the paper is divided into four sections. Section 1 introduces the background and objectives of this study. Section 2 describes the proposed approach for reducing the neutral current by optimal phase arrangement. Section 3 discusses the simulation results. Section 4 presents our conclusions.

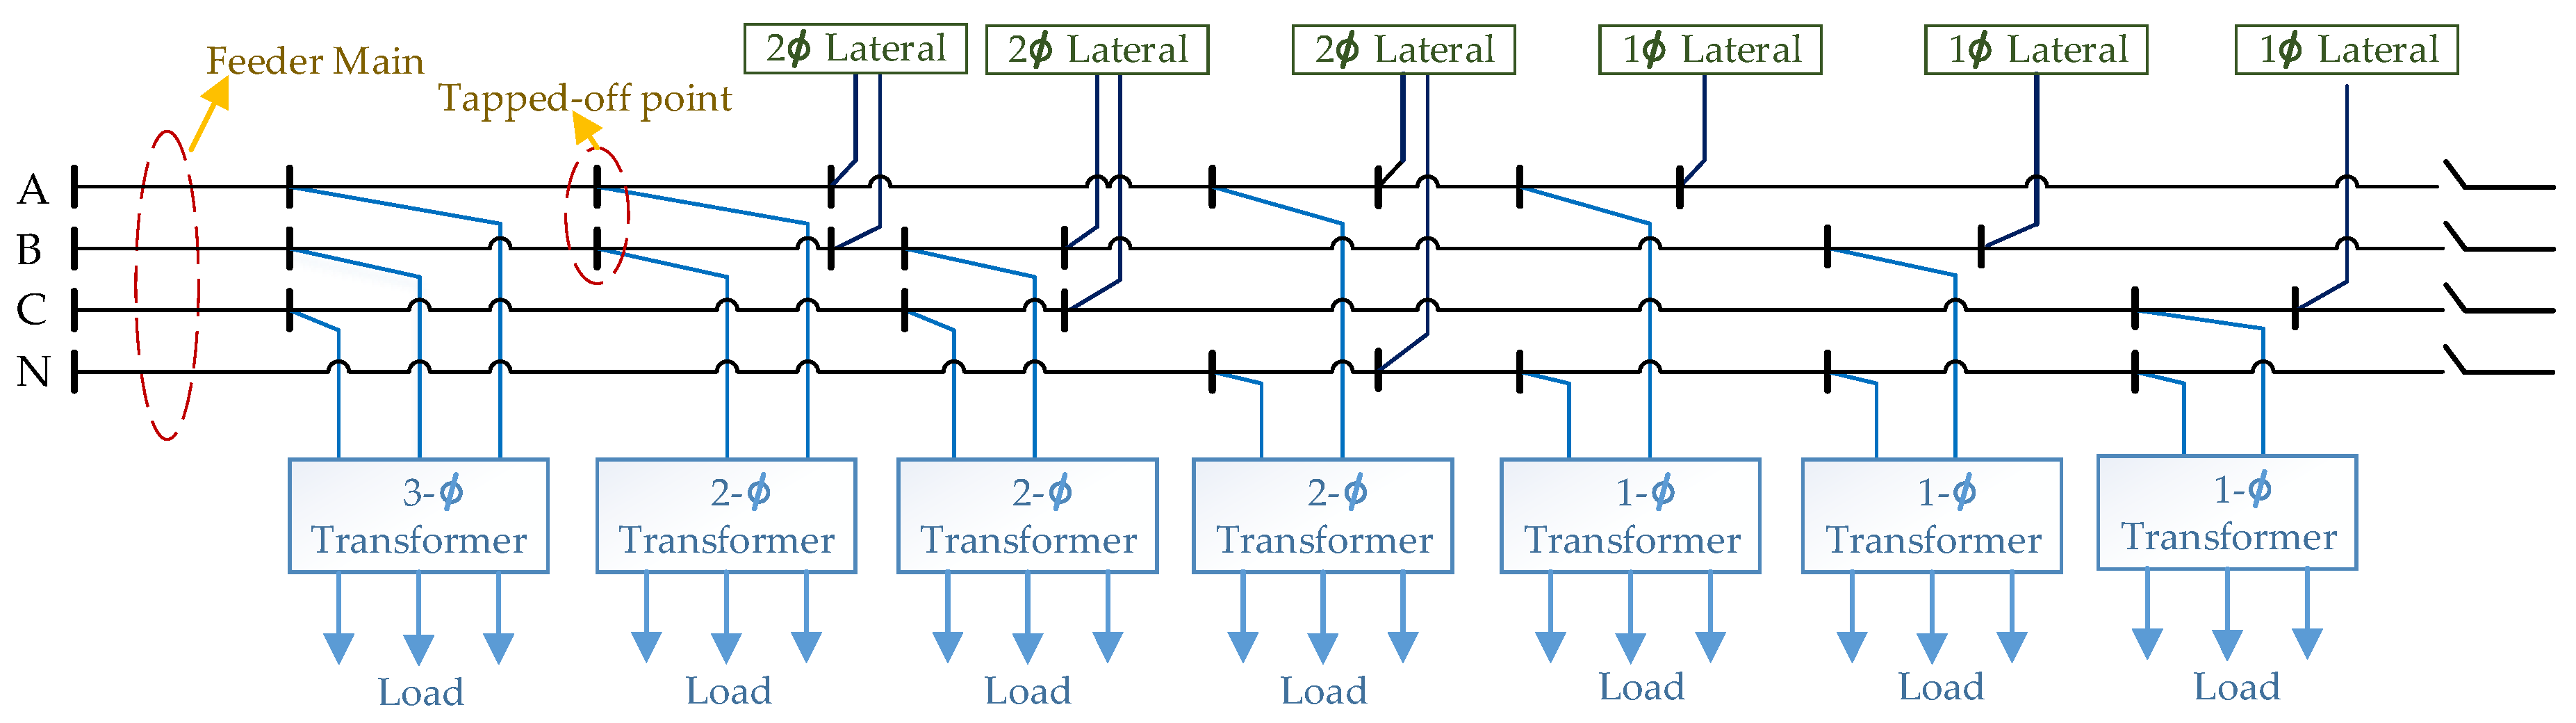
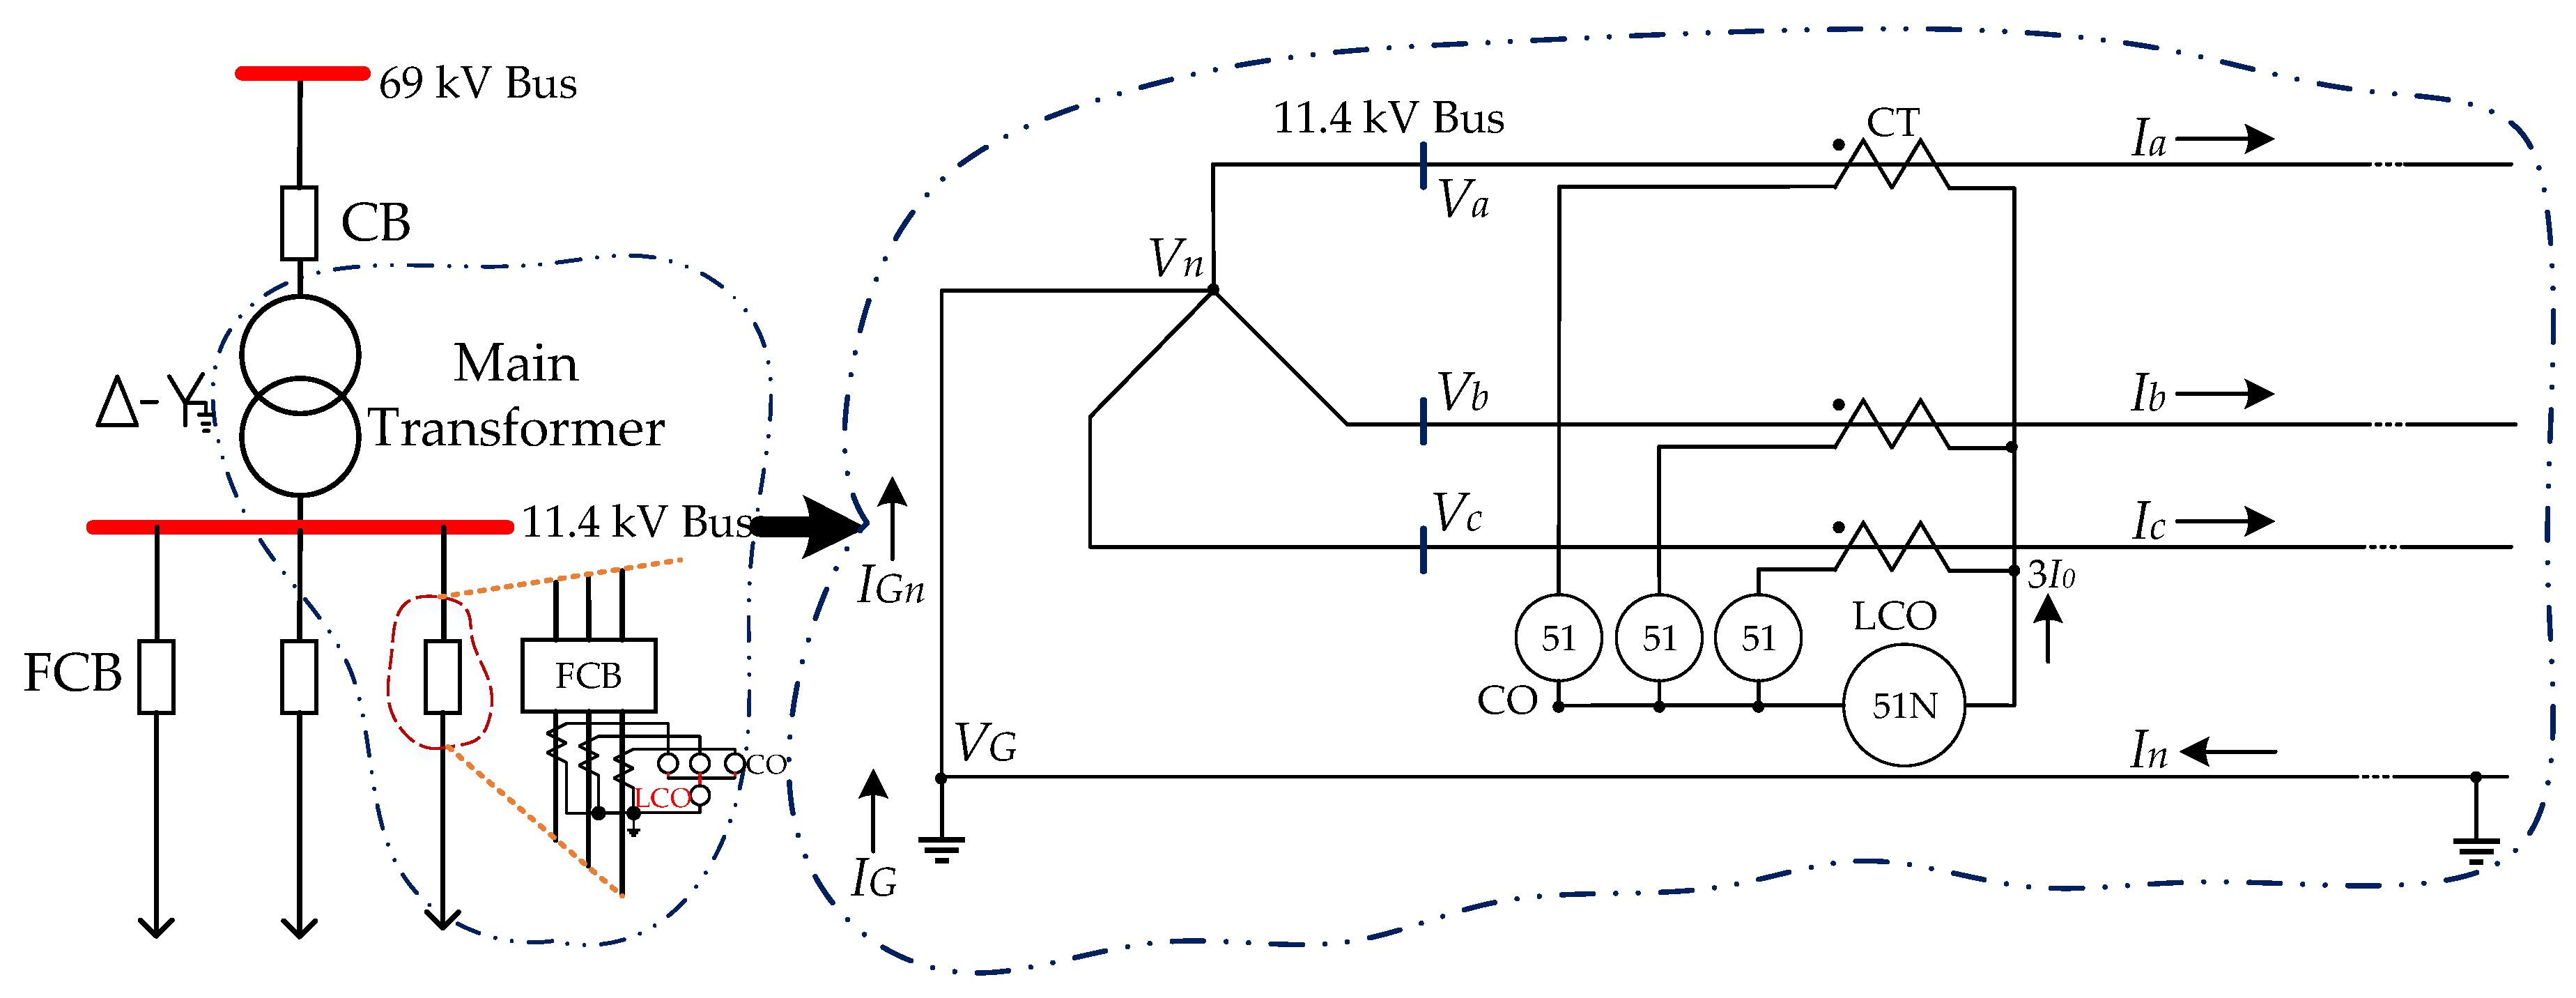
2. Problem Description and the Proposed Approach

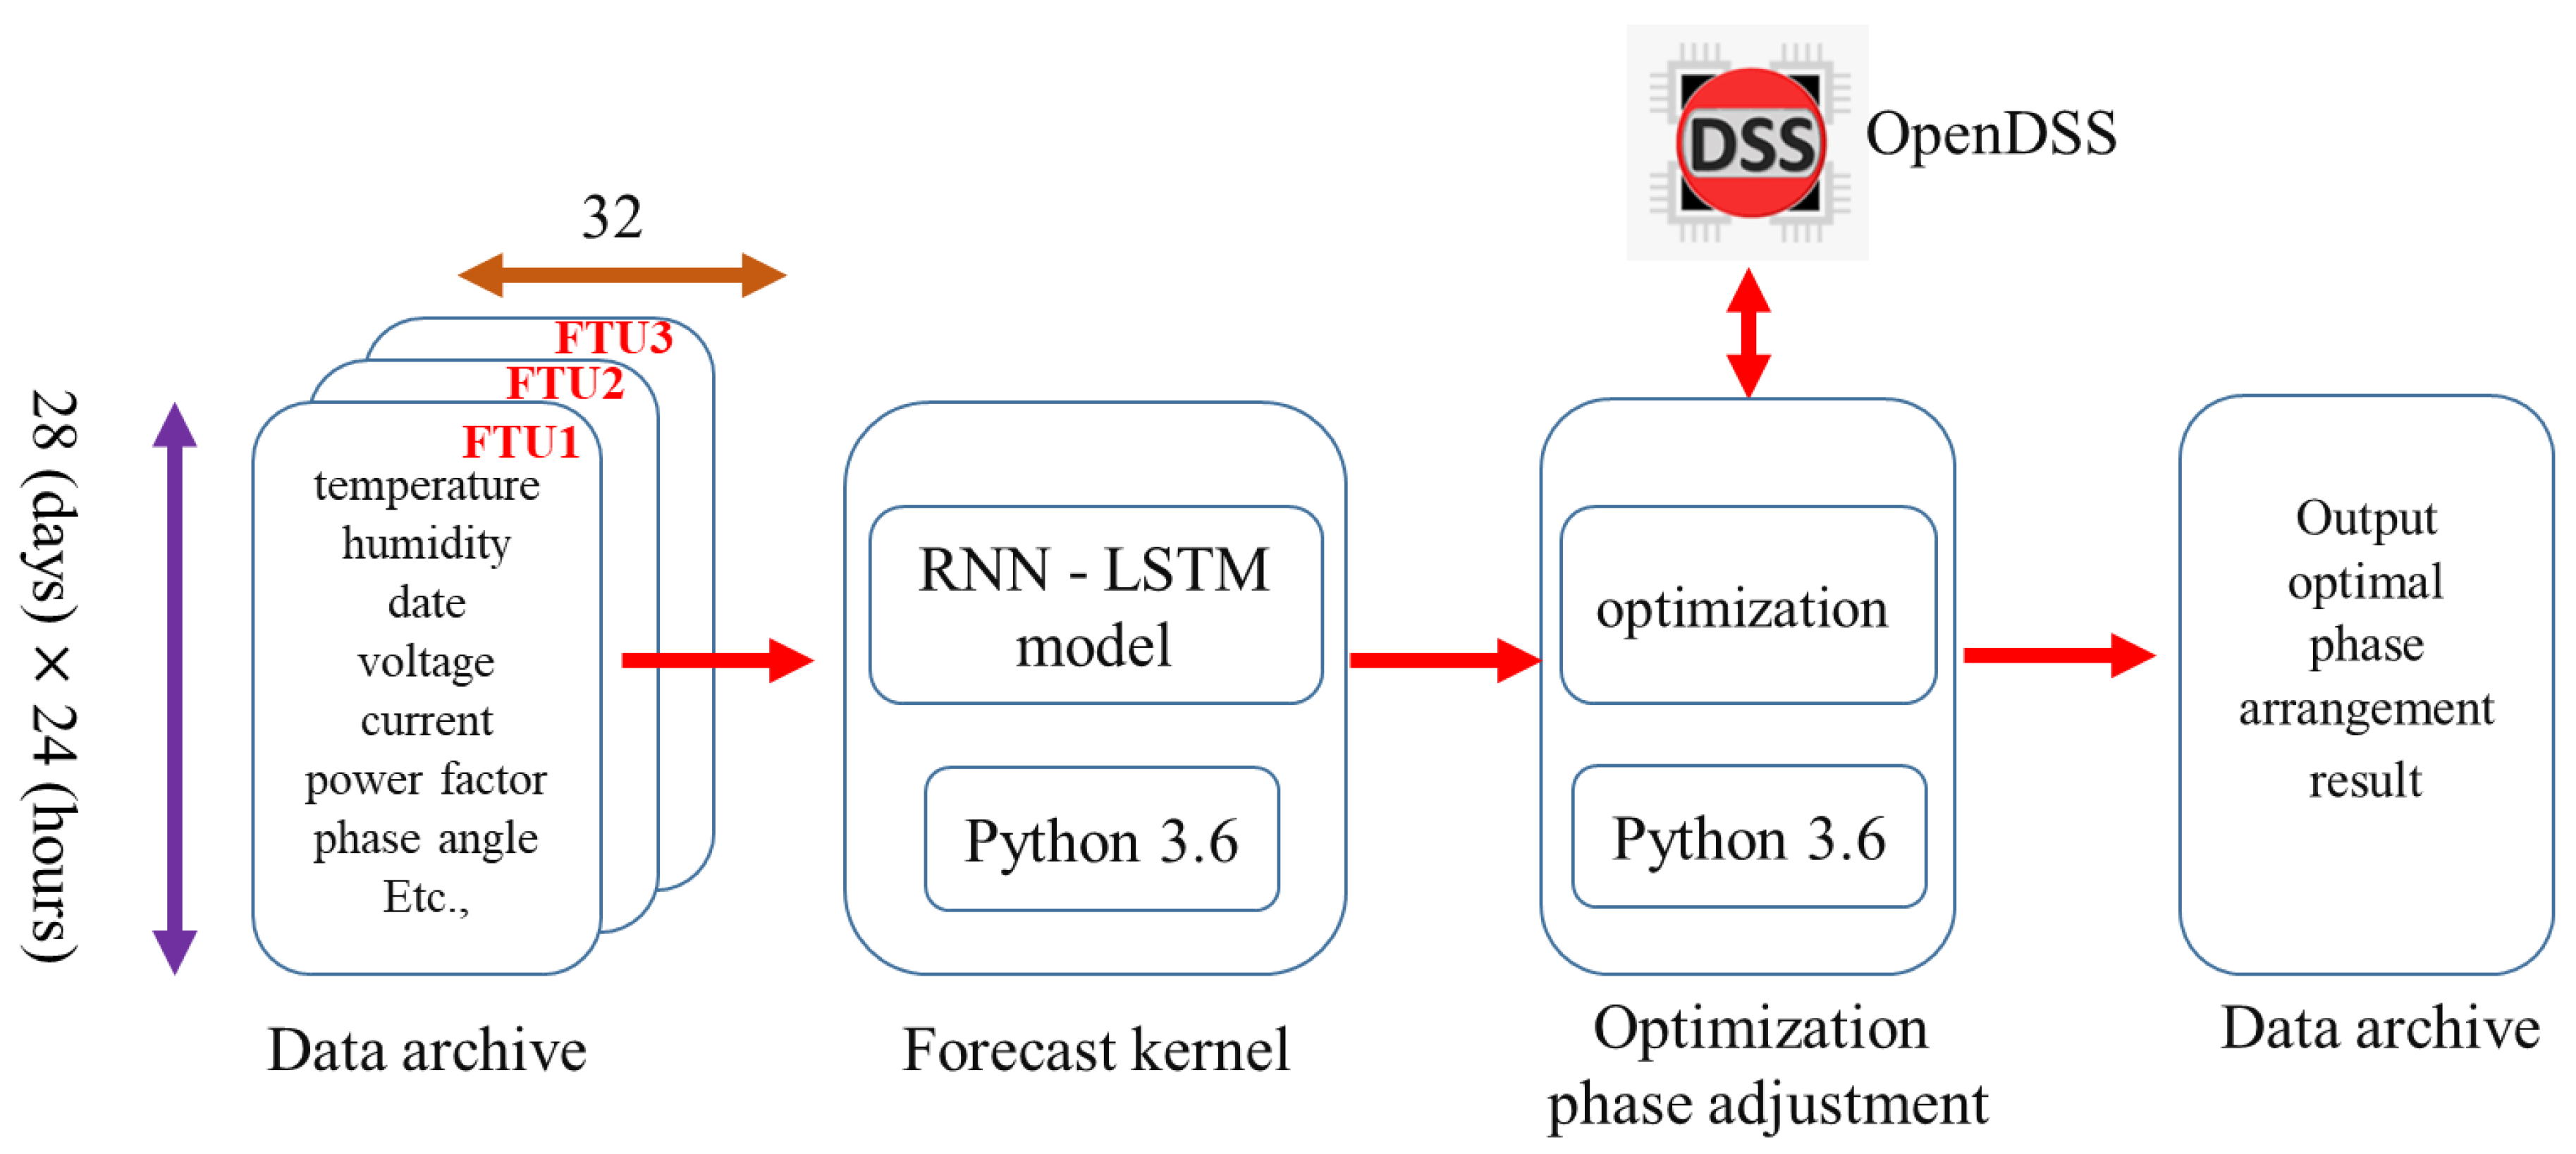
2.1. The Solution Procedure of the Proposed Approach

Figure 1 shows the systematical procedure of the proposed approach for reducing the neutral current by optimal rephasing in order to improve the current inefficient phase adjustment manual via report review from a record log of the DDCC. The solution procedure can be divided into three main parts: the front-end database, the forecast kernel module, and the optimal phase arrangement module. The database is responsible for consolidating the calculation results of each module and converting it into a structured query language (SQL) database format, which is stored in a single file. The forecast kernel module uses an LSTM neural network of a recurrent neural network (RNN). The LSTM-RNN is widely used in electrical load prediction, and the results demonstrate its superior load forecasting ability [17,18,19,20,21]. Therefore, the LSTM-RNN is used to predict the real and reactive powers, and then the results are also stored in the database for phase balancing in the optimal phase arrangement module. Details about the LSTM-RNN is described in detail in the following section.
In Figure 1, the front-end processing and forecast kernel internal architecture of the database is shown in Figure 2. The SQL format data was stored in the Forecast_M7.db file. Its contents include the SQL feeder data format, the SQL weather data format, and the SQL power prediction data format. These SQL formats are converted from raw feeder data and weather data by PQ_estimate.py after which the CSV is converted to SQLited.py files. The forecast module is added to the Feeder.py file. The LSTM model training and testing functions were organized with the translator and TensorFlow package of Python 3.6 (Version 1.13.1, Google, Mountain View, CA, USA) and above, and the calculation results were returned to the Forecast_Feeder.db file for storage.
Figure 3 shows the structure diagram of the optimal phase arrangement module, which was divided into two parts: a data processing program and a PSO algorithm model. In the a data processing program, the load forecast results were imported from the database (.db file). The transformer data of the practical feeder of Taipower were imported from the trial calculation table (.xlsx) to the converterDataToOpenDSS.py sub-program, after which the OpenDSS file (.dss) was automatically exported to establish the basic feeder model in OpenDSS. The OpenDSS (Version 8.6.5.2, Electric Power Research Institute, Inc., Palo Alto, CA, USA) [22] is an electric power distribution system simulator, which is designed to support DERs, including the photovoltaic, wind power, electrical energy storage, grid integration, and smart grid applications. It is a powerful and reliable tool for solving the power flow, harmonic, and so on, in unbalanced distribution systems and is capable of co-operating with an objective oriented optimal program designed by other programming languages [22,23,24,25,26].
The second part of the optimal phase arrangement module is the PSO algorithm model, which contains 25 sub-programs. The PSO.py, which is the main program of the proposed PSO algorithm, calls the dssRephase.py subroutine and sends the particle position data to it. The particle position indicates six connection types corresponding to each transformer and is interconnected with OpenDSS through the component object model (COM) interface. This adjusts the phase of the transformer, solves the power flow, and then returns the power flow results to the PSO.py to continue the iterative operation.

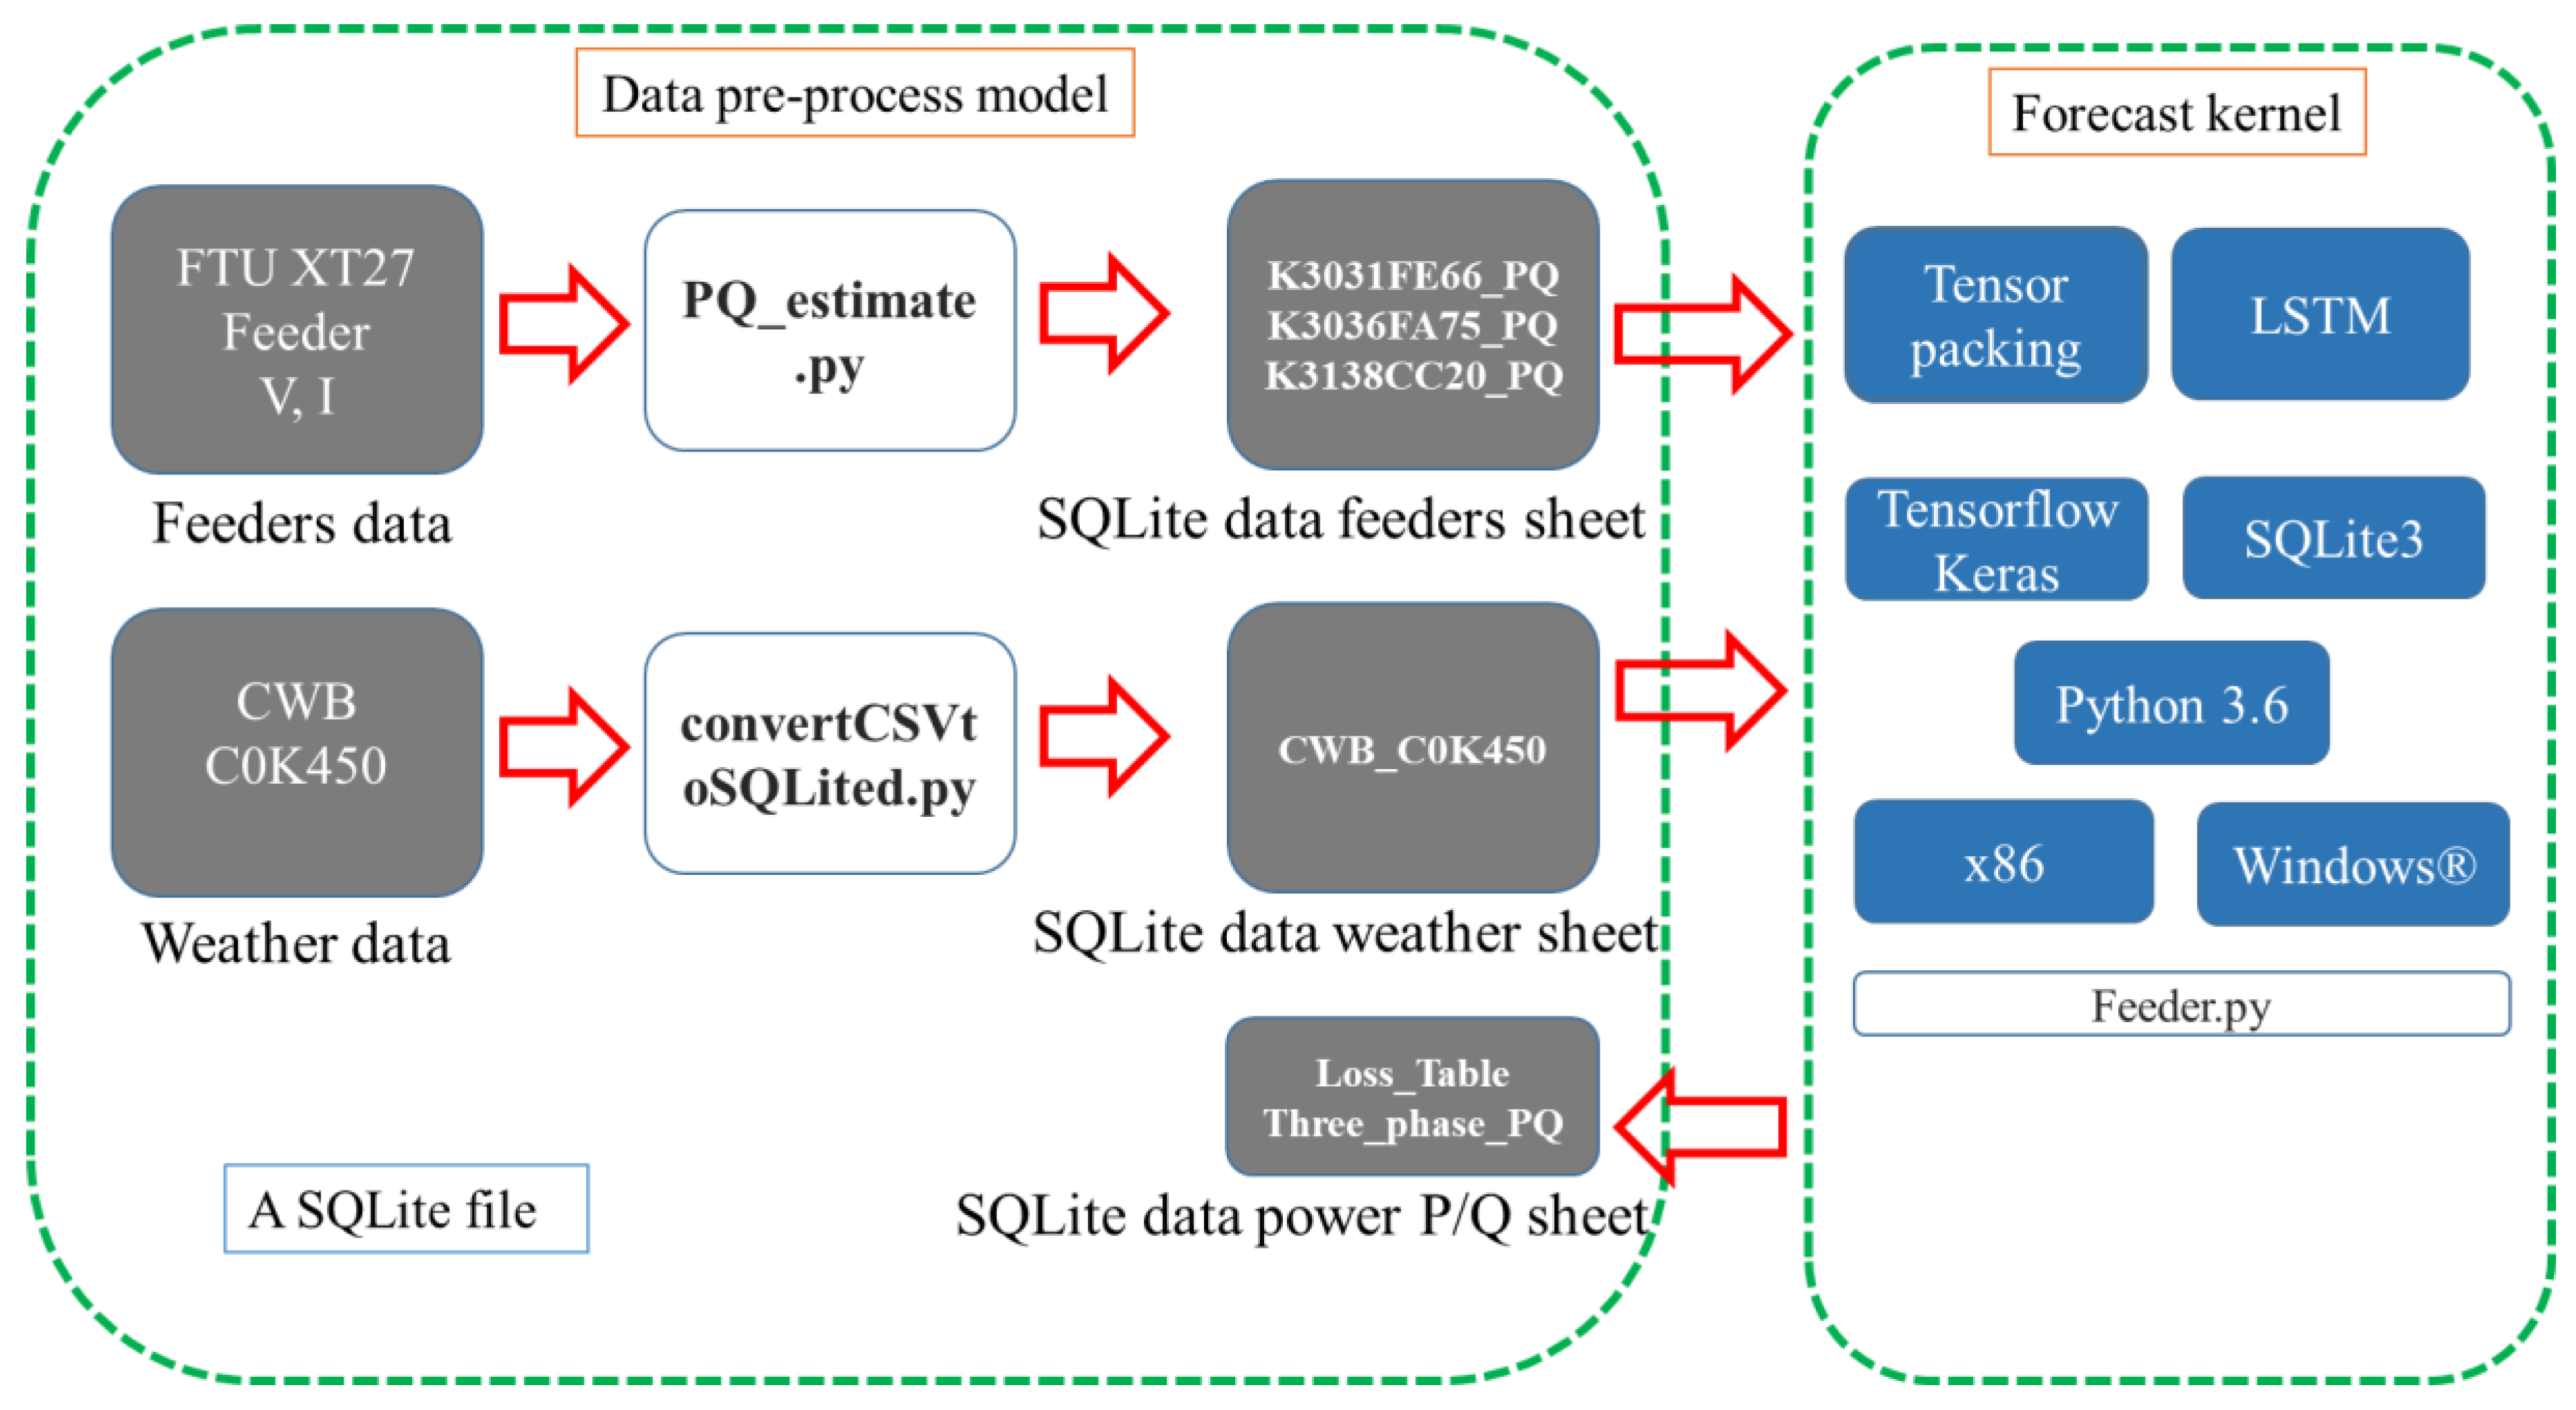
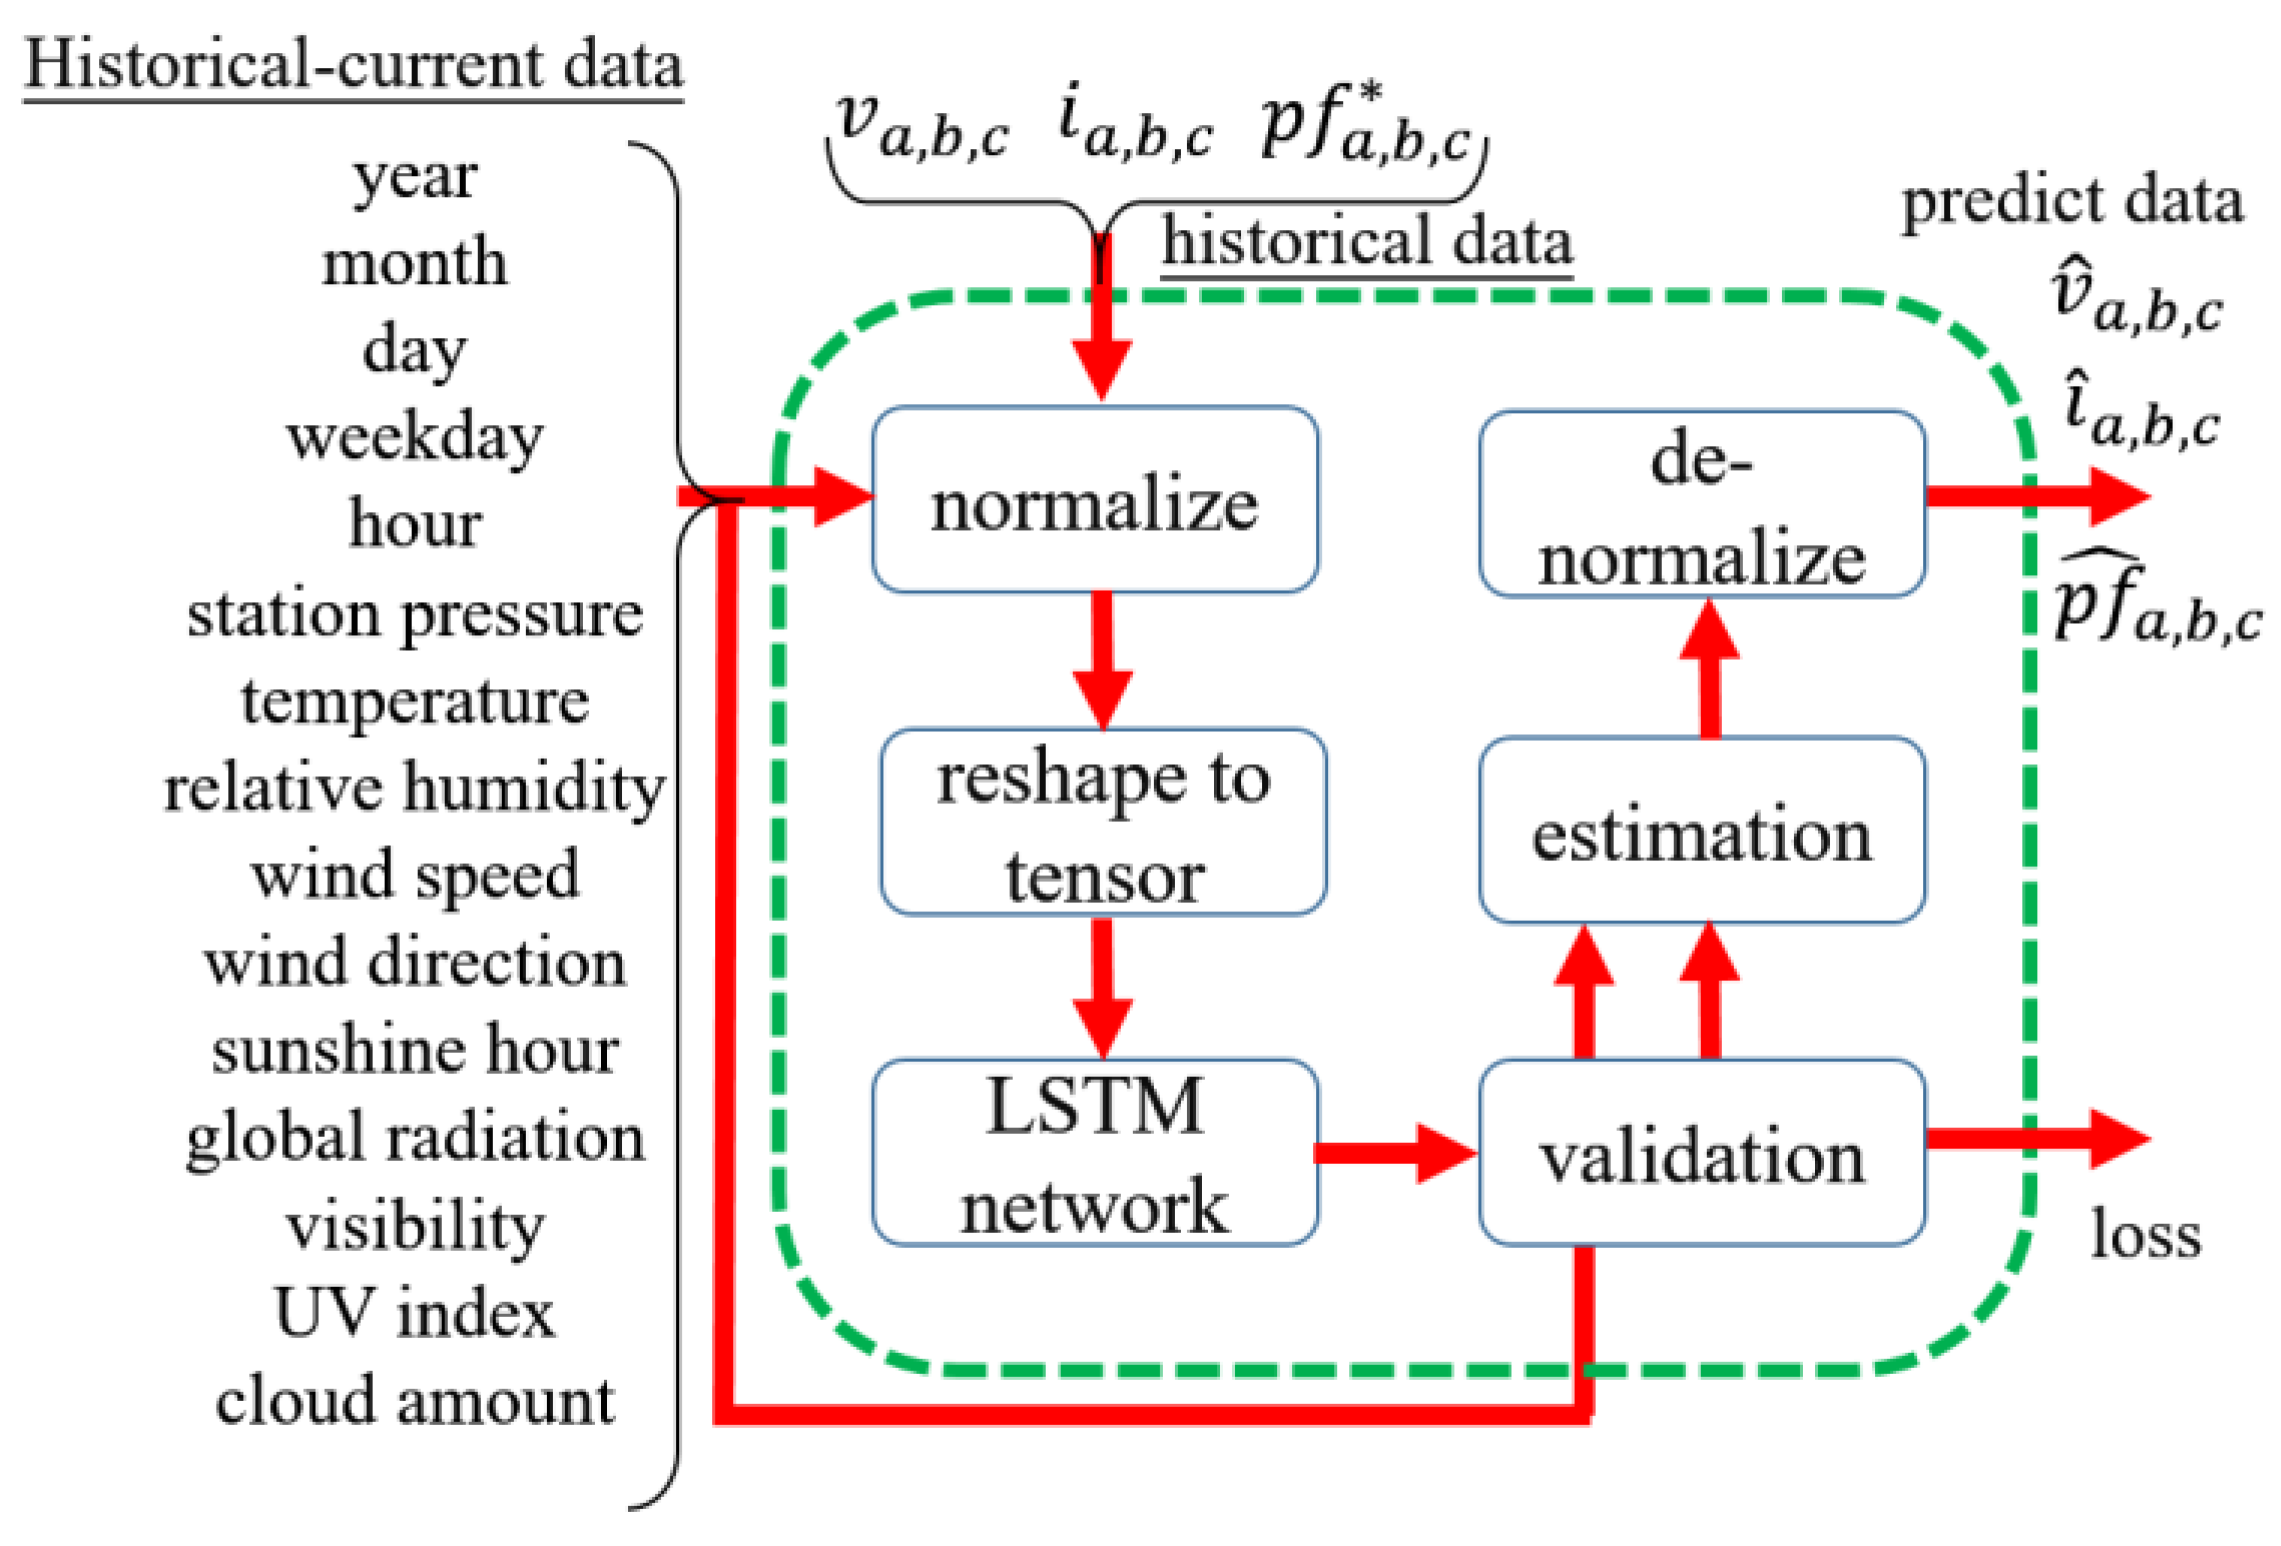
2.2. Description of the Long Short Term Memory

LSTM algorithm applied to the Li-ion batteries charging application and PV plant output forecast in Chemali [27] and Ospina’s [28] study, respectively. This study made the LSTM algorithm forecast the future three-phase power flow according to the weather and time information for the later optimization block process. Tuition materials of the LSTM were recommended in Brownlee’s contribution with the mathematical models, machine learning environment introduction, example codes, and question reply in free [29]. In this study, the LSTM solver is mainly described in Figure 4.
The solver consists of four parts in the input: historical-current data, loss, output predict data, and LSTM solver kernel block. From Figure 2, the input historical-current data are from SQL file sheets. These data were: year (2019–present), month (1–12), day (1–31), weekday (1–7), hour (0–23), station pressure (hPa), temperature (°C), relative humidity (%), wind speed (m/s), wind direction (360°), sunshine hour (h), global radiation (MJ/ m 2 ), visibility (km), ultraviolet index (none), and cloud amount (0–10). Because these data are in different ranges, the normalize process of the LSTM compresses them into unity. For the memory allocation amount size and computation accuracy consideration, the reshape to tensor process converts a portion of the input data into the tensor format in the desired setup. The significant amount of the tensor size reduces the computation time but not accuracy, vice versa. Thus, the validation process is used to tune these parameters via the loss data. Finally, the de-normalize process restores the estimation process and outputs the forecast data upon the current data loop.

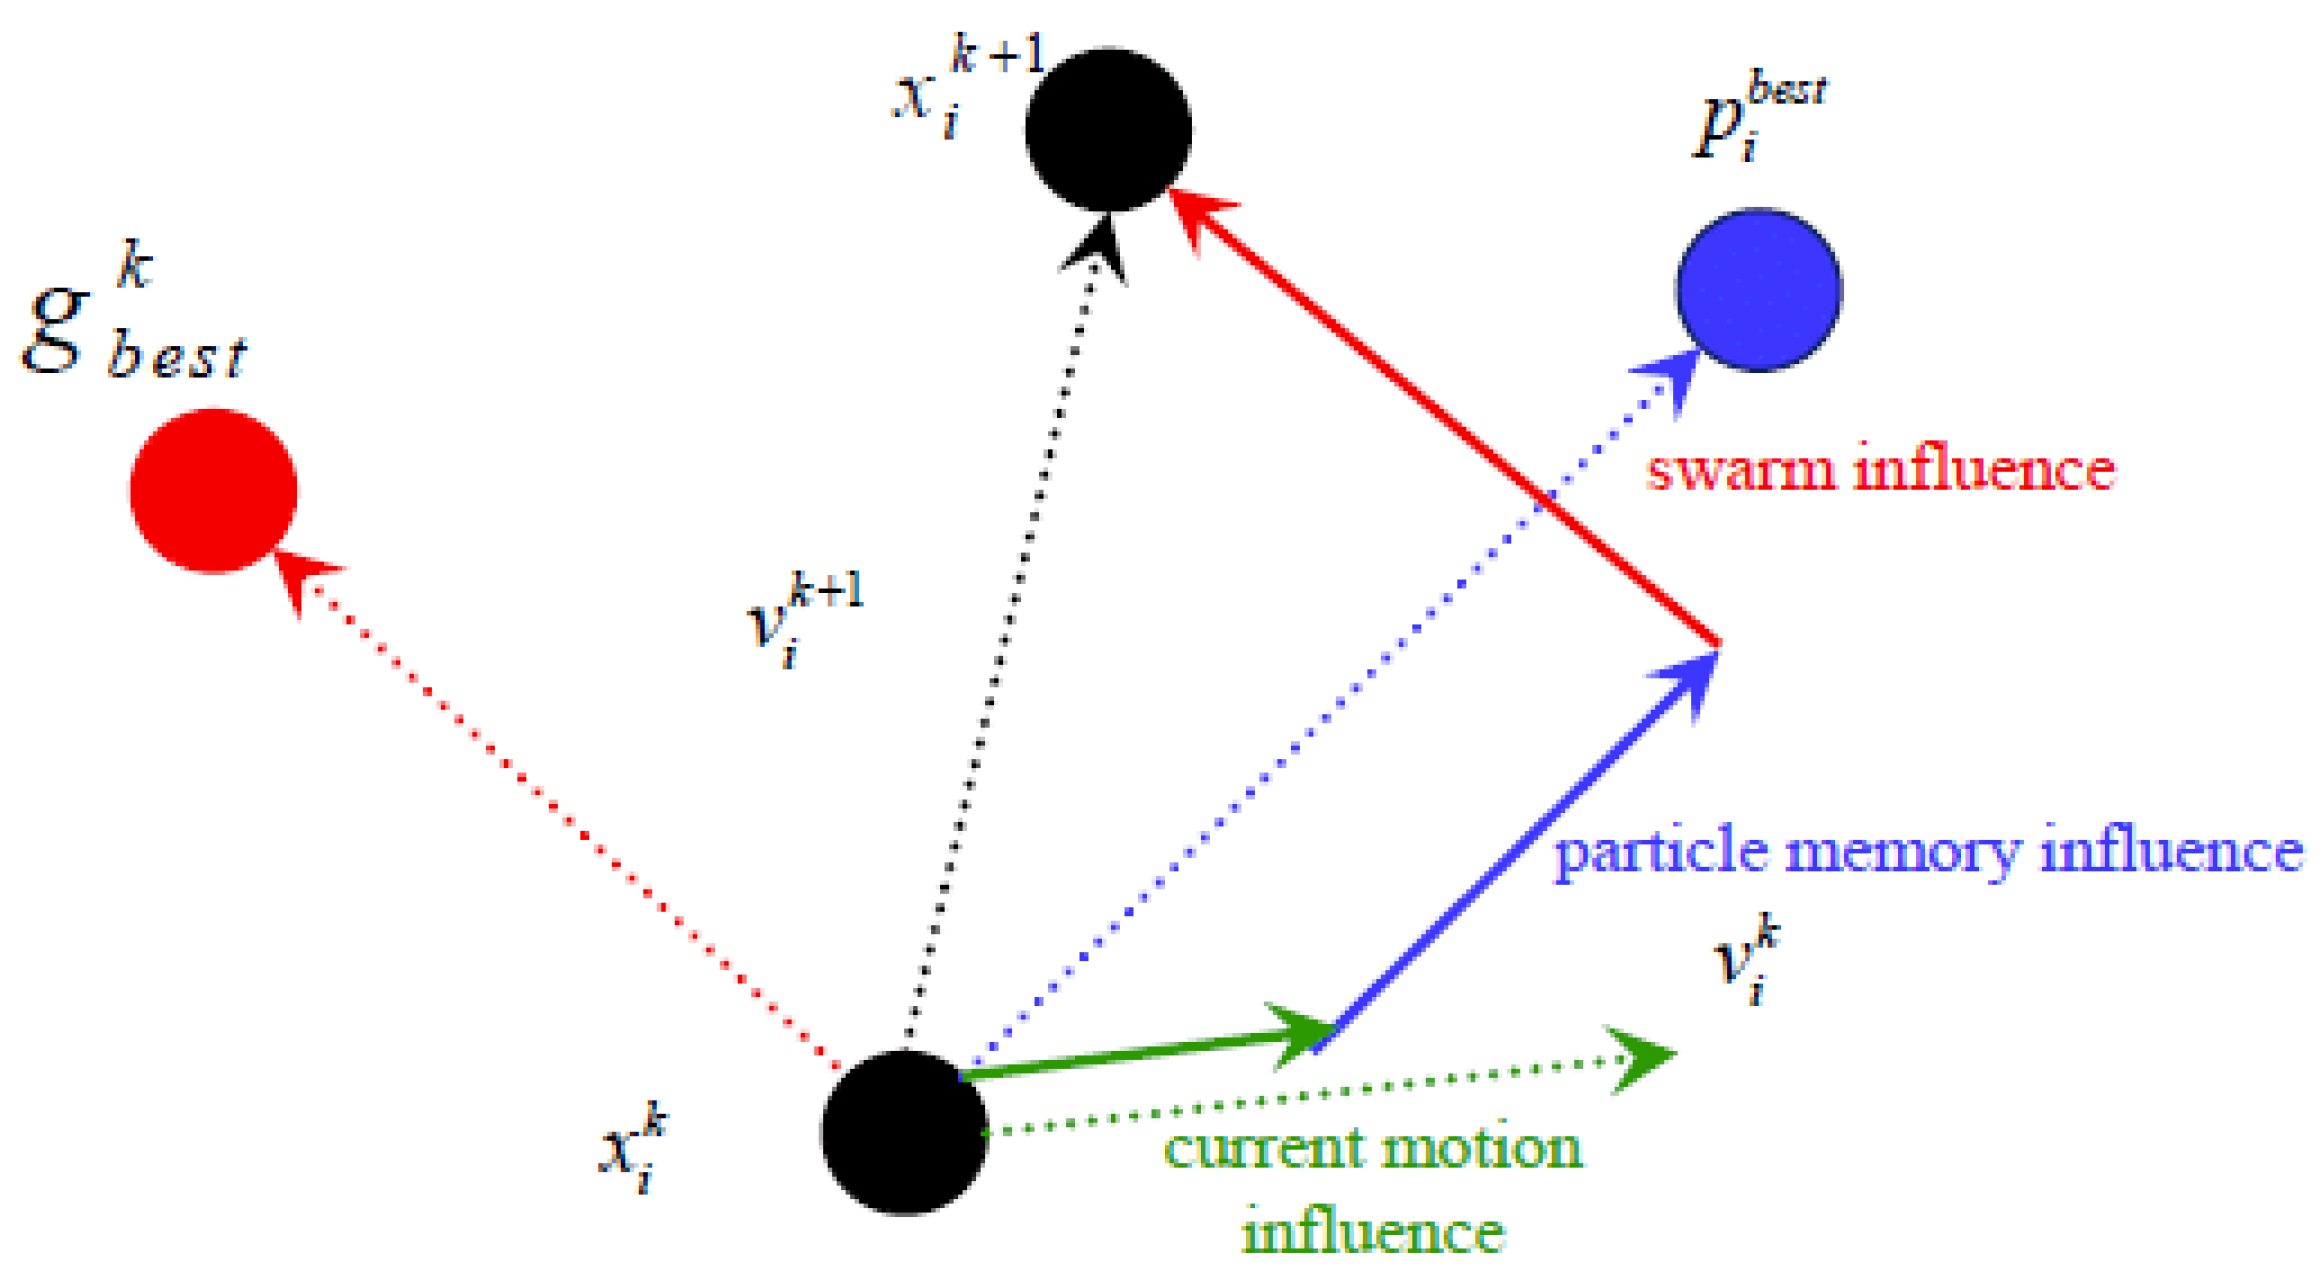
2.3. Description of the Particle Swarm Optimization

The PSO method imitates the flocks of spicy bird migration and forage behavior, and was originally proposed by James Kennedy and Russell Eberhart [30]. This method observes living creatures and concludes two fundamental behaviors in the migration and forage actions. Figure 5 presents two modes: the cognition-only and social-only modes. In PSO, every entity represents a particle that potentially contains a solution, and each particle also owns its position and velocity information. The movement of each particle updates its direction from the inertia and experience outcomes; this is called the cognitive learning model. When the individual particles are compared with other particles to derive the updated direction result, this process is referred to as the social learning model. Thus, two models iterate and derive the optimal solution. The flow chart is shown in Figure 5, and the PSO algorithm equations are shown in Equations (1) and (2) below.
v n i + 1 = ω v n i + φ p r a n d ( p i b e s t   n s n i ) + φ g r a n d ( g b e s t n i s n i )
s n i + 1 = s n i + v n i + 1
In Equations (1) and (2), w denotes the weights, v n i is the particle n movement velocity at the i moment, φ p and φ g are the learning factors, and r a n d ( . ) refers to the random number between 0 and 1. In addition, p i b e s t   n is the optimal solution of the particle n movement velocity at the i moment, s n i is the position of the particle n movement velocity at the i moment, and g b e s t n i is the social learning’s optimal solution of the particle and n is the movement velocity at the i moment. Compared with others, PSO requires fewer setup parameters, is easy to implement, and can efficiently solve the optimization problem. Hence, this algorithm is used to solve the best phase adjustment problem in this study.

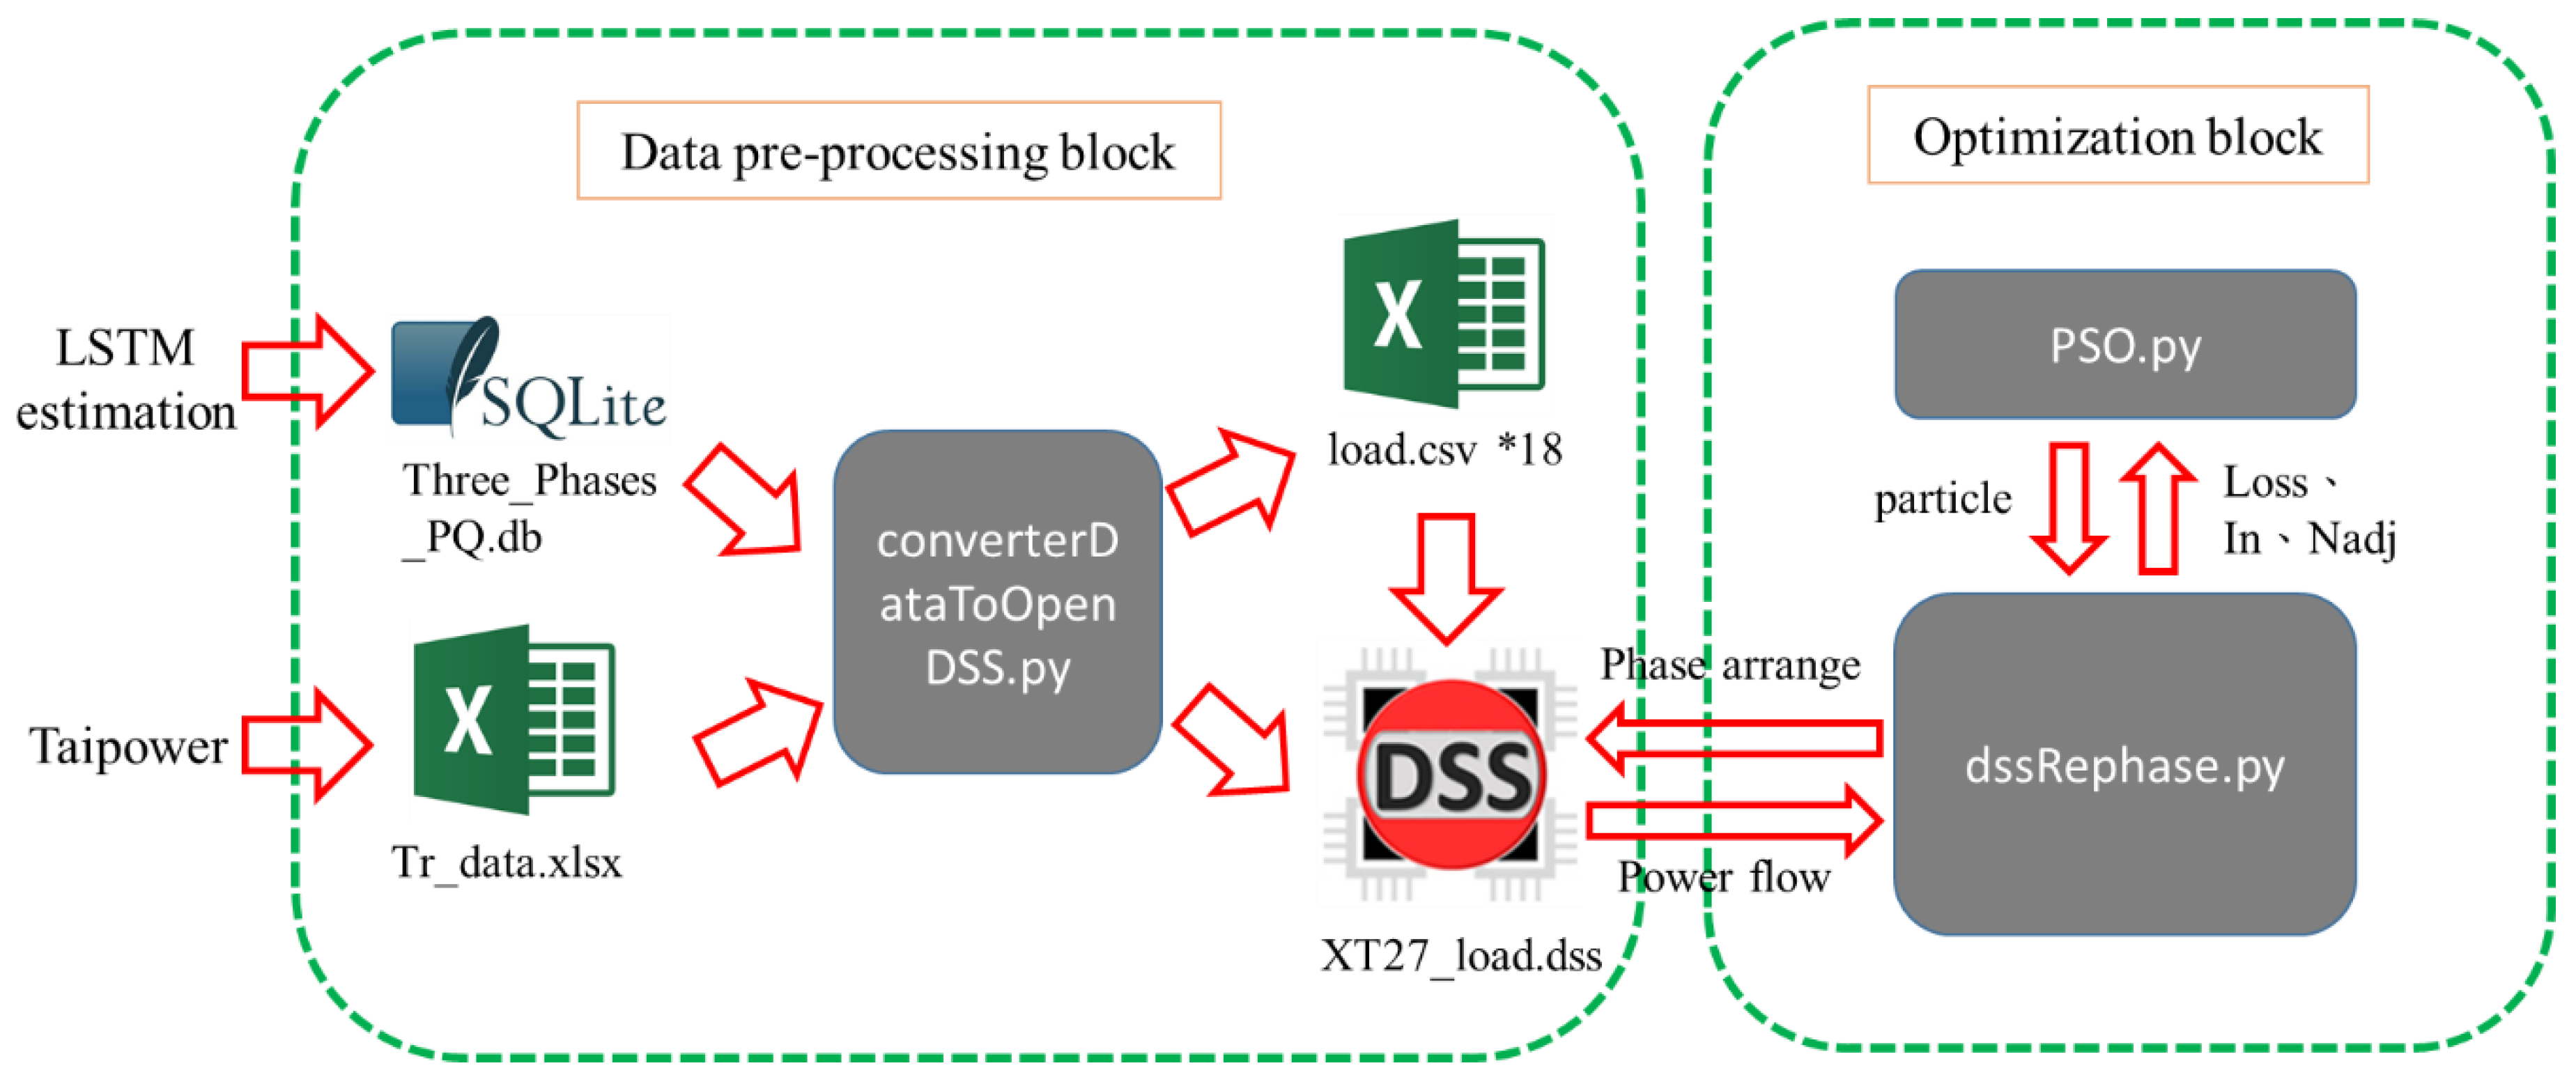
2.4. The Computation Platform with the OpenDSS and Python

Initially, the Electrotek Concepts company developed OpenDSS, a distribution application simulation software. The Electric Power Research Institute purchased it and shared in an open-source manner for research purposes in 2008 [31]. Compared to the commercial software, such as PSS/E (Version 33.4.0, Siemes, Washington, DC, USA) and Cyme PSAF(Version 8.2, CYME International T&D Inc., Quebec City, QC, Canada), OpenDSS has advantages in terms of cost and computation speed despite having fewer functionalities. This study, with an open-source Python computer language, is dynamically linked to the OpenDSS via the COM engine interface to implement the PSO algorithm and derive the optimal phase arrangement outcome. Figure 6 illustrates each process block and the flow direction.

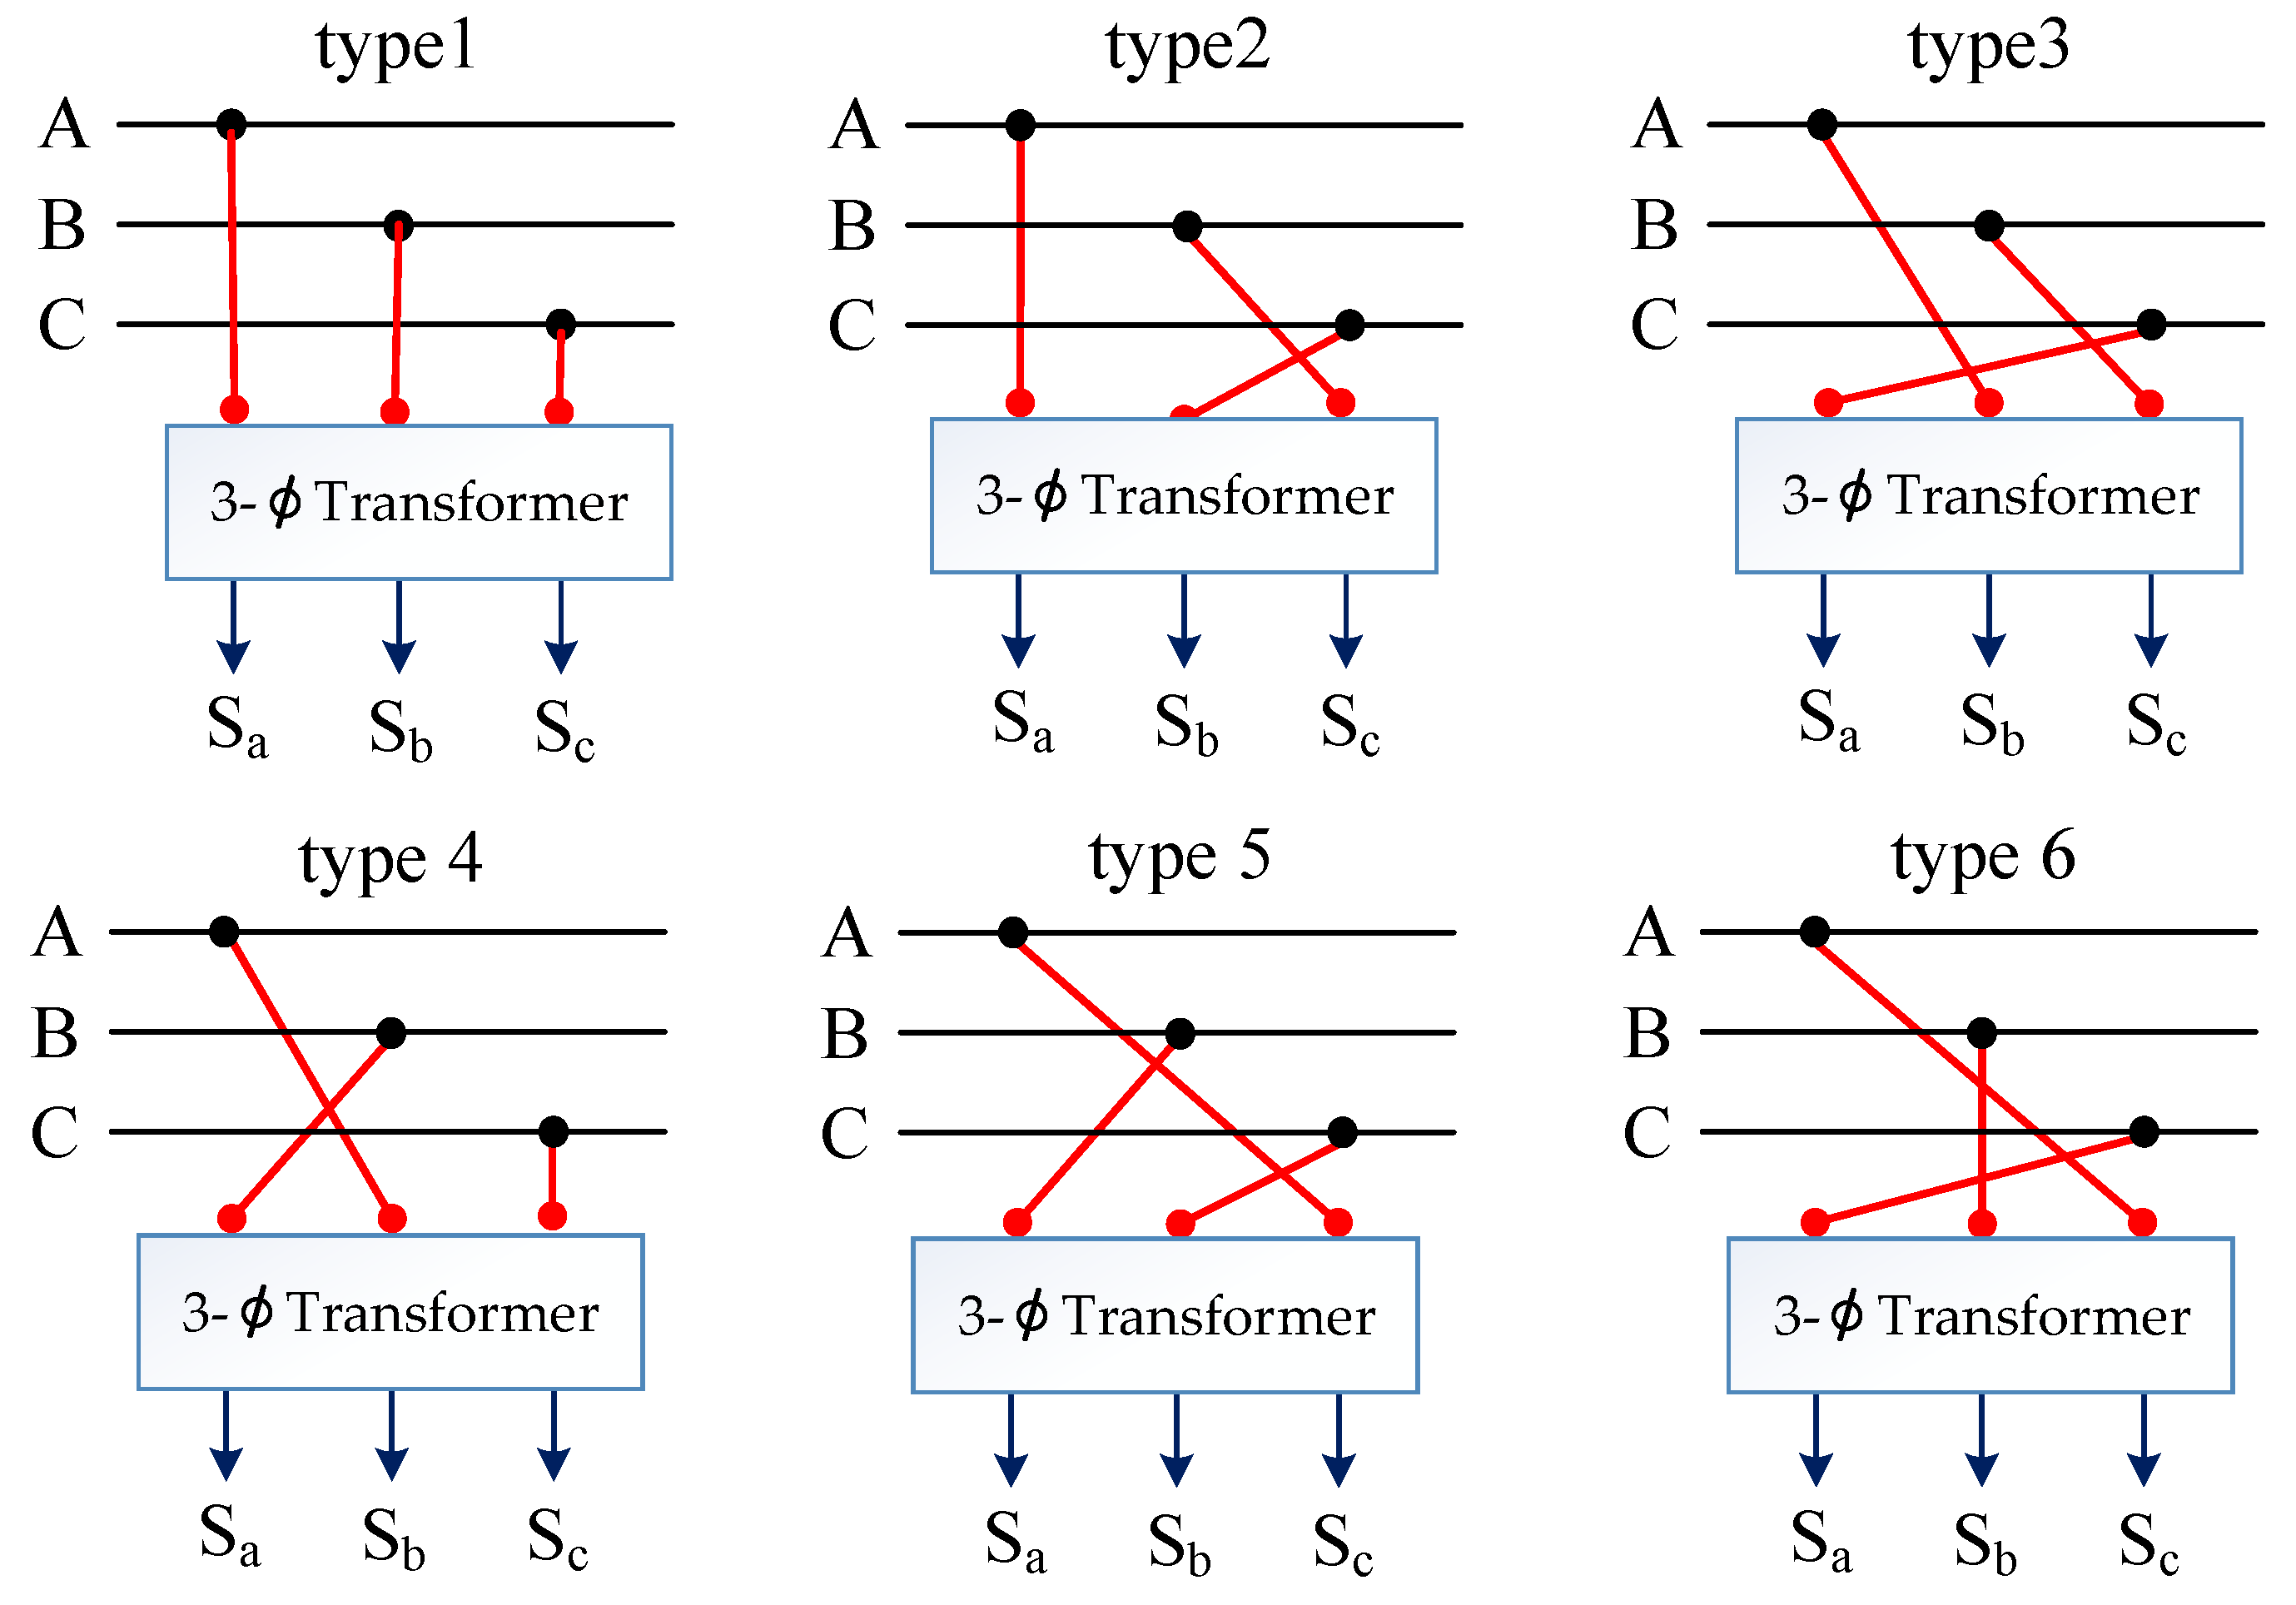
2.5. Optimal Phase Arrangement with the Multi-objective Function

As mentioned above, the practical three-phase, four-wire distribution systems exhibit unbalanced operation caused by the asymmetrical structure of power line arrangement and distribution transformer, DER penetration, and random power consumption of customers. This unbalanced condition results in the serious malfunction of the protective relay, extra power loss, derating motor torque, and degraded power quality. The phase arrangement process changes the physical connection between the individual distribution transformer or lateral and tapped-off point in feeder main. In this paper, the rephasing work was performed in the three-phase feeder main; therefore, the distribution transformers and laterals connected to the feeder main will be the adjusted points. The possible connection schemes for the three-, two-, or single-phase transformers and laterals were different, as shown in Figure 7. For example, Figure 8 presents the six types of connection schemes used in the three-phase connection transformer.
In the rephasing study, the solved problem becomes complicated due to the non-traditional single-objective problem. Many expected goals must be considered in real applications. Hence, it becomes a multi-purpose function problem and the weighting method must be used to solve it. The unity proportional weight factors must also be used to combine the different scenarios into a single-objective problem. These scenarios aim to achieve a general concept of reducing the neutral line current to prevent the unexpected tripping of the LCO protective relay. Considering the factors of the power loss and the labor cost of the phase adjustment, the multi-purpose fitness function is found in Equation (3).
F = w 1 I N l i n e i N l i n e min i N l i n e max i N l i n e min + w 2 P l o s s p l o s s min p l o s s max p l o s s min + w 3 N a d j n a d j min n a d j max n a d j min
The weights are limited in Equation (4):
w 1 + w 2 + w 3 = 1
where I N l i n e denotes the neutral line current (A) of feeder main, P l o s s is the power loss (kW) per hour, N a d j is the number of the adjusted transformer and lateral, and w is the unity proportional weight factor.

3. Simulation and Analysis

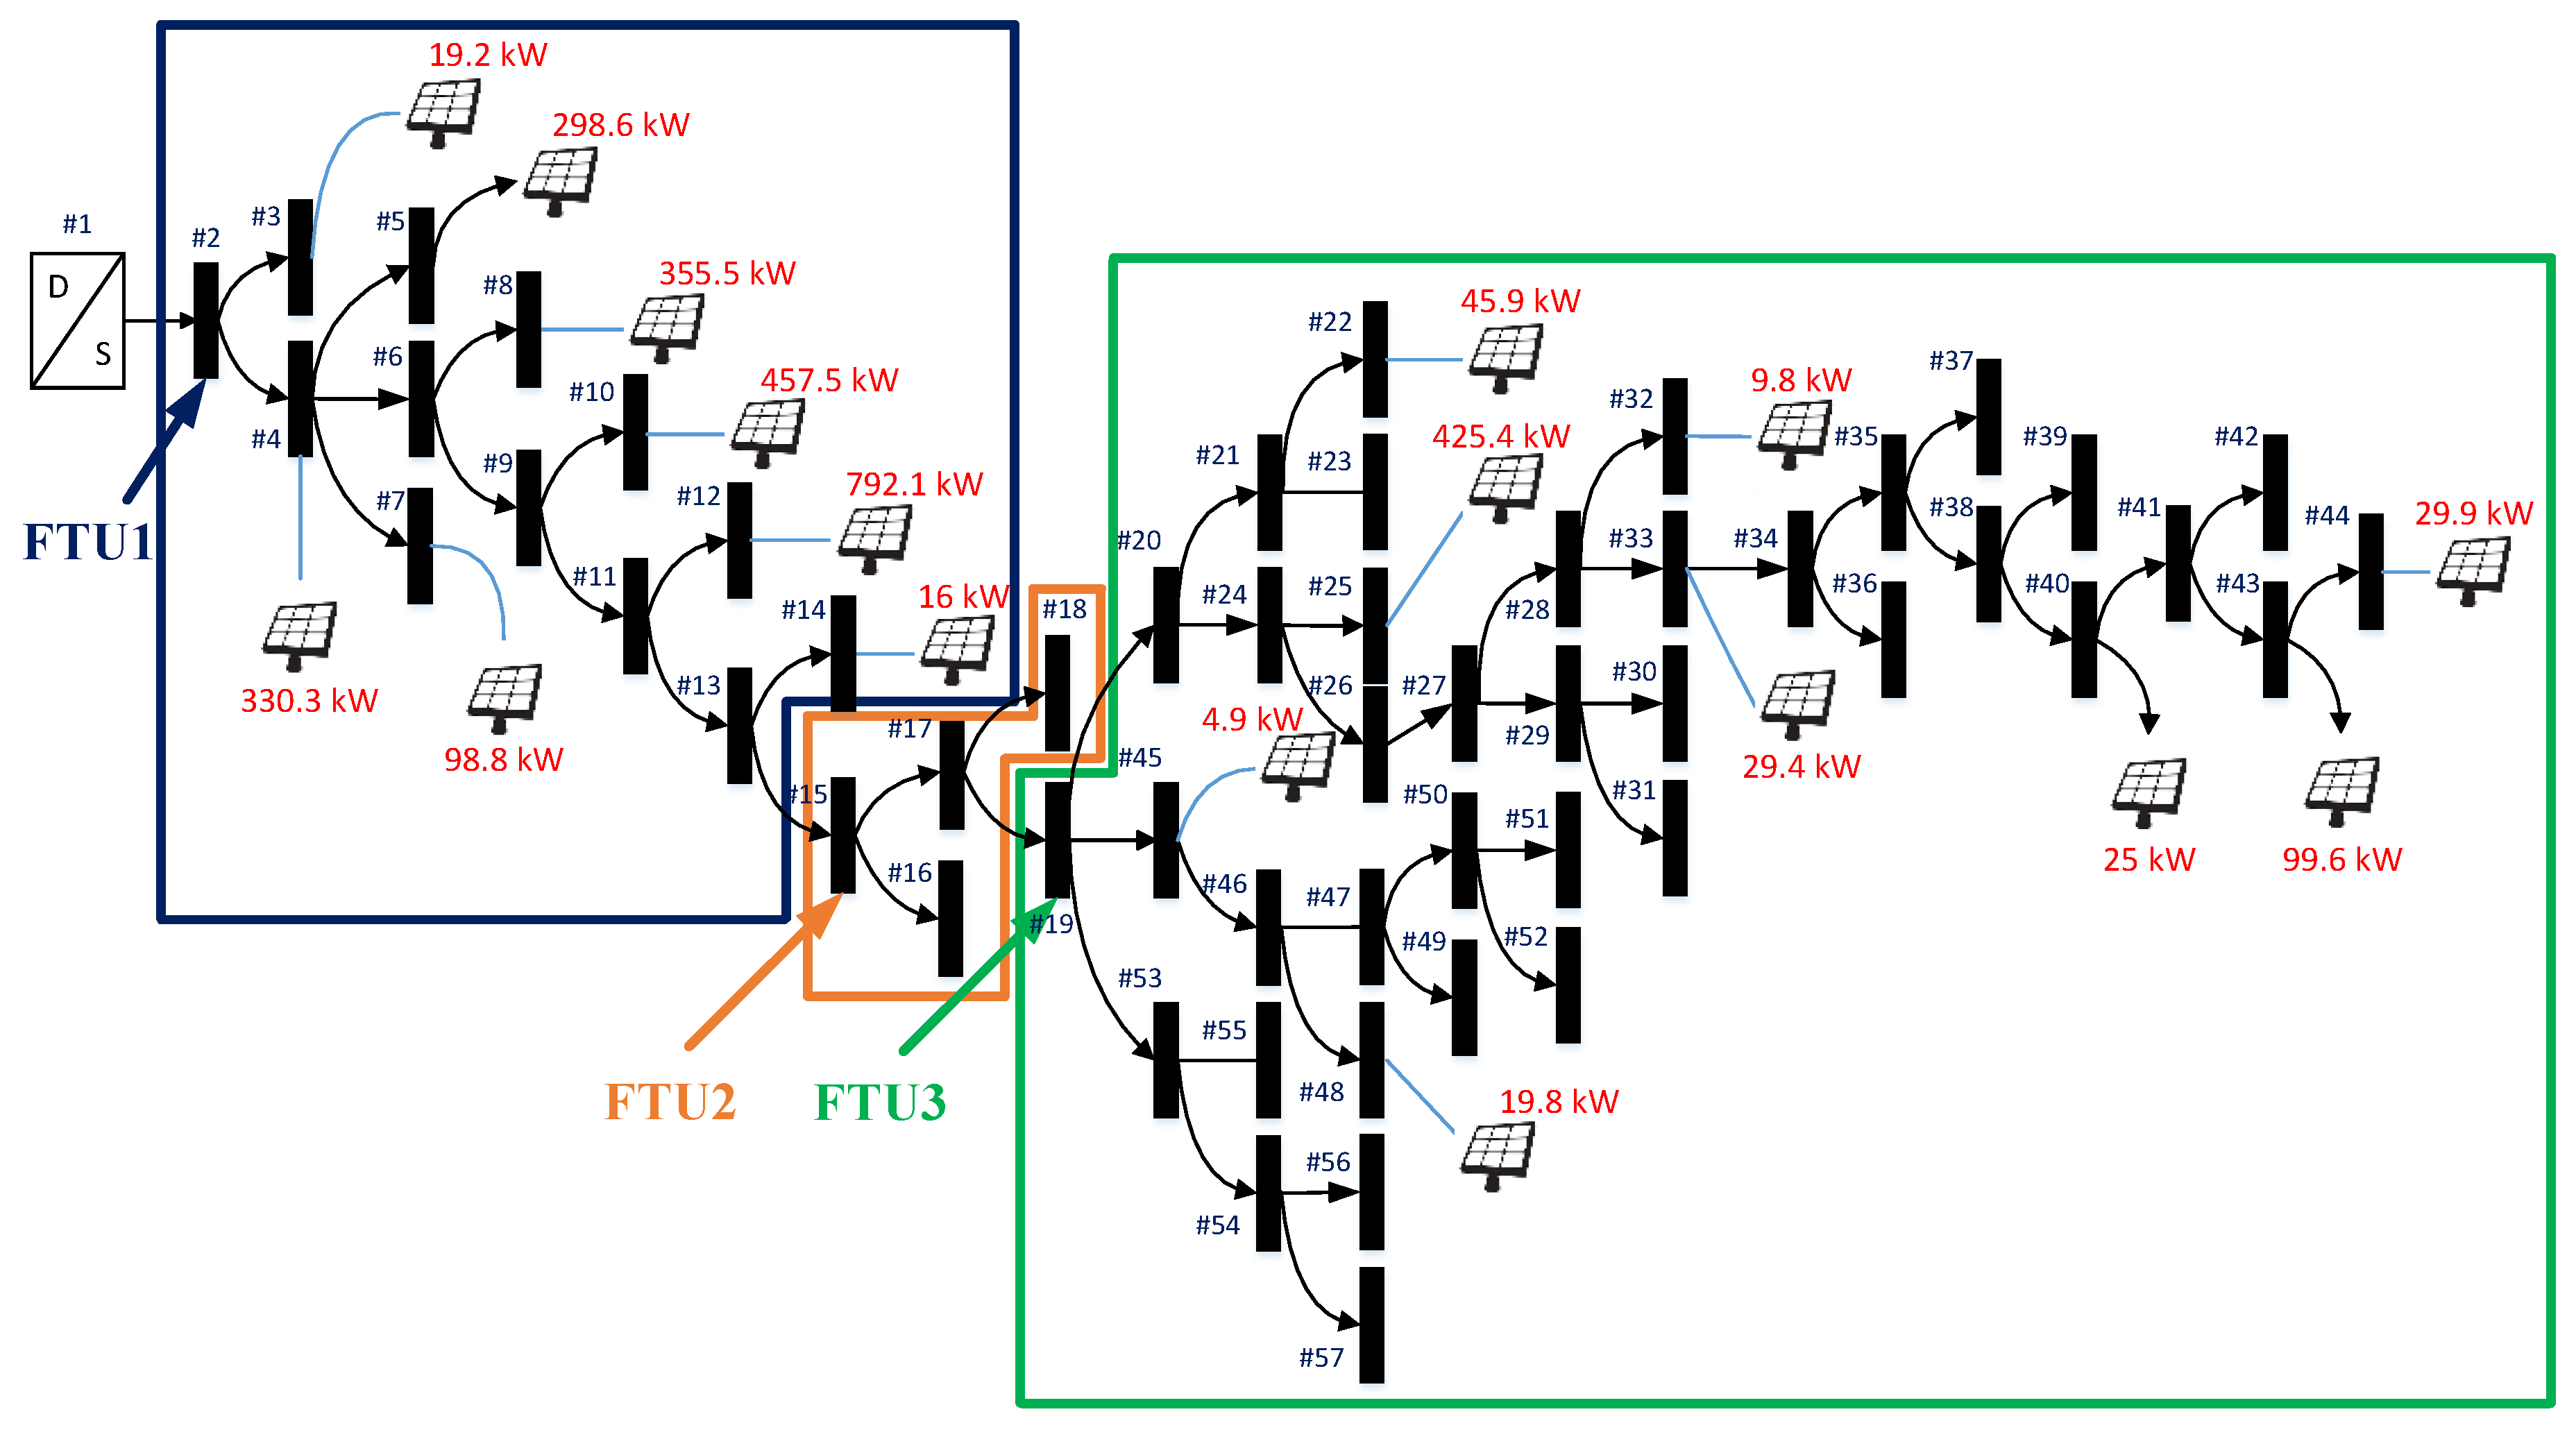
3.1. Scenario and Simulation Parameter Setting

The practical distribution feeder, shown in Figure 9, is located in the middle Taiwan district and is selected from the Taipower. It operates with the installed PV with a 3057.7 kW capacity, 55 buses, and three FTUs located in the front, middle, and ending positions, respectively. The FTUs measure the summation of the injected power, which includes the customer loading S l o a d , line loss S l o s s , and the PV power output in a negative value P P V , g e n . These are summarized in Equation (5) below.
S F T U = S l o a d + S l o s s P P V , g e n
Meanwhile, Figure 9 shows the FTUs and PV plant locations. There are also 81 transformers in the feeder main, which can be rephrased in Taipower’s regular monthly work. Thus, the optimization work proposed the phase adjustment philosophy of these buses in order to achieve the expected outcomes.
Defining the feeder main line loading is crucial in resolving the phase adjustment philosophy. Referring to the normal three-phase loading distribution of the feeder main, Equations (6)–(8) represent each of the active and reactive powers in the different feeder areas, which include several feeder sections. The calculation mainly substrates each FTU’s measurement and derives the loading information in each area.
S 1 , t o t a l = S F T U 1 - S F T U 2
S 2 , t o t a l = S F T U 2 S F T U 3
S 3 , t o t a l = S F T U 3
According to the installed three-phase capacity C D T r , i of the distribution transformer at each bus, we allocated the feeder area power S 1 , t o t a l , S 2 , t o t a l , and S 3 , t o t a l on the bus by Equation (9). Similarly, the loading at the tapped-off point between the feeder main and lateral can be calculated by the same approach wherein C D T r , i is the summation of the installed capacity of the distribution transformers in the lateral. Based on the derived hourly load at each bus in the feeder main and on the regular rule of monthly phase adjustment strategy of Taipower, this study forecasted the month-ahead power loading per hour unit. By using the proposed LSTM-RNN algorithm, we were able to derive the full-scale load model in one month for the optimal phase arrangement by the proposed multi-objective function in Equation (3):
B u s l o a d , i = S t o t a l × C D T r , i i n C D T r , i
In the following section, the practical unbalanced distribution feeder of Taipower, shown in Figure 1, was used in the sample system. Four cases were assumed, as shown in Table 1, with three sets of weighting values in neutral current, total energy loss, and rephasing number, respectively, in order to demonstrate the performance of the proposed approach. The fitness function, neutral current, total energy loss, and rephasing number of the proposed approach were compared to those of the original system prior to the phase arrangement. The numerical results of Case 1 shall be fully analyzed and discussed in Section 3.2, and the comparisons of the four cases will be discussed in Section 3.3.

3.2. Numerical Results

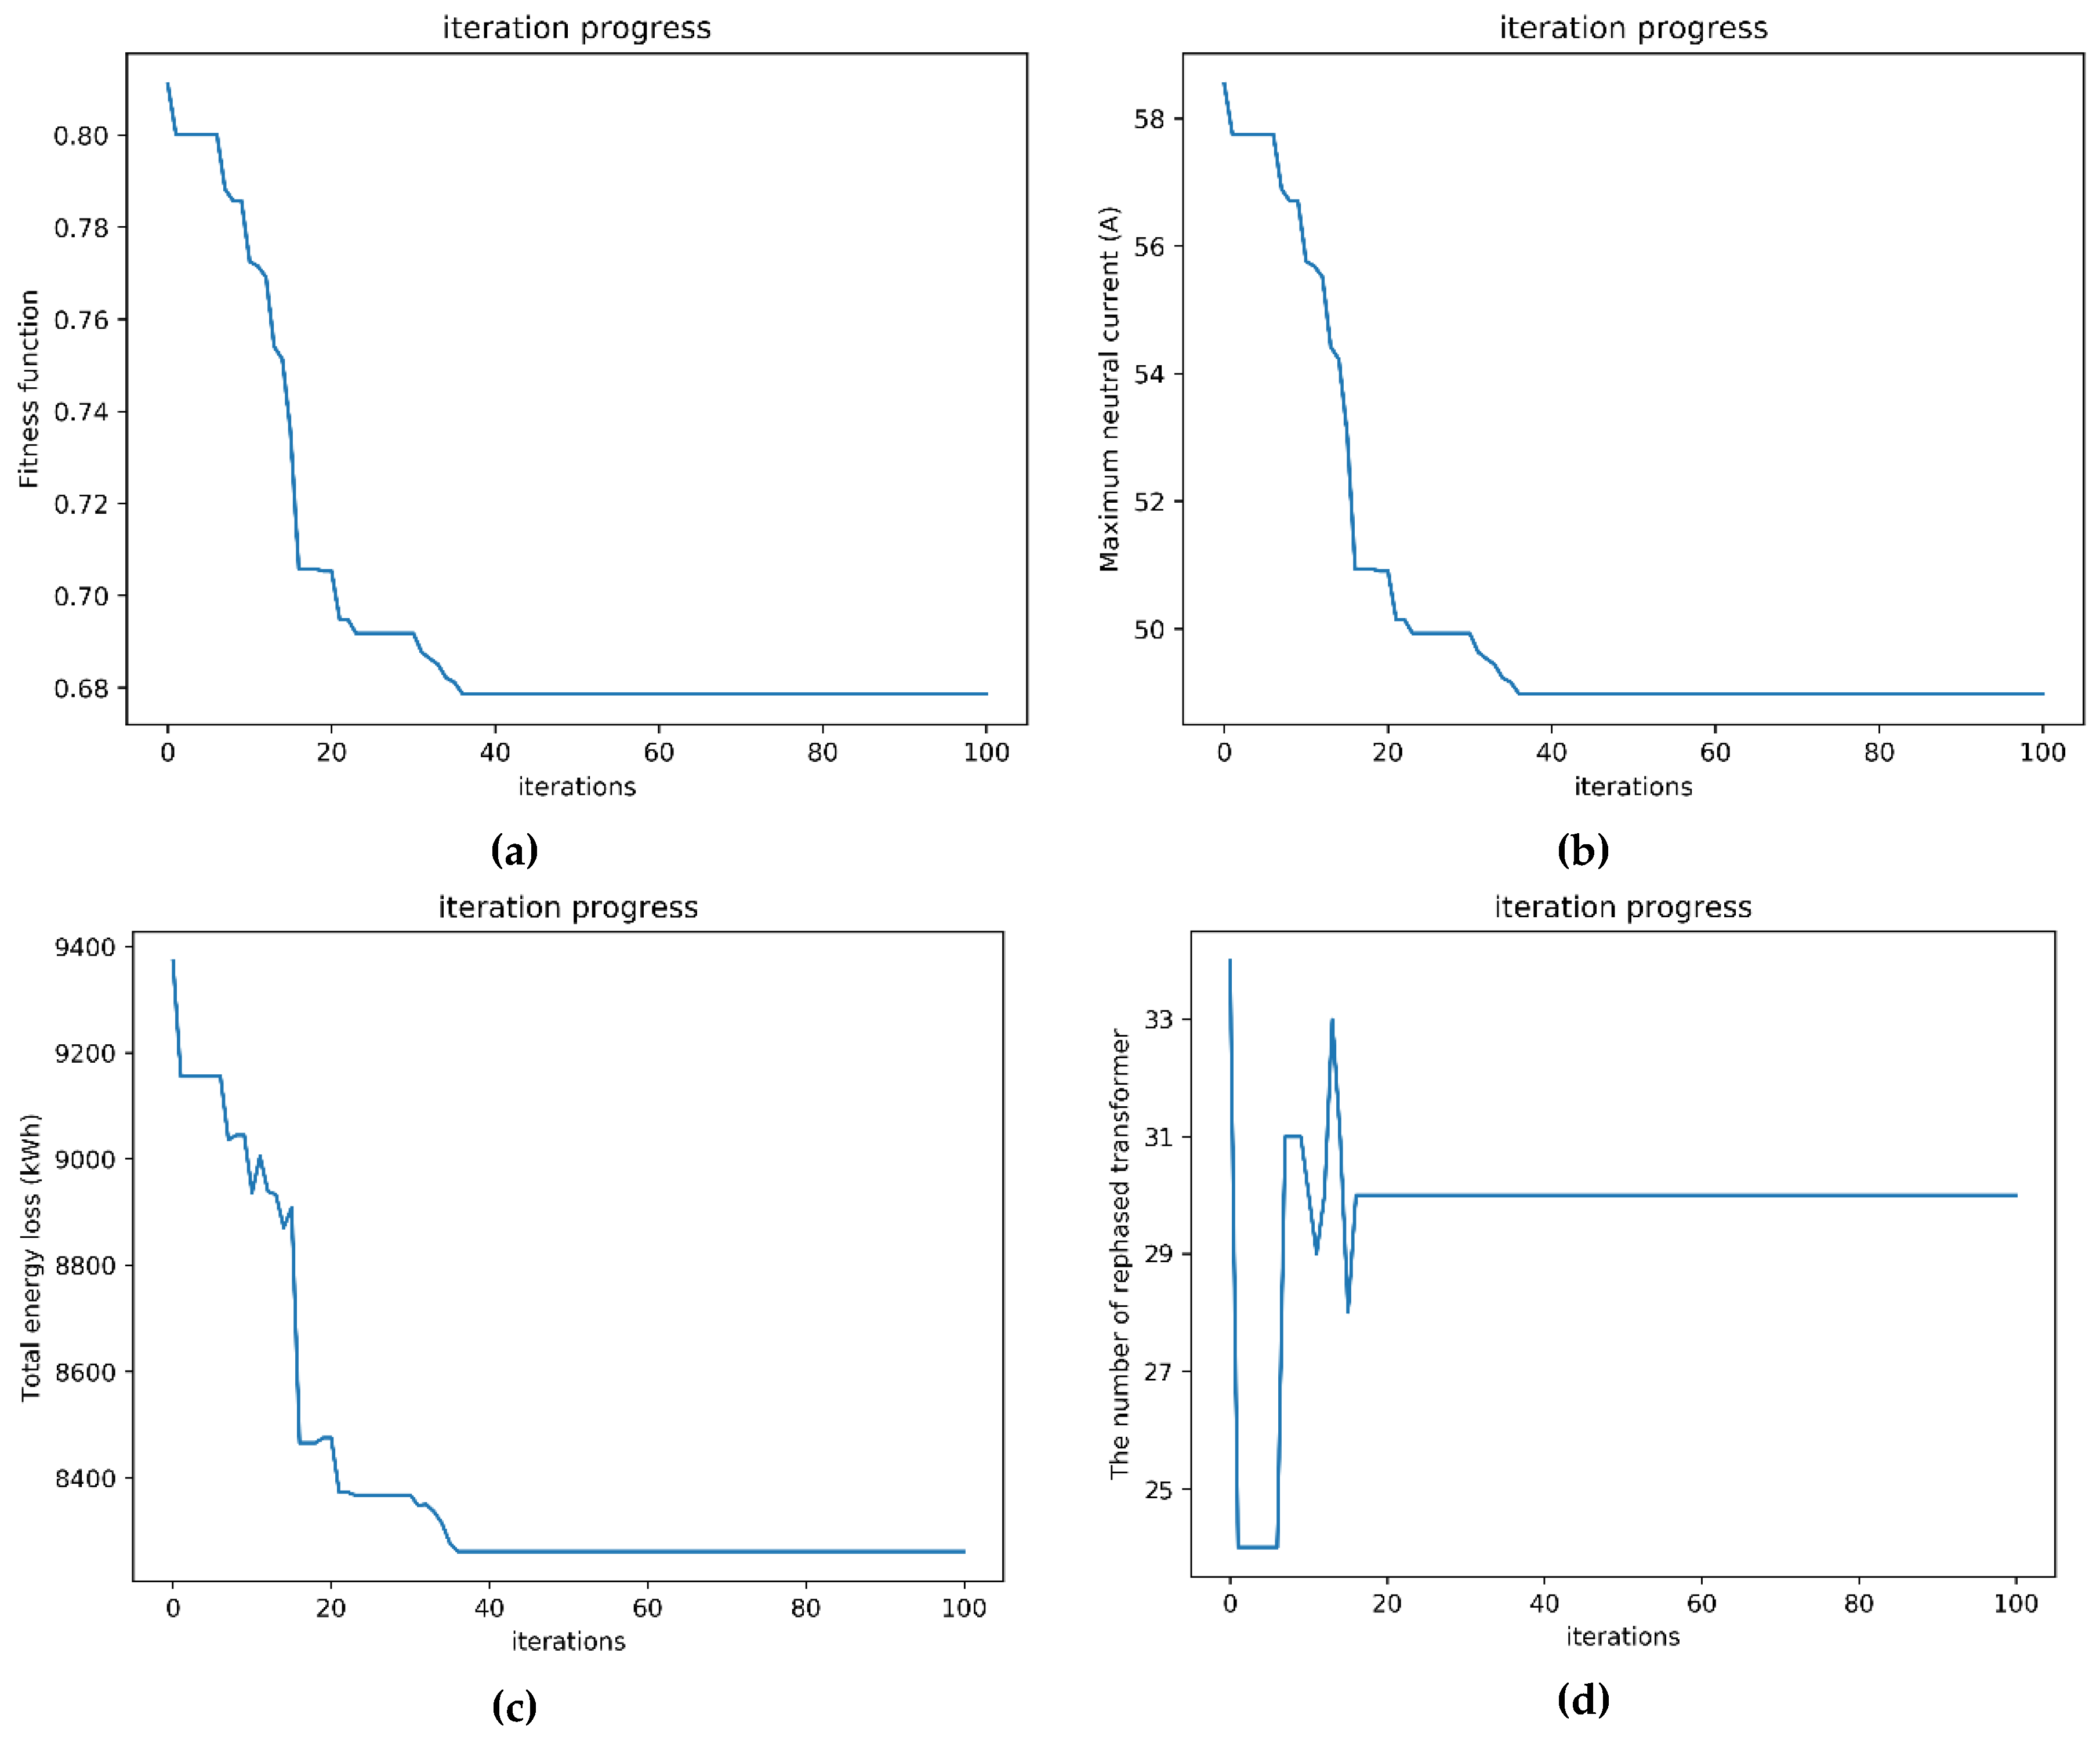
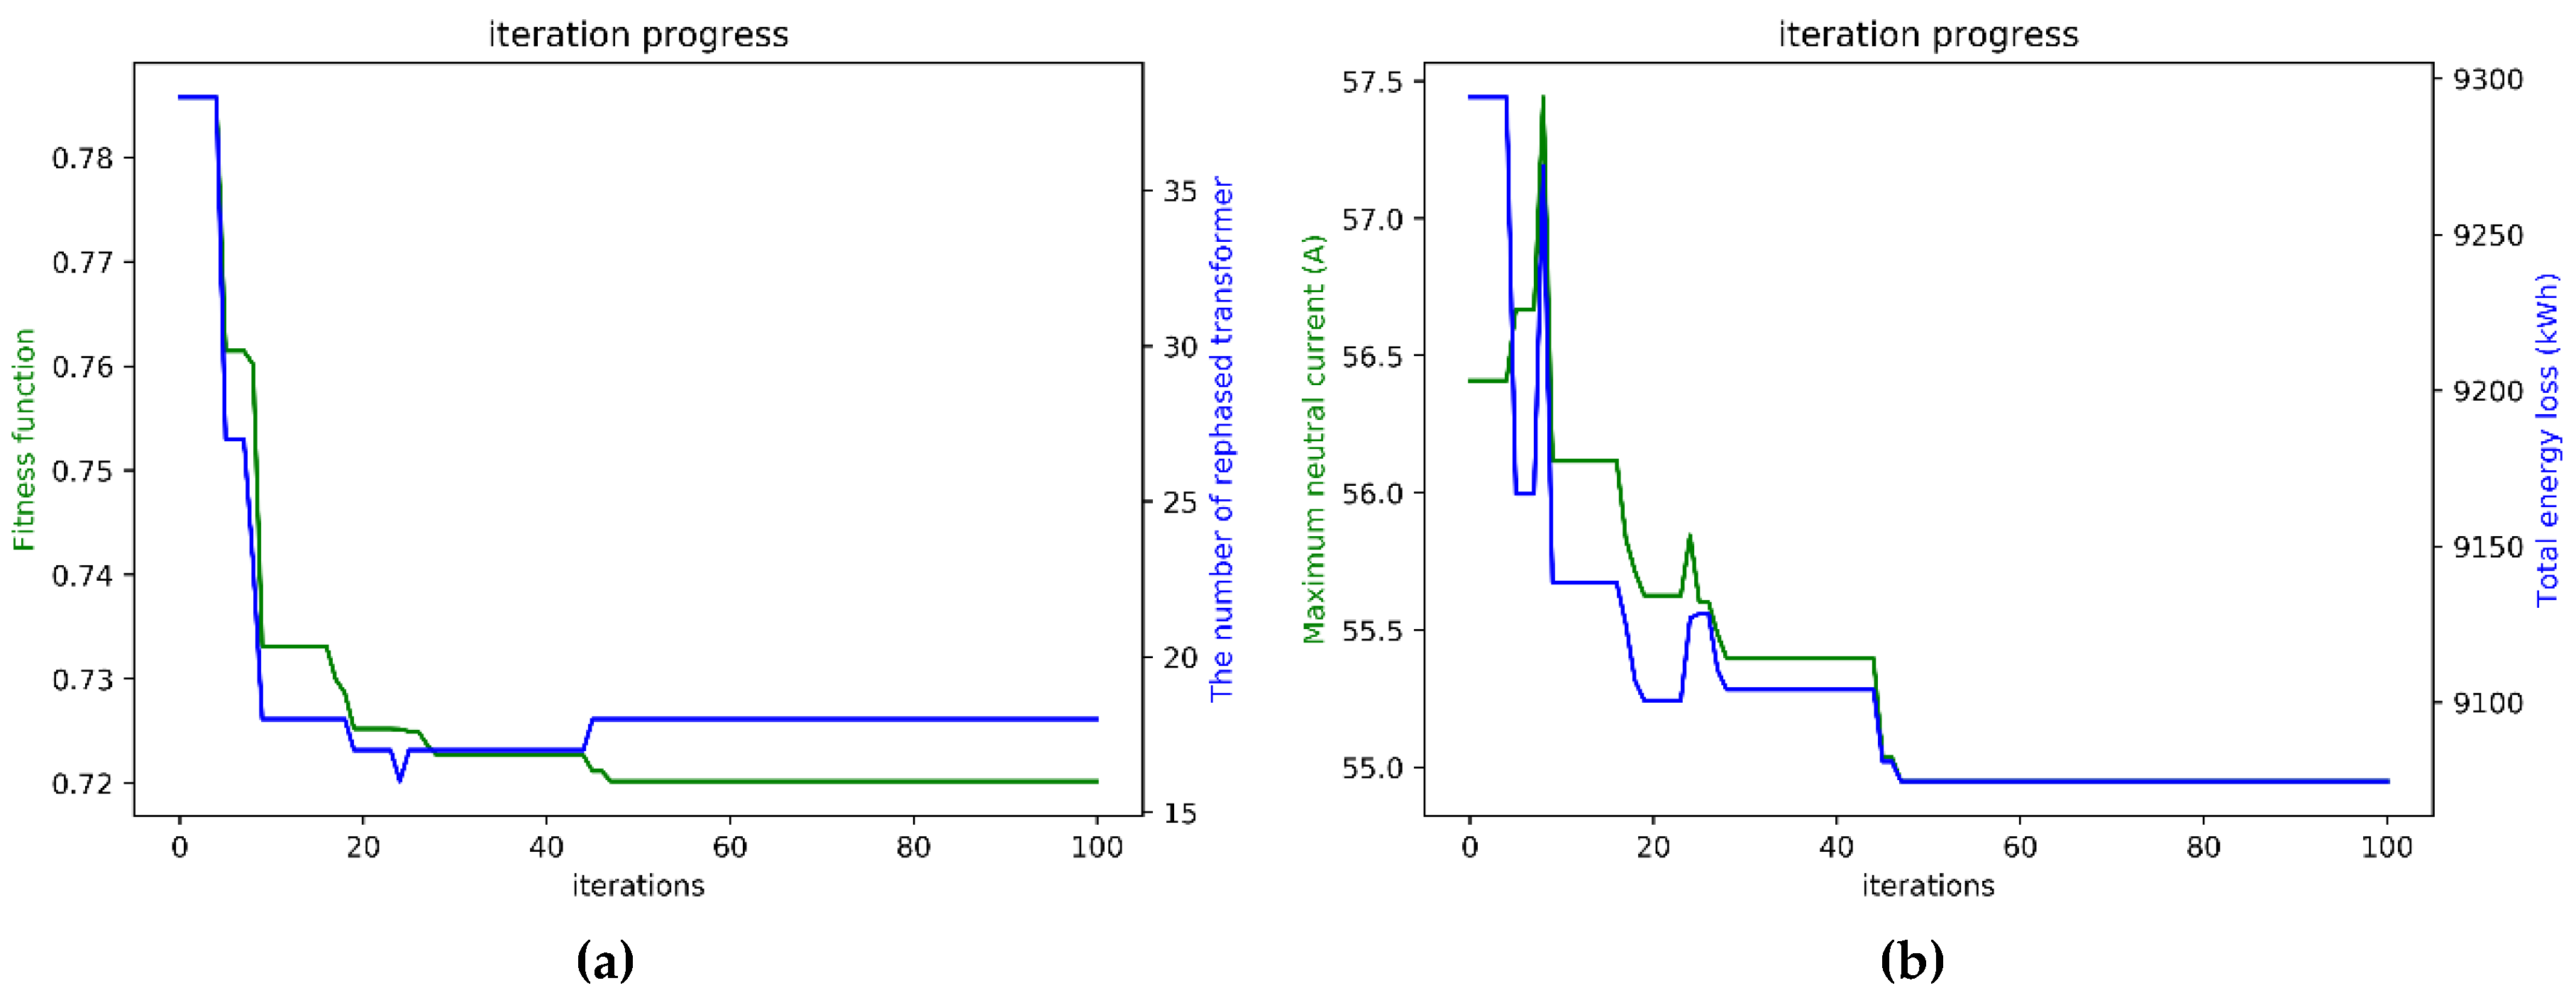
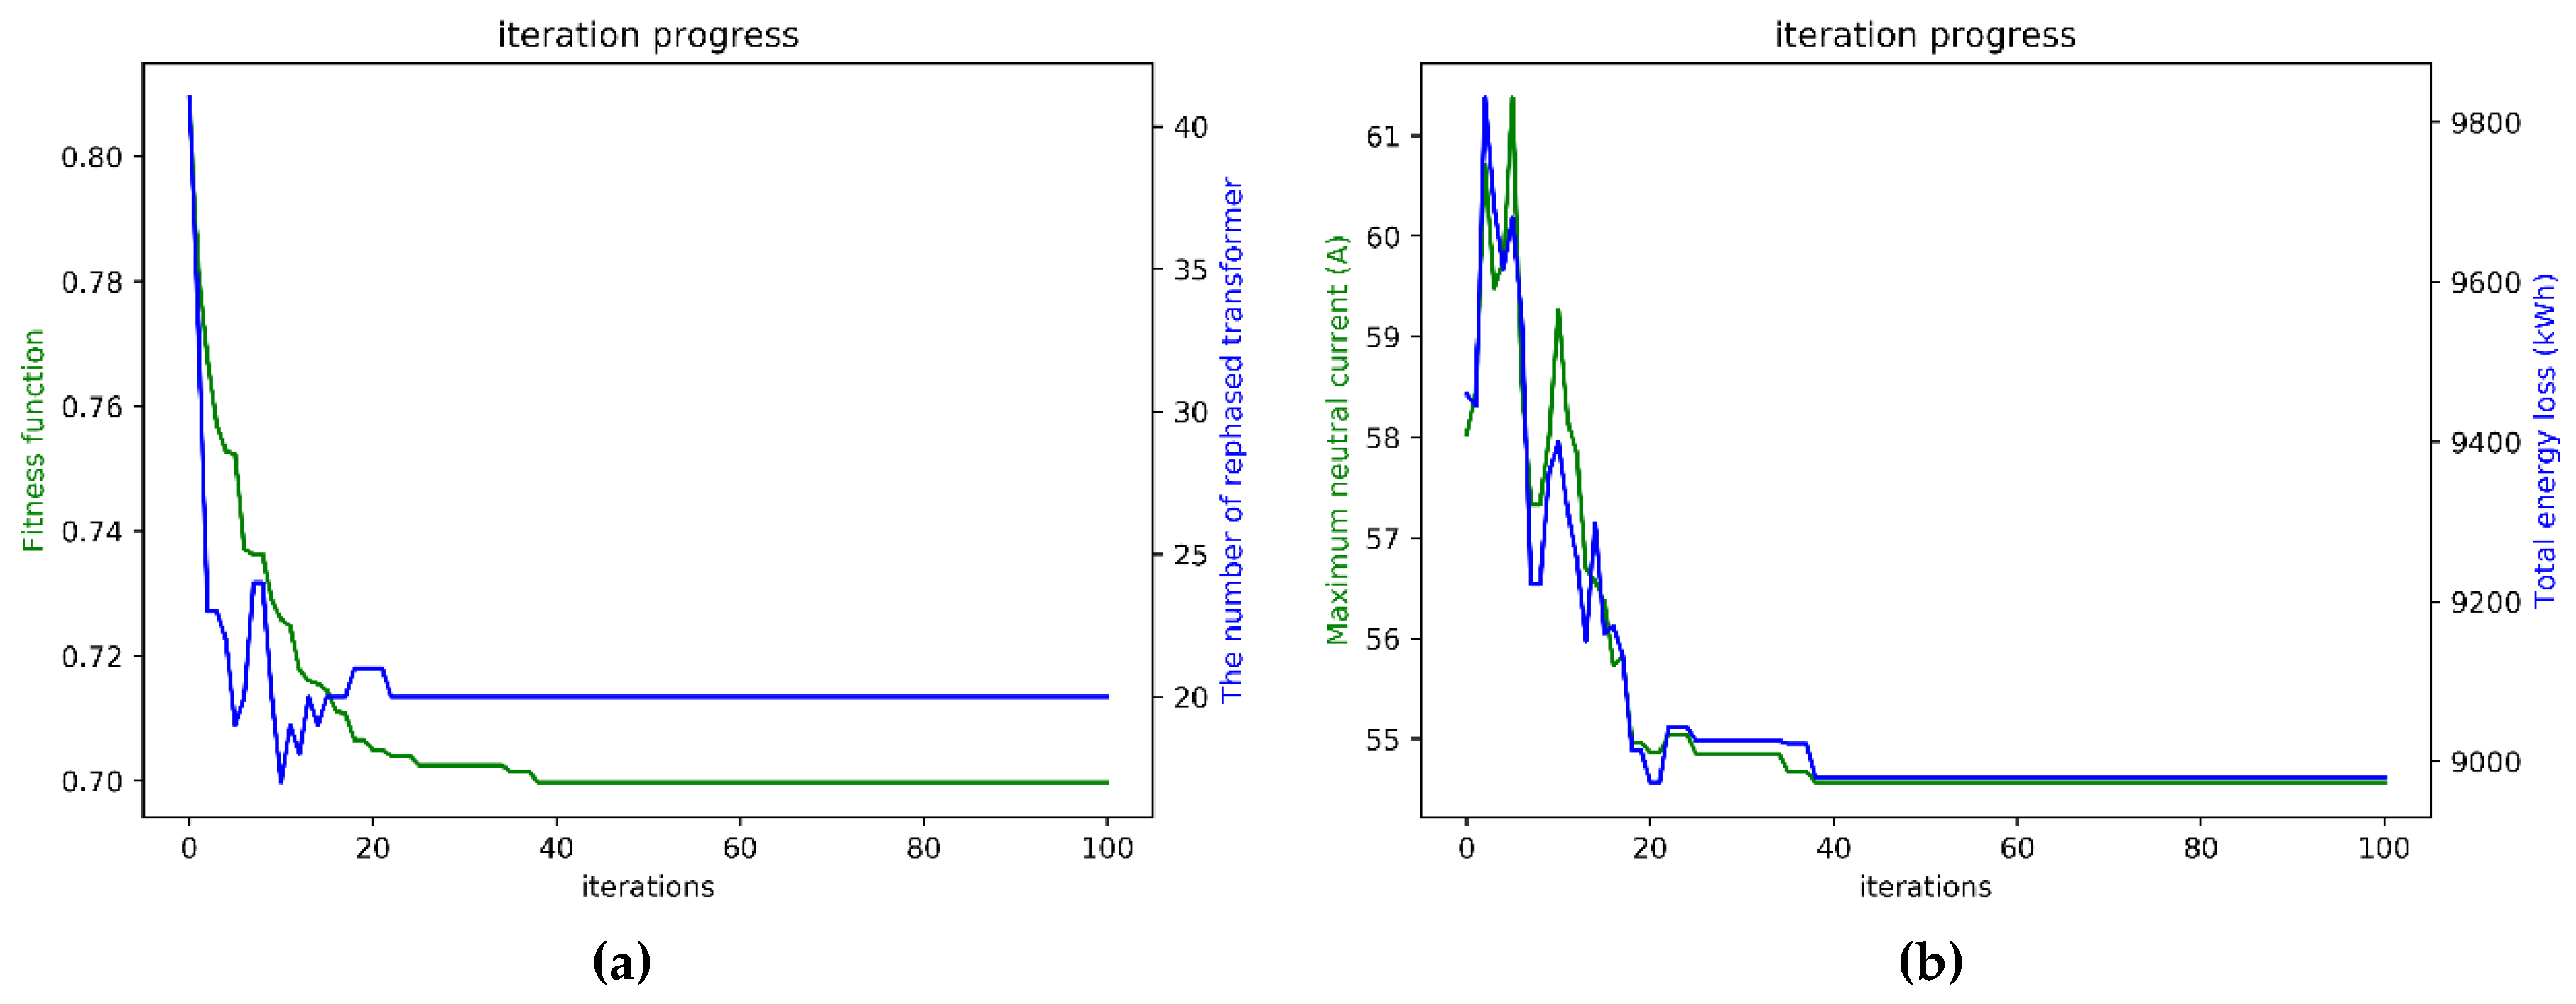
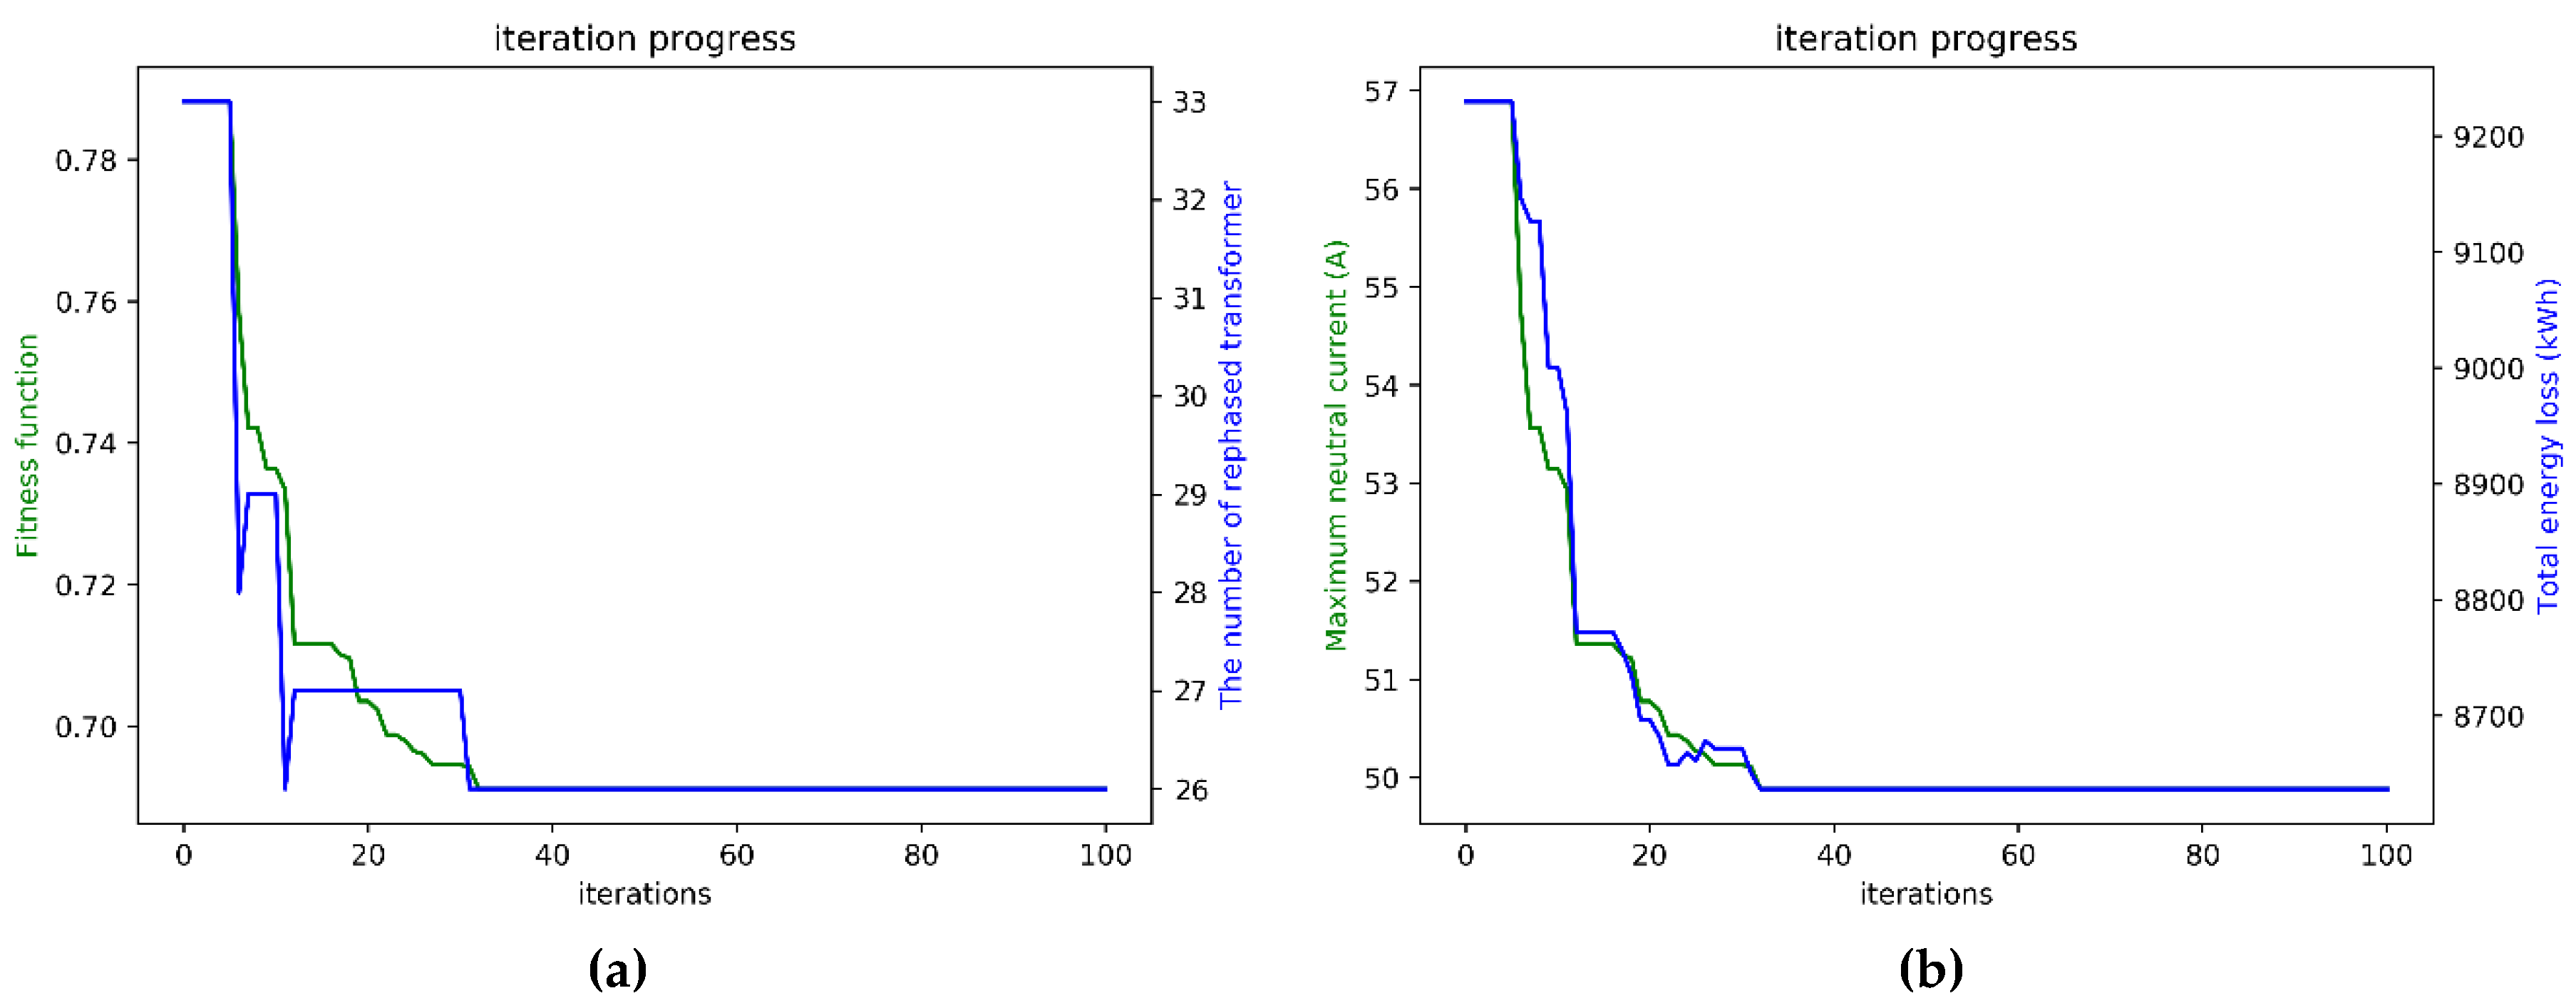
3.2.1. Iterative Convergence Trend

According to the parameters setting in Case 1, in which the neutral current reduction was only considered, the trends of convergence of the proposed multi-purpose fitness function, neutral current, total energy loss, and rephasing number are shown in Figure 10. The fitness function from the initial value to the global optimum value of 0.678675 was below 40 iterations, as shown in Figure 10a. Moreover, the neutral current was reduced from the original value 72.17 A to 48.98 A, which was below 40 iterations, as shown in Figure 10b. These two convergence diagrams are the same because the fitness function equals the neutral current prediction in Case 1. The convergence trend of total energy loss per month is also similar to those shown in Figure 10a,b due to the phase balancing results in neutral current reduction. Therefore, the power loss is decreased under a more balanced condition. The total energy loss from the initial value of 11,317.21 kWh to the global optimum value of 8261.55 kWh is also below 40 iterations, as shown in Figure 10c. Additionally, the trend of the rephasing number from the initial value to the global optimum value of 61 is below 20 iterations, as shown in Figure 10d.

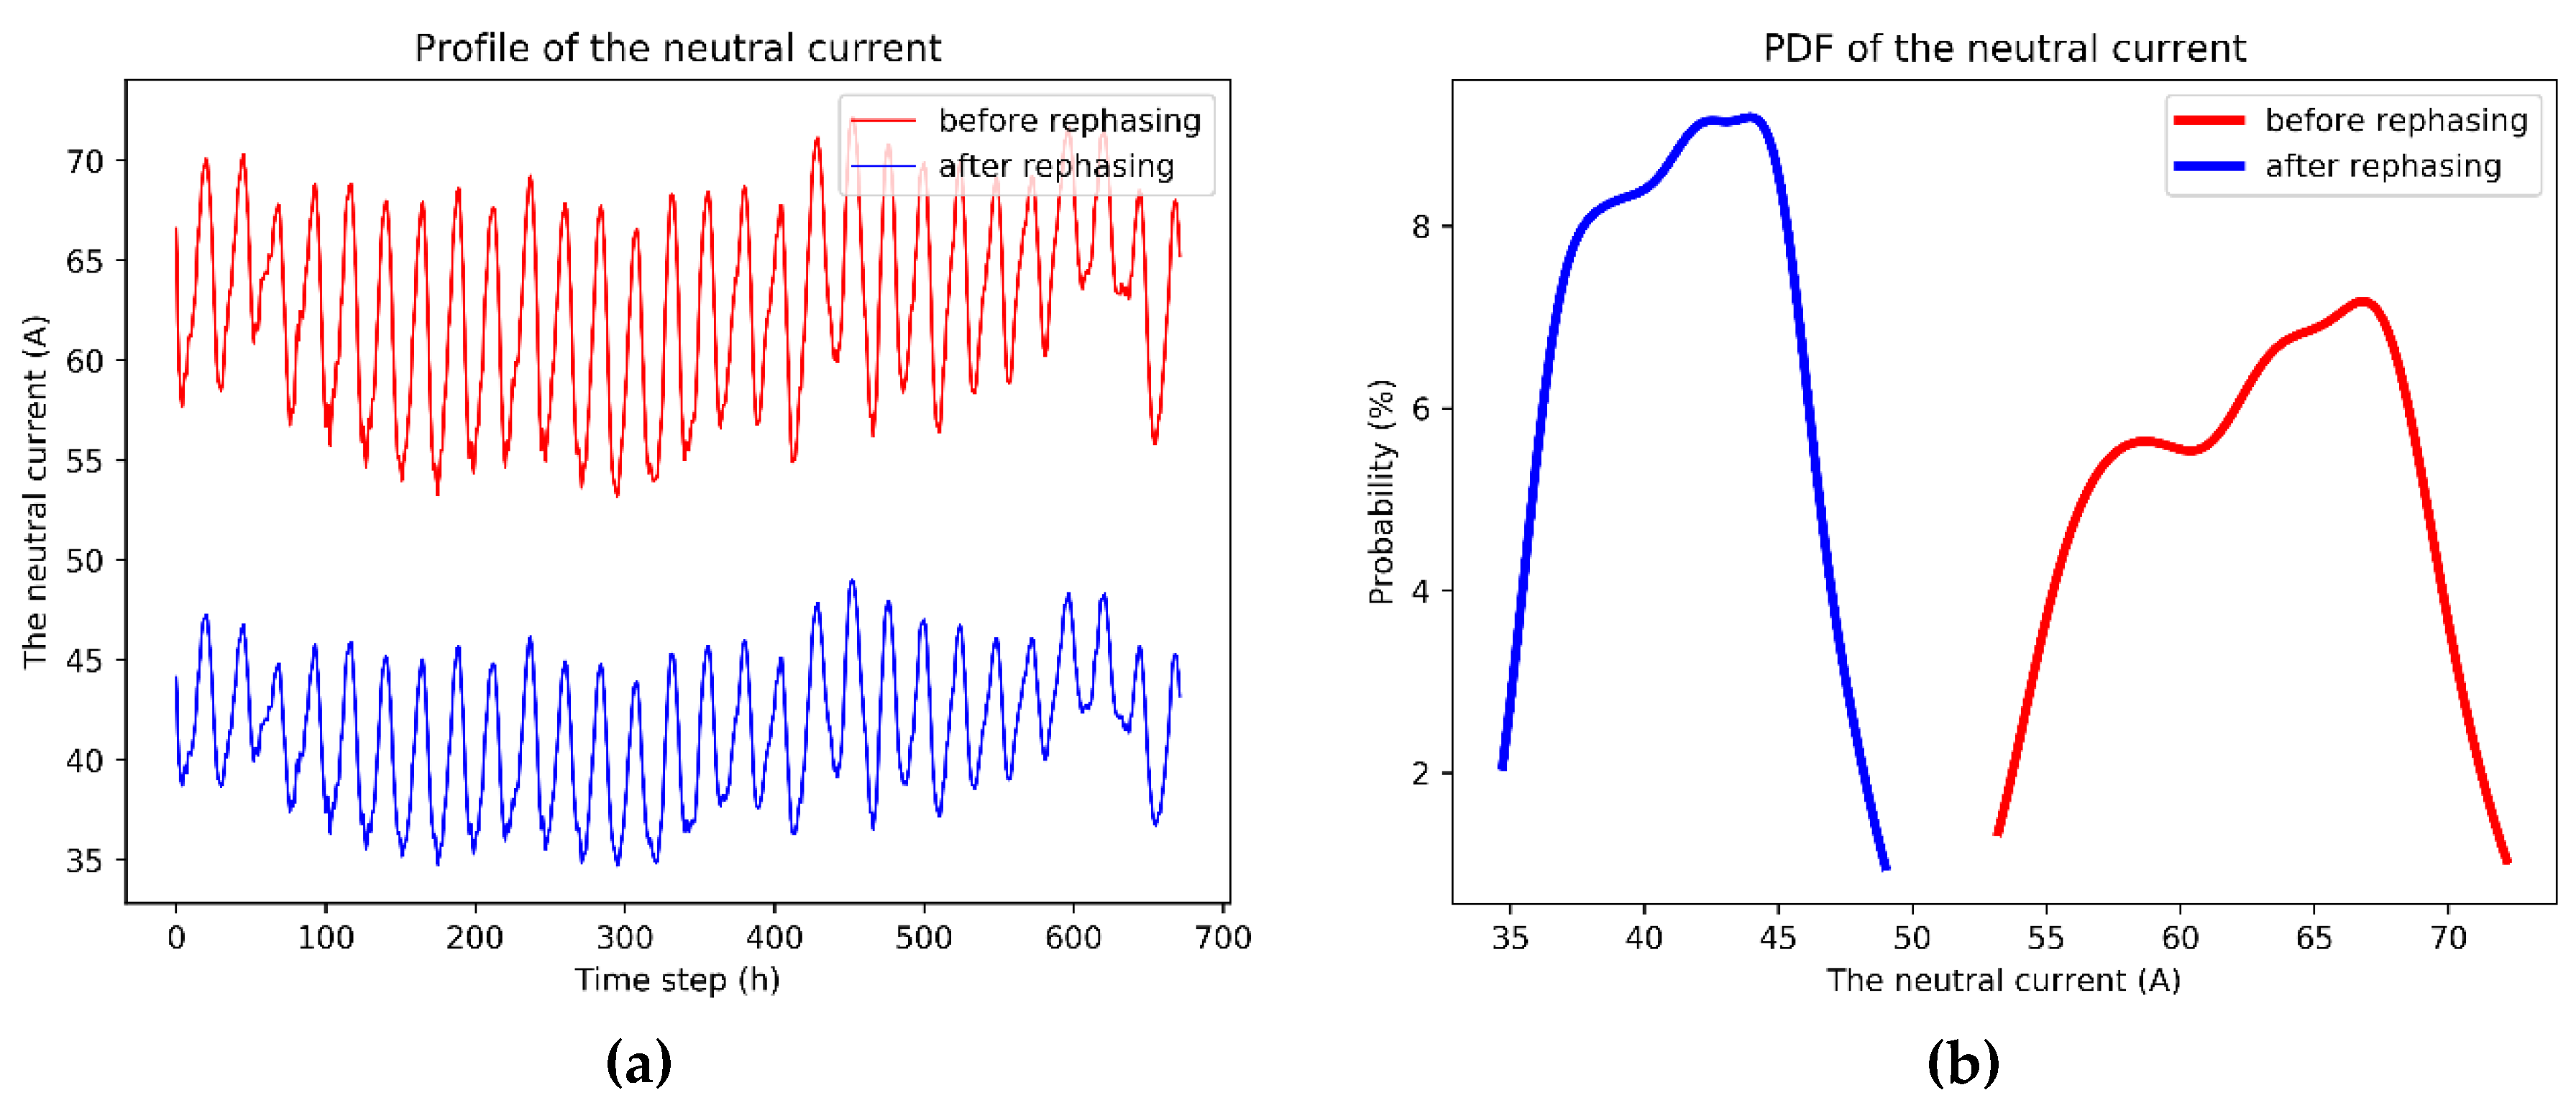
3.2.2. Neutral Current Profile

Figure 11 shows the single line diagram of the LCO protective relay in the three-phase, four-wire distribution systems. The current of LCO is formulated as the three-phase current, which is equal to the neutral current. In Taipower, the LCO relay tripping setting limit value is around 70 A, and the LCO detects the neutral current over 70 A to trip the unbalanced short-circuit fault, which then causes the increased tripping setting limit value of the neutral current. Unfortunately, the unbalanced loading can also lead to high neutral current and the malfunctioning of the LCO. In turn, this can cause unexpected interruption and increase the system average interruption duration index (SAIDI) and system average interruption frequency index (SAIFI) of the power company. Thus, supervisory control should be implemented and the neutral current must be acquired. The objective of this paper was to reduce the neutral current by using the proposed approach. Figure 12a,b indicate the corresponding simulation results of the neutral current spread and probability density function (PDF), which was in the front end of the feeder flow into the LCO, before and after rephasing by the full-scale net load model in one month. In the figures, the horizontal axis represents the time in hour (24 h × 7 day × 4 week = 672 h). The neutral current before rephasing is much higher than that after rephasing; it is over 70 A during some time periods before rephasing but decreased to below 50 A after rephasing. The improvement of neutral current was significant. The neutral reduction before and after the proposed optimal approach can be more clearly seen in Figure 12b. The neutral currents of each line section in the three-phase, four-wire feeder before and after rephasing are illustrated in Figure 13a,b, respectively. The line section numbers from 0 to 50 represent the feeder front to the feeder end. The current unbalanced condition in each line section can also be investigated from these figures.

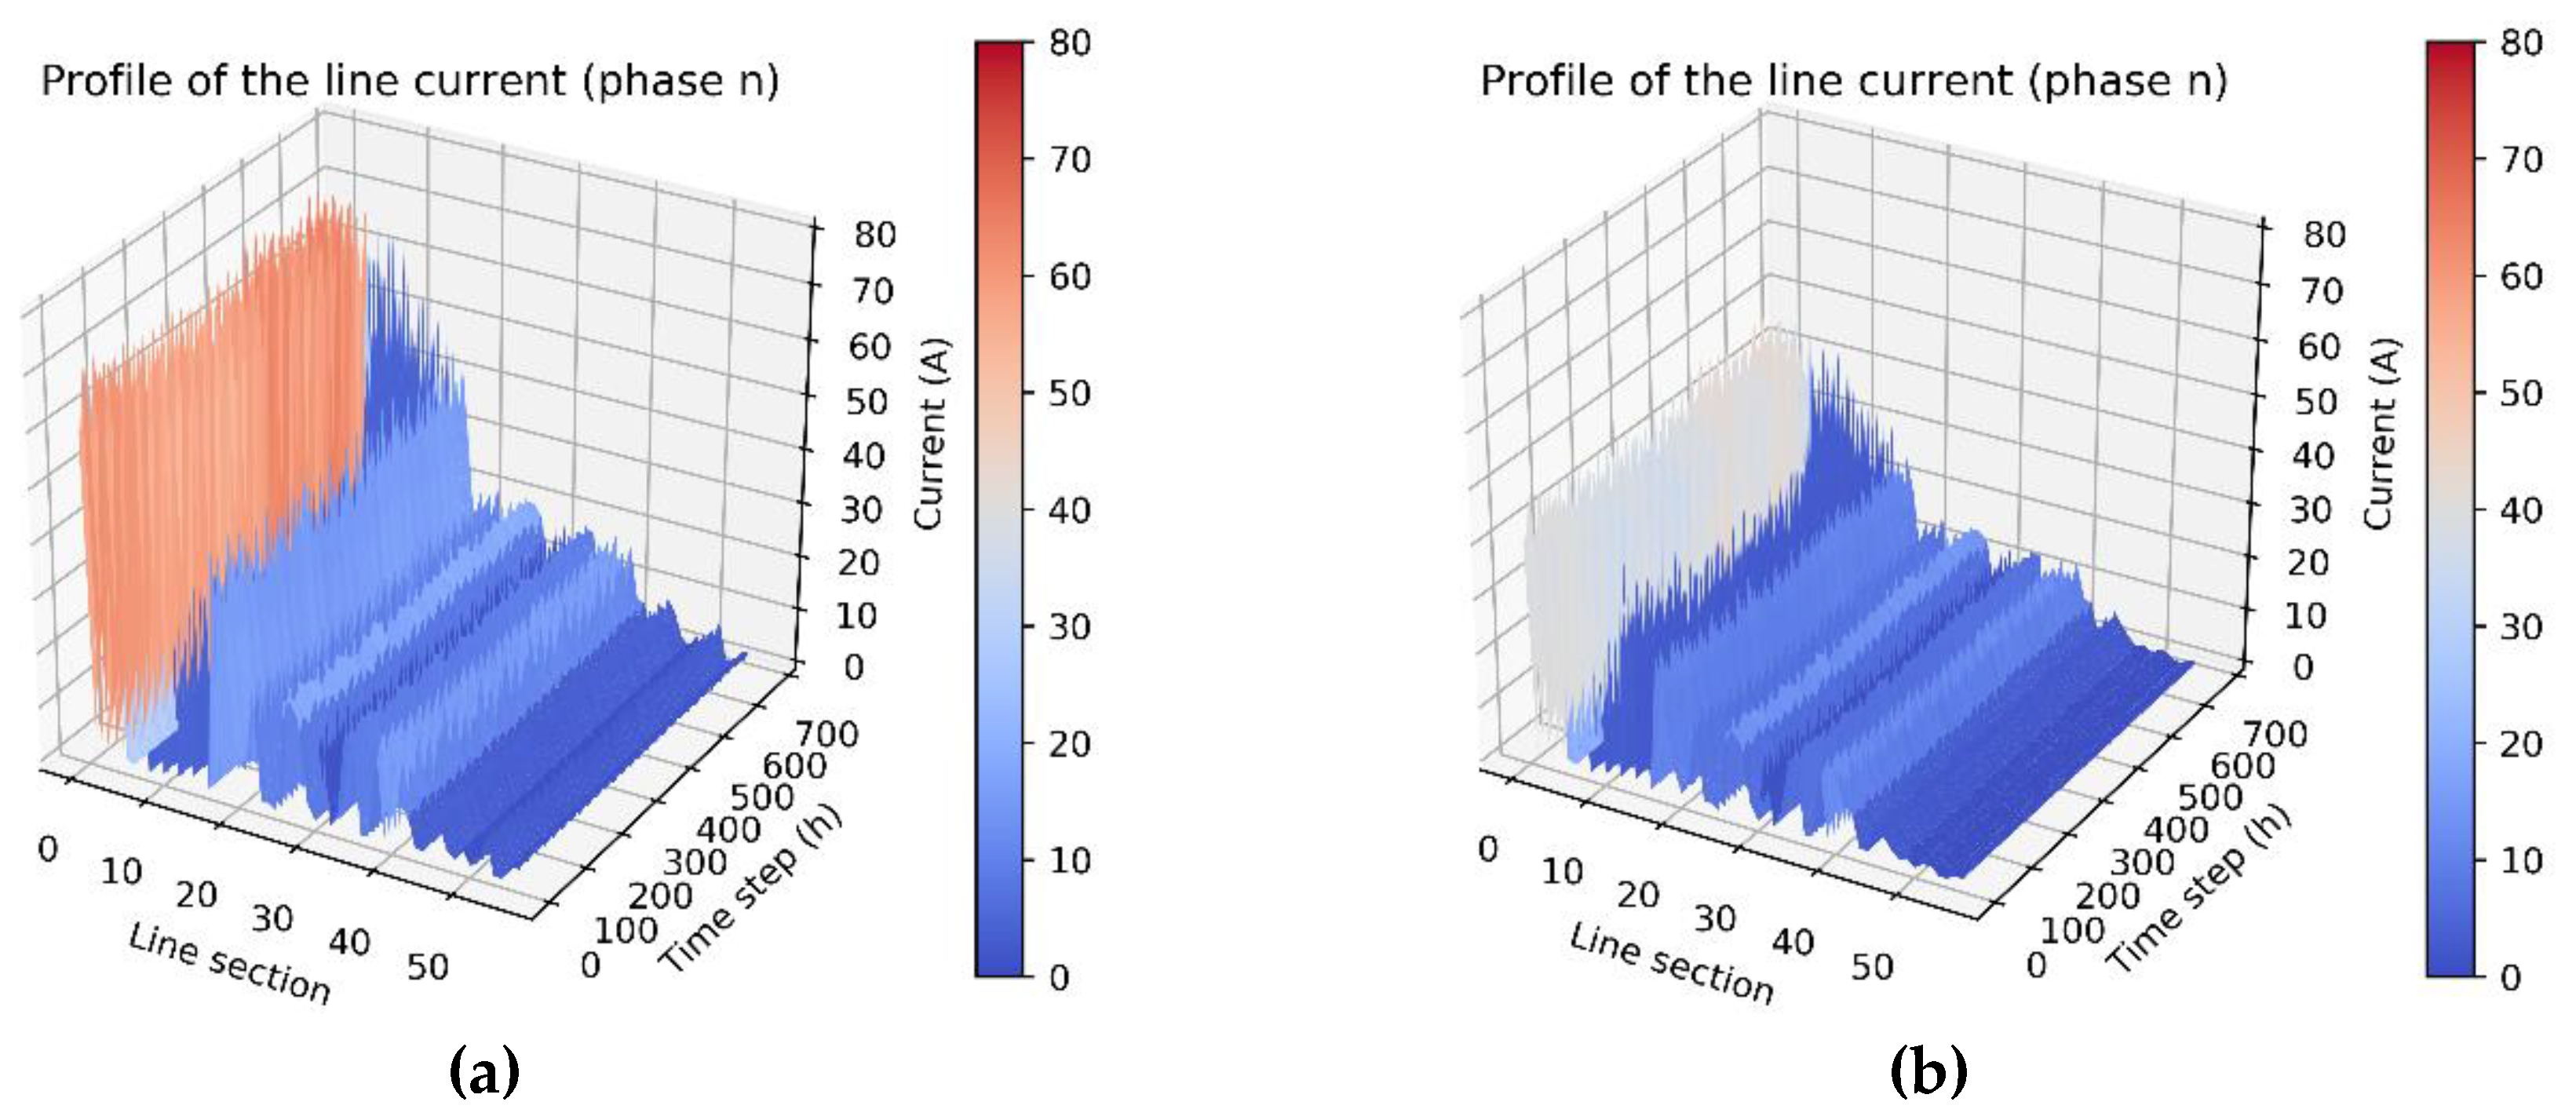
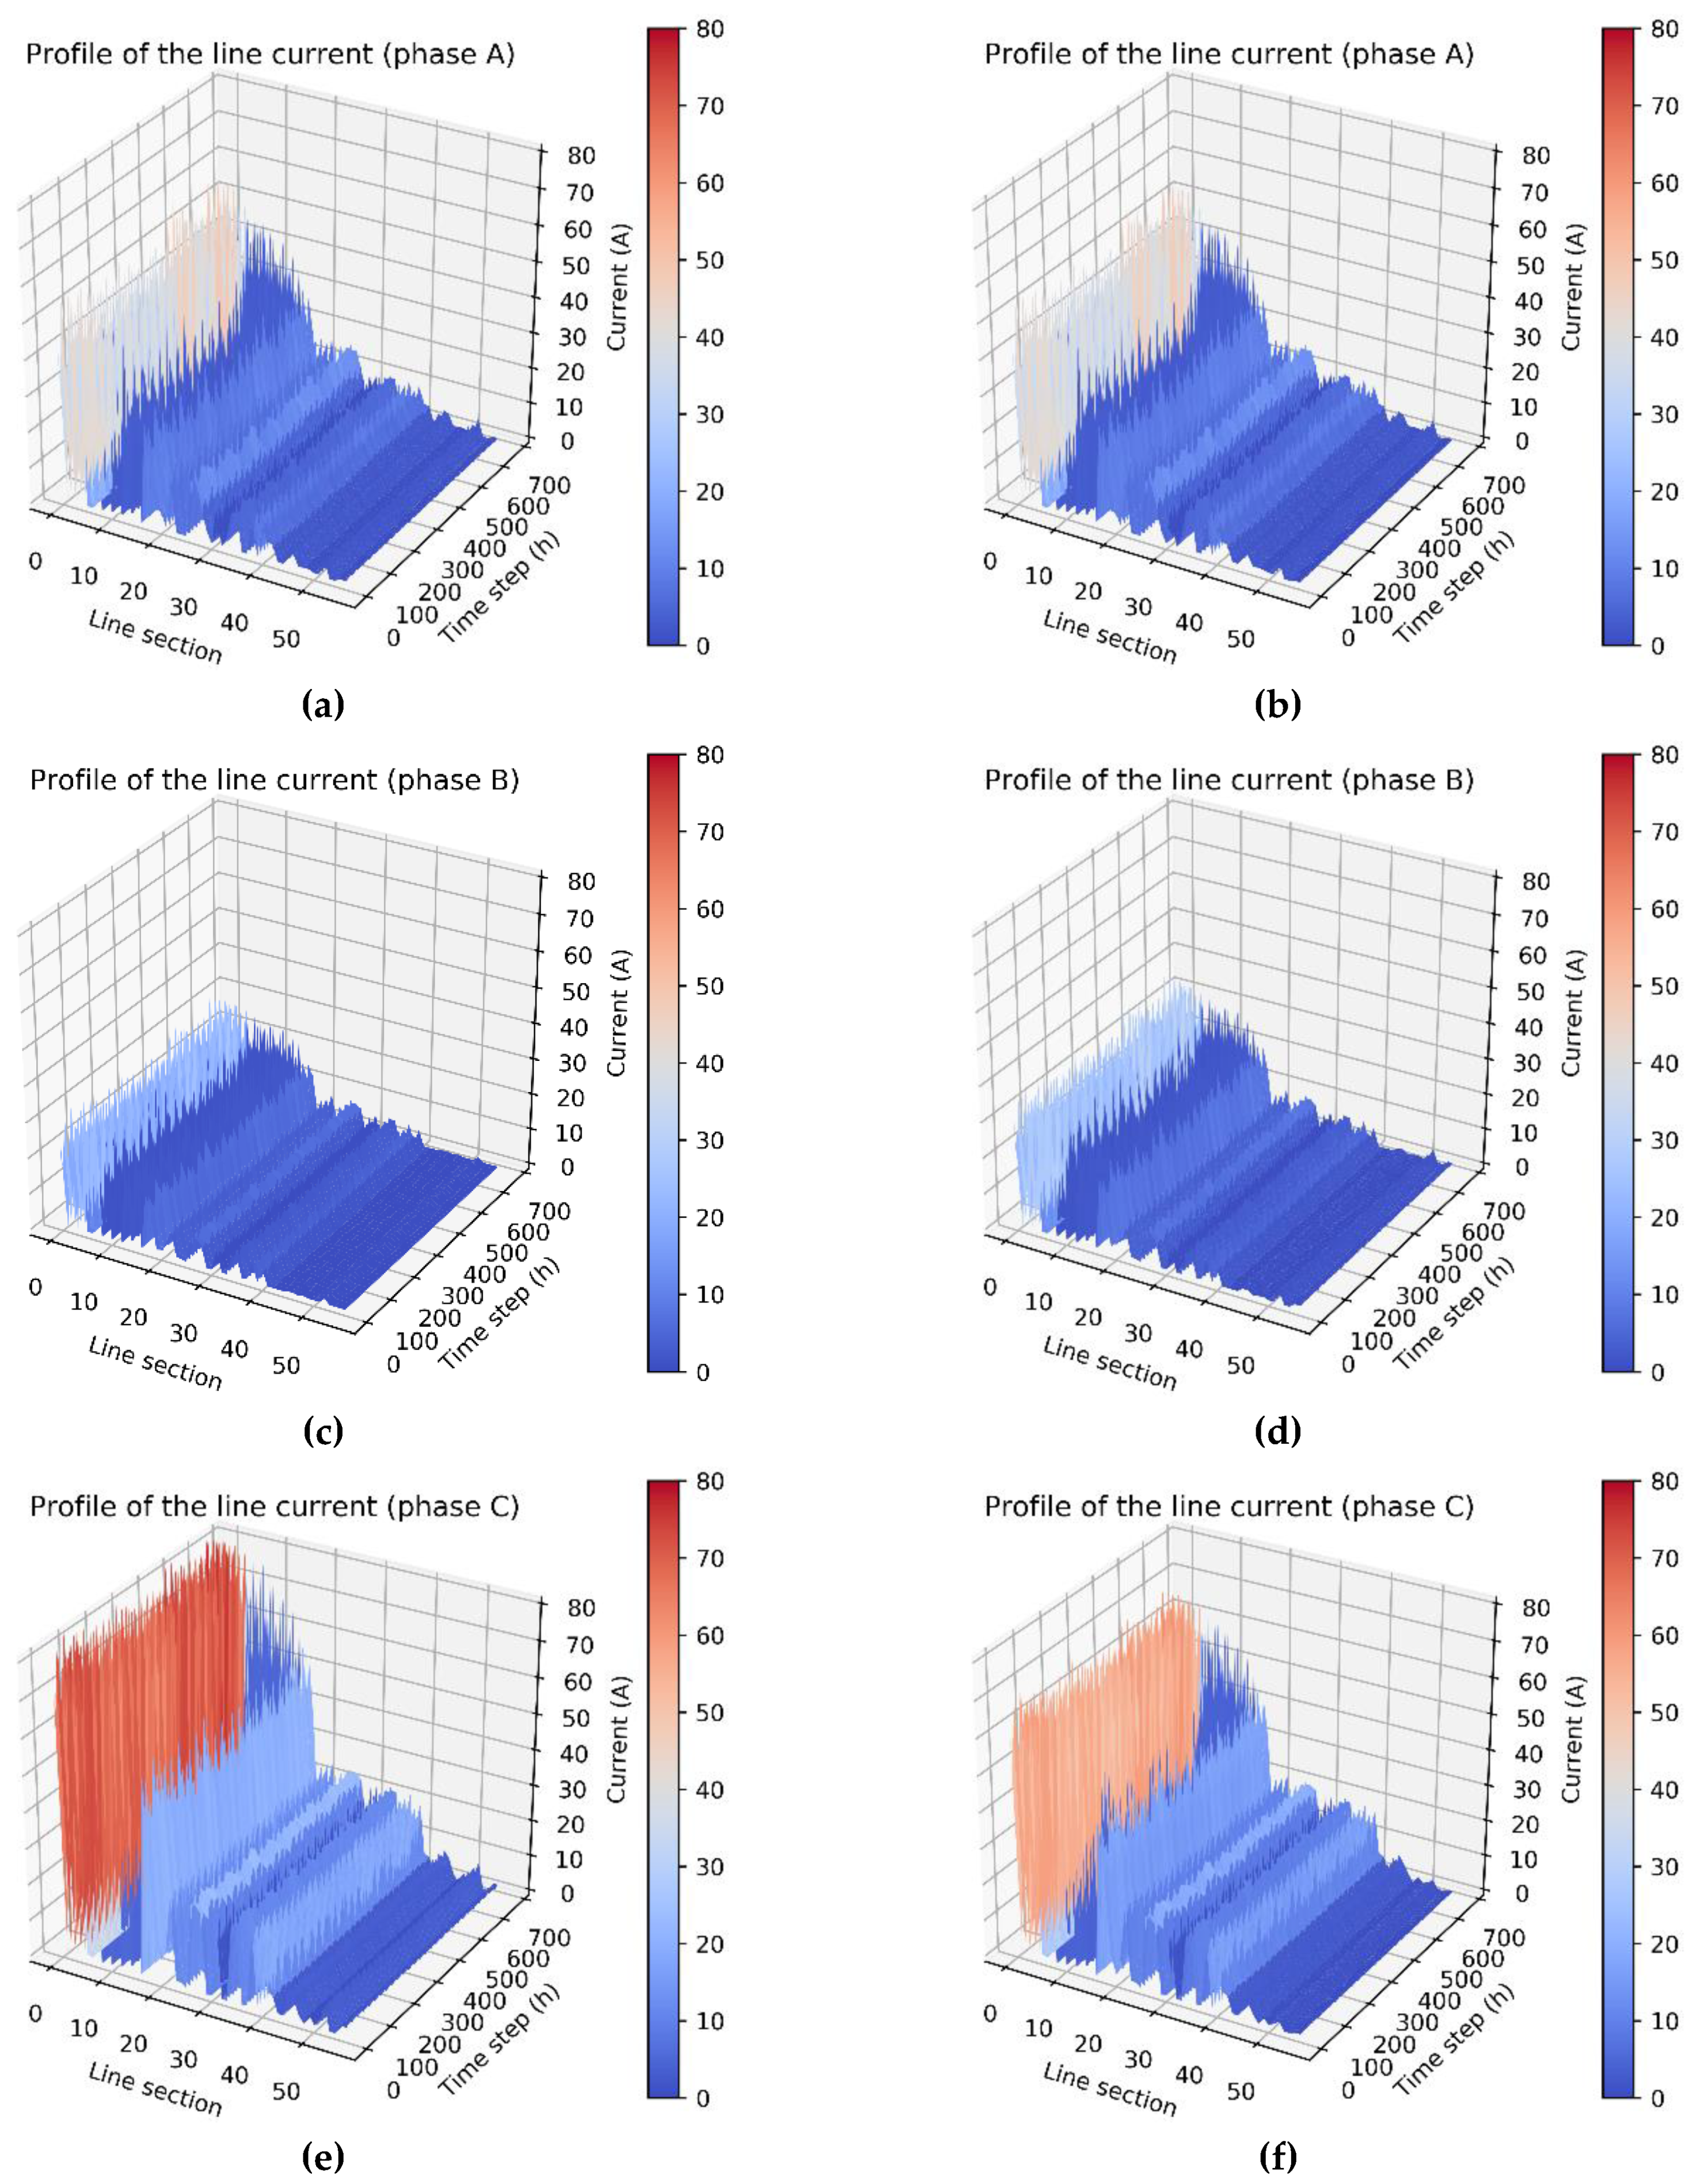
3.2.3. Line Current Profile

Figure 14 depicts the simulation results of the current of each phase in each line section before and after rephasing. The magnitudes of the line current of phases A, B, and C in each line section from the feeder at the secondary side of main transformer in distribution substation to the feeder end of a radial type distribution feeder show a decreasing distribution. In other words, the smaller the distance from the distribution substation, the larger the current becomes. In this study, the loading from heavy to light was as follows: phase C > phase A > phase B, and this corresponded to the magnitude of the line current in each phase. The simulation results shown in Figure 14b,d,f show that the current unbalance of each phase after optimization was better than those shown in Figure 14a,c,d, respectively, before optimization.

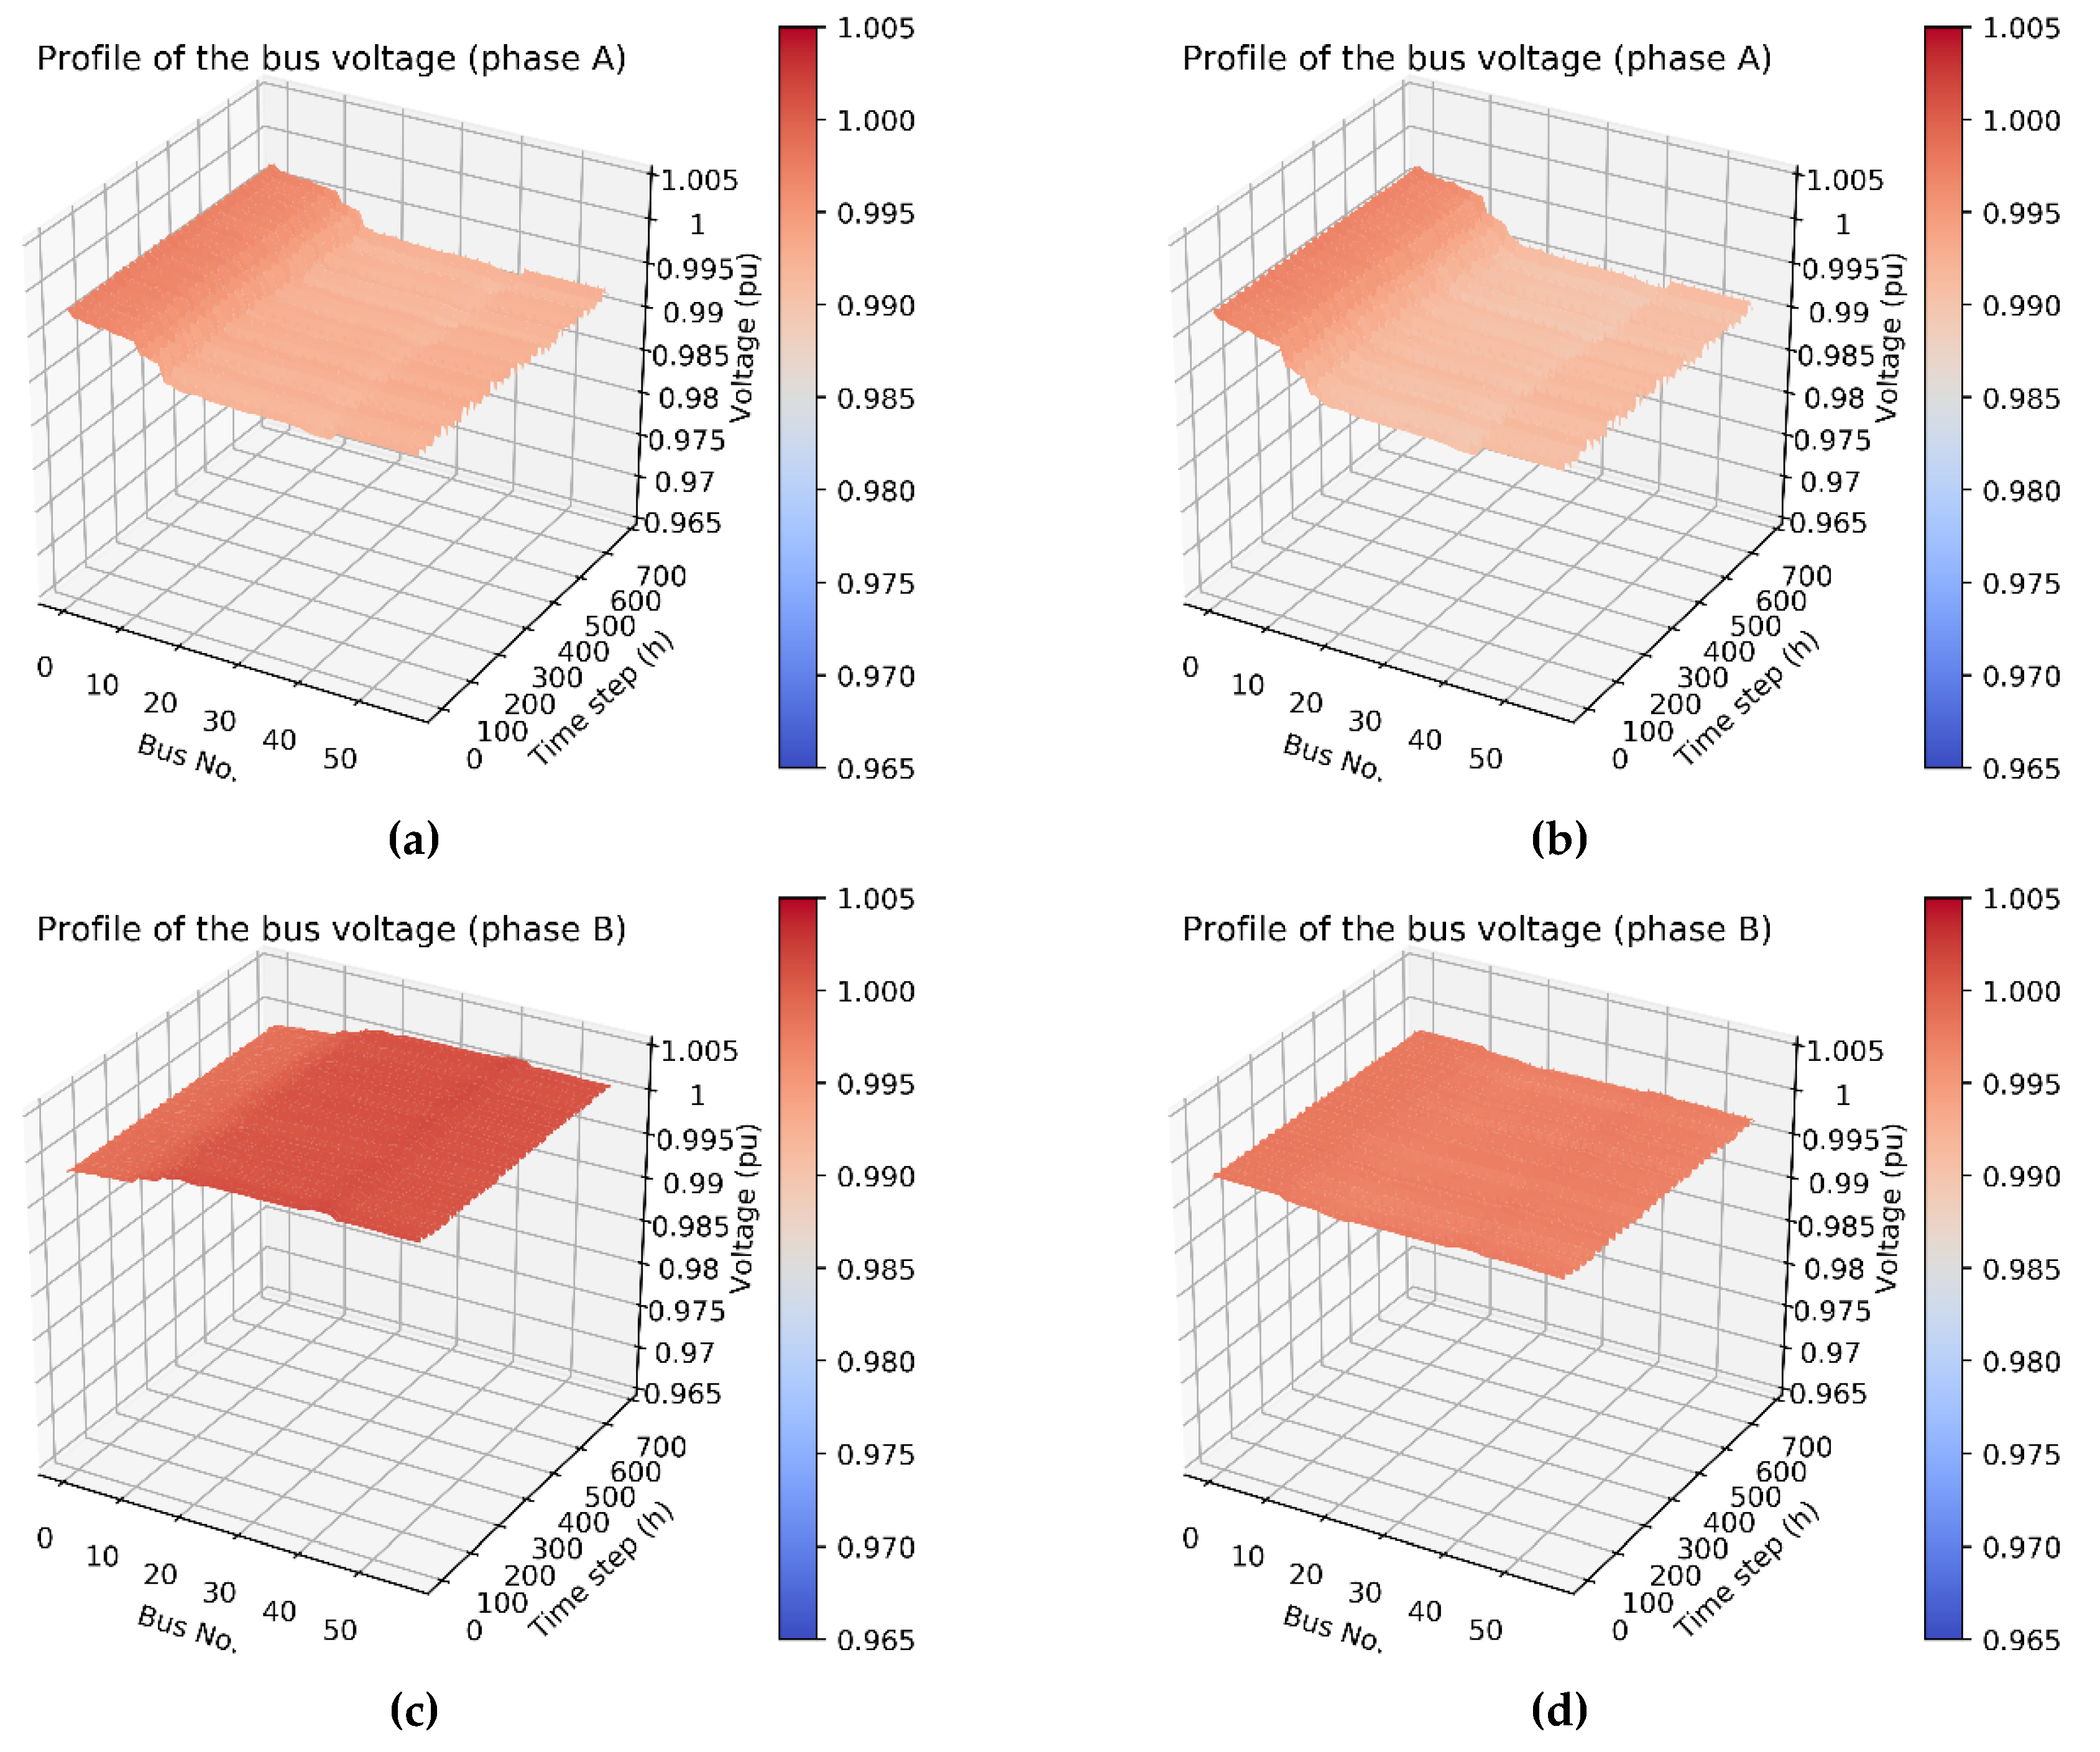
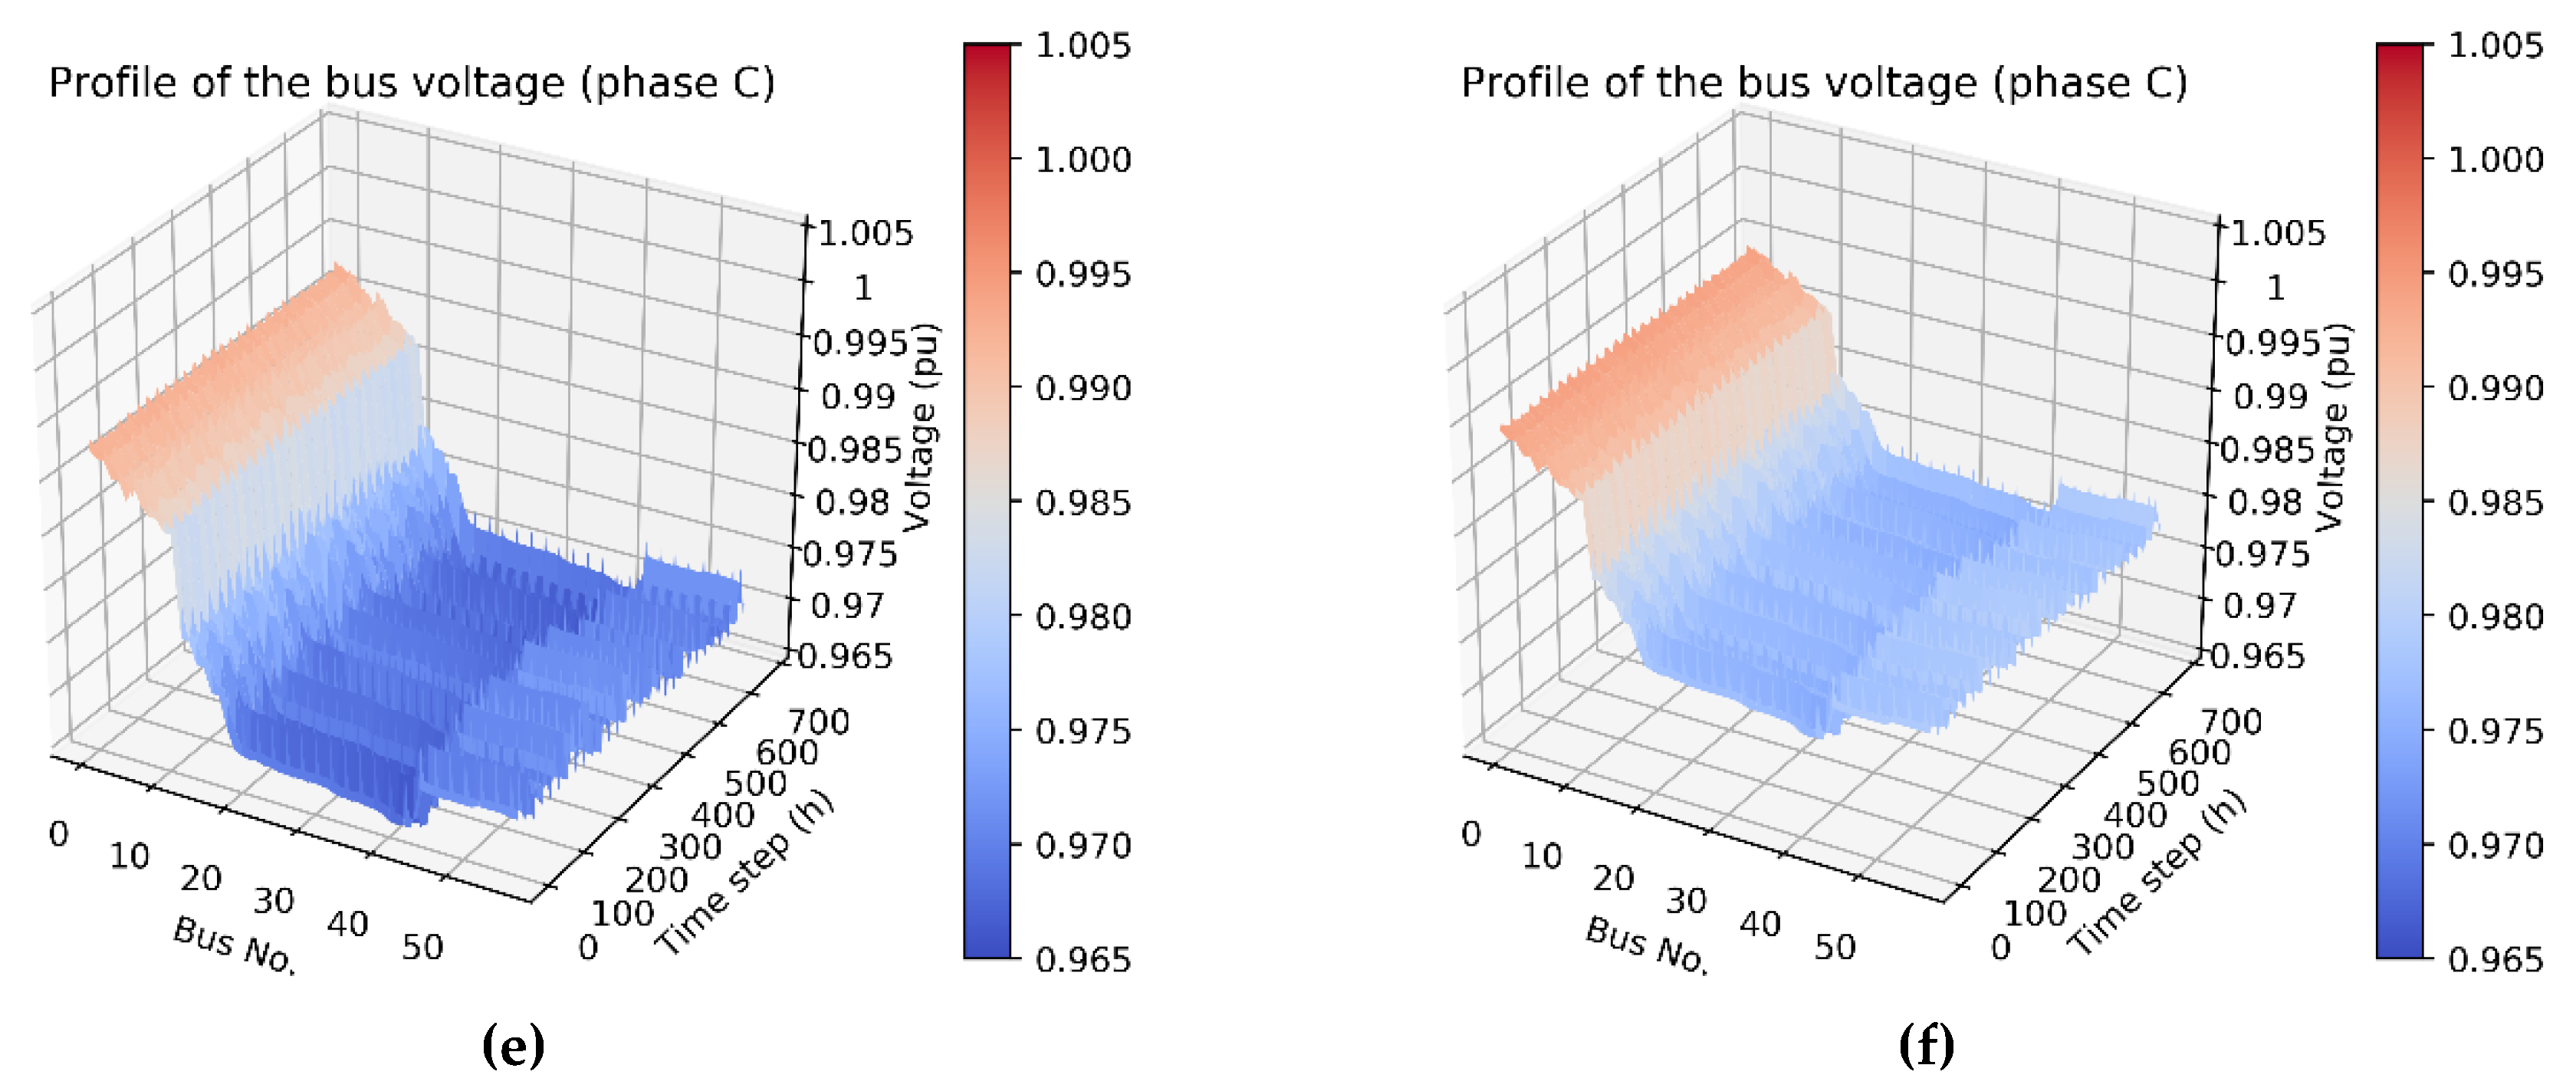
3.2.4. Bus Voltage Profile

Figure 15 illustrates the simulation results of the magnitude of bus voltage of each phase along the feeder main before and after rephasing. The magnitudes of bus voltage of phases A and C decreased from the front to end along the radial type distribution feeder. On the contrary, the magnitude of bus voltage of phase B increased from the front to end along the feeder, which was caused by the induced voltage rise by mutual induction under the unbalanced condition. In this study, the loading from heavy to light was as follows: phase C > phase A > phase B. Thus, the average magnitude of bus voltage from high to low was as follows: phase B > phase A > phase C. The simulation results of Figure 15b,d,f show that the voltage unbalance of each phase after optimization was better than those shown in Figure 15a,c,d, respectively, before optimization. In addition, according to the symmetrical components method, introduced by Dr. C. L. Fortescue in 1918, V0, V1, and V2 denote the zero- positive-, and negative-sequence voltage components, respectively. The zero- and negative-sequence voltage unbalance factors are defined in Equations (10) and (11), respectively. These two unbalance factors can completely reflect the voltage unbalance phenomenon caused by magnitude and phase angle deviation. Consequently, the zero- and negative-sequence voltage unbalance factors were used to estimate the performance of the proposed approach in this paper. The simulation results show that the maximum values of the zero- and negative-sequence voltage unbalance factors were near 1.7% before rephasing, but decreased to below 0.3% after rephasing (Figure 16).
D 0 = | V 0 | | V 1 | × 100 %
D 2 = | V 2 | | V 1 | × 100 %

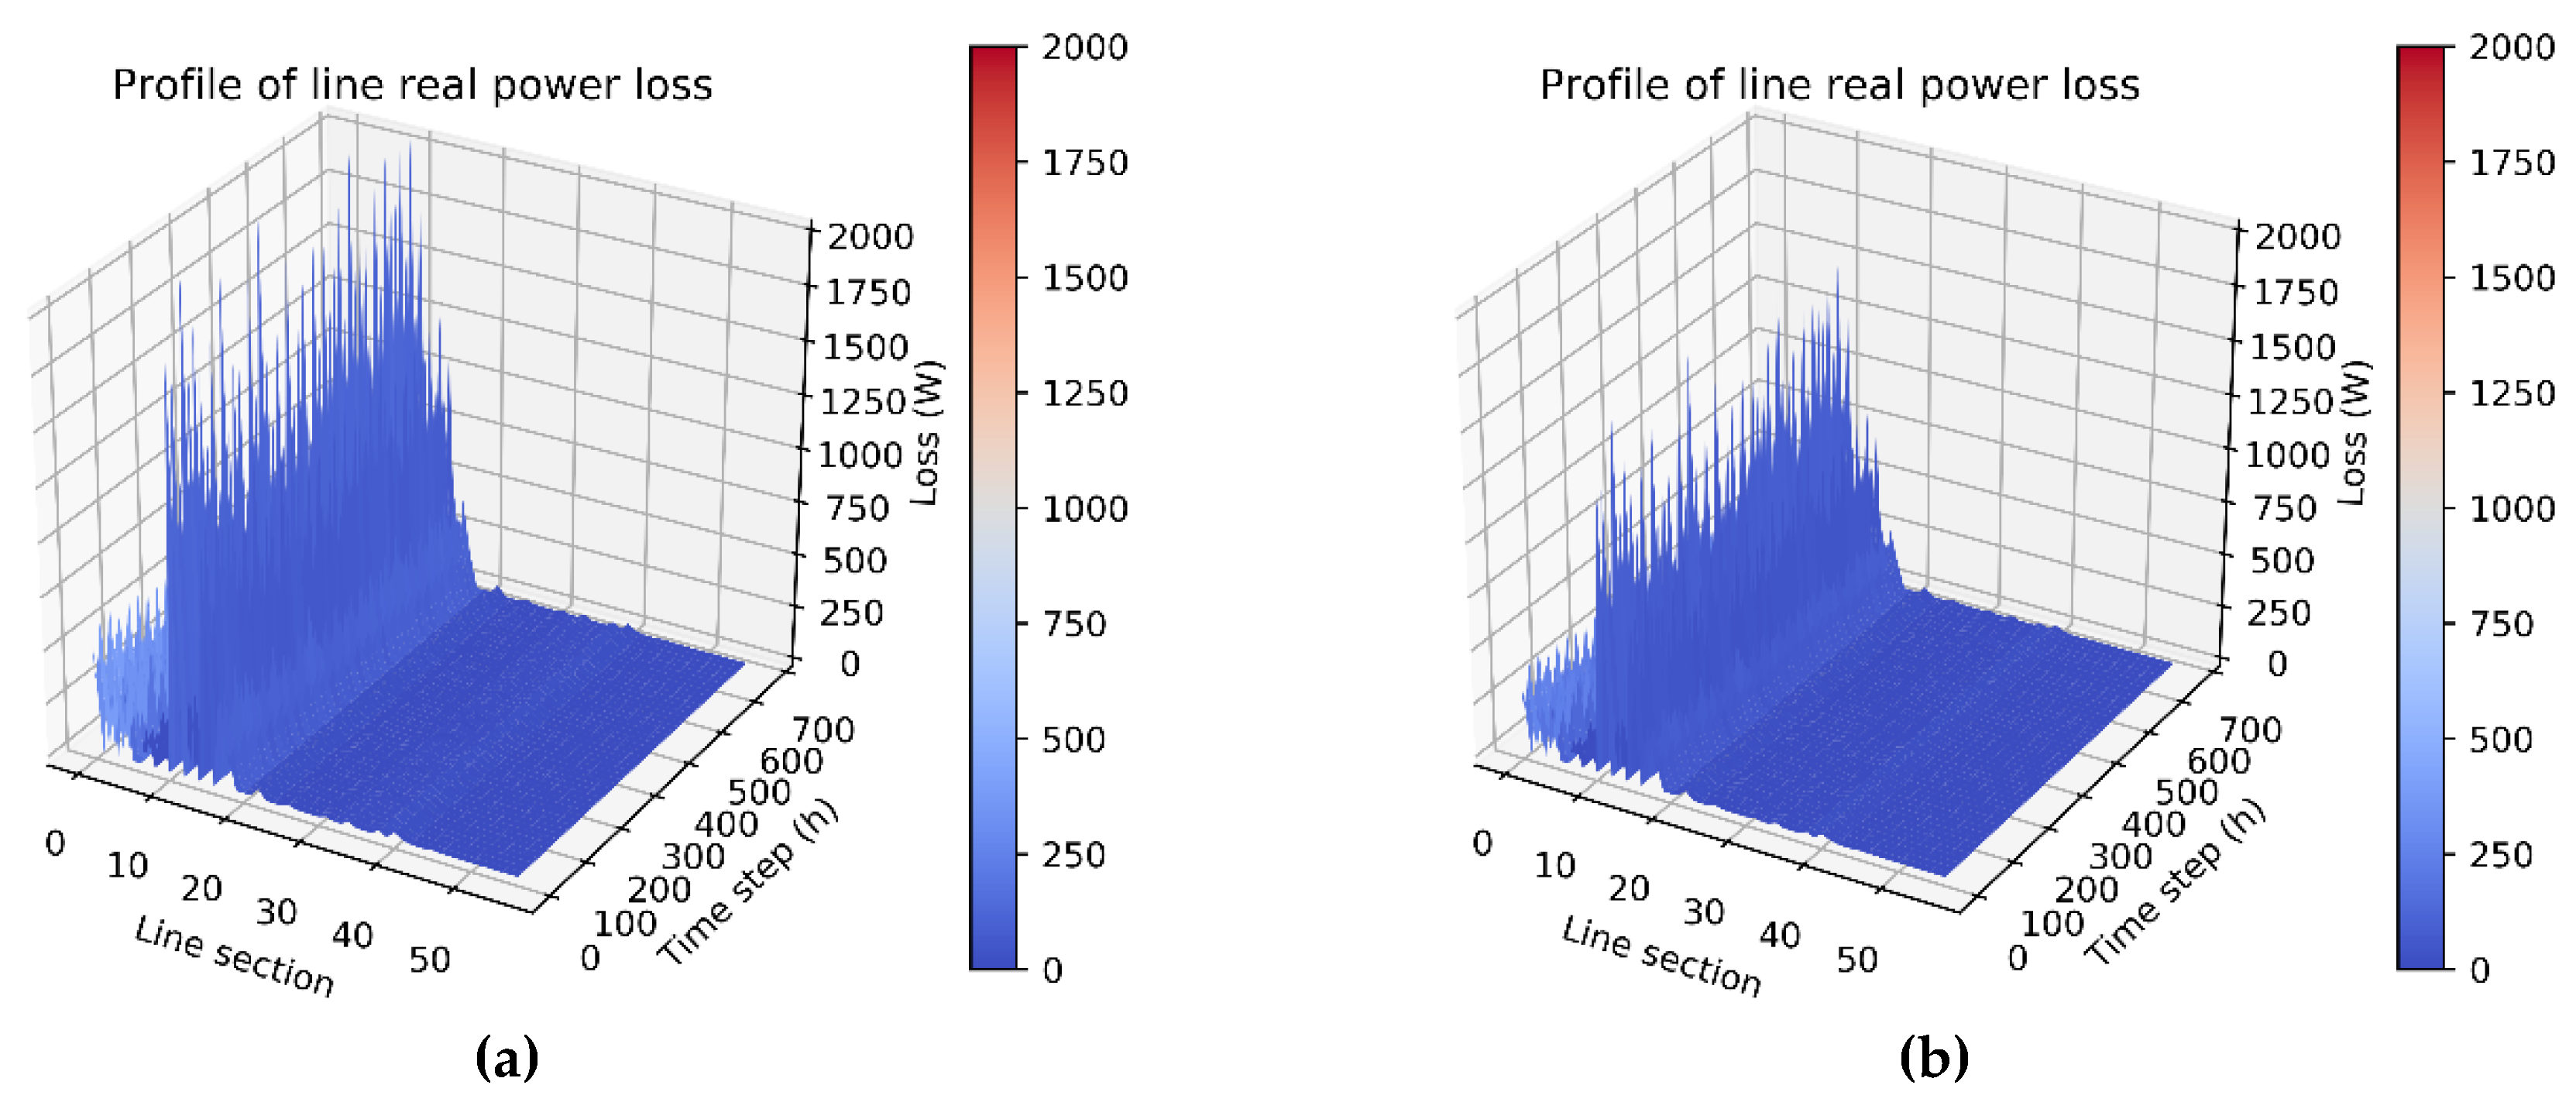
3.2.5. Power Loss Profile

As stated earlier, the higher the neutral current, the greater the three-phase unbalance, which then causes extra power loss. Figure 17 depicts the simulation results of the total three-phase power loss in each line section before and after rephasing. The numerical value in each line section reflects the magnitude of the current and the three-phase unbalance ratio. The simulation results in Figure 17b show that the overall power loss after optimization was smaller than that before optimization, as shown in Figure 17a.

3.3. Discussion

Based on the numerical results of Case 1, the proposed algorithm was proven to be a feasible approach to reduce neutral current, thereby balancing the three-phase current, improving voltage quality, reducing energy loss, and increasing efficiency. Due to the fact that phase balancing is dependent on the distribution network topology, the load distribution, the monthly loading, and the connection of the distribution transformer, the weighting value can be adjusted to obtain the optimal rephasing strategy. Except for Case 1 and Case 4 with different swarm size only for the optimal neutral current, the simulation results of Case 2 for the optimal neutral current and rephasing number are shown in Figure 18, and the simulation results of Case 3 for the optimal neutral current, power loss, and rephasing number are shown in Figure 19, and the results of Case 4 are shown in Figure 20.
Table 2 lists the values of fitness function, maximum neutral current, monthly energy loss, and rephasing numbers of the original and four cases to evaluate the performance of the proposed multi-objective function. The optimal phase arrangement comparisons of four cases with the original condition is listed in Table 3. As can be seen, the maximum neutral current of Case 1 was the smallest among the four cases, because of the weighting w 1 = 1 and those of w 2 and w 3 , which were zero. In Case 2, the weightings were adjusted to reduce the rephasing number: w 1 = 0.8, w 2 = 0.2, and w 3 = 0. The simulation results show that the rephasing number reduced to 18; however, the neutral current and energy loss increased. Additionally, a compromise weighting setting was Case 3, and the simulation results reflected the setting value. Furthermore, the difference of parameters setting between Case 1 and Case 4 was only the swarm size, and the result of neutral current reduction of Case 4 was slightly greater than that of Case 1; similarly, the maximum neutral current of Case 4 was smaller than Case 2 and Case 3. It is worth noting that the decision of the swarm size of the PSO should be carefully evaluated on a case by case basis.

4. Conclusions

In this paper, a monthly full-scale net load model derived from the FTU measurement data and predicted by LSTM was used to reduce the neutral current via phase arrangement optimization by PSO. The proposed multi-objective function, which is composed of neutral current, power loss, and rephasing number, was applied to solve the optimal phase arrangement problem of a practical unbalanced distribution feeder. The simulation results demonstrated that the proposed approach had good performance in terms of reducing the neutral current and avoiding the malfunction of the LCO protective relay. Clearly, the phase balancing achieved using this approach is superior to that of the original condition after optimal rephrasing. Furthermore, the monthly energy loss is reduced dramatically. The full scope of the next-month system status can be explored by the month-ahead forecasting load data before and after rephasing. Consequently, the proposed approach is helpful for improving system operation efficiency and is worthy of practical application in the regular operations of real-life distribution systems.

Author Contributions

The initial idea and formula derivation of the proposed approach for neutral current reduction was done by W.-T.H. and Y.-D.L. The LSTM algorithm was coded by H.-C.C., and the optimal phase arrangement algorithm was coded by W.-C.L. The authors J.-L.J. and Y.-H.H. evaluated the simulation results and corrected the manuscript. All authors have read and agreed to the published version of the manuscript.

Funding

The authors would like to acknowledge the financial support of the Institute of Nuclear Energy Research of Taiwan through its grant NO. 109A010.

Acknowledgments

The authors would like to acknowledge the financial support of the Institute of Nuclear Energy Research of Taiwan through its grant NO. 109A010.

Conflicts of Interest

The authors declare no conflict of interest.

References

  1. Siddique, A.; Yadava, G.; Singh, B. Effects of voltage unbalance on induction motors. In Proceedings of the Conference Record of the 2004 IEEE International Symposium on Electrical Insulation ELINSL-04, Indianapolis, IN, USA, 19–22 September 2005; pp. 26–29. [Google Scholar]
  2. Weckx, S.; González, C.; Driesen, J. Reducing grid losses and voltage unbalance with PV inverters. In Proceedings of the 2014 IEEE PES General Meeting|Conference & Exposition; Institute of Electrical and Electronics Engineers (IEEE), National Harbor, MD, USA, 27–31 July 2014; pp. 1–5. [Google Scholar]
  3. Otcenasova, A.; Bolf, A.; Altus, J.; Regula, M. The Influence of Power Quality Indices on Active Power Losses in a Local Distribution Grid. Energies 2019, 12, 1389. [Google Scholar] [CrossRef] [Green Version]
  4. Farughian, A.; Kumpulainen, L.; Kauhaniemi, K. Earth Fault Location Using Negative Sequence Currents. Energies 2019, 12, 3759. [Google Scholar] [CrossRef] [Green Version]
  5. Lowczowski, K.; Lorenc, J.; Andruszkiewicz, J.; Nadolny, Z.; Zawodniak, J. Novel Earth Fault Protection Algorithm Based on MV Cable Screen Zero Sequence Current Filter. Energies 2019, 12, 3190. [Google Scholar] [CrossRef] [Green Version]
  6. Shao, W.; Bai, J.; Cheng, Y.; Zhang, Z.; Li, N. Research on a Faulty Line Selection Method Based on the Zero-Sequence Disturbance Power of Resonant Grounded Distribution Networks. Energies 2019, 12, 846. [Google Scholar] [CrossRef] [Green Version]
  7. Tu, C.-S.; Tsai, M.-T. Optimal Phase Arrangement of Distribution Transformers for System Unbalance Improvement and Loss Reduction. Energies 2020, 13, 545. [Google Scholar] [CrossRef] [Green Version]
  8. Chen, T.H.; Cherng, J.T. Optimal phase arrangement of distribution transformers connected to a primary feeder for system unbalance improvement and loss reduction using a genetic algorithm. In Proceedings of the 21st International Conference on Power Industry Computer Applications. Connecting Utilities. PICA 99. To the Millennium and Beyond (Cat. No. 99CH36351), Santa Clara, CA, USA, 21 May 1999; Volume 15, pp. 994–1000. [Google Scholar]
  9. Huang, M.-Y.; Chen, C.-S.; Lin, C.-H.; Kang, M.-S.; Chuang, H.-J.; Huang, C.-W. Three-phase balancing of distribution feeders using immune algorithm. IET Gener. Transm. Distrib. 2008, 2, 383–392. [Google Scholar] [CrossRef]
  10. Hooshmand, R.-A.; Soltani, S. Fuzzy Optimal Phase Balancing of Radial and Meshed Distribution Networks Using BF-PSO Algorithm. IEEE Trans. Power Syst. 2011, 27, 47–57. [Google Scholar] [CrossRef]
  11. Arias, J.; Calle, M.; Turizo, D.; Guerrero, J.; Candelo-Becerra, J.E. Historical Load Balance in Distribution Systems Using the Branch and Bound Algorithm. Energies 2019, 12, 1219. [Google Scholar] [CrossRef] [Green Version]
  12. Lin, C.-H.; Chen, C.; Chuang, H.-J.; Huang, M.-Y.; Huang, C.-W. An Expert System for Three-Phase Balancing of Distribution Feeders. IEEE Trans. Power Syst. 2008, 23, 1488–1496. [Google Scholar]
  13. Soltani, S.; Rashidinejad, M.; Abdollahi, A. Stochastic Multiobjective Distribution Systems Phase Balancing Considering Distributed Energy Resources. IEEE Syst. J. 2017, 12, 2866–2877. [Google Scholar] [CrossRef]
  14. Peng, C.; Xu, L.; Gong, X.; Sun, H.; Pan, L. Molecular Evolution Based Dynamic Reconfiguration of Distribution Networks With DGs Considering Three-Phase Balance and Switching Times. IEEE Trans. Ind. Inform. 2019, 15, 1866–1876. [Google Scholar] [CrossRef]
  15. Chen, C.; Tsai, C.-T.; Lin, C.-H.; Hsieh, W.-L.; Ku, T.-T. Loading Balance of Distribution Feeders With Loop Power Controllers Considering Photovoltaic Generation. IEEE Trans. Power Syst. 2011, 26, 1762–1768. [Google Scholar] [CrossRef]
  16. Huang, W.-T.; Chen, T.-H.; Chen, H.-T.; Yang, J.-S.; Lian, K.-L.; Chang, Y.-R.; Lee, Y.-D.; Ho, Y.-H. A Two-stage Optimal Network Reconfiguration Approach for Minimizing Energy Loss of Distribution Networks Using Particle Swarm Optimization Algorithm. Energies 2015, 8, 13894–13910. [Google Scholar] [CrossRef] [Green Version]
  17. Bouktif, S.; Fiaz, A.; Ouni, A.; Serhani, M.A. Multi-Sequence LSTM-RNN Deep Learning and Metaheuristics for Electric Load Forecasting. Energies 2020, 13, 391. [Google Scholar] [CrossRef] [Green Version]
  18. Yudantaka, K.; Kim, J.-S.; Song, H. Dual Deep Learning Networks Based Load Forecasting with Partial Real-Time Information and Its Application to System Marginal Price Prediction. Energies 2019, 13, 148. [Google Scholar] [CrossRef] [Green Version]
  19. Santra, A.S.; Lin, J.-L. Integrating Long Short-Term Memory and Genetic Algorithm for Short-Term Load Forecasting. Energies 2019, 12, 2040. [Google Scholar] [CrossRef] [Green Version]
  20. Tian, C.; Ma, J.; Zhang, C.; Zhan, P. A Deep Neural Network Model for Short-Term Load Forecast Based on Long Short-Term Memory Network and Convolutional Neural Network. Energies 2018, 11, 3493. [Google Scholar] [CrossRef] [Green Version]
  21. Kim, S.H.; Lee, G.; Kwon, G.-Y.; Kim, D.-I.; Shin, Y.-J. Deep Learning Based on Multi-Decomposition for Short-Term Load Forecasting. Energies 2018, 11, 3433. [Google Scholar] [CrossRef] [Green Version]
  22. OpenDSS-EPRI. Available online: https://www.epri.com/#/pages/sa/opendss?lang=en (accessed on 21 February 2020).
  23. Kim, H.; Kim, K.; Park, S.; Kim, H.; Kim, H. CoSimulating Communication Networks and Electrical System for Performance Evaluation in Smart Grid. Appl. Sci. 2018, 8, 85. [Google Scholar] [CrossRef] [Green Version]
  24. Xiao, H.; Pei, W.; Dong, Z.; Kong, L.; Wang, D. Application and Comparison of Metaheuristic and New Metamodel Based Global Optimization Methods to the Optimal Operation of Active Distribution Networks. Energies 2018, 11, 85. [Google Scholar] [CrossRef] [Green Version]
  25. Misra, R.; Paudyal, S.; Ceylan, O.; Mandal, P. Harmonic Distortion Minimization in Power Grids with Wind and Electric Vehicles. Energies 2017, 10, 932. [Google Scholar] [CrossRef] [Green Version]
  26. Martinez-Velasco, J.; Guerra, G. Reliability Analysis of Distribution Systems with Photovoltaic Generation Using a Power Flow Simulator and a Parallel Monte Carlo Approach. Energies 2016, 9, 537. [Google Scholar] [CrossRef] [Green Version]
  27. Chemali, E.; Kollmeyer, P.; Preindl, M.; Ahmed, R.; Emadi, A.; Kollmeyer, P. Long Short-Term Memory Networks for Accurate State-of-Charge Estimation of Li-ion Batteries. IEEE Trans. Ind. Electron. 2017, 65, 6730–6739. [Google Scholar] [CrossRef]
  28. Ospina, J.; Newaz, A.; Faruque, M.O. Forecasting of PV plant output using hybrid wavelet-based LSTM-DNN structure model. IET Renew. Power Gener. 2019, 13, 1087–1095. [Google Scholar] [CrossRef]
  29. Brownlee, J. Long Short-term Memory Networks with Python: Develop Sequence Prediction Models with Deep Learning; Machine Learning Mastery: Melbourne, Australia, 2017. [Google Scholar]
  30. Jamian, J.J.; Aman, M.M.; Mustafa, M.W.; Jasmon, G.B.; Mokhlis, H.; Bakar, A.H.A.; Abdullah, M.N. Optimum multi DG units placement and sizing based on voltage stability index and PSO. In Proceedings of the 2012 47th International Universities Power Engineering Conference (UPEC), Middlesex, UK, 4–7 September 2012; pp. 1–6. [Google Scholar]
  31. Montenegro, D.; Hernandez, M.; Ramos, G.; Montenegro-Martinez, D. Real time OpenDSS framework for distribution systems simulation and analysis. In Proceedings of the 2012 Sixth IEEE/PES Transmission and Distribution: Latin America Conference and Exposition (T&D-LA), Montevideo, Uruguay, 3–5 September 2012; pp. 1–5. [Google Scholar]
Figure 1. The solution procedure of the proposed approach.
Energies 13 01844 g001
Figure 2. The structure of load prediction.
Energies 13 01844 g002
Figure 3. The structure of optimal phase arrangement.
Energies 13 01844 g003
Figure 4. The structure of the proposed LSTM solver.
Energies 13 01844 g004
Figure 5. PSO particle behavior flow chart.
Energies 13 01844 g005
Figure 6. PSO solution flow chart.
Energies 13 01844 g006
Figure 7. Various connections between the individual distribution transformer and the lateral and tapped-off points in the feeder main.
Energies 13 01844 g007
Figure 8. Illustration of the phase arrangement scheme of three-phase transformer.
Energies 13 01844 g008
Figure 9. One-line diagram of the practical distribution feeder.
Energies 13 01844 g009
Figure 10. The iterative convergence diagram: (a) fitness function, (b) neutral current, (c) total energy loss, and (d) rephasing number.
Energies 13 01844 g010
Figure 11. The single line diagram of LCO protective relay in the three-phase, four-wire distribution systems.
Energies 13 01844 g011
Figure 12. The neutral current spread and PDF of neutral current: (a) before rephrasing and (b) after rephasing.
Energies 13 01844 g012
Figure 13. The neutral current profile in each line section: (a) before rephrasing and (b) after rephasing.
Energies 13 01844 g013
Figure 14. Line current profiles: (a) phase A: before rephasing, (b) phase A: after rephasing, (c) phase B: before rephasing, (d) phase B: after rephasing, (e) phase C: before rephasing, and (f) phase C: after rephasing.
Energies 13 01844 g014
Figure 15. Bus voltage profiles: (a) phase A: before rephasing, (b) phase A: after rephasing, (c) phase B: before rephasing, (d) phase B: after rephasing, (e) phase C: before rephasing, and (f) phase C: after rephasing.
Energies 13 01844 g015aEnergies 13 01844 g015b
Figure 16. Zero- and negative-sequence voltage unbalance factors: (a) Zero-sequence: before rephasing, (b) Zero-sequence: after rephasing, (c) Negative-sequence: before rephasing, and (d) Negative-sequence: after rephasing.
Energies 13 01844 g016
Figure 17. Energy loss profiles: (a) before rephasing and (b) after rephasing.
Energies 13 01844 g017
Figure 18. The iterative convergence diagram of Case 2: (a) fitness function and rephasing number and (b) neutral current and total energy loss.
Energies 13 01844 g018
Figure 19. The iterative convergence diagram of Case 3: (a) fitness function and rephasing number and (b) neutral current and total energy loss.
Energies 13 01844 g019
Figure 20. The iterative convergence diagram of Case 4: (a) fitness function and rephasing number and (b) neutral current and total energy loss.
Energies 13 01844 g020
Table 1. The PSO algorithm parameter and weighting values of the four test cases.
CaseParameter
Swarm SizeIterations ω φ p φ g w 1 w 2 w 3
Case 1100100from 0.9 to 0.4
during iteration
0.50.5100
Case 20.800.2
Case 30.40.30.3
Case 4150100
Table 2. Performance comparison of four cases with the original condition.
CaseResult
Fitness FunctionMaximunm
Neutral Current (A)
Total Energy
Loss (kWh)
Rephasing Number
Original-72.1711,317.21-
Case 10.67867548.988261.5530
Case 20.72019554.959074.6918
Case 30.69972054.568980.3320
Case 40.69116149.888636.626
Table 3. Optimal phase arrangement comparisons of four cases with the original condition.
ConnectionOriginalCase 1Case 2Case 3 ConnectionOriginalCase 1Case 2Case 3
Bus No. Bus No.
6_1BCBABCBA21_11ABABABAB
11_4AAAA21_13BCBABABC
11_5BCABBCBA21_14BCBABCBA
11_6CAAA21_15CBCA
11_7AAAA27_1AAAA
11_9BCBCBCBC27_7ACBCACAC
11_10CCBC28_1BBBB
11_12BBBB30_0AAAA
11_16BBBB33_2BBBB
11_17BBBB36_0ABCABCABCABC
11_27ABABABAB35_1ABABABAB
11_28BBBB38_2BBBB
13_1BBBB38_3ACABACAC
13_9CAAA38_5ACACACAC
13_10CBAA38_6BCBCBCBC
15_2ACABACAC39_0BCBABCBA
15_3BBBB40_3ACACACAC
15_4BABB40_4ACACBCAB
16_2BBBB40_5ACACACAC
16_7BCBCBABC40_27AAAA
16_10BBBB40_28CACC
16_15CBBC40_31ACACACAB
16_20AAAA40_33BBBB
17_20AAAA40_34CBAA
17_22BABB47_0ACACACAC
17_23BBBB49_1AAAA
17_25BBBB50_0ACBCABAB
17_26BCABBABC51_0ACACACAC
18_0BCABBABC54_0ACACACAC
19_0CACC54_2ACACACBC
19_4CBAC54_6CBCC
19_5BBBB54_10CACA
19_7BBBB54_11ABABABAB
19_8AAAA54_12BBBB
19_9ABABABAB54_13BCBABABA
20_3CCAA54_14ABABABAB
20_9ACACACAB54_15BBBB
20_10BCBABABC54_16ACBCABBC
20_11CACC57_0ACABBCBC
21_9ACACACAC57_1ACBCACAC
21_10CBABNote: Bus No._nth Transformer(lateral)

