Article

Wet Chemical Oxidation to Improve Interfacial Properties of Al2O3/Si and Interface Analysis of Al2O3/SiOx/Si Structure Using Surface Carrier Lifetime Simulation and Capacitance–Voltage Measurement

1
Photovoltaics Laboratory, Korea Institute of Energy Research, Daejeon 34129, Korea
2
Department of Materials Science and Engineering, Korea University, Seoul 02841, Korea
3
Department of Energy Environment Policy and Technology, Green School (Graduate School of Korea Energy and Environment), Korea University, Seoul 02841, Korea
*
Authors to whom correspondence should be addressed.
Energies 2020, 13(7), 1803; https://doi.org/10.3390/en13071803
Submission received: 6 March 2020 / Revised: 1 April 2020 / Accepted: 7 April 2020 / Published: 8 April 2020
(This article belongs to the Section A2: Solar Energy and Photovoltaic Systems)

Abstract

:
A thin silicon oxide (SiOx) layer (thickness: 1.5–2.0 nm) formed at an Al2O3/Si interface can enhance the interface properties. However, it is challenging to control the characteristics of thin SiOx layers because SiOx forms naturally during Al2O3 deposition on Si substrates. In this study, a ~1.5 nm-thick SiOx layer was inserted between Al2O3 and Si substrates by wet chemical oxidation to improve the passivation properties. The acidic solutions used for wet chemical oxidation were HCl:H2O2:H2O, H2SO4:H2O2:H2O, and HNO3. The thicknesses of SiOx layers formed in the acidic solutions were ~1.48, ~1.32, and ~1.50 nm for SiOx-HCl, SiOx-H2SO4, and SiOx-HNO3, respectively. The leakage current characteristics of SiOx-HNO3 were better than those of the oxide layers formed in the other acidic solutions. After depositing a ~10 nm-thick Al2O3 on an SiOx-acidic/Si structure, we measured the effective carrier lifetime using quasi steady-state photoconductance and examined the interfacial properties of Al2O3/SiOx-acidic/Si using surface carrier lifetime simulation and capacitance–voltage measurement. The effective carrier lifetime of Al2O3/SiOx-HNO3/Si was relatively high (~400 μs), resulting from the low surface defect density (2.35–2.88 × 1010 cm−2eV−1). The oxide layer inserted between Al2O3 and Si substrates by wet chemical oxidation helped improve the Al2O3/Si interface properties.

Graphical Abstract

1. Introduction

The surface passivation of crystalline silicon (c-Si) solar cells can be improved using various materials such as SiO2 [1,2,3,4,5,6], SiNx [7,8,9], Al2O3 [10,11,12,13], TiOx [14,15,16], MoOx [17,18], and poly-Si [19,20,21,22]. In particular, Al2O3 thin films are most widely used for boron-doped Si surfaces (or p+ emitter surfaces) owing to the low surface recombination velocity (SRV) [10,11]. The interface of Al2O3 films can be characterized by a low interface trap density and a high negative charge density because of the ultrathin SiOx and negatively charged interstitial O ions present at the Al2O3/Si interface [23,24]. The passivation properties of an Al2O3/Si structure can be improved by optimizing the Al2O3 thickness and annealing temperature [25,26]. In particular, a thin SiOx layer is formed at the Al2O3/Si interface during the deposition process and can be activated through annealing. However, it is difficult to control the quality of this layer because it forms spontaneously.
In this work, we considered a method to improve the interfacial properties of an Al2O3/Si structure by inserting a thin silicon oxide layer between Al2O3 and Si substrates. The widely used methods of growing thin silicon oxides are thermal and wet chemical oxidations. In thermal oxidation, although the quality of the silicon oxide formed is excellent, it is difficult to control the thickness (<1.5 nm) at temperatures above 800 °C. If the silicon oxide layer becomes thicker, the field effect passivation of the Al2O3/Si interface may deteriorate [27]. Therefore, a thickness of ~1.5 nm or less is required to improve the interfacial properties of the Al2O3/Si structure and ensure a good field effect passivation. Wet chemical oxidation is a promising method of growing thin SiOx, and the quality of thin oxides grown using this method has been verified [28,29,30,31,32]. In this research, a thin oxide layer was utilized to improve the passivation property of an Al2O3/Si structure. We applied wet chemical oxidation to grow ~1.5 nm-thick SiOx and then deposited a ~10 nm-thick Al2O3 using plasma-assisted atomic layer deposition (PA-ALD). To analyze the passivation characteristics and interface properties of the Al2O3/SiOx/Si structure, the effective carrier lifetime was measured using quasi steady state photoconductance (QSSPC), and surface carrier lifetime simulation and capacitance–voltage (C–V) measurements were performed.

2. Experimental

After the Radio Corporation of America (RCA) cleaning developed by Werner Kern to remove ionic and organic impurities in the polished 4~5 Ω∙cm p-type Si(100) substrate [33], we performed wet chemical oxidation using three acidic solutions: (i) HCl:H2O2:H2O = 1:1:5, (ii) H2SO4:H2O2:H2O = 1:1:5, and (iii) HNO3 (68%) [28,29,30]. The wet chemical oxide layers formed in the acidic solutions are hereinafter abbreviated as SiOx-HCl, SiOx-H2SO4, and SiOx-HNO3, respectively. The process temperature was 85 °C for SiOx-HCl and SiOx-H2SO4 and 121 °C for SiOx-HNO3. The immersion time was varied from 10 to 60 min. The thickness and refractive index of the silicon oxide (SiOx-acidic) layers formed on Si surface was measured using spectroscopy ellipsometry (SE) and transmission electron microscopy (TEM). The quality of SiOx-acidic was evaluated in terms of the leakage current density, which was measured by conducting a current–voltage (I–V) analysis with mercury probe and Keithley 238 current source meter under dark conditions. To measure the surface passivation characteristics, an approximately 10 nm-thick Al2O3 film was deposited on a SiOx-acidic/Si substrate using PA-ALD. The reaction sources for Al2O3 deposition were trimethylaluminum (Al(CH3)3, TMA) and O2 (purity 99.999%) gas; the purge gas was Ar (purity 99.999%). The deposition process was performed at a substrate temperature of 250 °C, a process pressure of 1.0 torr, a plasma power of 200 W, an O2 exposure time of 0.5 s, and a distance of 20 mm between the showerhead and the substrate. Annealing was then conducted in an electric furnace at 425 °C for 15 min to activate the Al2O3 layer. After annealing, the carrier lifetimes of the samples were measured using QSSPC to evaluate the surface passivation characteristics. For a detailed analysis of the interface properties of Al2O3/SiOx-acidic/Si, a surface carrier lifetime simulation and C–V measurement were performed by mercury probe with Agilent E4980A LCR meter.

3. Results and Discussions

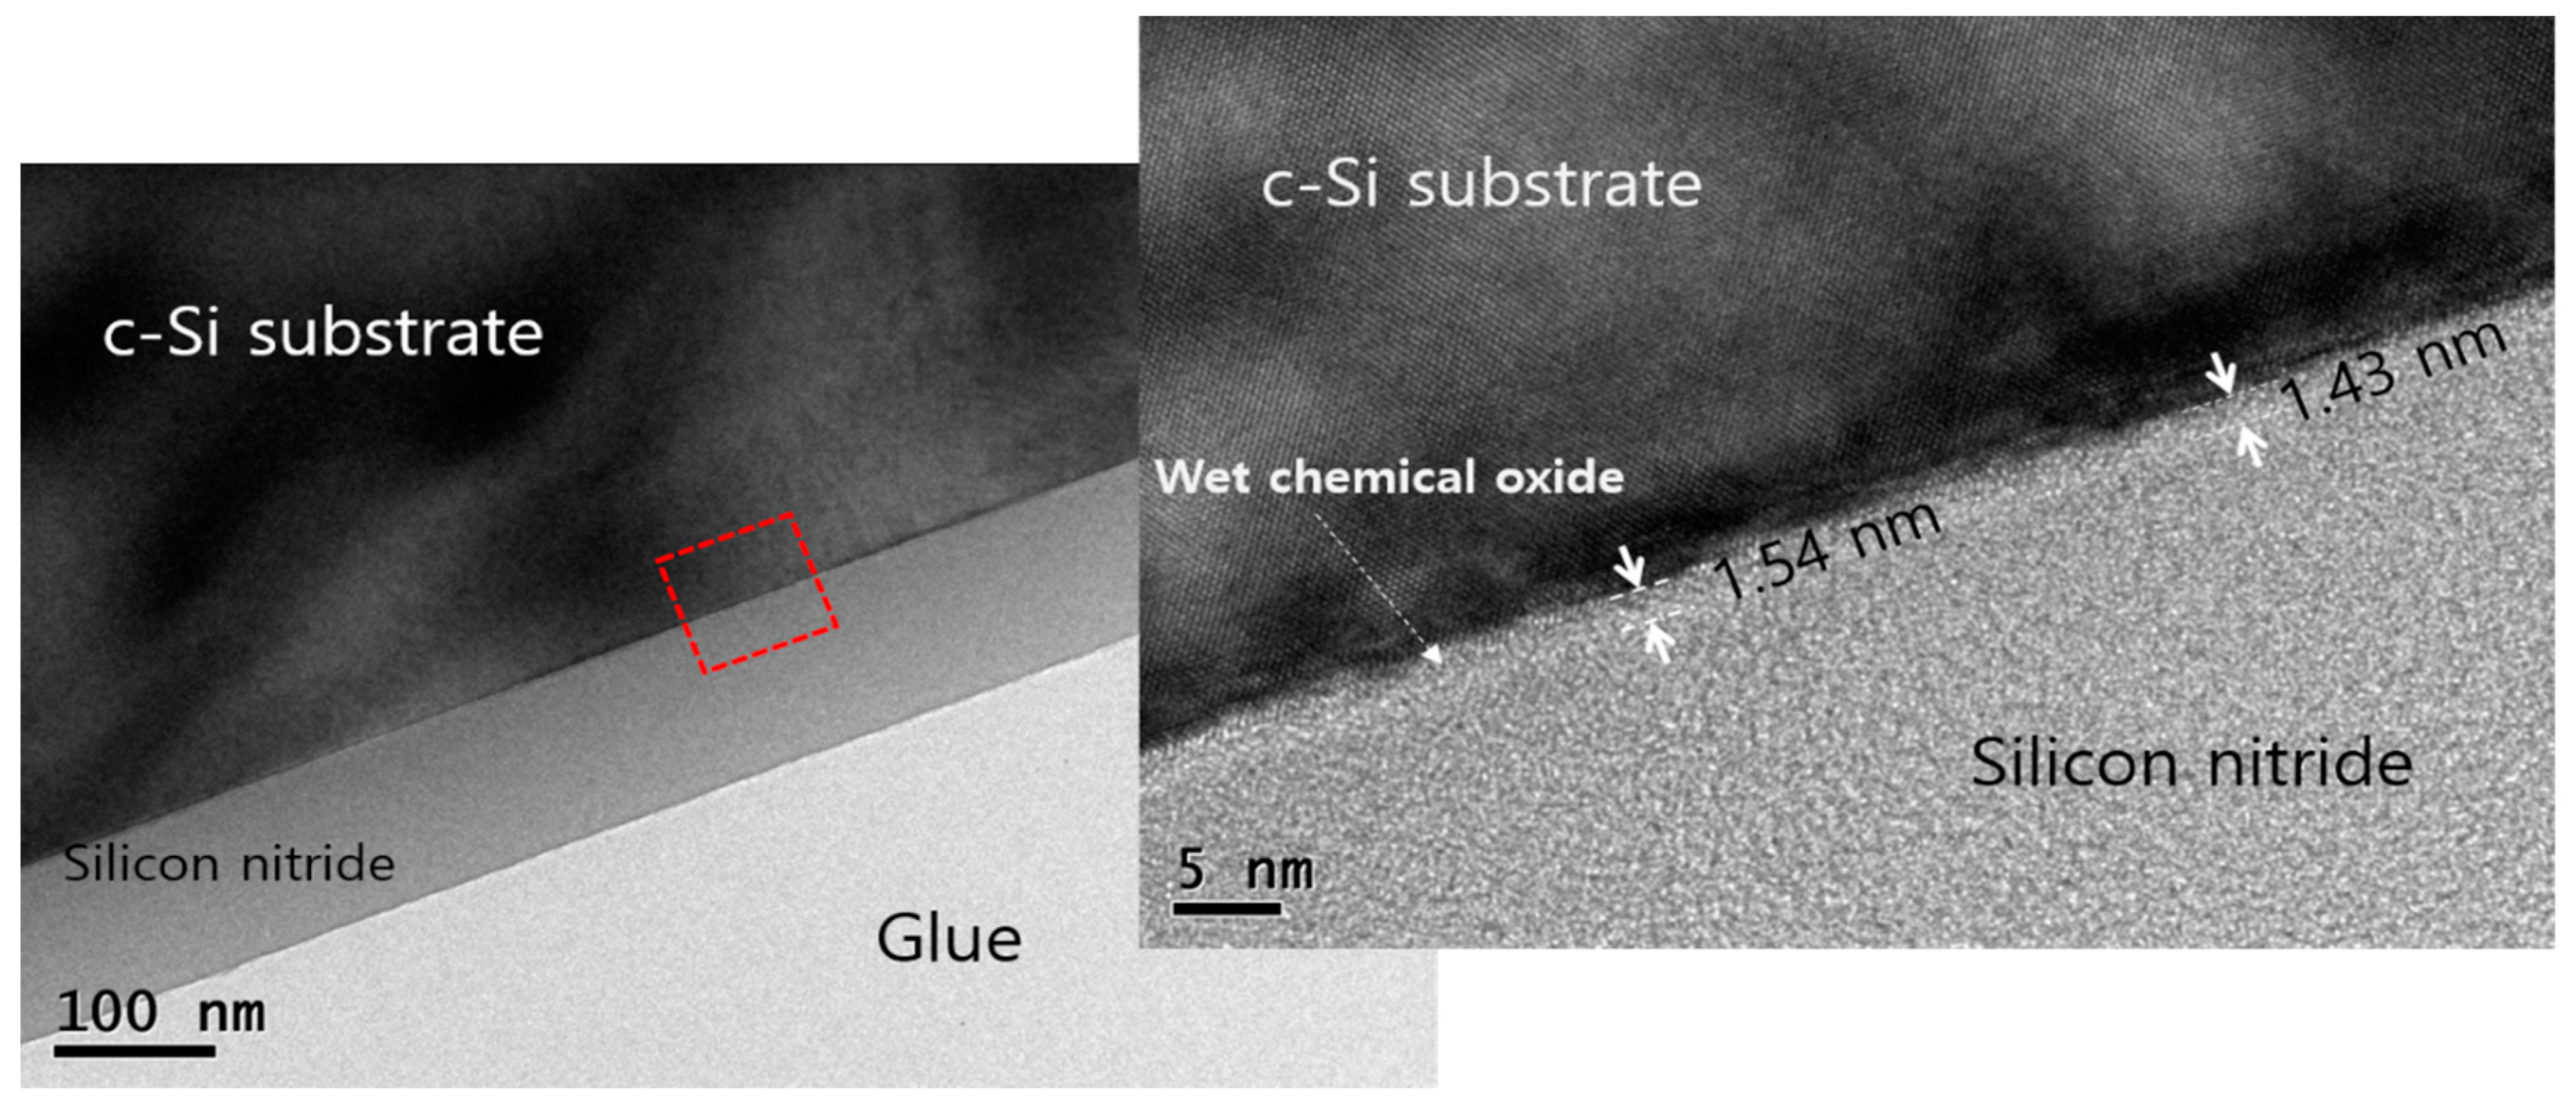
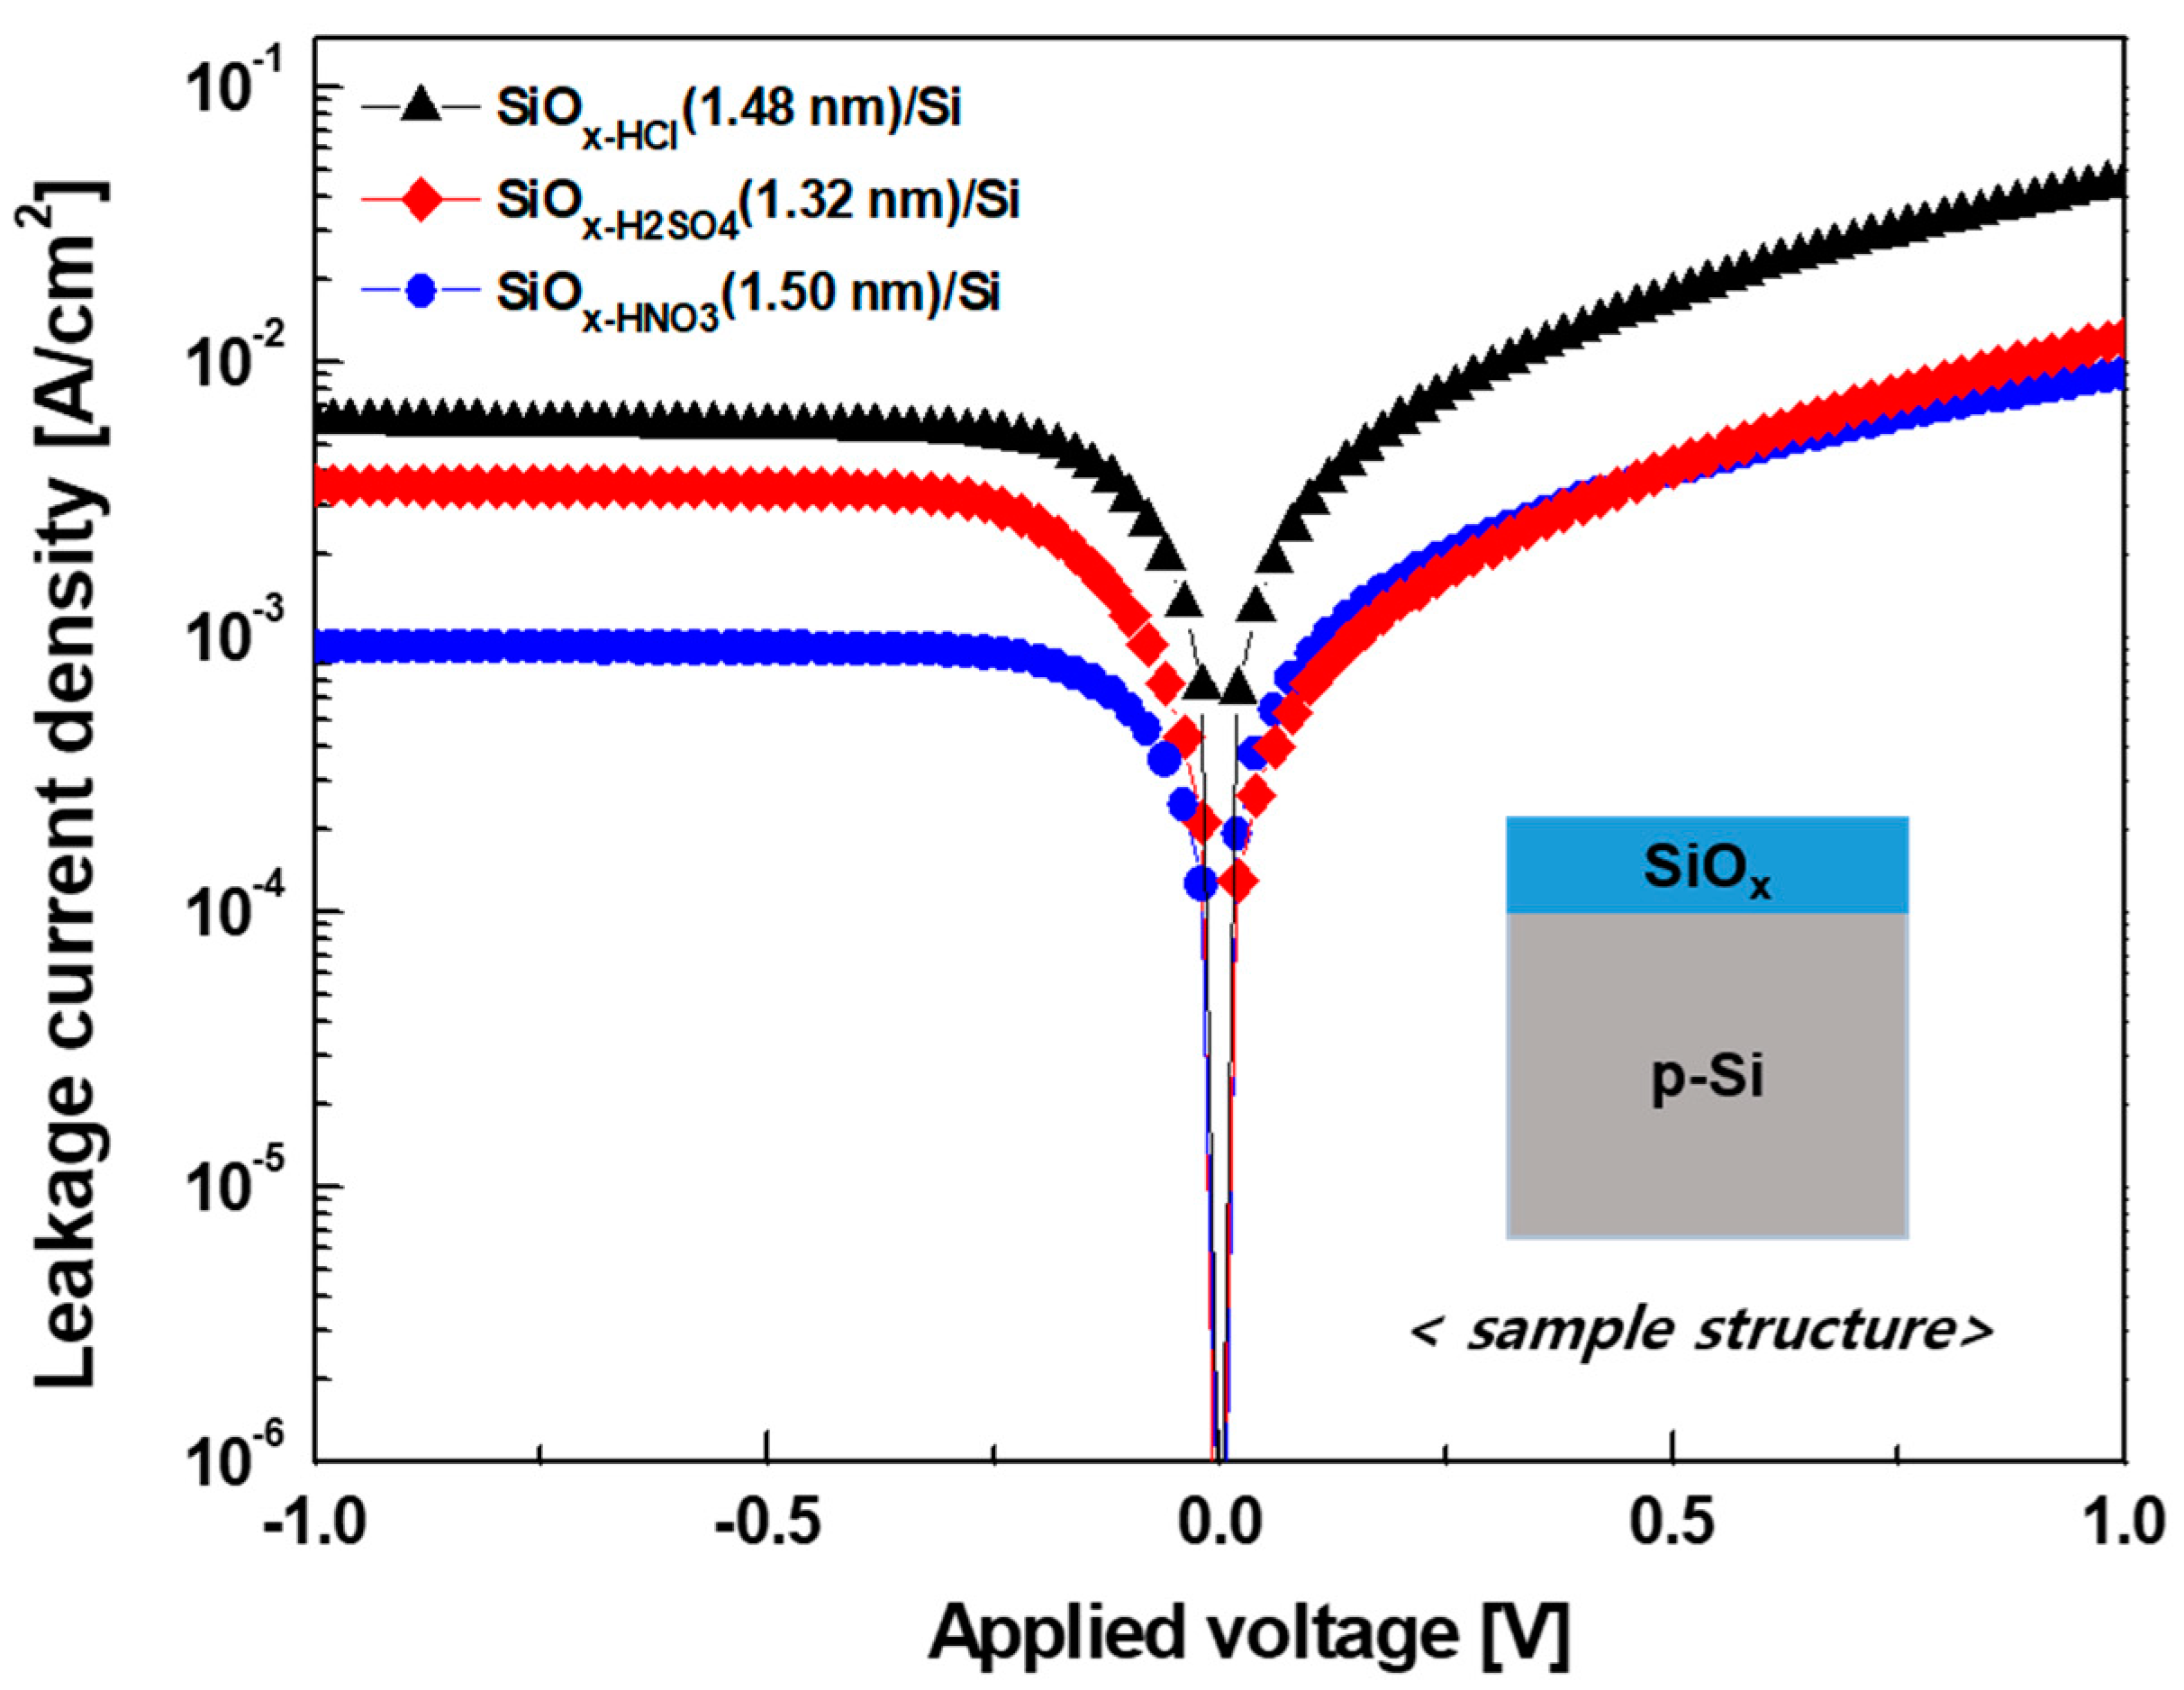
Figure 1 shows the thickness of the silicon oxide (SiOx-acidic) formed in the acidic solutions with various immersion times. The film thickness was measured by SE. The measured wavelength range was 300–100 nm and the incident beam angle was 75° in the SE measurement. With the increase in the immersion time, the thickness increased, saturating in the range of 1.32–1.50 nm. The thicknesses of SiOx are ~1.48 nm for SiOx-HCl, ~1.32 nm for SiOx-H2SO4, and ~1.50 nm for SiOx-HNO3. These results are similar to those reported previously [28,29,30]. The thickness of SiOx-HNO3 was also confirmed by TEM measurement, as shown in Figure 2. In the TEM measurements, silicon nitride (SiNx) was used as the capping layer to avoid additional thin oxide growth in the Al2O3 deposition process. The SiOx-HNO3 thickness was in the range of 1.43–1.54 nm, consistent with SE measurements. As the thicknesses of SiOx formed in each acidic solution saturated after approximately 15 min, the immersion time was fixed at 15 min (Table 1). To evaluate the characteristics of the SiOx-acidic layer, the leakage current densities were measured by I–V curves under dark conditions. As shown in Figure 3, the leakage current density of SiOx-HNO3 was the lowest (~9.1 × 10⁻³ A/cm2 at 1 Vforward-bias and ~0.92 × 10⁻³ A/cm2 at −1 Vreverse-bias), indicating that the quality of SiOx-HNO3 is relatively better than the other oxides. The leakage current density results are similar to those reported by Kobayashi Asuha et al. [30].
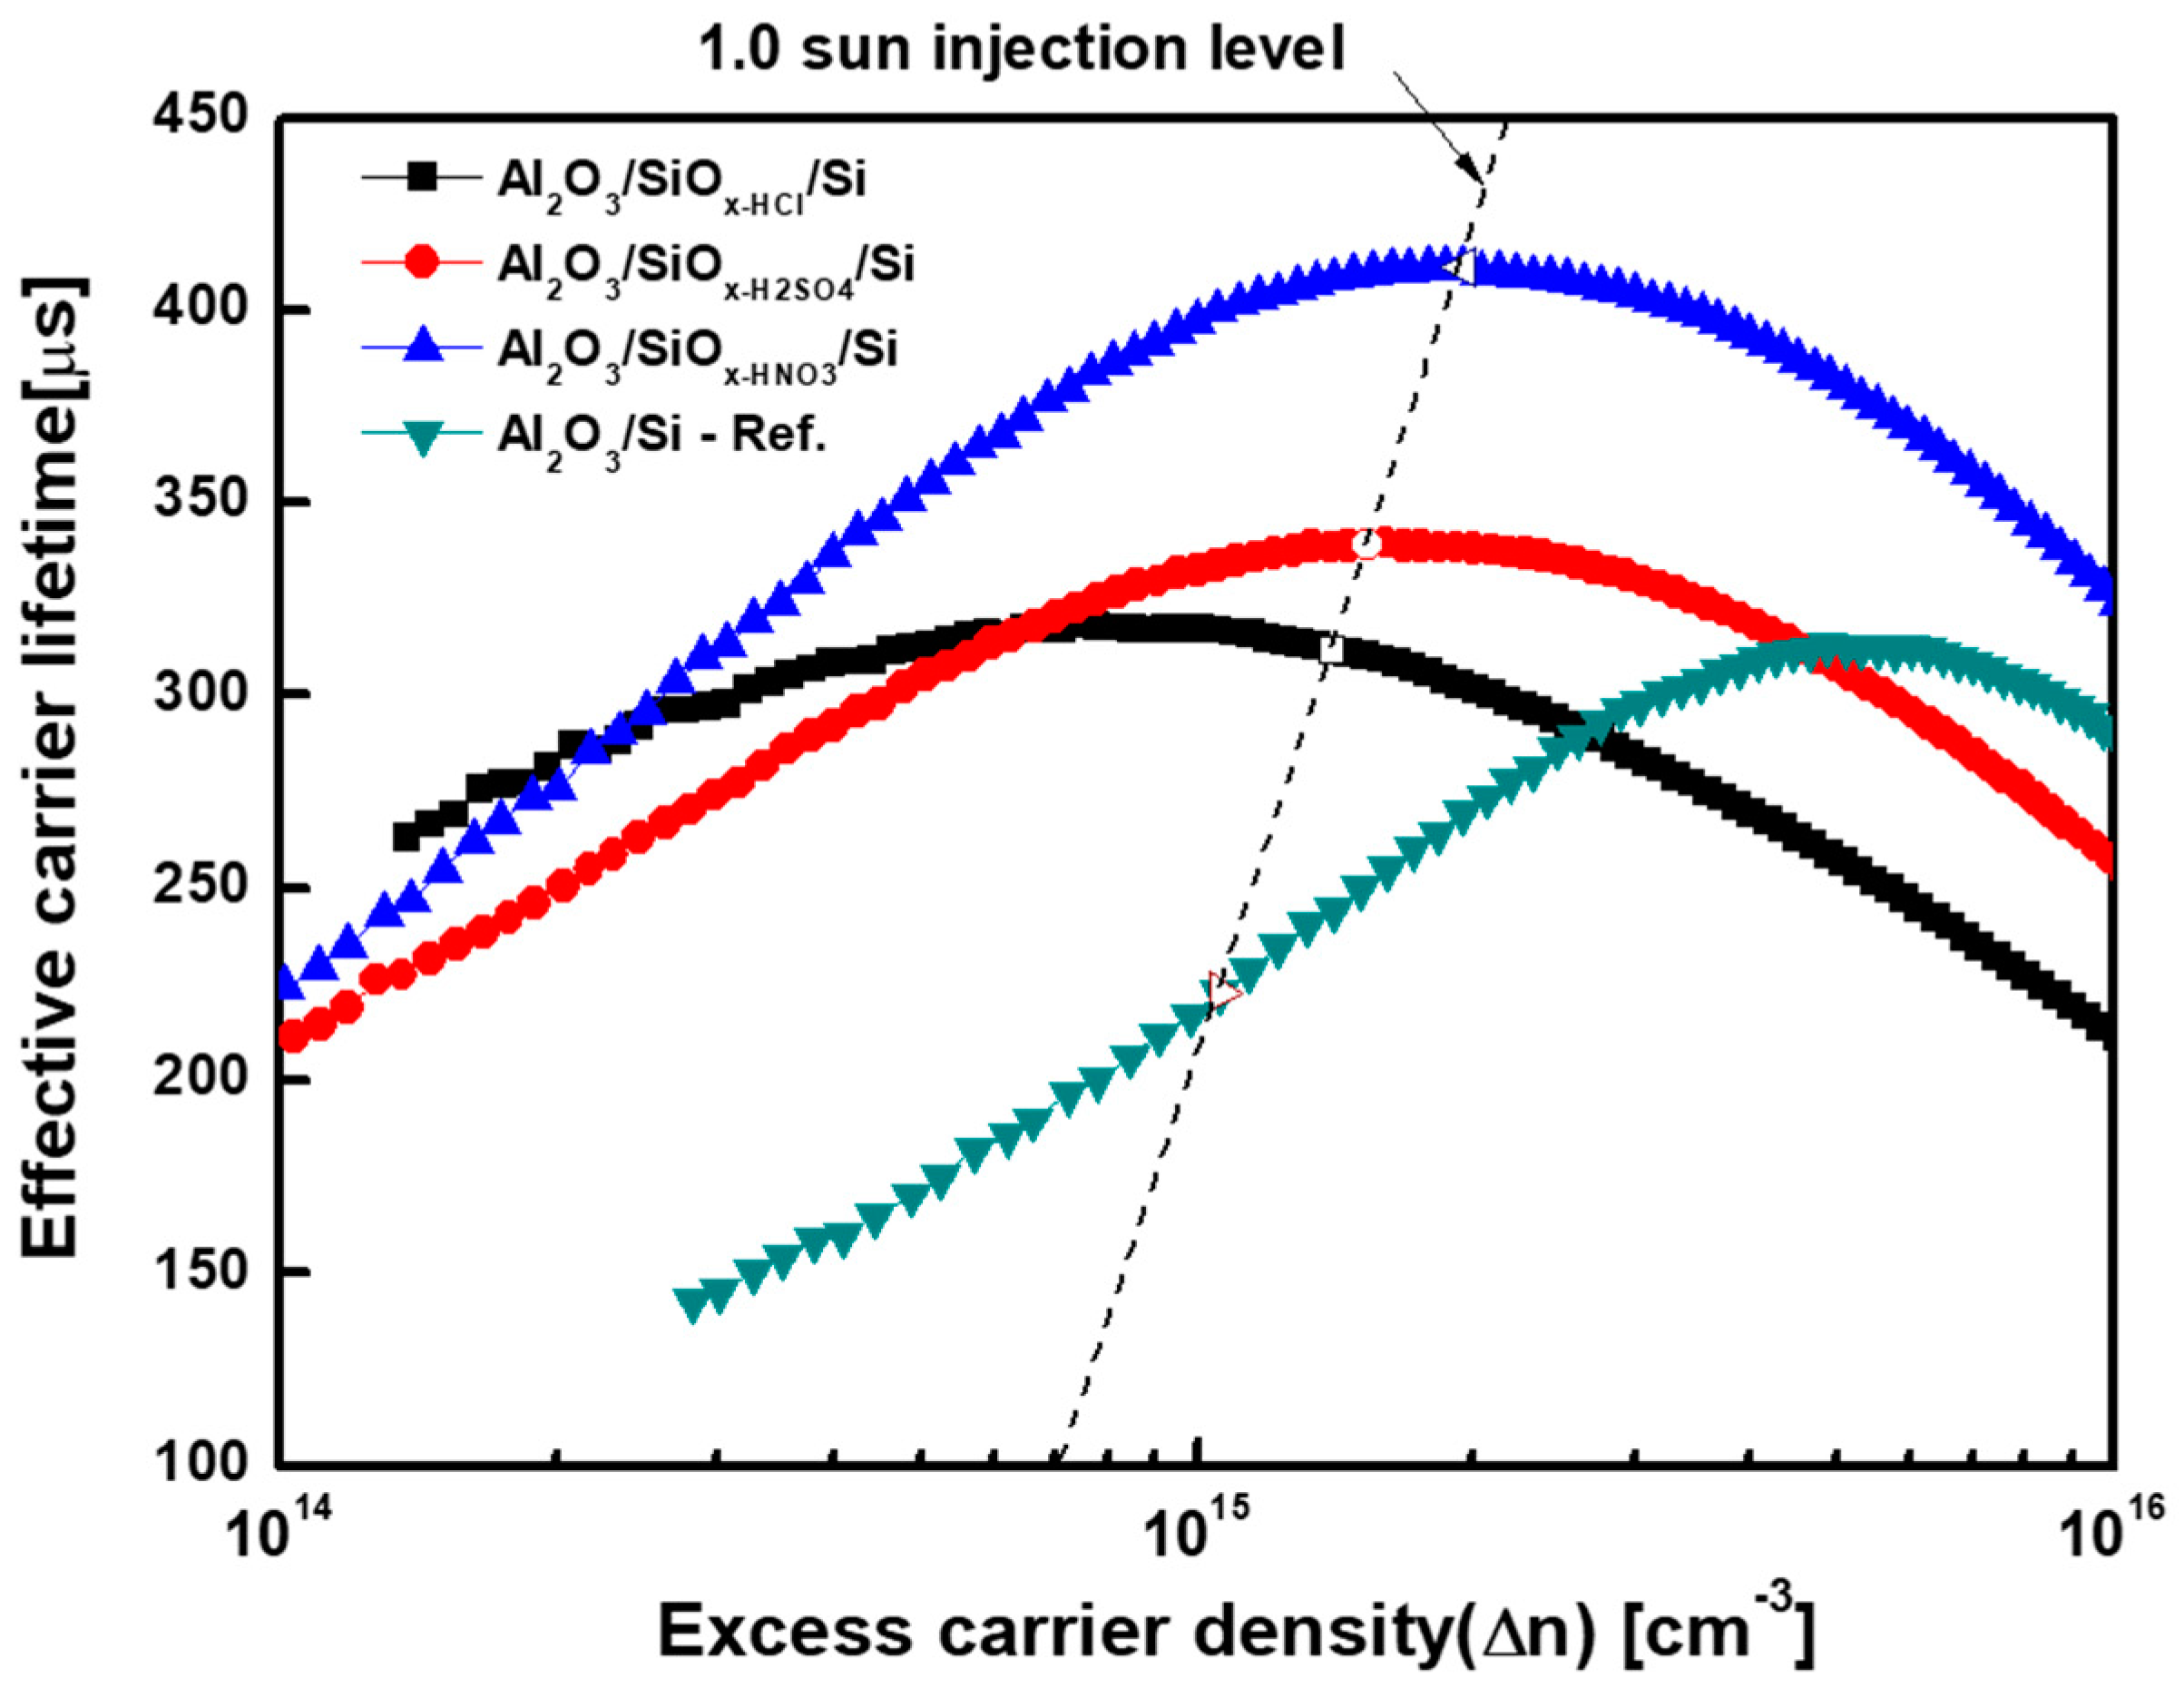
To investigate the surface passivation properties of the SiOx-acidic, a ~10 nm-thick Al2O3 layer was deposited on both sides of the SiOx-acidic/Si substrate using PA-ALD, and the effective carrier lifetime was measured by QSSPC. The measured effective carrier lifetimes at 1.0 sun injection level [34] of Al2O3/SiOx-HNO3/Si, Al2O3/SiOx-HCl/Si, and Al2O3/SiOx-H2SO4 /Si are ~400, ~317, and ~332 μs (Figure 4); notably, the passivation quality of SiOx,HNO3 is excellent. Moreover, the reference sample, which did not form an oxide film intentionally, exhibited a significantly lower effective carrier lifetime (~220 μs) than the samples with wet chemical oxides. This indicates that the quality of the thin SiOx layer formed at the Al2O3/Si interface influences the effective carrier lifetime and that the oxides formed in acidic solutions exhibit better passivation properties than oxide films formed naturally during the deposition process. To investigate the interfacial properties of Al2O3/SiOx-acidic/Si, the surface carrier lifetime simulation and C–V measurement were performed. The surface carrier lifetime simulation is based on the extended Shockley–Read–Hall (SRH) recombination equation. This equation was derived from the SRV, expressed in Equations (1) and (2) [35,36].
S   U s Δ n s
U s = n s p s n i 2 n s + n 1 S p 0 + p s + p 1 S n 0   with   S p 0 = σ p V t h D i t ,   S n 0 = σ n V t h D i t
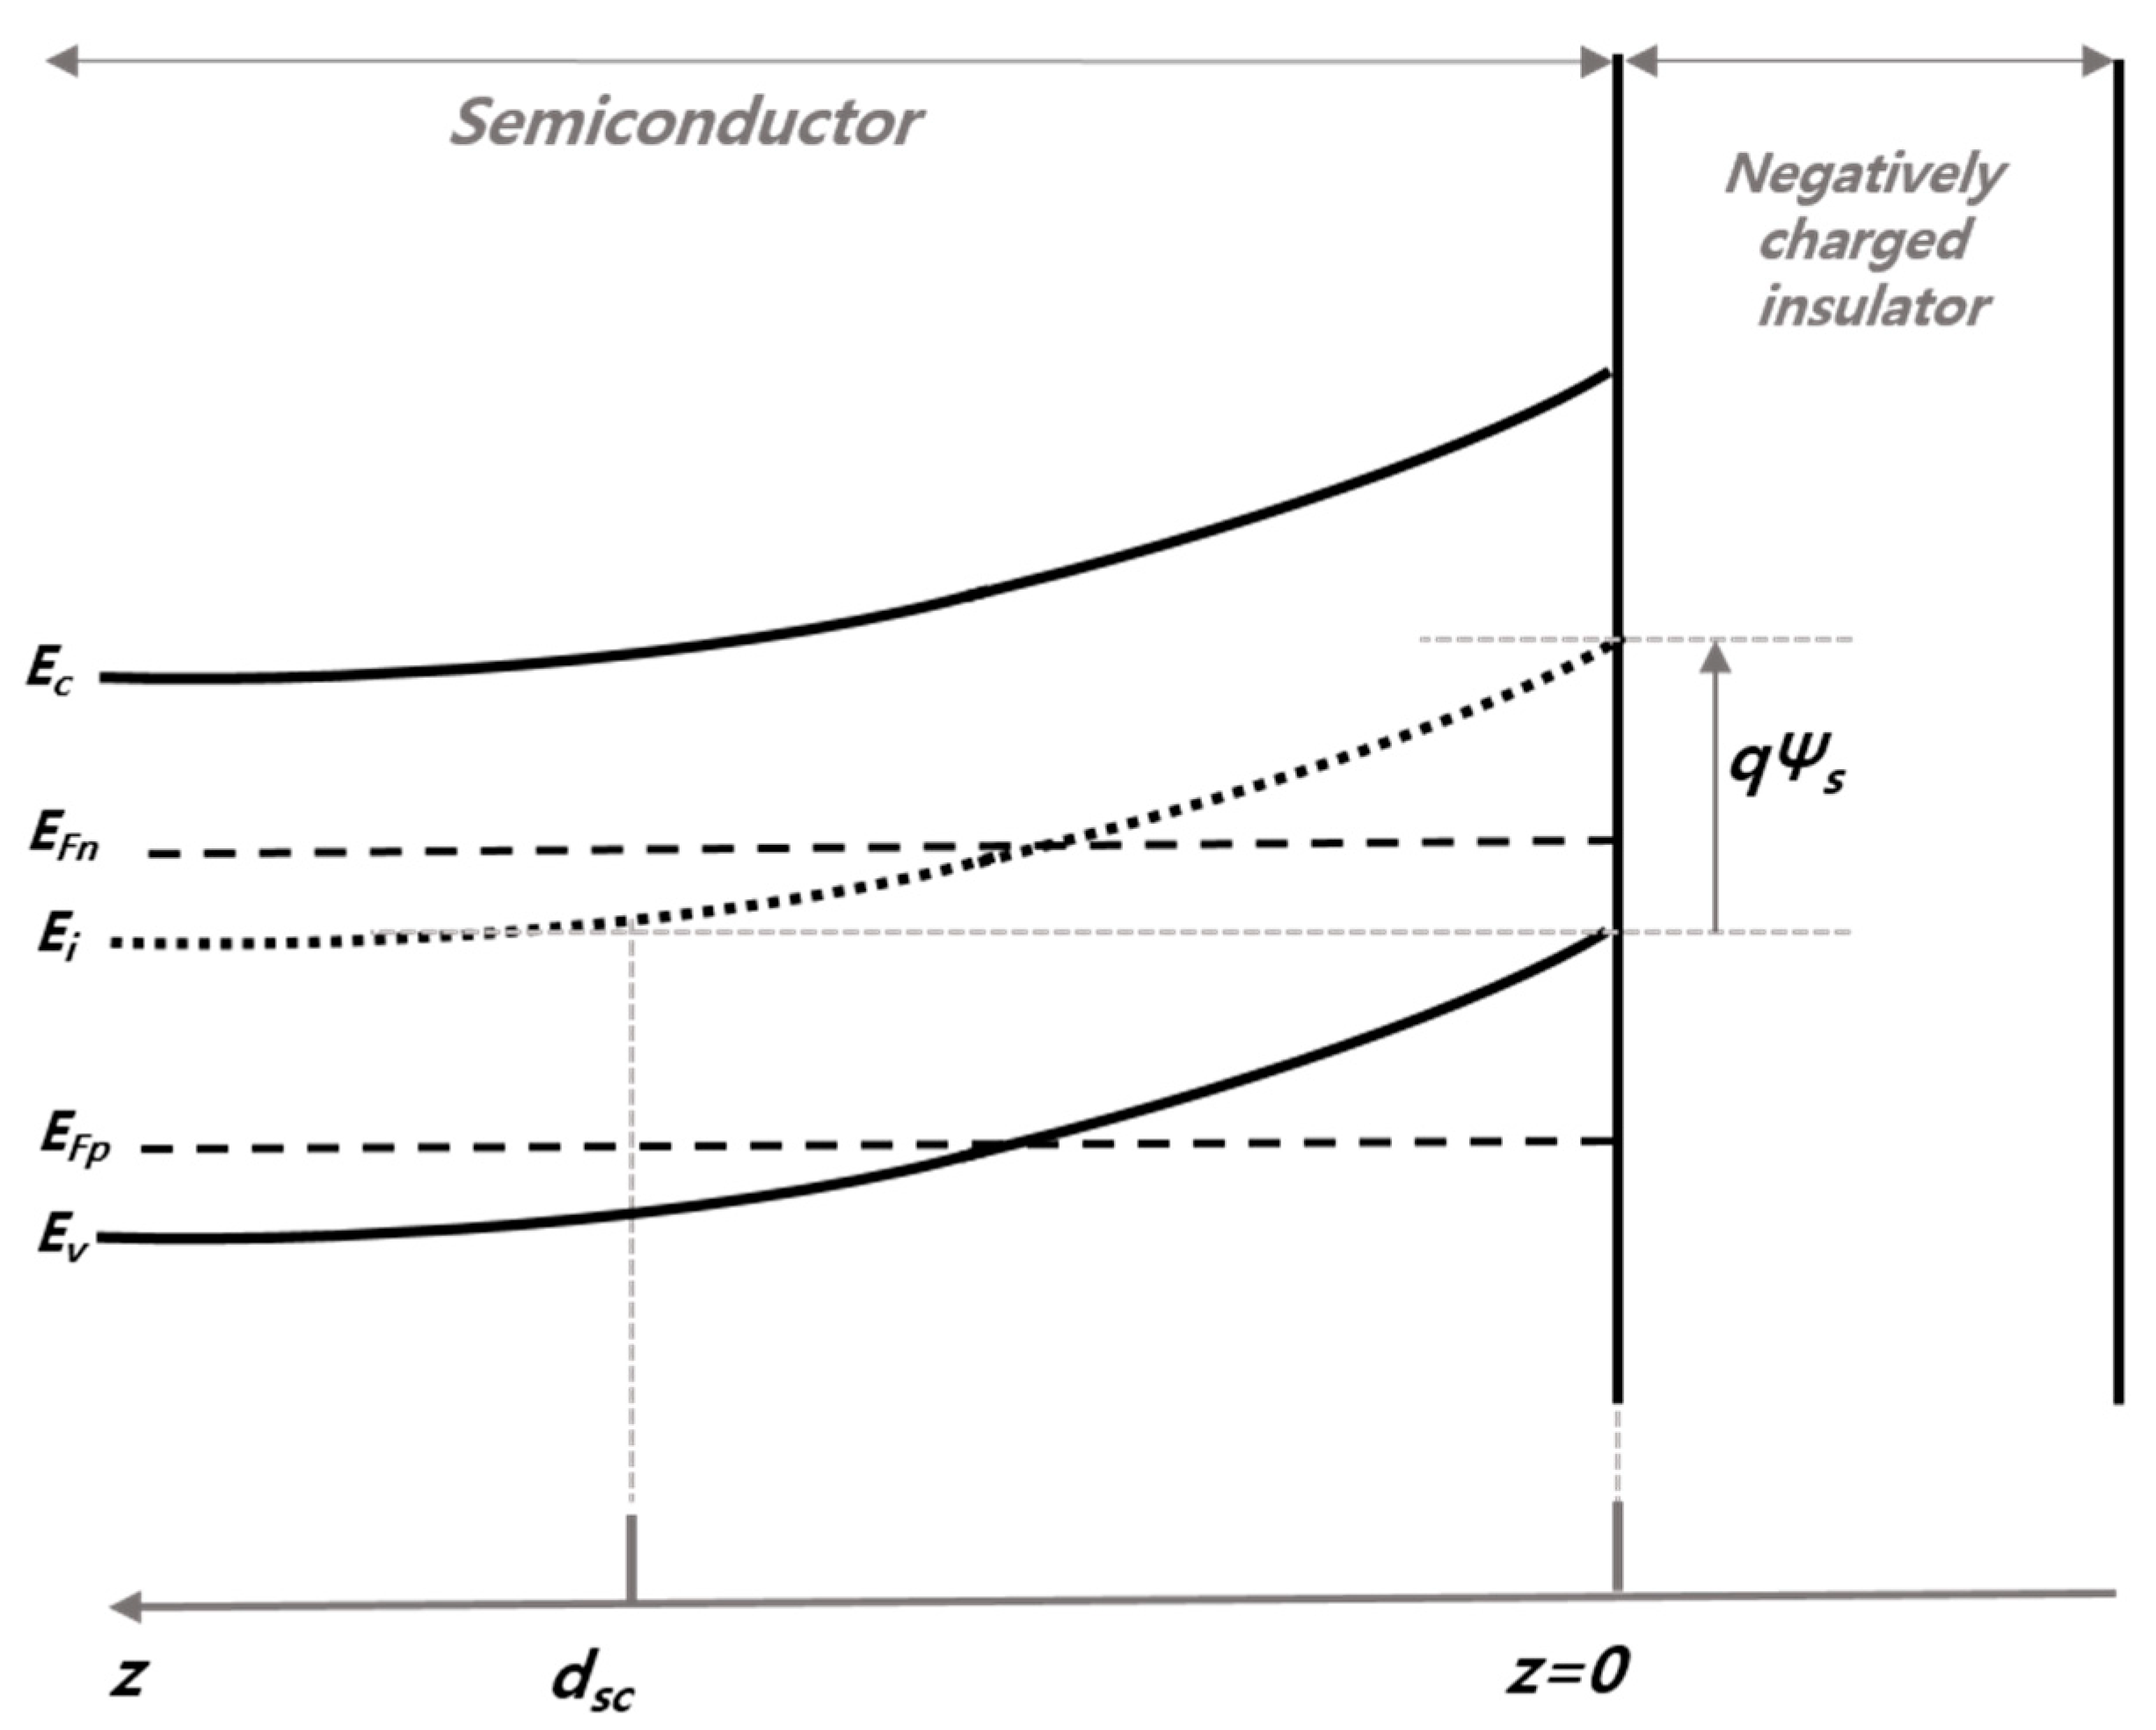
where S is the surface recombination velocity, Us is the surface recombination rate, and Δns is the excess carrier density at the surface, Sn0 and Sp0 are the surface recombination velocities of electrons and holes, ns and ps are the electron and hole concentrations at the surface, σn and σp are the capture cross-sections for electrons and holes, n1 and p1 are parameter in the SRH recombination equation and Dit is the number of surface states per unit area. However, if band bending exists on the Si surface by fixed charges (such as negative or positive charges), it is difficult to evaluate Δns because the carrier lifetime is determined by the carrier density in the bulk. To this end, we considered the surface of the semiconductor region (z = 0) and the space charge region (z < dsc), as shown in Figure 5.
Therefore, the effective surface recombination velocity (Seff) is the sum of the interface recombination velocity and the space charge recombination velocity, as shown in Equations (3)–(9) [35,36,37,38,39].
S e f f = 1 Δ n d s c [ U s + 0 d s c U ( z ) d z ] = S i t + S s c
Sit can be expressed in Equation (4) based on Equations (1) and (2).
S i t = 1 Δ n d s c [ ( n s p s n i 2 ) D i t V t h E g n s + n 1 + Δ n s σ p + p s + p 1 + Δ n s σ n ]
Ssc can be described by Equation (5) as follows by using Equations (6)–(9) for surface potential (Ψs) and surface electron and hole concentrations by effective charge density (Qf) [34,35].
S s c = 1 Δ n d s c 0 d s c ( n s ( z ) p s ( z ) n i 2 ) N s t V t h E g n s ( z ) + n 1 + Δ n s c σ p + p s ( z ) + p 1 + Δ n s c σ n d z
0 d s c n s ( z ) d z =   β λ D Ψ s 0 n ( Ψ ) F d Ψ   , 0 d s c p s ( z ) d z =   β λ D Ψ s 0 p ( Ψ ) F d Ψ  
Q f =   ε s F ( Ψ s , Φ p , Φ n ) q β λ D
F ( Ψ s , Φ p , Φ n ) = 2 p b + n b [ p b ( e β Ψ s + β Ψ s 1 ) + n b ( e β Ψ s β Ψ s 1 ) ]
p b = n i e β Φ p   ,   n b = n i e β Φ n
Here, Sit is the interface recombination velocity between the Si surface and the dielectric layer (z = 0), Ssc is the recombination velocity in the space charge region (z < dsc), dsc is the distance of the space charge region, and z is the coordinate perpendicular to the semiconductor surface and increases toward the bulk of Si, Vth is the thermal carrier velocity, Eg is the energy band gap of Si, Ψ is the surface potential, Qf is the fixed charge density, Φn and Φp are quasi-fermi level for electrons and holes, pb and nb are the carrier concentration for electrons and holes, ni is intrinsic carrier concentration. With Equation (3), we can calculate the theoretical effective surface carrier lifetime using Equation (10).
1 τ e f f = 1 τ i t + 1 τ s c = W 2 ( 1 s i t + 1 s s c )
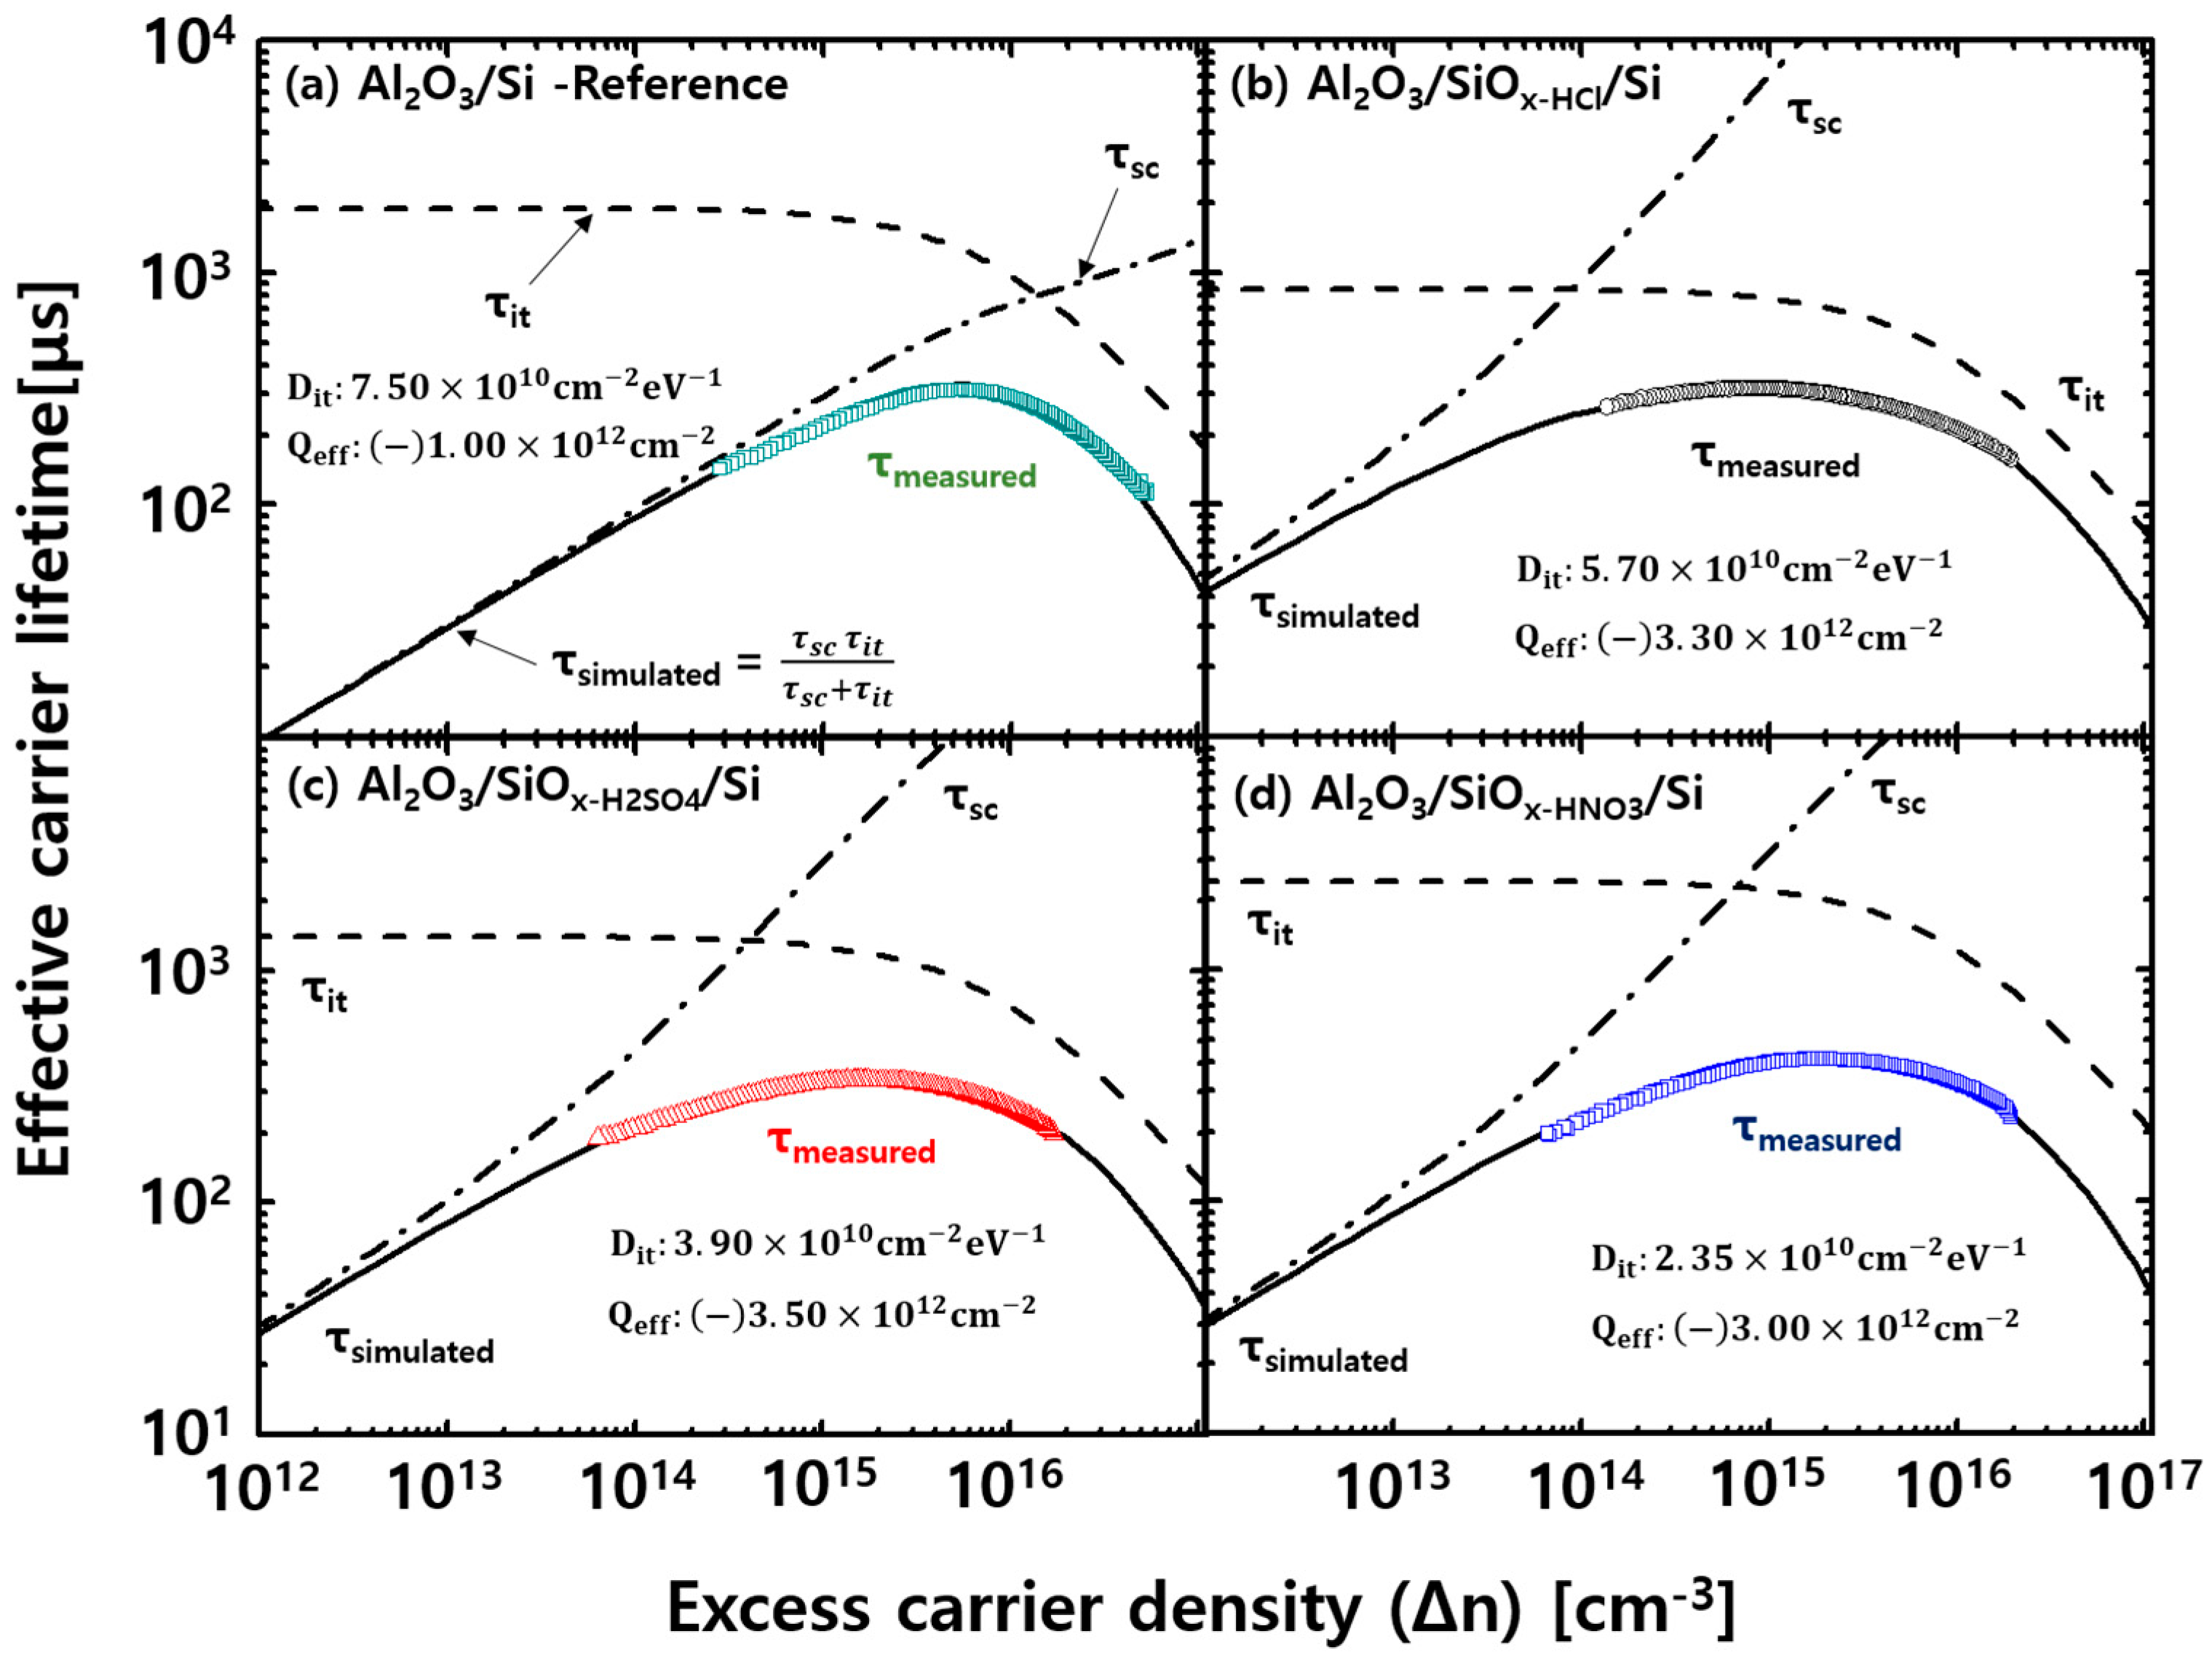
where τeff is the effective surface carrier lifetime, τit is the carrier lifetime in the interface region between the Si surface and the dielectric layer, τsc is the carrier lifetime in the space charge region, and W is the thickness of the wafer. The surface carrier lifetime simulation was performed by comparing the effective carrier lifetime (τmeasured) measured using Equation (10). Assuming that the capture cross-section of the electron and hole is σn = σp = 1 × 1015 cm2, we analyzed the interface trap density (Dit) and the fixed charge density (Qf) as variable parameters so that the curves of τsimulated and τmeasured matched well. Figure 6 shows the τsimulated and τmeasured curves.
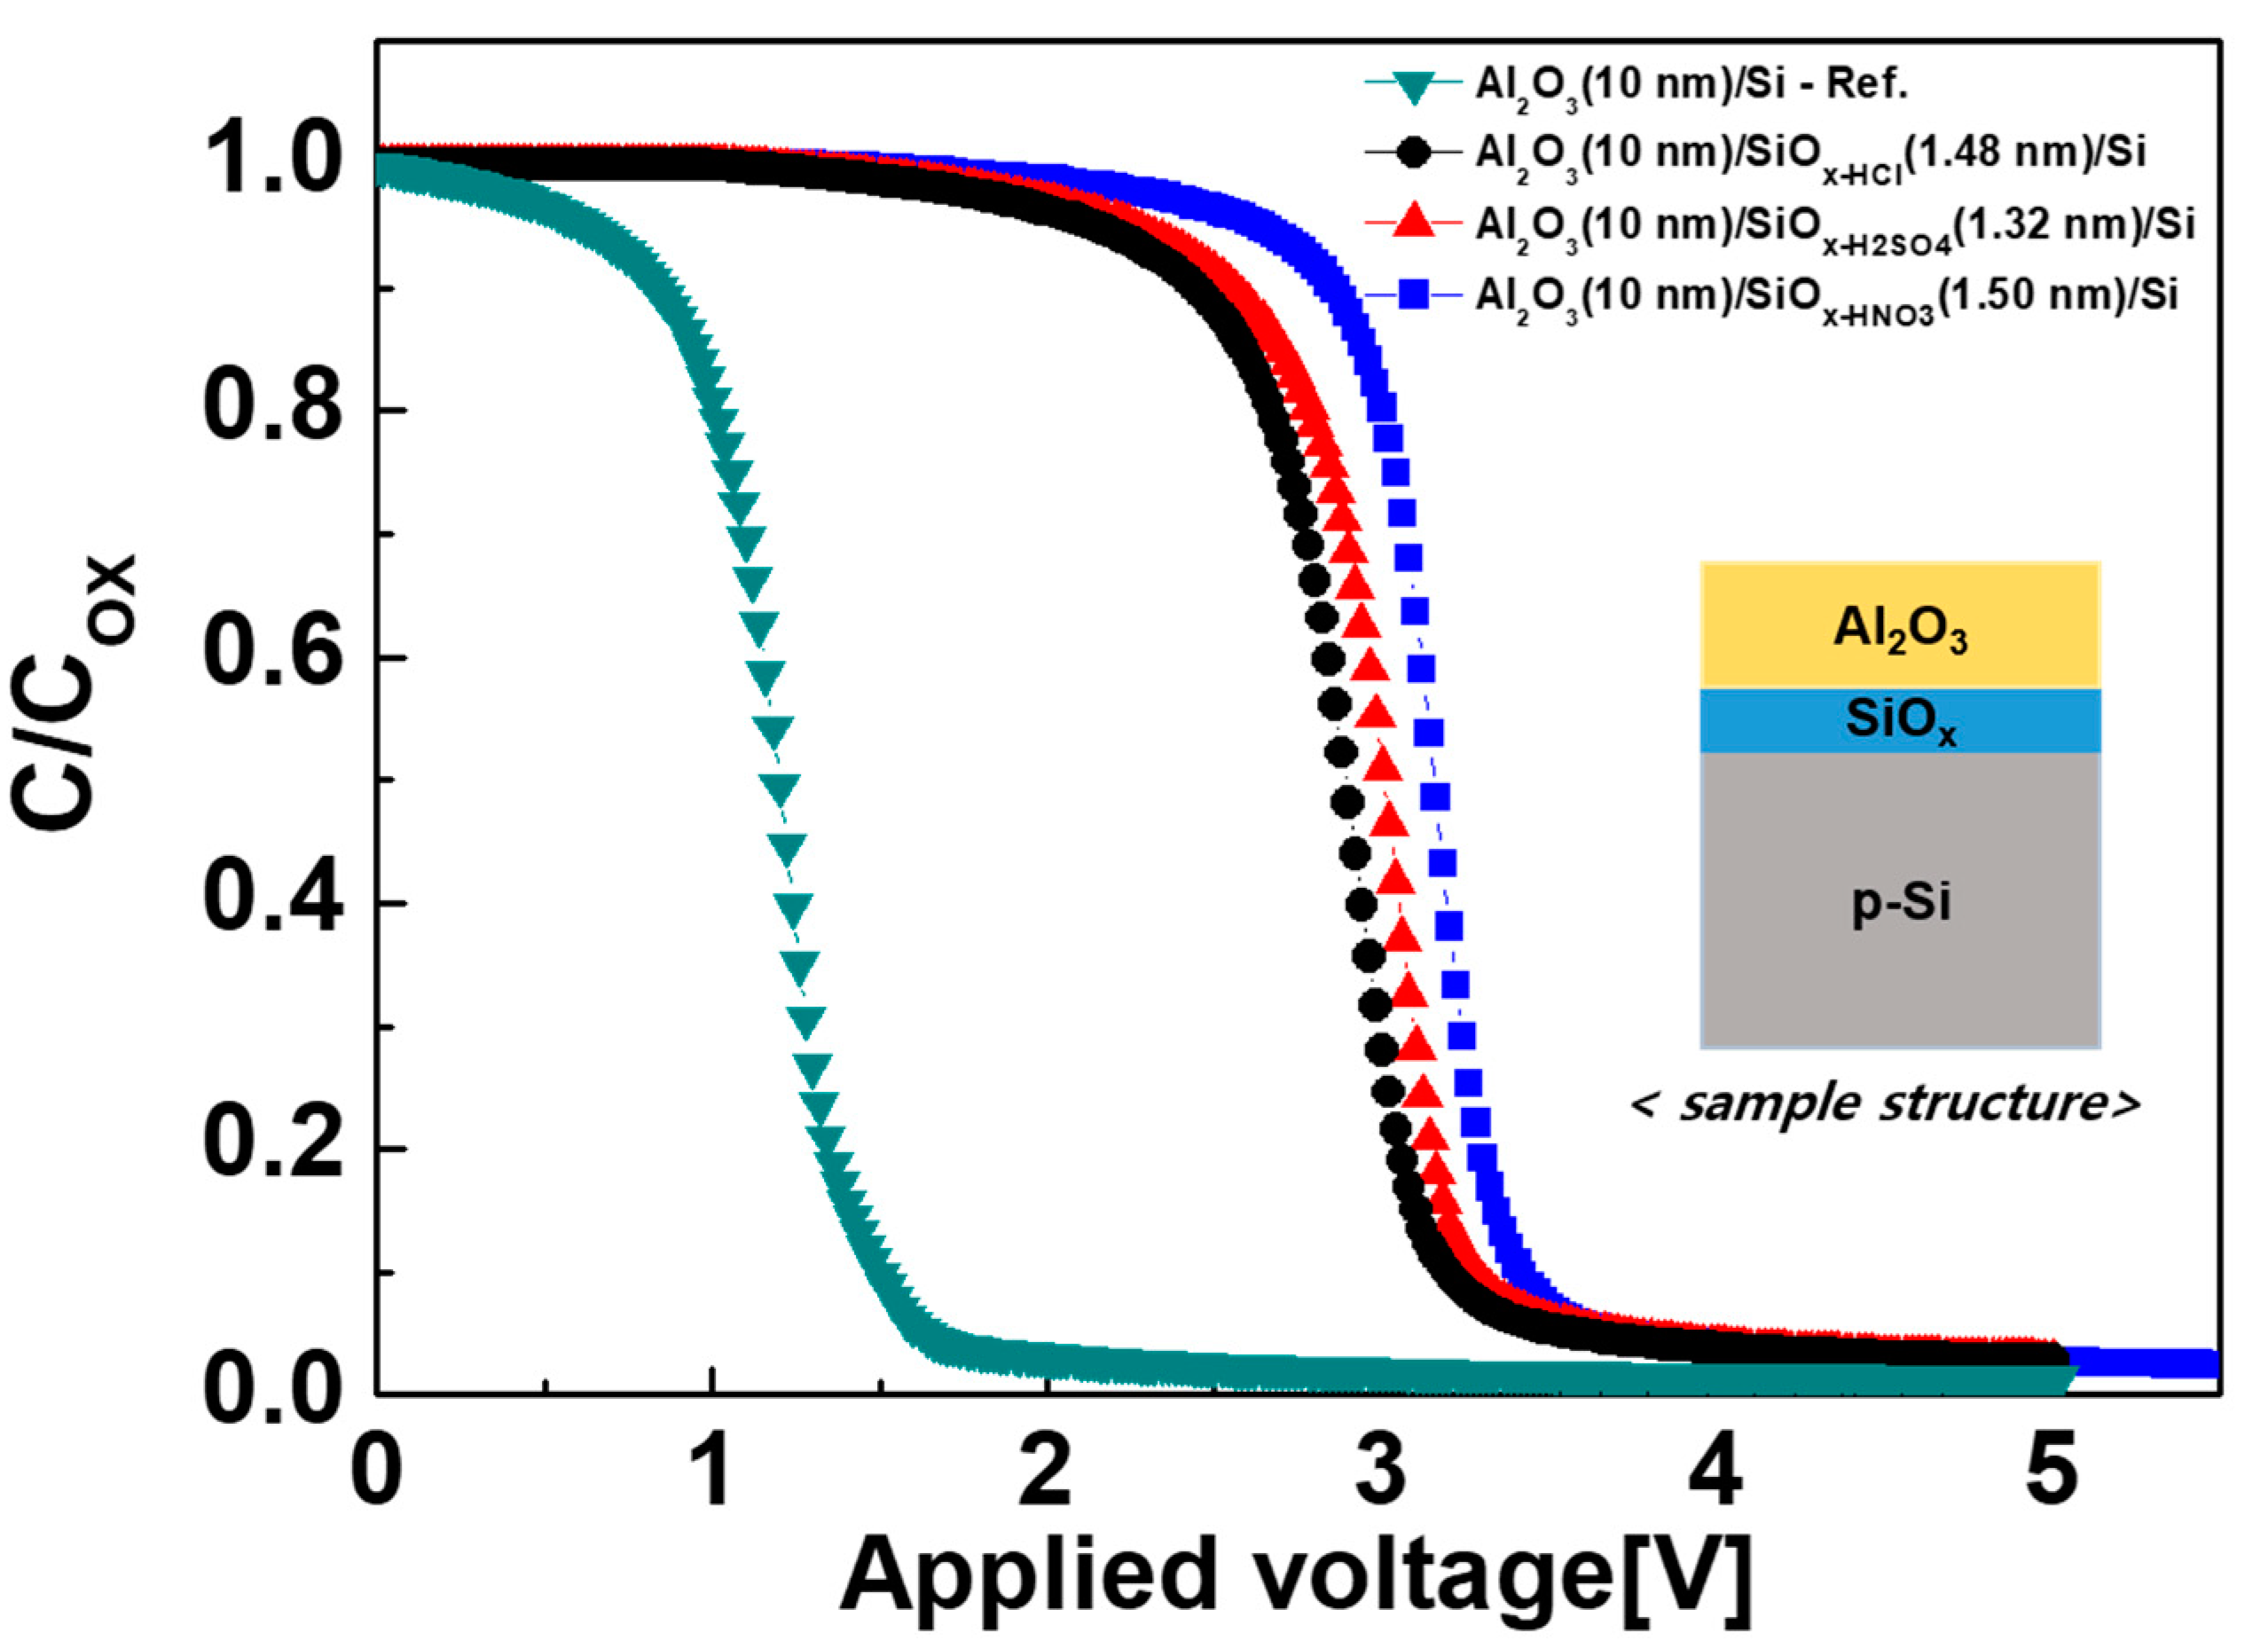
The surface carrier lifetime analysis results show that the Al2O3/SiOx-HNO3/SiOx sample exhibits a lower Dit (2.35 × 1010 cm−2eV−1) than the other samples (Table 2). The effective charge densities are similar regardless of the acidic solution used. Considering the lifetime of the SiOx-HNO3 layer and values of Qf and Dit extracted from the surface carrier lifetime analysis, the passivation properties would be more influenced by Dit than Qf. C–V measurements were also performed to compare the values of Dit and Qf with those obtained from the surface carrier lifetime analysis. The C–V measurement results show that VFB (flat band voltage) of the silicon substrates with wet chemical oxide layers shifts by 1.77–2.08 V toward the positive bias, as shown in Figure 7.
Qf was calculated using VFB extracted from the measured C–V graph, and Dit was obtained using the Terman method (Table 2) [40,41]. The negative Qf values of the silicon oxides formed in the different acidic solutions did not change significantly in the range of 3.03–3.24 × 1012 cm−2. However, Dit was markedly different depending on the acid solution used (Table 2). Therefore, we confirm that the quality of SiOx at the Al2O3/Si interface affects the passivation characteristics, and the insertion of a wet chemical oxide layer improved the passivation quality, compared with the SiOx layer simultaneously formed during the deposition of Al2O3.

4. Conclusions

In this study, we improved the interfacial properties of an Al2O3/Si structure by performing wet chemical oxidation on an Si substrate. The thickness of the wet chemical oxides grown on the Si surface in different acidic solutions was in the range of 1.32–1.5 nm, which was similar to that of SiOx naturally formed at the interface of the Al2O3/Si sample during PA-ALD deposition. In particular, SiOx-HNO3 showed a relatively lower leakage current than SiOx-HCl and SiOx-H2SO4. The carrier lifetime of Al2O3/SiOx-HNO3/Si measured by QSSPC to evaluate the passivation characteristics was ~ 400 µs, which was higher than those of the other SiOx-acidic layers (~317 µs for SiOx-HCl and ~332 µs for SiOx-H2SO4). C–V measurement and surface carrier lifetime analysis were performed to analyze the interface characteristics of the Al2O3/SiOx/Si samples. The fixed charges showed little change with the oxides, and the Dit values changed significantly. The wet chemical oxide formed in the HNO3 solution showed better passivation characteristics than those formed in other acidic solutions, resulting from the low interface trap density of SiOx-HNO3. We confirmed the improvement in the passivation characteristics of the Al2O3/Si sample by inserting a wet chemical oxide between Al2O3 and Si substrates. In addition, the values of the parameters associated with the interface properties, such as Qf and Dit, obtained from the C–V measurement and surface carrier lifetime simulation were similar. Therefore, this simulation can be a useful tool to analyze interfacial characteristics. Moreover, this study lays a foundation for analyzing the interfacial properties of samples, such as poly-Si/SiOx/Si structures with ultra-thin SiOx, that cannot be analyzed by C–V measurements.

Author Contributions

K.H.M. designed experiments, performed the experiments and wrote manuscripts; H.-e.S. and H.-S.L. wrote manuscripts and interpreted experimental findings; S.P., M.G.K., J.I.L., Y.K., D.K. supervised the studies; S.C. and M.S.J. participated in discussion. All authors have read and agreed to the published version of the manuscript.

Funding

This work was conducted under the framework of the Research and Development of the Korea Institute of Energy Research (C0-2402); the Technology Development Program to Solve Climate Changes of the National Research Foundation (NRF) funded by the Ministry of Science, ICT and Future Planning (2017M1A2A2086911).

Conflicts of Interest

The authors declare no conflict of interest.

References

  1. King, R.R.; Sinton, R.A. Studies of diffused phosphorus emitters: Saturation current, surface recombination velocity, and quantum efficiency. IEEE Trans. Electron. Dev. 1990, 37, 365–371. [Google Scholar] [CrossRef]
  2. Cuevas, A.; Basore, P.A.; Giroult-Matlakowski, G.; Dubois, C. Surface recombination velocity of highly doped n-type silicon. J. Appl. Phys. 1996, 80, 3370–3375. [Google Scholar] [CrossRef]
  3. Blakers, A.W.; Wang, A.; Milne, A.M.; Zhao, J.; Green, M.A. 22.8% efficient silicon solar cell. Appl. Phys. Lett. 1989, 55, 1363–1365. [Google Scholar] [CrossRef]
  4. Sterk, S.; Glunz, S.W.; Knobloch, J.; Wettling, W. High efficiency (>22%) Si-solar cells with optimized emitter. In Proceedings of the IEEE 1st World Conference on Photovoltaic Energy Conversion, Waikoloa, HI, USA, 5–9 December 1994. [Google Scholar]
  5. Zhang, S.; Yao, Y.; Hu, D.; Lian, W.; Qian, H.; Jie, J.; Wei, Q.; Ni, Z.; Zhang, X.; Xie, L. Application of silicon oxide on high efficiency monocrystalline silicon PERC solar cells. Energies 2019, 12, 1168. [Google Scholar] [CrossRef] [Green Version]
  6. Gong, L.; Zhou, C.; Zhu, J.; Wang, W. Passivation characteristics of new silicon oxide. IEEE J. Photovolt. 2019, 9, 1873–1879. [Google Scholar] [CrossRef] [Green Version]
  7. Aberle, A.G.; Lauinger, T.; Schmidt, J.; Hezel, R. Injection-level dependent surface recombination velocities at the silicon-plasma silicon nitride interface. Appl. Phys. Lett. 1995, 66, 2828–2830. [Google Scholar] [CrossRef]
  8. Schmidt, J.; Aberle, A.G. Carrier recombination at silicon–silicon nitride interfaces fabricated by plasma-enhanced chemical vapor deposition. J. Appl. Phys. 1999, 85, 3626–3633. [Google Scholar] [CrossRef]
  9. Lelièvre, J.-F.; Kafle, B.; Saint-Cast, P.; Brunet, P.; Magnan, R.; Hernandez, E.; Pouliquen, S.; Massines, F. Efficient silicon nitride SiNx:H antireflective and passivation layers deposited by atmospheric pressure PECVD for silicon solar cells. Prog. Photovolt. Res. Appl. 2020, 27, 1007–1019. [Google Scholar] [CrossRef]
  10. Hoex, B.; Schmidt, J.; Bock, R.; Altermatt, P.P.; Van de Sanden, M.C.M.; Kessels, W.M.M. Excellent passivation of highly doped p-type Si surfaces by the negative-charge-dielectric Al2O3. Appl. Phys. Lett. 2007, 91, 112107. [Google Scholar] [CrossRef] [Green Version]
  11. Richter, A.; Benick, J.; Hermle, M. Boron emitter passivation with Al2O3 and Al2O3/SiNx stacks using ALD Al2O. IEEE J. Photovolt. 2013, 3, 236–245. [Google Scholar] [CrossRef]
  12. Lin, Y.-H.; Wu, Y.-C.; You, H.-C.; Chen, C.-H.; Chen, P.-H.; Tsai, Y.-H.; Yang, Y.-Y.; Chang-Liao, K.S. Silicon heterojunction solar cells using AlOx and plasma-immersion ion implantation. Energies 2014, 7, 3653–3663. [Google Scholar] [CrossRef] [Green Version]
  13. Dicks, O.A.; Cottom, J.; Shluger, A.L.; Afamas’ev, V.V. The origin of negative charging in amorphous Al2O3 films: The role of native defects. Nanotechnology 2019, 30, 205201. [Google Scholar] [CrossRef] [PubMed]
  14. Yang, X.; Weber, K.; Hameiri, Z.; De Wolf, S. Industrially feasible, dopant-free, carrier-selective contacts for high-efficiency silicon solar cells. Prog. Photovolt. Res. Appl. 2017, 25, 896–904. [Google Scholar] [CrossRef]
  15. Lee, Y.-T.; Lin, F.-R.; Lin, T.-C.; Chen, C.-H.; Pei, Z. Low-temperature, chemically grown titanium oxide thin films with a high hole tunneling rate for Si solar cells. Energies 2016, 9, 402. [Google Scholar] [CrossRef] [Green Version]
  16. Chen, T.-C.; Yang, T.-C.; Cheng, H.-E.; Yu, I.-S.; Yang, Z.-P. Single material TiO2 thin film by atomic layer deposition for antireflection and surface passivation applications on p-type c-Si. Appl. Surf. Sci. 2018, 451, 121–127. [Google Scholar] [CrossRef]
  17. Geissbühler, J.; Werner, J.; Martin de Nicolas, S.; Barraud, L.; Hessler-Wyser, A.; Despeisse, M.; Nicolay, S.; Tomasi, A.; Niesen, B.; De Wolf, S.; et al. 22.5% efficient silicon heterojunction solar cell with molybdenum oxide hole collector. Appl. Phys. Lett. 2015, 107, 081601. [Google Scholar] [CrossRef] [Green Version]
  18. Bivour, M.; Temmler, J.; Steinkemper, H.; Hermle, M. Molybdenum and tungsten oxide: High work function wide band gap contact materials for hole selective contacts of silicon solar cells. Sol. Energy. Mater. Sol. Cells 2015, 142, 34–41. [Google Scholar] [CrossRef]
  19. Römer, U.; Peibst, R.; Ohrdes, T.; Lim, B.; Krügener, J.; Wietler, T.; Brendel, R. Ion implantation for poly-Si passivated back-junction back-contacted solar cells. IEEE J. Photovolt. 2015, 5, 507–514. [Google Scholar] [CrossRef]
  20. Moldovan, A.; Feldmann, F.; Zimmer, M.; Rentsch, J.; Benick, J.; Hermle, M. Tunnel oxide passivated carrier-selective contacts based on ultra-thin SiO2 layers. Sol. Energy Mater. Sol. Cells 2015, 142, 123–127. [Google Scholar] [CrossRef]
  21. Choi, S.; Min, K.H.; Jeon, M.S.; Lee, J.I.; Kang, M.G.; Song, H.-E.; Kang, Y.; Lee, H.-S.; Kim, D.; Kim, K.-H. Structural evolution of tunneling oxide passivating contact upon thermal annealing. Sci. Rep. 2017, 7, 12853. [Google Scholar] [CrossRef] [Green Version]
  22. Feldmann, F.; Reichel, C.; Müller, R.; Hermle, M. The application of poly-Si/SiOx contacts as passivated top/rear contacts in Si solar cells. Sol. Energy. Mater. Sol. Cells 2017, 159, 256–271. [Google Scholar] [CrossRef]
  23. Hoex, B.; Gielis, J.J.H.; van de Sanden, M.C.M.; Kessels, W.M.M. On the c-Si surface passivation mechanism by the negative-charge-dielectric Al2O3. J. Appl. Phys. 2008, 104, 1113703. [Google Scholar] [CrossRef] [Green Version]
  24. Naumann, V.; Otto, M.; Wehrspohn, R.B.; Werner, M.; Hagendorf, C. Interface and material characterization of thin ALD-Al2O3 layers on crystalline silicon. Energy Procedia 2012, 27, 312–318. [Google Scholar] [CrossRef]
  25. Kersten, F.; Schmid, A.; Bordihn, S.; Müller, J.W.; Heitmann, J. Role of annealing conditions on surface passivation properties of ALD Al2O3 films. Energy Procedia 2013, 38, 843–848. [Google Scholar] [CrossRef] [Green Version]
  26. Veith, B.; Werner, F.; Zielke, D.; Brendel, R.; Schmidt, J. Comparison of the thermal stability of single Al2O3 layers and Al2O3/SiNx stacks for the surface passivation of silicon. Energy Procedia 2011, 8, 307–312. [Google Scholar] [CrossRef] [Green Version]
  27. Dingemans, G.; Terlinden, N.M.; Verheijen, M.A.; van de Sanden, M.C.M.; Kessels, W.M.M. Controlling the fixed charge and passivation properties of Si(100)/Al2O3 interfaces using ultrathin SiO2 interlayers synthesized by atomic layer deposition. J. Appl. Phys. 2011, 110, 093715. [Google Scholar] [CrossRef]
  28. Kobayashi, H.; Yamashita, Y.; Nakato, Y.; Komeda, T.; Nishioka, Y. Interface states at ultrathin oxide/Si(111) interfaces obtained from x-ray photoelectron spectroscopy measurements under biases. Appl. Phys. Lett. 1996, 69, 2276–2278. [Google Scholar] [CrossRef]
  29. Imamura, K.; Takahashi, M.; Asuha; Hirayama, Y.; Imai, S.; Kobayashi, H. Nitric acid oxidation of Si method at 120 °C: HNO3 concentration dependence. J. Appl. Phys. 2010, 107, 054503. [Google Scholar] [CrossRef]
  30. Kobayashi Asuha, H.; Maida, O.; Takahashi, M.; Iwasa, H. Nitric acid oxidation of Si to form ultrathin silicon dioxide layers with a low leakage current density. J. Appl. Phys. 2003, 94, 7328–7335. [Google Scholar] [CrossRef]
  31. Laades, A.; Angermann, H.; Sperlich, H.-P.; Stürzebecher, U.; Álvarez, C.A.D.; Bähr, M.; Lawerenz, A. Wet chemical oxidation of silicon surfaces prior to the deposition of all-PECVD AlOx/a-SiNx passivation stacks for silicon solar cells. Solid State Phenom. 2013, 195, 310–313. [Google Scholar] [CrossRef]
  32. Bordihn, S.; Engelhart, P.; Mertens, V.; Kesser, G.; Köhn, D.; Dingemans, G.; Mandoc, M.M.; Müller, J.W.; Kessels, W.M.M. High surface passivation quality and thermal stability of ALD Al2O3 on wet chemical grown ultra-thin SiO2 on silicon. Energy Procedia 2011, 8, 654–659. [Google Scholar] [CrossRef] [Green Version]
  33. Kern, W. The evolution of silicon wafer cleaning technology. J. Elecrochem. Soc. 1990, 137, 1887–1892. [Google Scholar] [CrossRef]
  34. Sinton, R.A.; Cuevas, A. Contactless determination of current-voltage characteristics and minority carrier lifetimes in semiconductors from quasi-steady-state photoconductance data. Appl. Phys. Lett. 1996, 69, 2510–2512. [Google Scholar] [CrossRef]
  35. Aberle, A.G. Crystalline Silicon Solar Cells, Advanced Surface Passivation and Analysis; UNSW: Sydney, Australia, 2009. [Google Scholar]
  36. Bonilla, R.S.; Hoex, B.; Hamer, P.; Wilshaw, P.R. Dielectric surface passivation for silicon solar cells: A review. Phys. Status Solidi A 2017, 214, 1700293. [Google Scholar] [CrossRef] [Green Version]
  37. Schmidt, J.; Moschner, J.D.; Henze, J.; Dauwe, S.; Hezel, R. Recent progress in the surface passivation of silicon solar cells using silicon nitride. In Proceedings of the 19th European Photovoltaic Solar Energy Conference, Paris, France, 7–11 June 2004; pp. 391–396. [Google Scholar]
  38. McIntosh, K.R.; Black, L.E. On effective surface recombination parameters. J. Appl. Phys. 2014, 116, 014503. [Google Scholar] [CrossRef] [Green Version]
  39. Ma, F.-J.; Hoex, B.; Samudra, G.S.; Aberle, A.G. Modelling and simulation of field-effect surface passivation of crystalline silicon-based solar cells. Energy Procedia 2012, 15, 155–161. [Google Scholar] [CrossRef] [Green Version]
  40. Terman, L.M. An investigation of surface states at a silicon/silicon oxide interface employing metal-oxide-silicon diodes. Solid State Electron. 1962, 5, 285–299. [Google Scholar] [CrossRef]
  41. Nicollian, E.H.; Brews, J.R. MOS (Metal Oxide Semiconductor) Physics and Technology; Wiley: New York, NY, USA, 1982. [Google Scholar]
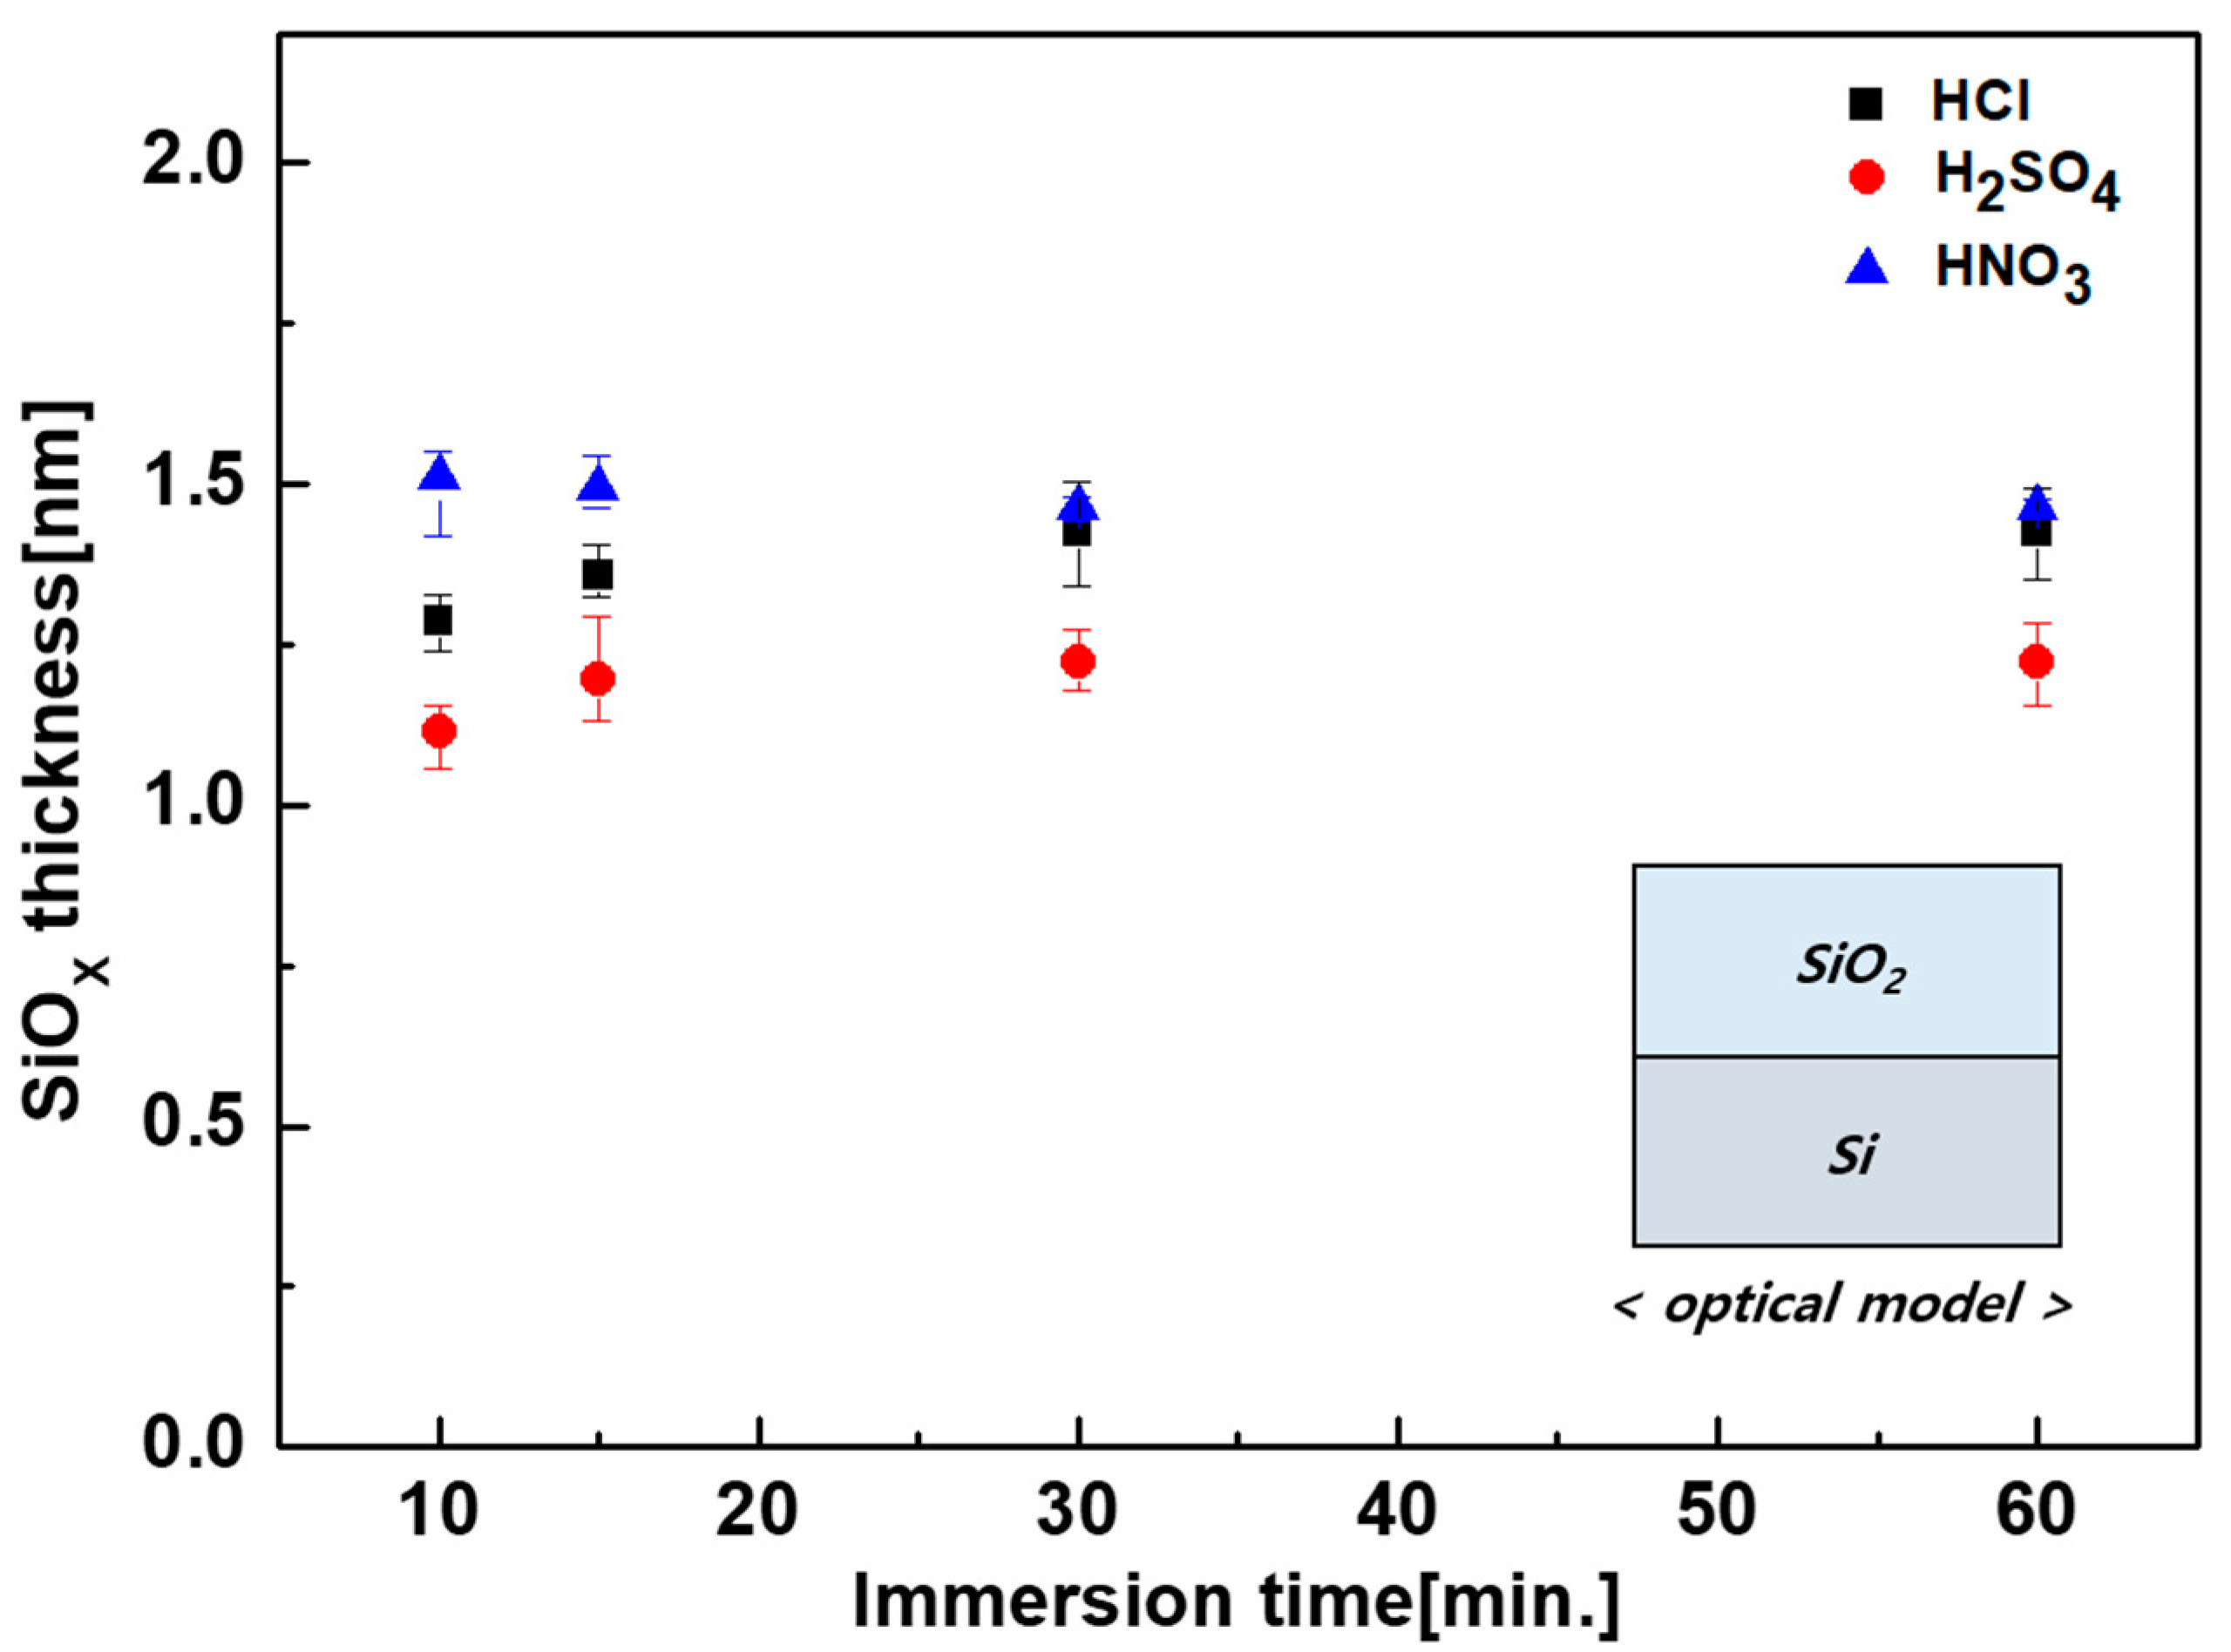
Figure 1. Measured thicknesses of wet chemical oxide (SiOx) layers prepared in different acid solutions as a function of the immersion time. The optical model is shown in the insert (right bottom) for ellipsometry analysis.
Energies 13 01803 g001
Figure 2. Transmission electron microscopy (TEM) images of the wet chemical oxide (SiOx-HNO3) layer in an SiNx/SiOx/Si structure.
Energies 13 01803 g002
Figure 3. Current–voltage curves under dark condition for SiOx/Si formed in different acidic solutions. The SiOx thickness is 1.49 nm for SiOx-HCl, 1.32 nm for SiOx-H2SO4, and 1.50 nm for SiOx-HNO3, respectively.
Energies 13 01803 g003
Figure 4. Effective carrier lifetime curves as a function of the excess carrier density (Δn) for Al2O3/SiOx-acidic/Si structures and Al2O3/Si reference sample. The Al2O3 thickness is 10 nm and the SiOx thicknesses are 1.49 nm for SiOx-HCl, 1.32 nm for SiOx-H2SO4, and 1.50 nm for SiOx-HNO3, respectively.
Energies 13 01803 g004
Figure 5. Energy band diagram for a semiconductor–insulator interface under illumination, where the semiconductor is p-type and the insulator is negatively charged (i.e., Al2O3). The diagram shows the energy of the conduction band Ec, the valence band Ev, the intrinsic fermi level Ei, as well as the quasi-fermi energy of electrons EFn and holes EFp. The distance z = 0 represents the interface between the semiconductor and the negatively charged insulator, and z = dsc represents the distance of the space charge region. Ψs is the surface potential.
Energies 13 01803 g005
Figure 6. Measured and simulated effective carrier lifetime curves at Al2O3/SiOx-acidic/Si structures as a function of excess carrier density (Δn). The solid line indicates the simulated effective carrier lifetime (τsimulated), the dash line indicates the effective carrier lifetime via interface state (τit), and the dotted dash line indicates the effective carrier lifetime via surface space charge region (τsc). The electron and hole capture cross-sections are assumed to be equal, σn = σp = 1 × 1015 cm2.
Energies 13 01803 g006
Figure 7. Capacitance–voltage curves at 1 MHz of Al2O3/SiOx-acidic/Si structures and Al2O3/Si reference sample for calculating the fixed charge density (Qf) and interface trap density (Dit).
Energies 13 01803 g007
Table 1. SiOx layer thickness and refractive index (n) at an immersion time of 15 min. The data are averaged with ten samples.
SolutionThickness (nm)Refractive Index (n) at 630 nm
HCl1.491.421
H2SO41.321.417
HNO31.501.430
Table 2. Results of capacitance–voltage (C–V) and surface carrier lifetime analyses.
Sample
(Average of Five Samples)
Capacitance–Voltage (C–V) AnalysisSurface Carrier Lifetime Analysis
Qf
(1012 cm−2)
Dit
(1010 cm−2eV−1)
VFB
(V)
Qf
(1012 cm−2)
Dit
(1010 cm−2eV−1)
Al2O3/Si−1.537.011.20−1.007.50
Al2O3/SiOx-HCl/Si−3.034.942.97−3.305.70
Al2O3/SiOx-H2SO4/Si−3.124.603.12−3.503.90
Al2O3/SiOx-HNO3/Si−3.242.883.28−3.522.30