Selection of Artificial Lift Methods: A Brief Review and New Model Based on Fuzzy Logic

 ,
,
Abstract
:
1. Introduction
- These should satisfy the individual requirements of the manufacturer and company
- Selected methods are acceptable to operations managers.
2. Brief Overview of the Techniques for Selecting Optimal Artificial Lift Methods
Cross-Sectional Analysis of Presented Research
- Characteristics of reservoir, well and fluid (depth, pressure, production, and technical limitations of artificial lift methods)
- Conditions in which the well operates (location, availability of energy, training of people, etc.)
- Economic factors (capital costs, operating costs, and maintenance costs.)
- there are several input parameters (I, II, III);
- for the first and third groups, parameters are measurable and can be displayed numerically;
- In the second group, parameters are from different processes dominated by uncertainty, multidimensionality, subjectivity, and indeterminacy, and can only be displayed expertly.
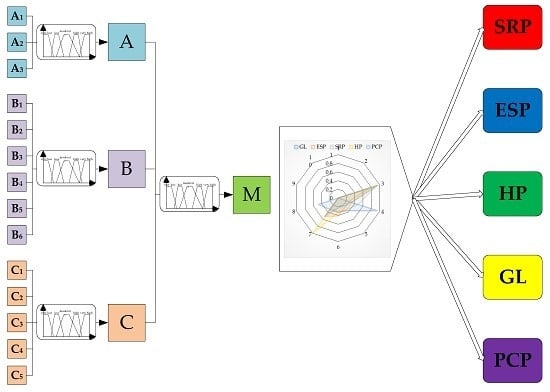
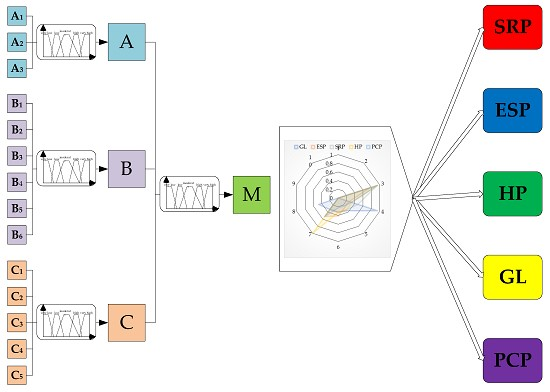
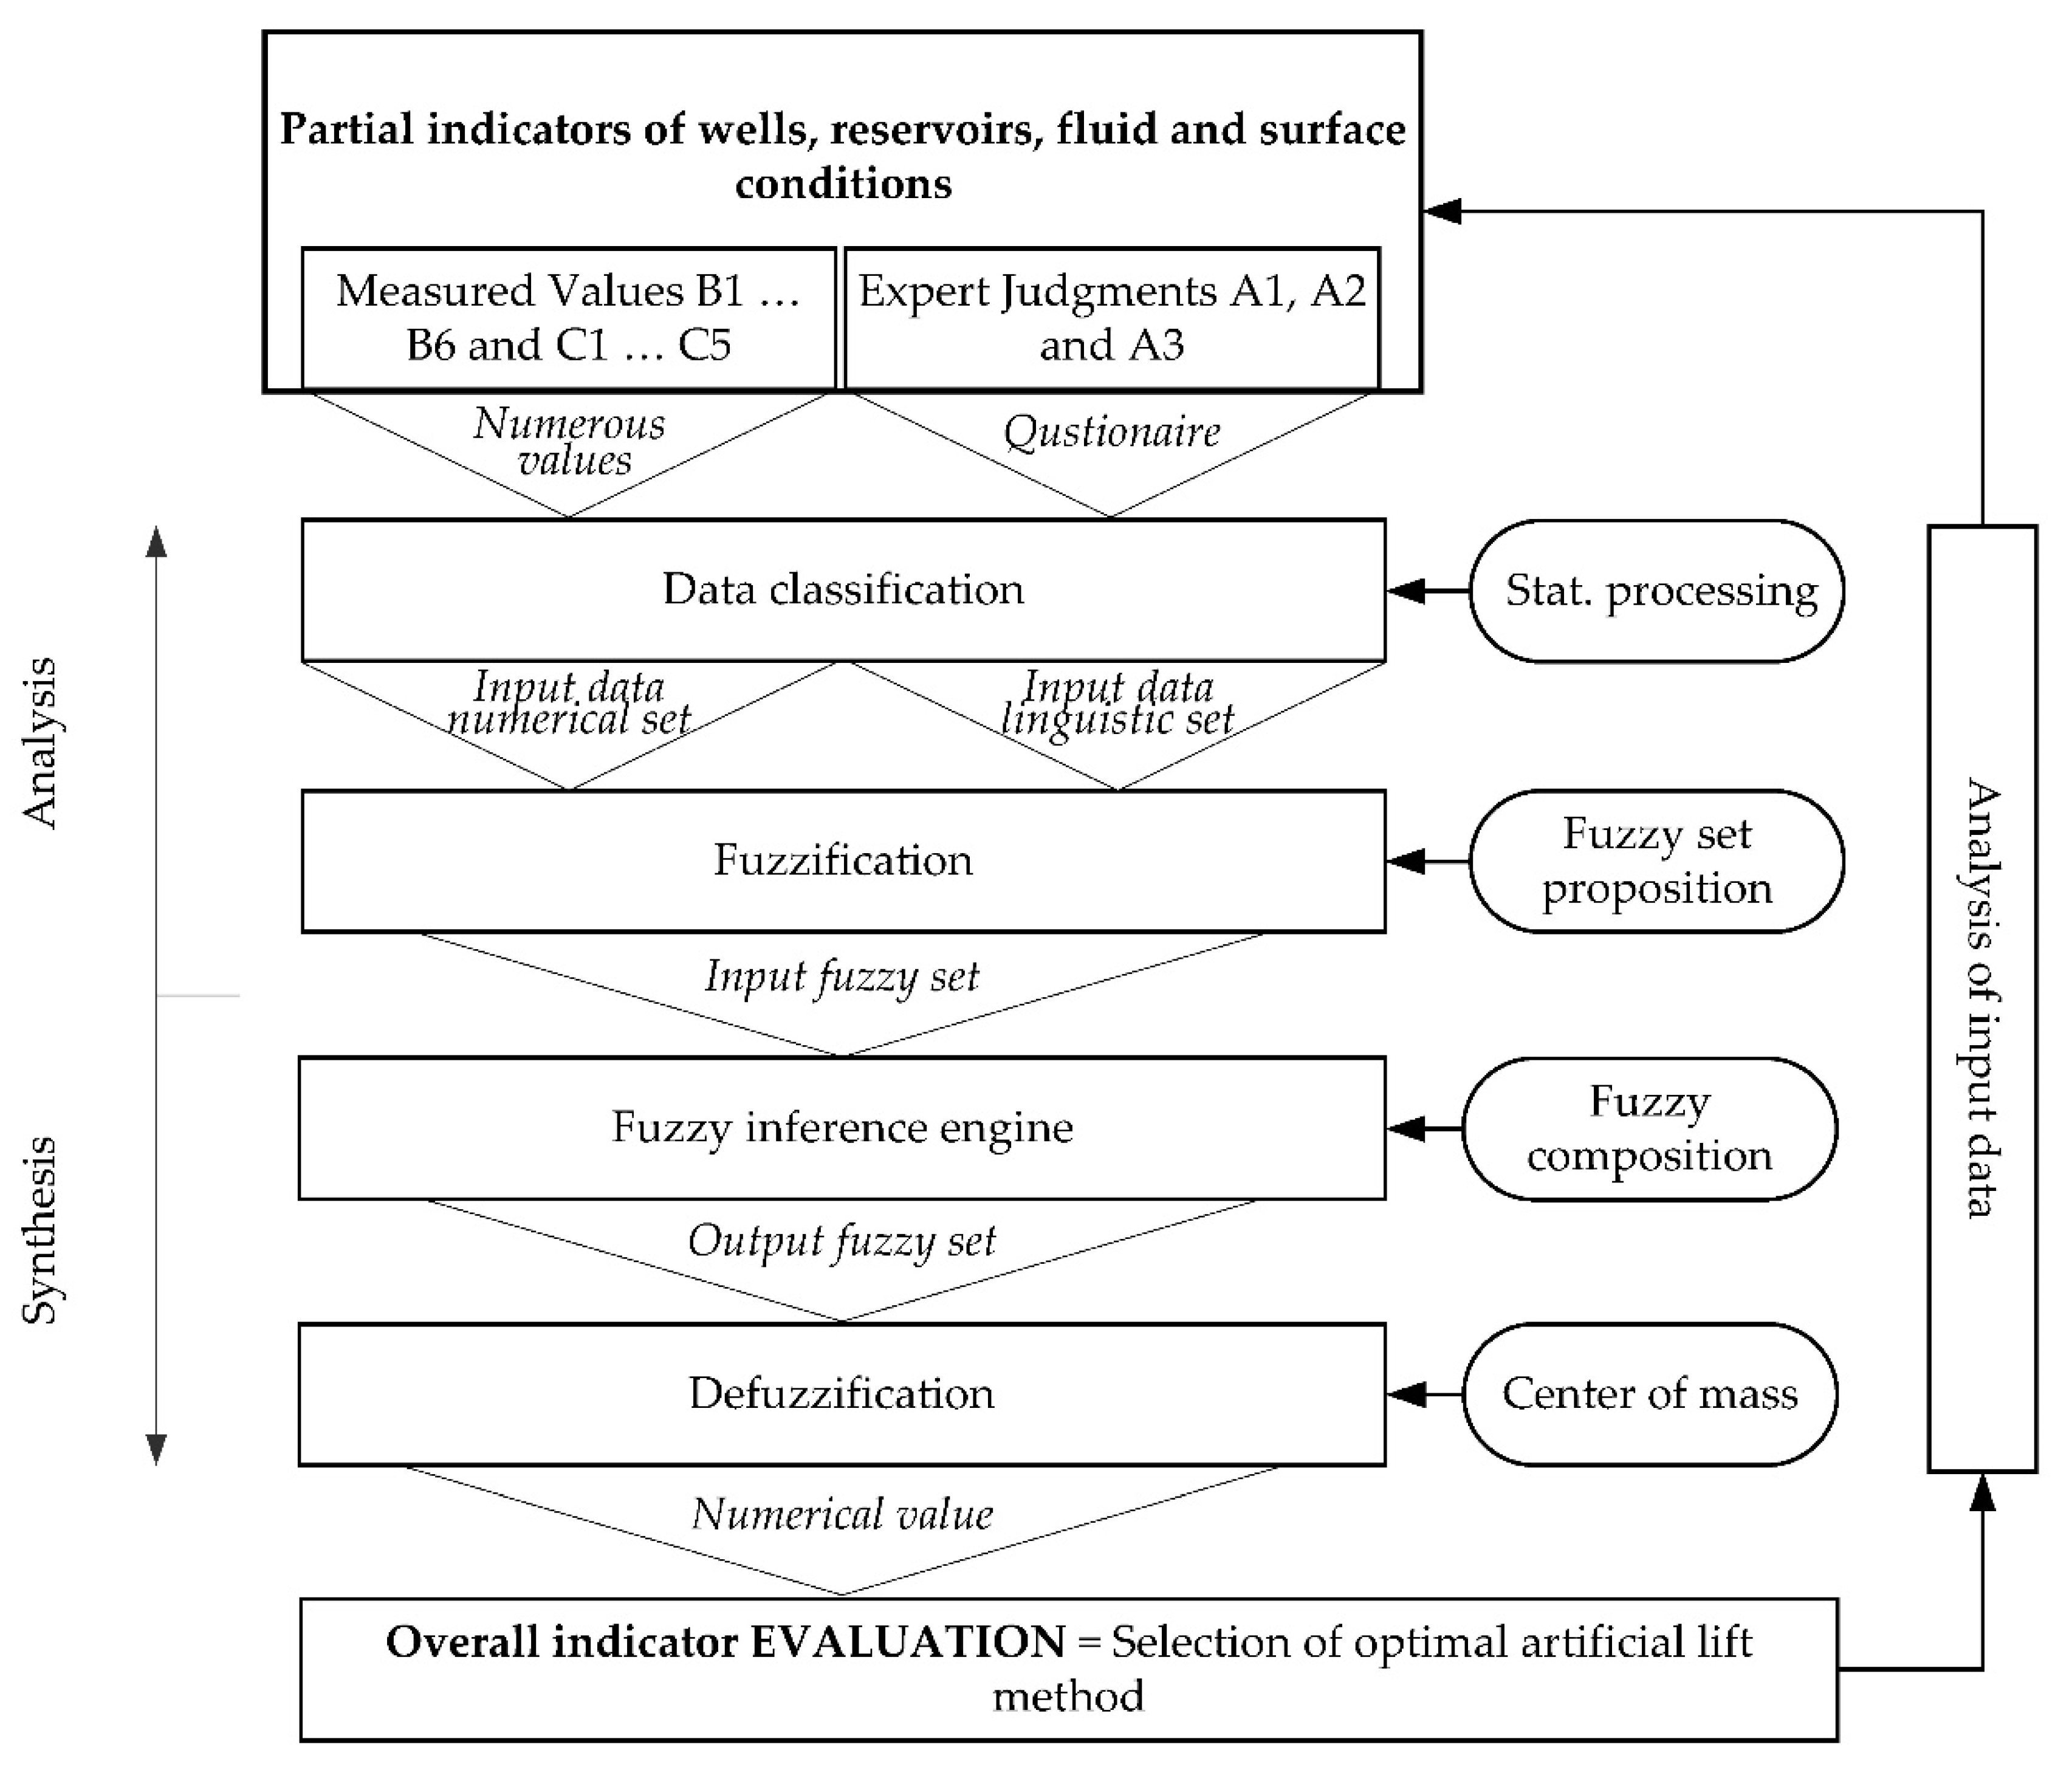
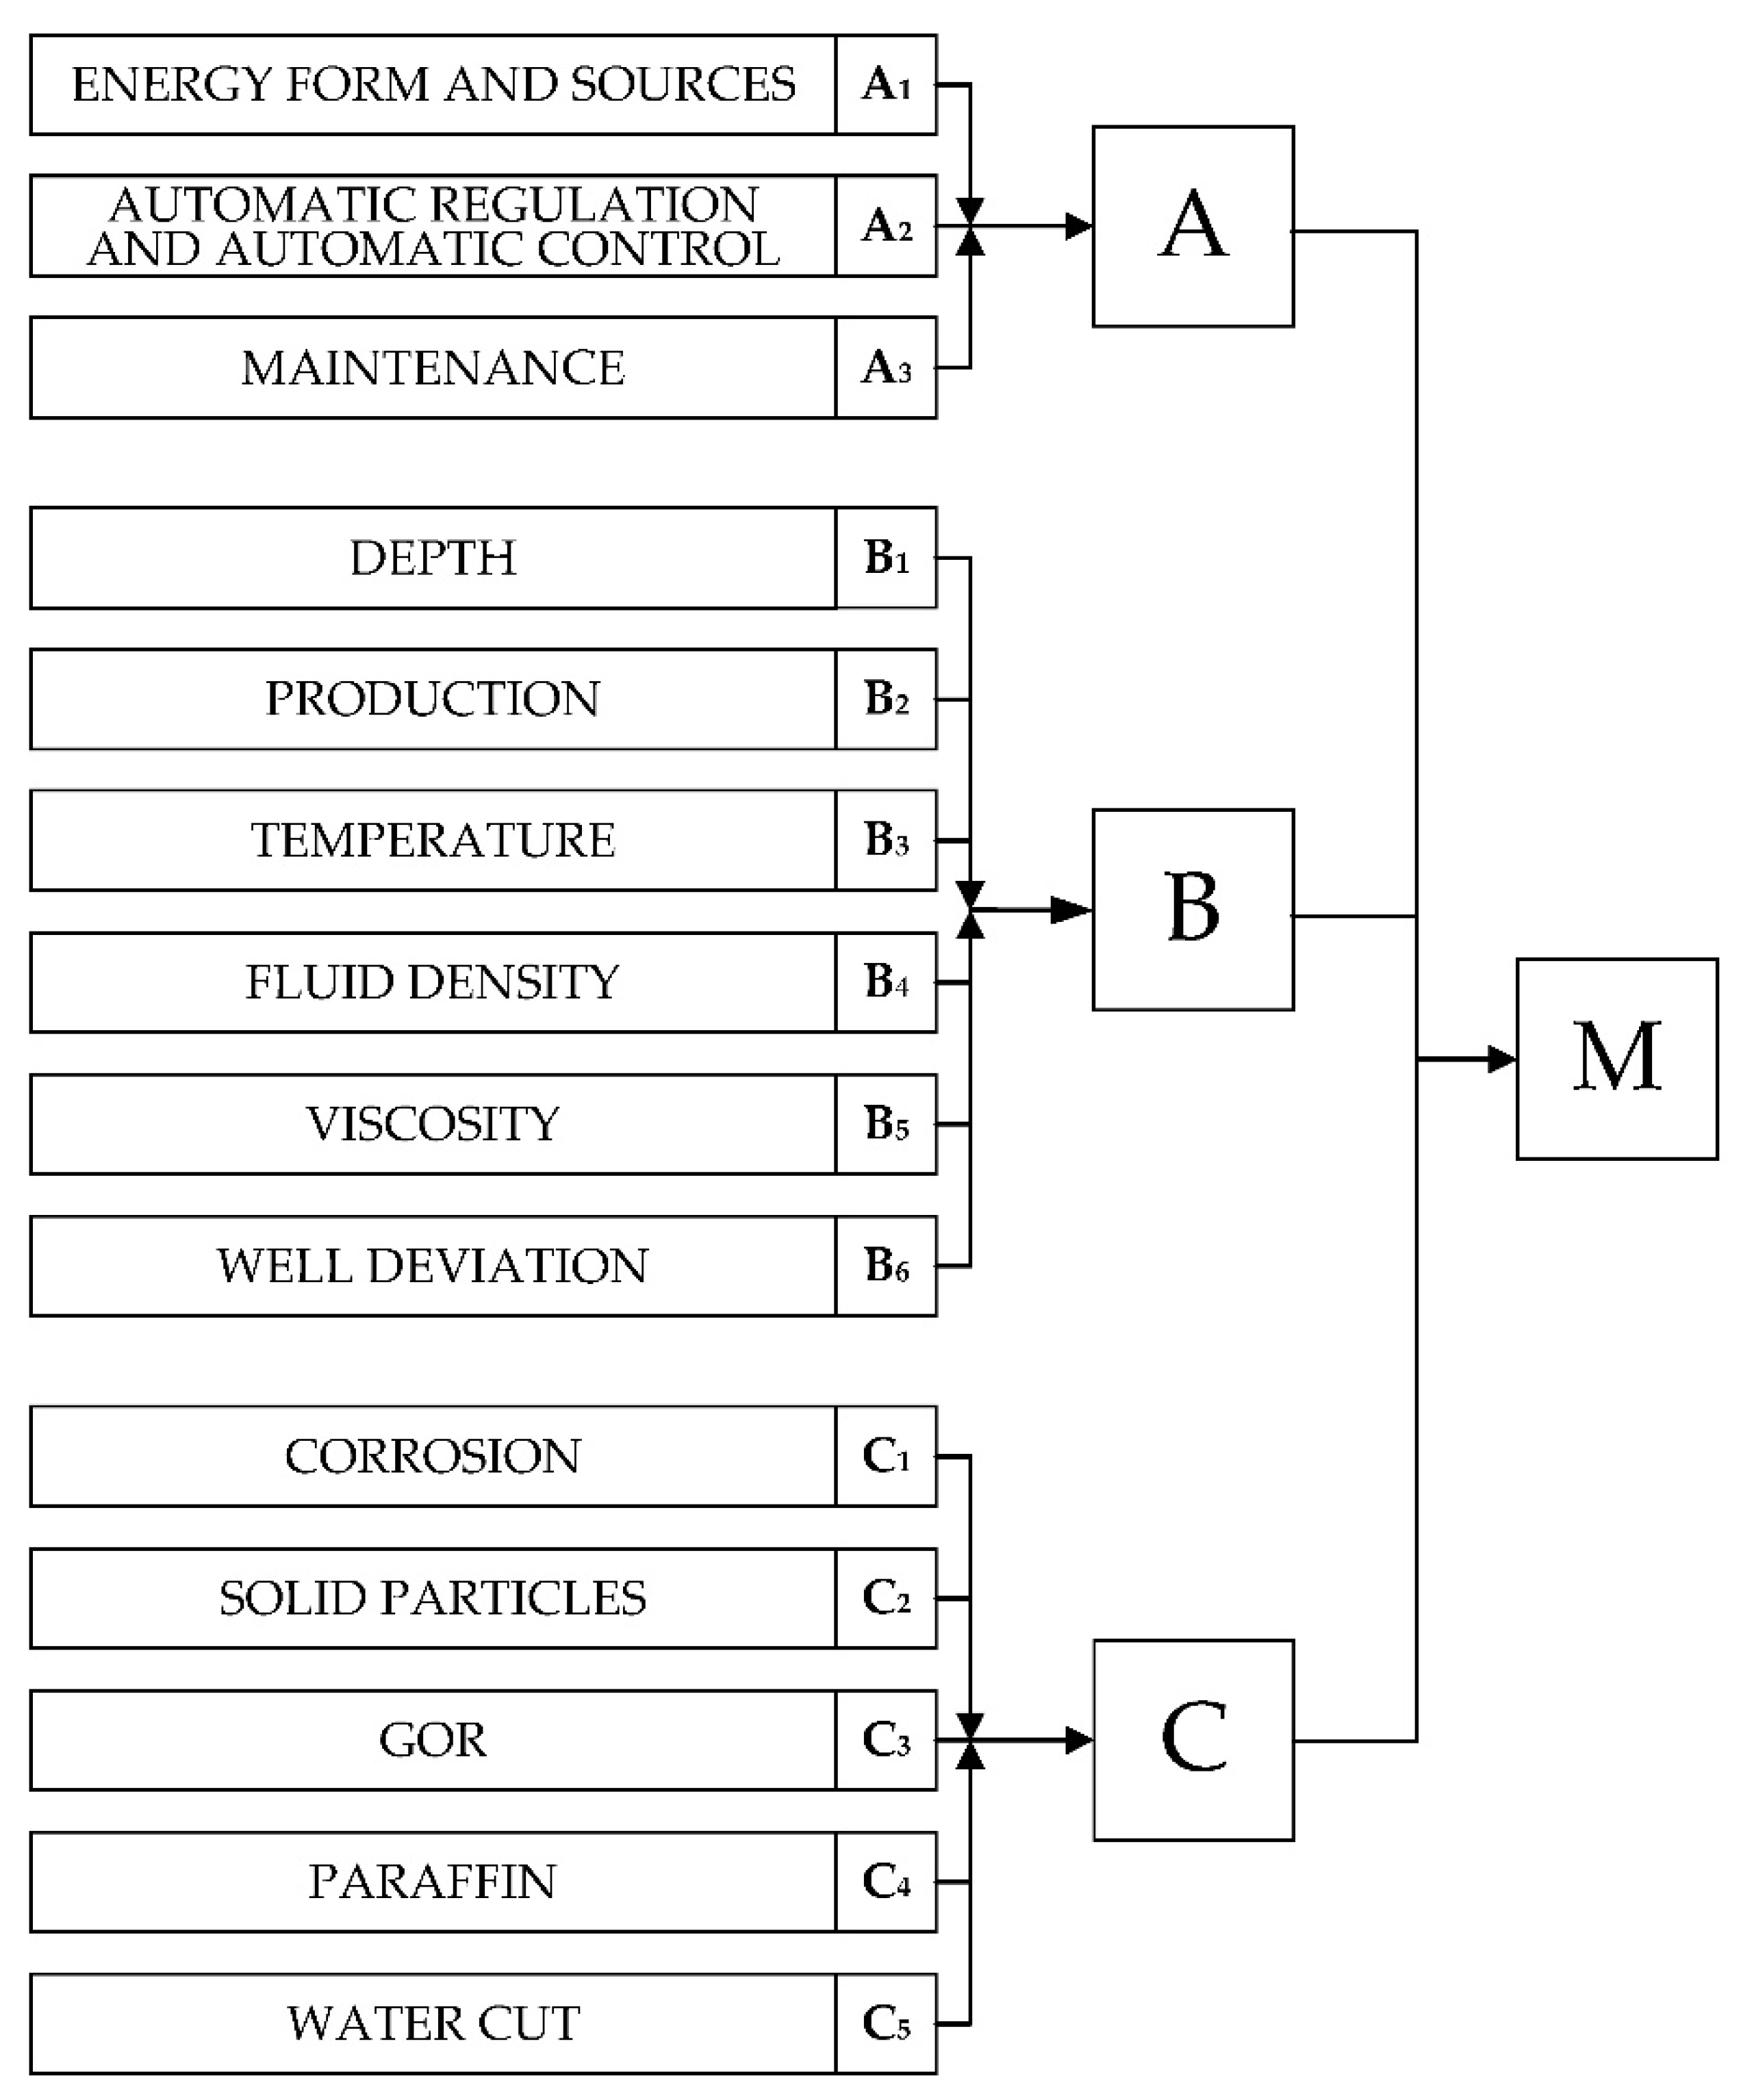
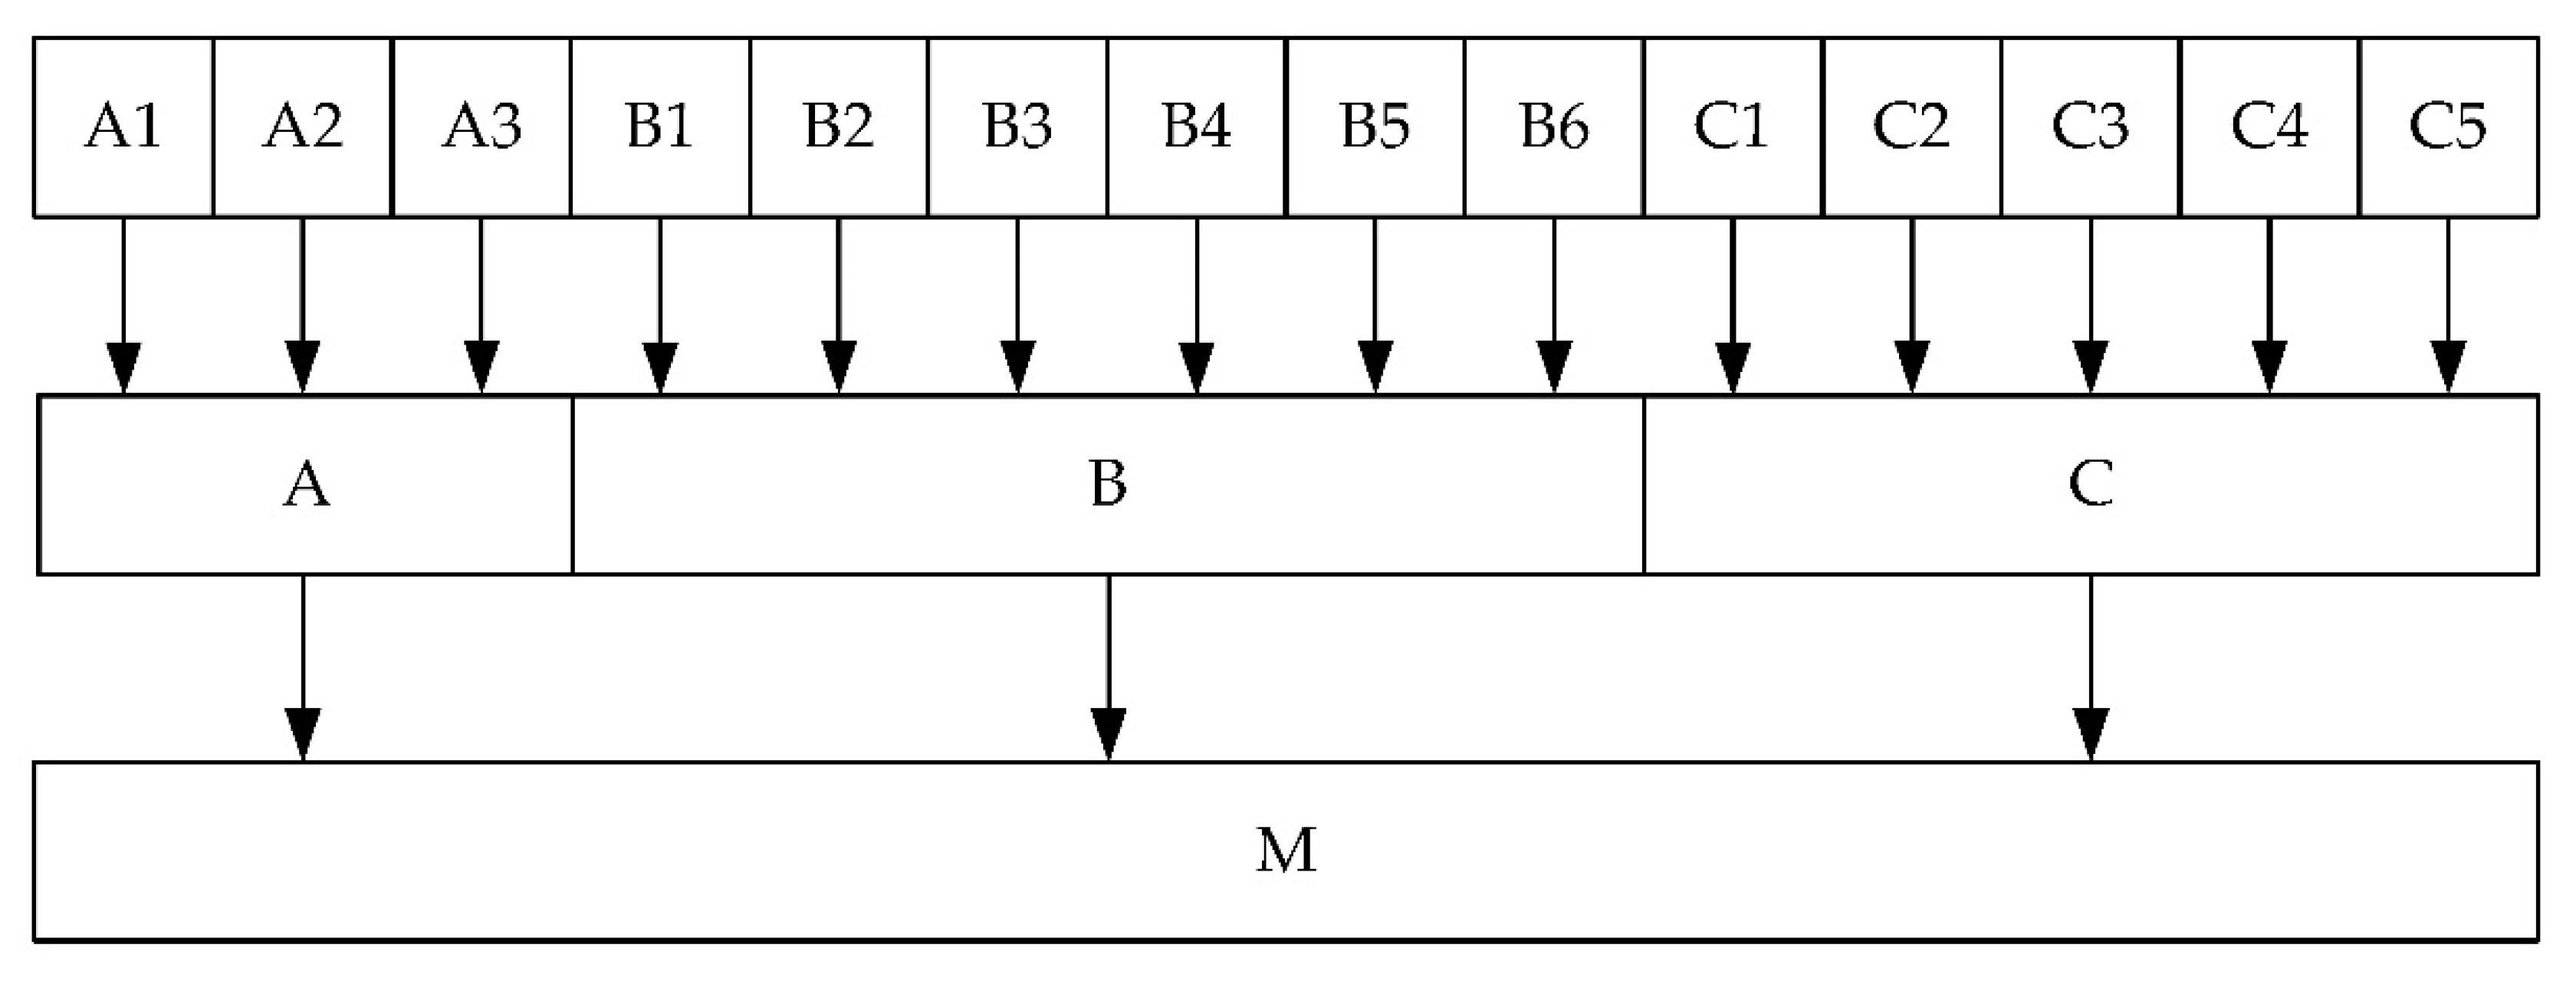
3. Development of a Conceptual Model for the Selection of an Artificial Lift
- Infrastructure parameters (A), which relate to (A1) energy forms and energy sources, (A2) automatic regulation and utility management, and (A3) service;
- Physical-geological parameters (B) respectively: (B1) depth, (B2) oil production, (B3) temperature, (B4) fluid density, (B5) viscosity, and (B6) well deviation;
- Production operating problem parameters (C), which are: (C1) corrosion, (C2) solid particles, (C3) gas oil ratio—GOR, (C4) paraffin, and (C5) water cut.
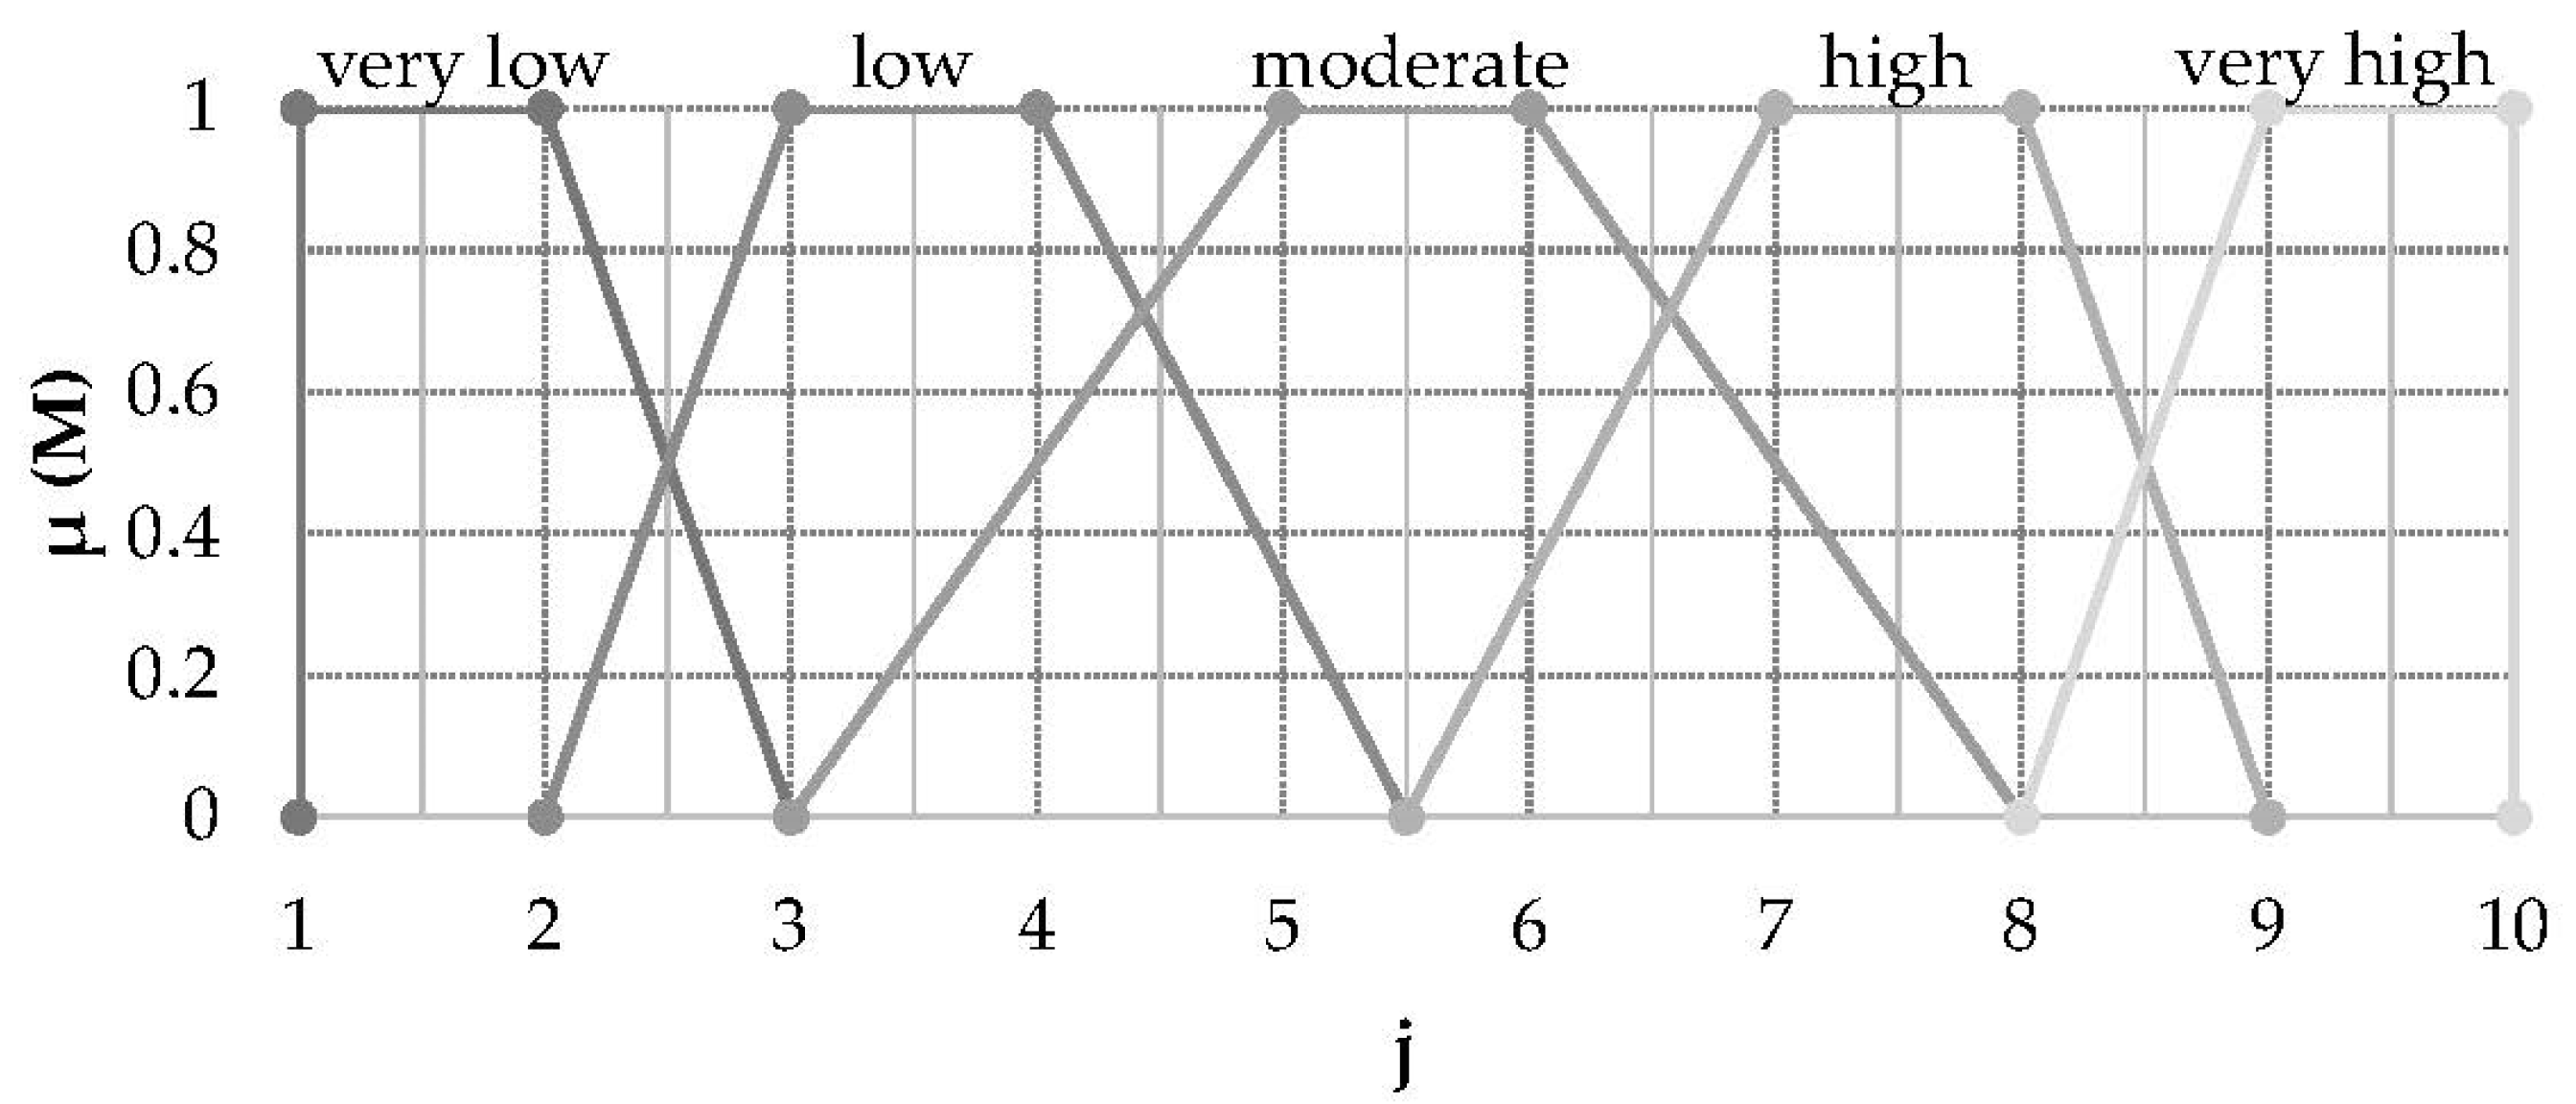
3.1. Analysis of the Input Parameters
- low = (0/1, 0/2, 1/3, 1/4, 0.33/5, 0/6, 0/7, 0/8, 0/9, 0/10)
- moderate = (0/1, 0/2, 0/3, 0.5/4, 1/5, 1/6, 0.5/7, 0/8, 0/9, 0/10)
- high = (0/1, 0/2, 0/3, 0/4, 0/5, 0.33/6, 1/7, 1/8, 0/9, 0/10)
- very high = (0/1, 0/2, 0/3, 0/4, 0/5, 0/6, 0/7, 0/8, 1/9, 1/10)
3.2. Synthesis Part of the Model
- μM = (MAXj=1, …, MAXj=10) = (μM1, …, μM10)
- MAXj = max{MINo}, for every j
- and MINo = min{μAj = 1, …, 10, μBj = 1, …, 10, μCj = 1, …, 10}, for all o = 1 to O.
4. Application of Conceptual Model for the Selection of an Artificial Lift Method at the Test Well
- xi—the support value at which its membership function reaches a maximum value (for trapezoidal membership functions this is taken as the center of the maximal range); μi—the degree of truth of its membership function
- N—number of experiments
- xi—observed values
- xsr—mean value of all observations based on Equations (3) and (4)
5. Conclusions
Author Contributions
Funding
Acknowledgments
Conflicts of Interest
References
- Naderi, A.; Ghayyem, M.A.; Ashrafi, M. Artificial Lift Selection in the Khesht Field. Pet. Sci. Technol. 2014, 32, 1791–1799. [Google Scholar] [CrossRef]
- Ghiasi-Freez, J.; Ziaii, M.; Kadkhodaie-Ilkhchi, A.; Honarmand, J. A Reservoir Rock Porosity Estimation through Image Analysis and Fuzzy Logic Techniques. Energy Sources Part A Recovery Util. Environ. Eff. 2014, 36, 1276–1284. [Google Scholar] [CrossRef]
- Jafarinezhad, S.; Shahbazian, M. Modeling the Porosity of the Carbonate Reservoir Using a Genetic Type-2 Fuzzy Logic System. Energy Sources Part A Recovery Util. Environ. Eff. 2015, 37, 1354–1362. [Google Scholar] [CrossRef]
- Liao, R.F.; Chan, C.W.; Hromek, J.; Huang, G.H.; He, L. Fuzzy logic control for a petroleum separation process. Eng. Appl. Artif. Intell. 2008, 21, 835–845. [Google Scholar] [CrossRef]
- Zoveidavianpoor, M.; Samsuri, A.; Shadizadeh, S.R. Fuzzy Logic in Candidate-well Selection for Hydraulic Fracturing in Oil and Gas Wells: A Critical Review. Int. J. Phys. Sci. 2012, 7, 4049–4060. [Google Scholar] [CrossRef]
- Neely, B.; Gipson, F.; Clegg, J.; Capps, B.; Wilson, P. Selection of Artificial Lift Method. In SPE Annual Technical Conference and Exhibition; Society of Petroleum Engineers: San Antonio, TX, USA, 1981; p. 11. [Google Scholar]
- Valentin, E.P.; Hoffmann, F.C. OPUS: An Expert Advisor for Artificial Lift. In SPE Annual Technical Conference and Exhibition; Society of Petroleum Engineers: Houston, TX, USA, 1988; p. 8. [Google Scholar]
- Clegg, J.D. High-rate artificial lift. J. Pet. Technol. 1988, 40, 277–282. [Google Scholar] [CrossRef]
- Espin, D.A.; Gasbarri, S.; Chacin, J.E. Expert System for Selection of Optimum Artificial Lift Method. In SPE Latin America/Caribbean Petroleum Engineering Conference; Society of Petroleum Engineers: Buenos Aires, Argentina, 1994; p. 9. [Google Scholar]
- Heinze, L.R.; Winkler, H.W.; Lea, J.F. Decision Tree for Selection of Artificial Lift Method. In SPE Production Operations Symposium; Society of Petroleum Engineers: Oklahoma City, OK, USA, 1995; p. 8. [Google Scholar]
- Alemi, M.; Jalalifar, H.; Kamali, G.; Kalbasi, M. A prediction to the best artificial lift method selection on the basis of TOPSIS model. J. Pet. Gas Eng. 2010, 1, 009–015. [Google Scholar]
- Alemi, M.; Jalalifar, H.; Kamali, G.R.; Kalbasi, M.; Dev, P.R. A mathematical estimation for artificial lift systems selection based on ELECTRE model. J. Pet. Sci. Eng. 2011, 78, 193–200. [Google Scholar] [CrossRef]
- Alemi, M.; Kalbasi, M.; Rashidi, F. A mathematical prediction based on SAW model. Middle East J. Sci. Res. 2013, 18, 1077–1082. [Google Scholar]
- Alemi, M.; Kalbasi, M.; Rashidi, F. A mathematical prediction based on VIKOR model. Middle East J. Sci. Res. 2013, 18, 1035–1041. [Google Scholar]
- Clegg, J.D.; Bucaram, S.M.; Hein, N.W. Recommendations and Comparisons for Selecting Artificial-Lift Methods (includes associated papers 28645 and 29092). J. Pet. Technol. 1993, 45, 1128–1167. [Google Scholar] [CrossRef]
- Halliburton-Artificial Lift Systems and The 5 P’s. Available online: https://halliburtonblog.com/artificial-lift-and-the-5-ps/ (accessed on 26 March 2020).
- Klir, G.J.; Yuan, B. Fuzzy Sets and Fuzzy Logic: Theory and Applications. J. Chem. Inf. Comput. Sci. 1996, 36, 619. [Google Scholar]
- Wang, J.; Yang, J.B.; Sen, P. Safety analysis and synthesis using fuzzy sets and evidential reasoning. Reliab. Eng. Syst. Saf. 1995, 47, 103–118. [Google Scholar] [CrossRef]
- Kostić, A. Ležišta i istraživanje nafte i gasa [Deposits and exploration of oil and gas]. Univerzitet u Beogradu, Rudarsko-Geološki Fakultet: Beograd, Serbia, 2015; p. 260. [Google Scholar]
- Teodorovic, D.; Vukadinovic, K. Traffic Control and Transport Planning: A Fuzzy Sets and Neural Networks Approach. Int. Ser. Intell. Technol. 1998. [Google Scholar] [CrossRef]
- Miodragovic, R.; Tanasijevic, M.; Mileusnic, Z.; Jovancic, P. Effectiveness assessment of agricultural machinery based on fuzzy sets theory. Expert Syst. Appl. 2012, 39, 8940–8946. [Google Scholar] [CrossRef]
- Tanasijević, M.; Ivezić, D.; Jovančić, P.; Ćatić, D.; Zlatanovic, D. Study of Dependability Evaluation for Multi-Hierarchical Systems Based on Max–Min Composition. Qual. Reliab. Eng. Int. 2013, 29, 317–326. [Google Scholar] [CrossRef]
- Tanasijević, M.; Ivezić, D.; Jovančić, P.; Ignjatović, D.; Bugaric, U. Dependability assesment of open-pit mines equpment - Study on the bases of fuzzy algebra rules. Eksploat. Niezawodn-Maint. Reliab. 2013, 15, 66–74. [Google Scholar]
- Wang, J. A subjective modeling tool applied to formal ship safety assessment. Ocean Eng. 2000, 27, 1019–1035. [Google Scholar] [CrossRef]
- Gluščević, A. Optimizacija rada bušotina u dubinskom pumpanju primenom sistem analize. MsC. Thesis, University of Belgrade, Beograd, Serbia, 2008. [Google Scholar]
- Elhaddad, E.E. New Model for Achieving Optimum Production at Amal Oilfield. Ph.D. Thesis, University of Belgrade, Beograd, Serbia, 16 April 2015. [Google Scholar]
- Aliyev, E. Development of Expert System for Artificial Lift Selection. Master’s Thesis, Middle East Technical University, Ankara, Turkey, February 2013. [Google Scholar]
- Bowles, J.B.; Peláez, C.E. Fuzzy logic prioritization of failures in a system failure mode, effects and criticality analysis. Reliab. Eng. Syst. Saf. 1995, 50, 203–213. [Google Scholar] [CrossRef]
- Petrović, D.V.; Tanasijević, M.; Milić, V.; Lilić, N.; Stojadinović, S.; Svrkota, I. Risk assessment model of mining equipment failure based on fuzzy logic. Expert Syst. Appl. 2014, 41, 8157–8164. [Google Scholar] [CrossRef]


| Selection Method | First Group | Second Group | Third Group |
|---|---|---|---|
| Neely [6] | x | x | |
| Valentin [7] | x | x | x |
| Clegg [8] | x | x | x 1 |
| Espin [9] | x 1 | x 1 | x |
| Heinze [10] | x | x | x |
| Alemi [11,12,13,14] | x | x |
| Operating Parameters | SRP | ESP | HP | Gas Lift | PCP |
|---|---|---|---|---|---|
| Typical operating depth (m) | 35–3828 | 348–3480 | 1740–3480 | 1740–3480 | 696–1566 |
| Maximum operating depth (m) | 5568 | 5220 | 5220 | 5220 | 2088 |
| Typical operating volume (m3/d) | 0.8–267 | 18–5343 | 53–712 | 18–1781 | 0.89–392 |
| Maximum operating volume (m3/d) | 1069 | 7124 | 2672 | 5343 | 801 |
| Typical operating temperature (°C) | 38–177 | 38–135 | 38–121 | 38–121 | 24–66 |
| Maximum operating temperature (°C) | 288 | 204 | 260 | 204 | 121 |
| Corrosion handling | Good to Excellent | Good | Excellent | Good to excellent | Fair |
| Gas handling | Fair to good | Fair | Good | Excellent | Good |
| Solids handling | Fair to good | Fair | Good | Good | Excellent |
| Fluid gravity (kg/m3) | >1014.34 | >1000 | >1014.34 | >965.85 | <849.85 |
| Maximum wellbore Deviation | 0–90 deg landed pump | 0–90 deg | 0–90 deg <79 deg/100 m | 70 deg, short to medium radius | 0–90 deg <49 deg/100 m |
| Servicing | Workover or pulling rig | Workover or pulling rig | Hydraulic or wireline | Wireline or workover rig | Workover or pulling rig |
| Prime mover | Gas or electric | Electric motor | Multi-cylinder or electric | Compressor | Gas or electric |
| Parameters | Value | Unit |
|---|---|---|
| depth | 506–3500 | m |
| oil production | 1.5–2340 | m3/day |
| temperature | 50–180 | °C |
| oil density | 810.89–1014.34 | kg/m3 |
| oil viscosity | 2–681 | mPas |
| well deviation | 0–35 | ° |
| share of corrosive substances | 0–5 | % |
| solid particle content | 0–16 | % |
| GOR | 10–458 | m3/m3 |
| paraffin share | 0–20 | % |
| water content | 0–93 | % |
| forms of energy and source | 8–9 | grade |
| possibility of service | 5–7 | grade |
| possibility of automatic regulation and remote control | 4–9 | grade |
| Parameters | Value | Unit |
|---|---|---|
| Production, Reservoir and Well constraints | ||
| production rate | 178 | m3 |
| well depth | 2438.4–3352.8 | m |
| casing size | 0.36576 | m |
| dogleg severity | 0–10/0.3048 | m |
| temperature | 82.22–98.89 | °C |
| flowing pressure | >68.95 | bar |
| completion | simple | |
| recovery method | secondary waterflood | |
| Produced Fluid Properties | ||
| water cut | 70 | % |
| fluid viscosity | <0.1 | Pas |
| corrosive fluid | no | |
| sand and abrasives | <10 | ppm |
| GOR | 650 | m3/m3 |
| VLR | <0.1 | |
| Surface Infrastructure | ||
| location | offshore | |
| electrical power | utility | |
| well service | pulling unit | |
| Method | Overlapping of Each Method with New Well (%) |
|---|---|
| GL | 80.35 |
| SRP | 54.28 |
| ESP | 43.91 |
| HP | 49.03 |
| PCP | 40.70 |
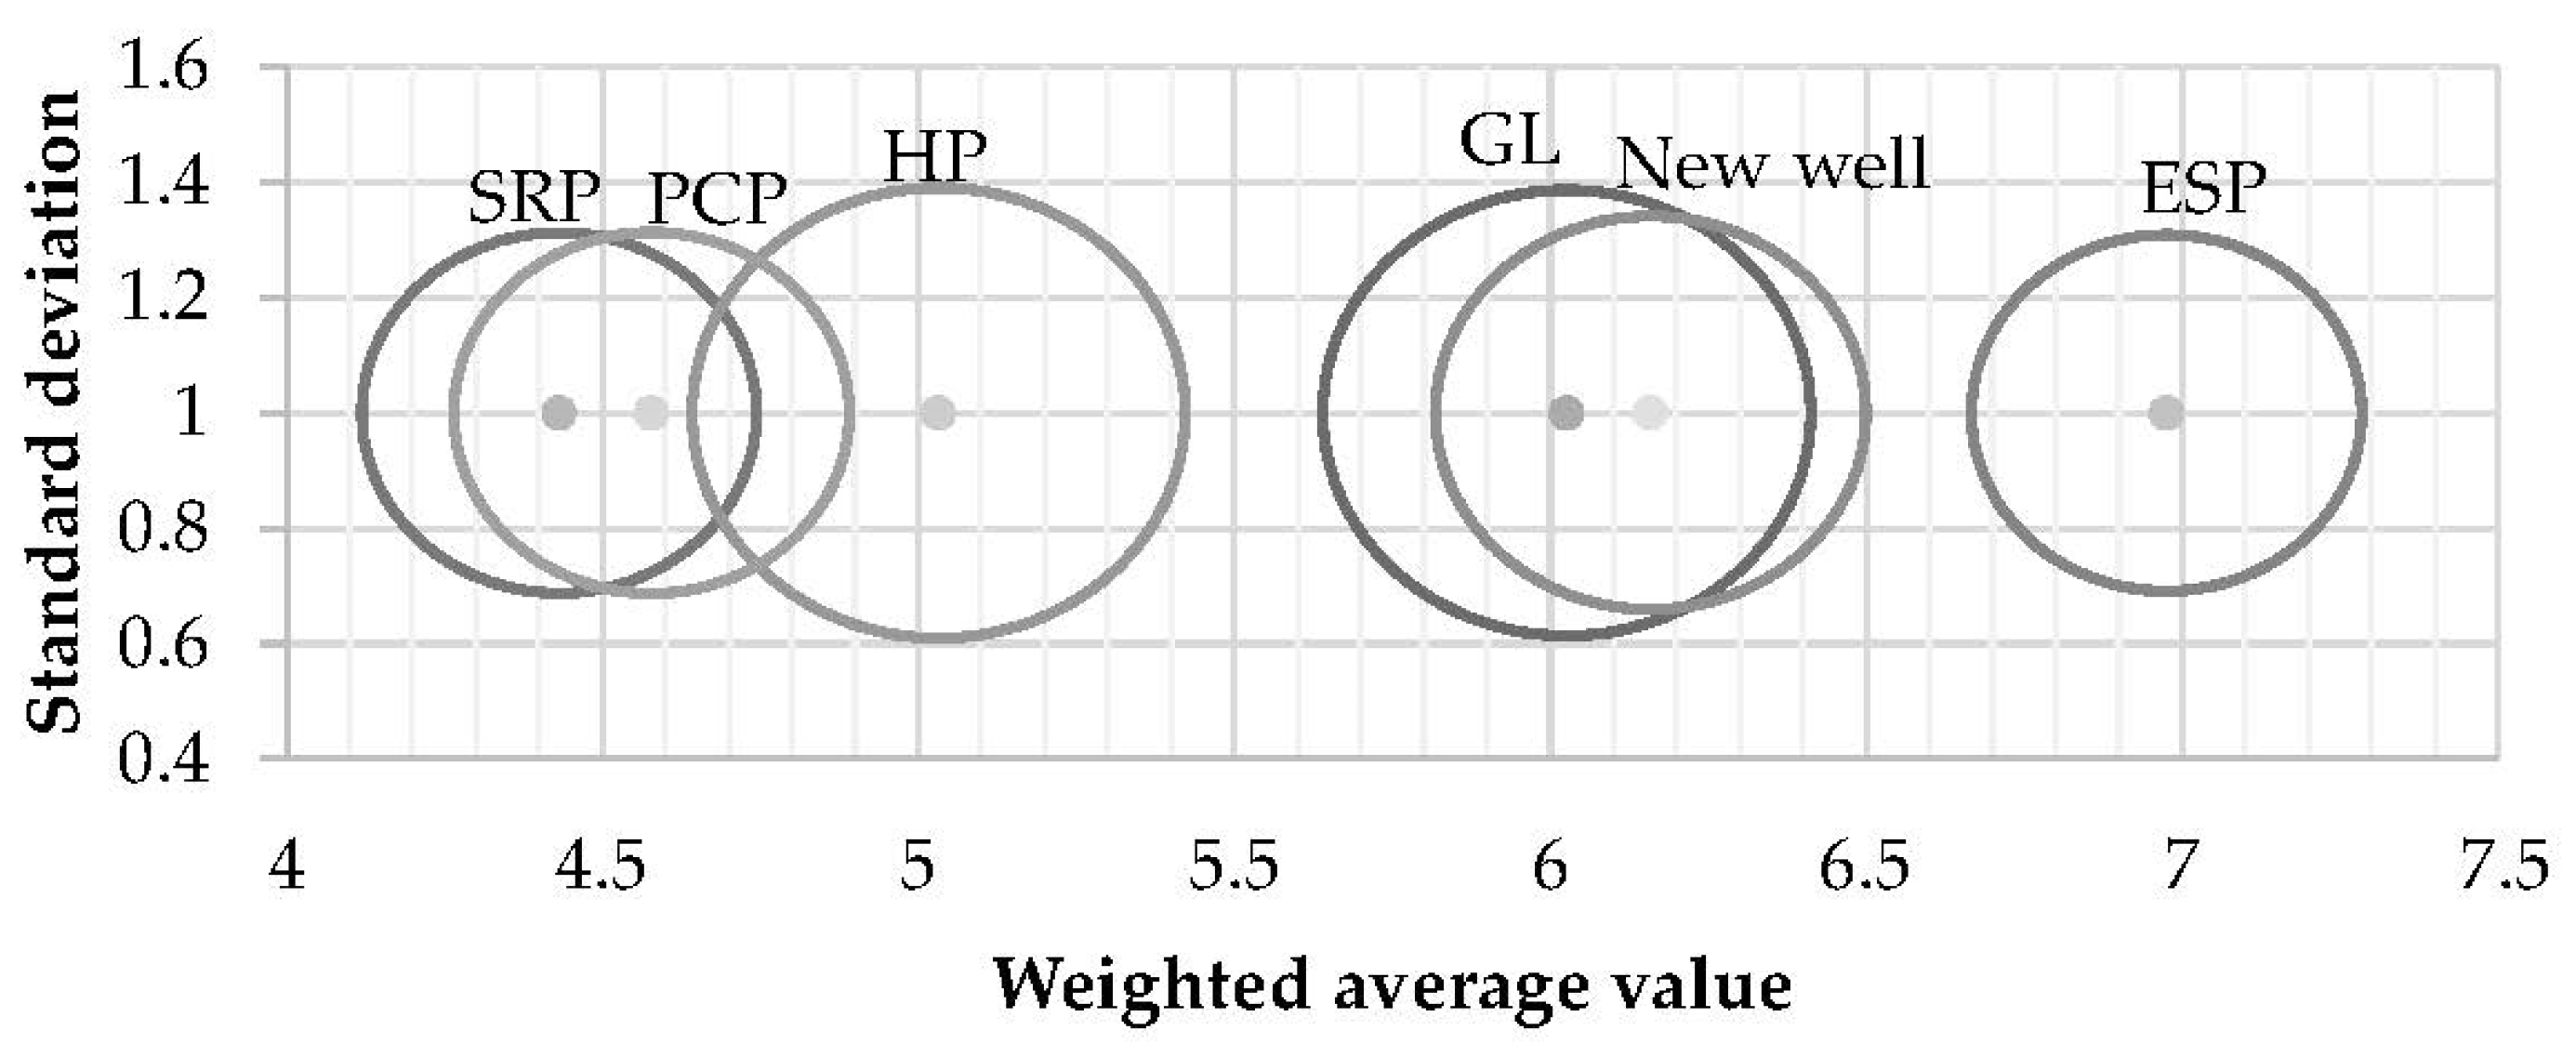
| Artificial Lift Method | Center of Mass | Standard Deviation |
|---|---|---|
| GL | 6.0258 | 0.3861 |
| SRP | 4.4314 | 0.3122 |
| ESP | 6.9750 | 0.3086 |
| HP | 5.0320 | 0.3901 |
| PCP | 4.5774 | 0.3128 |
| New well | 6.1590 | 0.3410 |
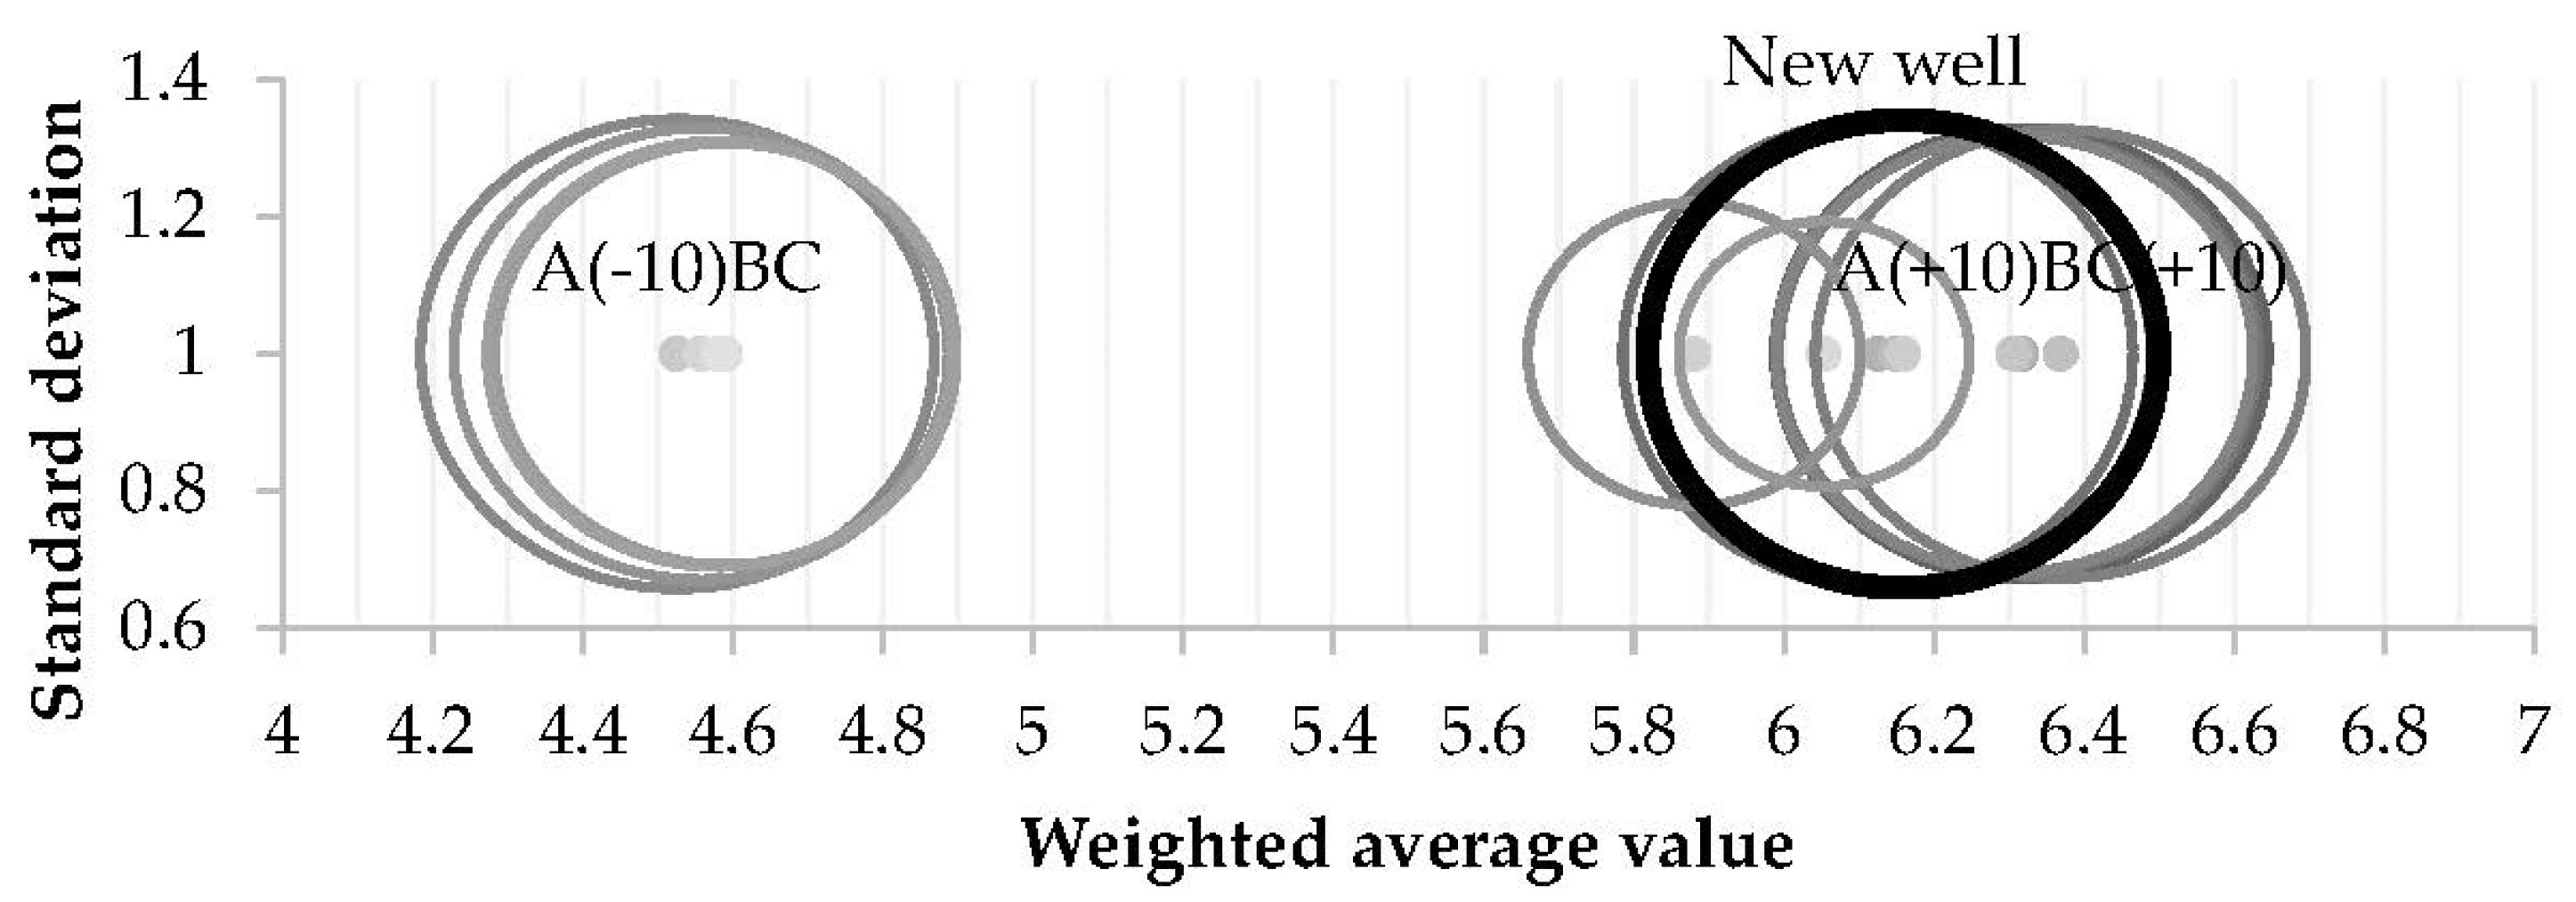
| A | B | C | Methods |
|---|---|---|---|
| 30 | 20 | 10 | GL |
| 0 | −20 | 0 | SRP |
| −10 | 25 | −10 | ESP |
| −10 | −20 | −20 | HP |
| −15 | 0 | 0 | PCP |
© 2020 by the authors. Licensee MDPI, Basel, Switzerland. This article is an open access article distributed under the terms and conditions of the Creative Commons Attribution (CC BY) license (http://creativecommons.org/licenses/by/4.0/).
Share and Cite
Crnogorac, M.; Tanasijević, M.; Danilović, D.; Karović Maričić, V.; Leković, B. Selection of Artificial Lift Methods: A Brief Review and New Model Based on Fuzzy Logic. Energies 2020, 13, 1758. https://doi.org/10.3390/en13071758
Crnogorac M, Tanasijević M, Danilović D, Karović Maričić V, Leković B. Selection of Artificial Lift Methods: A Brief Review and New Model Based on Fuzzy Logic. Energies. 2020; 13(7):1758. https://doi.org/10.3390/en13071758
Chicago/Turabian StyleCrnogorac, Miroslav, Miloš Tanasijević, Dušan Danilović, Vesna Karović Maričić, and Branko Leković. 2020. "Selection of Artificial Lift Methods: A Brief Review and New Model Based on Fuzzy Logic" Energies 13, no. 7: 1758. https://doi.org/10.3390/en13071758
APA StyleCrnogorac, M., Tanasijević, M., Danilović, D., Karović Maričić, V., & Leković, B. (2020). Selection of Artificial Lift Methods: A Brief Review and New Model Based on Fuzzy Logic. Energies, 13(7), 1758. https://doi.org/10.3390/en13071758