Article

AC Volume Breakdown and Surface Flashover of a 4% NovecTM 4710/96% CO2 Gas Mixture Compared to CO2 in Highly Nonhomogeneous Fields

by
Houssem Eddine Nechmi
1,*,
Mohammed El Amine Slama
1,
Abderrahmane (Manu) Haddad
2 and
Gordon Wilson
3
1
Advanced High Voltage Engineering Centre, School of Engineering, Cardiff University, Queen’s Buildings, The Parade, Cardiff CF24 3AA, UK
2
Advanced High Voltage Engineering Research Centre, Cardiff University, The Parade, Cardiff CF24 3AA, UK
3
National Grid House, Warwick Technology Park, Gallows Hill, Warwick CV34 6DA, UK
*
Author to whom correspondence should be addressed.
Energies 2020, 13(7), 1710; https://doi.org/10.3390/en13071710
Submission received: 24 February 2020 / Revised: 25 March 2020 / Accepted: 31 March 2020 / Published: 3 April 2020
(This article belongs to the Section F: Electrical Engineering)

Abstract

:
AC pre-discharge currents, breakdown, and flashover voltage measurements are reported in a 10 mm needle-plane arrangement in a 4% NovecTM 4710/96% CO2 gas mixture and compared with CO2 for pressures up to 8.8 bar abs. Flashover measurements were performed on different solid dielectrics (Al2O3_filled epoxy resins, PTFE (Polytetrafluoroethylene) and PE (polyethylene)) for different roughness surface finishes. The effect of fixed conducting needles at various positions on electrical strength is reported. A strong nonlinear behaviour as function of gas pressure was observed for all the studied parameters (gas, needle position, solid insulator, insulator roughness). The non-linear behaviour is attributed to the inception and quenching of glow corona, in the interval between inception and breakdown or flashover voltages. It is found that a 4% concentration of NovecTM 4710 in CO2 has a breakdown/flashover voltage ≈ 1.14 higher than CO2. The glow corona-induced stabilization effect is seen for pressures between 2 and 5 bar abs for all the studied parameters. The peak flashover voltage and its associated pressure of the different insulators are strongly dependent on surface roughness. At 8.8 bar abs, the flashover voltage level obtained with various materials was ordered as follows: PTFE > PE-UHMW > Epoxy > HDPE(High-density polyethylene).

Graphical Abstract

1. Introduction

NovecTM 4710/CO2 mixtures appear as those with a good compromise between equivalent insulation properties and the minimum operating temperature of apparatus while providing a significant reduction of the environmental impact. For a 4% NovecTM 4710/96% CO2, the equivalence with SF6 at 5.5, 6.5, 7.5 bar abs are feasible for a minimum operating temperature of −30 °C, −25 °C, and −20 °C [1,2,3,4], respectively. NovecTM 4710 (C4F7N)/CO2 mixtures consist of complex molecules, formed from several basic elements (5 Carbons, 7 Fluorines, 2 Oxygens, and 1 Nitrogen), the energy absorption by the constituents of these mixtures causes their fragmentation into smaller radicals, that are more stable [5,6,7]. Once at rest, unlike SF6, the decomposition products do not recombine to the original chemical arrangement. They react with contaminants such as water [8], oxygen [9], the buffer gas, metal electrodes [10,11,12], solid dielectrics [13], and/or adsorbents [14] to form other chemically stable decomposition by-products. High water content causes an increase in dielectric loss, accelerates the decomposition of NovecTM 4710 in the presence of electrical discharge or corona, and accelerates corrosion of the materials when in contact with decomposition products. For NovecTM 4710, limit values of moisture content are not yet set by the manufacturers. Under long-term operating conditions and with the effect of different combined constraints (electrical, thermal, impurities, etc.), the content of these products and new ones will increase.
The toxicity effect of most of these produced species is not known, and some of the species are undetectable via different characterization equipment (NMR-F (19F), Gas chromatography–mass spectrometry (GC-MS) and/or FTIR). Some are very toxic such as perfluoroisobutene C4F8 (PFIB) or heptafluorobutyronitrile C4F7N (CAS number 375-00-8) and involve strict controls of their presence [15,16] (safety zone, venting, special personal protective equipment, gas detectors, and gas extraction). The respiratory system is the primary target of toxicity of inhaled pure NovecTM 4710 in humans, which was reported to cause cell mutagenicity and reprotoxic effects [17,18]. The available literature on carcinogenicity is incomplete.
In uniform electric fields, the surface electrical strength (ES) of NovecTM 4710/CO2 mixtures [19] relative to CO2 is lower than the volume electrical insulation strength [2,4] (see Figure 1). The validity of the optimal gas mixture must be extended and verified at different electric field distributions, on the surface and in the volume, particularly in highly divergent fields that appear when a metal particle is stuck at the insulator surface or very close to it [20].
In this study, the pre-discharge, volume, and surface discharge characteristics of a 4% NovecTM 4710/96% CO2 gas mixture and CO2 in a needle-plane electrode configuration are measured under different conditions of needle position, gas pressure, and insulator type (material, roughness).

2. Materials and Methods

The system consists of a high voltage AC source (50 kV rms, 3.75 kVA), a capacitive voltage divider (1:3750), an insulation defect model (protrusion), a detecting Current Transformer, a digital oscilloscope (Lecroy HDO6104), and a gas pressure chamber. The test rig is made of 316 L stainless steel with a volume of about 12 L, and Viton is used as the sealing material, with a maximum filling pressure up to 12 bar abs.
The insulation defect model consists of a needle (radius, R ~ 100 µm) -plane electrode arrangement (see Figure 2). The tungsten needle is placed between two Bruce-shaped aluminium plane electrodes of 102 mm diameter and a flat area of 60 mm to provide a homogeneous background field. For each breakdown event, measurement series of 5 (solid flashover) and 10 (gas breakdown) individual discharges were performed, this allows to obtain useful values without rapidly degrading the state of insulators and electrodes. The average of the measured values is taken as the flashover voltage VFO or the breakdown voltage VBD.
For breakdown measurements, an AC voltage ramp is increased at a rate of 2 kV/s up to 90% of the voltage level that initiates electrical discharges, and then 0.1 kV/s is used. Three minutes were kept in between the individual electrical discharges. The pressures limits for 4%NovecTM 4710 /96%CO2 mixture are restricted by the test rig bushing flashover limit (58 kV peak, AC). The current activity was measured with a 500 MHz high frequency current transformer and a 1GHz Oscilloscope. The ramp method is employed to identify the inception voltage of partial discharge. The voltage is increased with the rate of 1 kV/s until the first pulse is detected.
Four insulator blocks are made of different solid dielectric materials: Polytetrafluoroethylene (PTFE), High-density polyethylene (HDPE), Ultra-high-molecular-weight polyethylene (UHMW-PE), and Al2O3 filled epoxy resin, which are used in electrical equipment (See Figure 3). Surface roughness features are summarized in Table 1. Each insulator measured 13 mm in height and 30 mm in diameter. In order to simulate a particle at the triple junction point, a 3 mm needle with 0.1 mm in radius is fixed on the insulator surface and connected to the HV electrode with conductive aluminium tape. The effective gap between the needle tip and the ground electrode is 10 mm. A scanning electron microscopy (SEM), a Hitachi TM3030, equipped with an energy dispersive spectrometer (EDS) with a Quantax 75 EDS system is used.

3. Results

3.1. Gas Breakdown

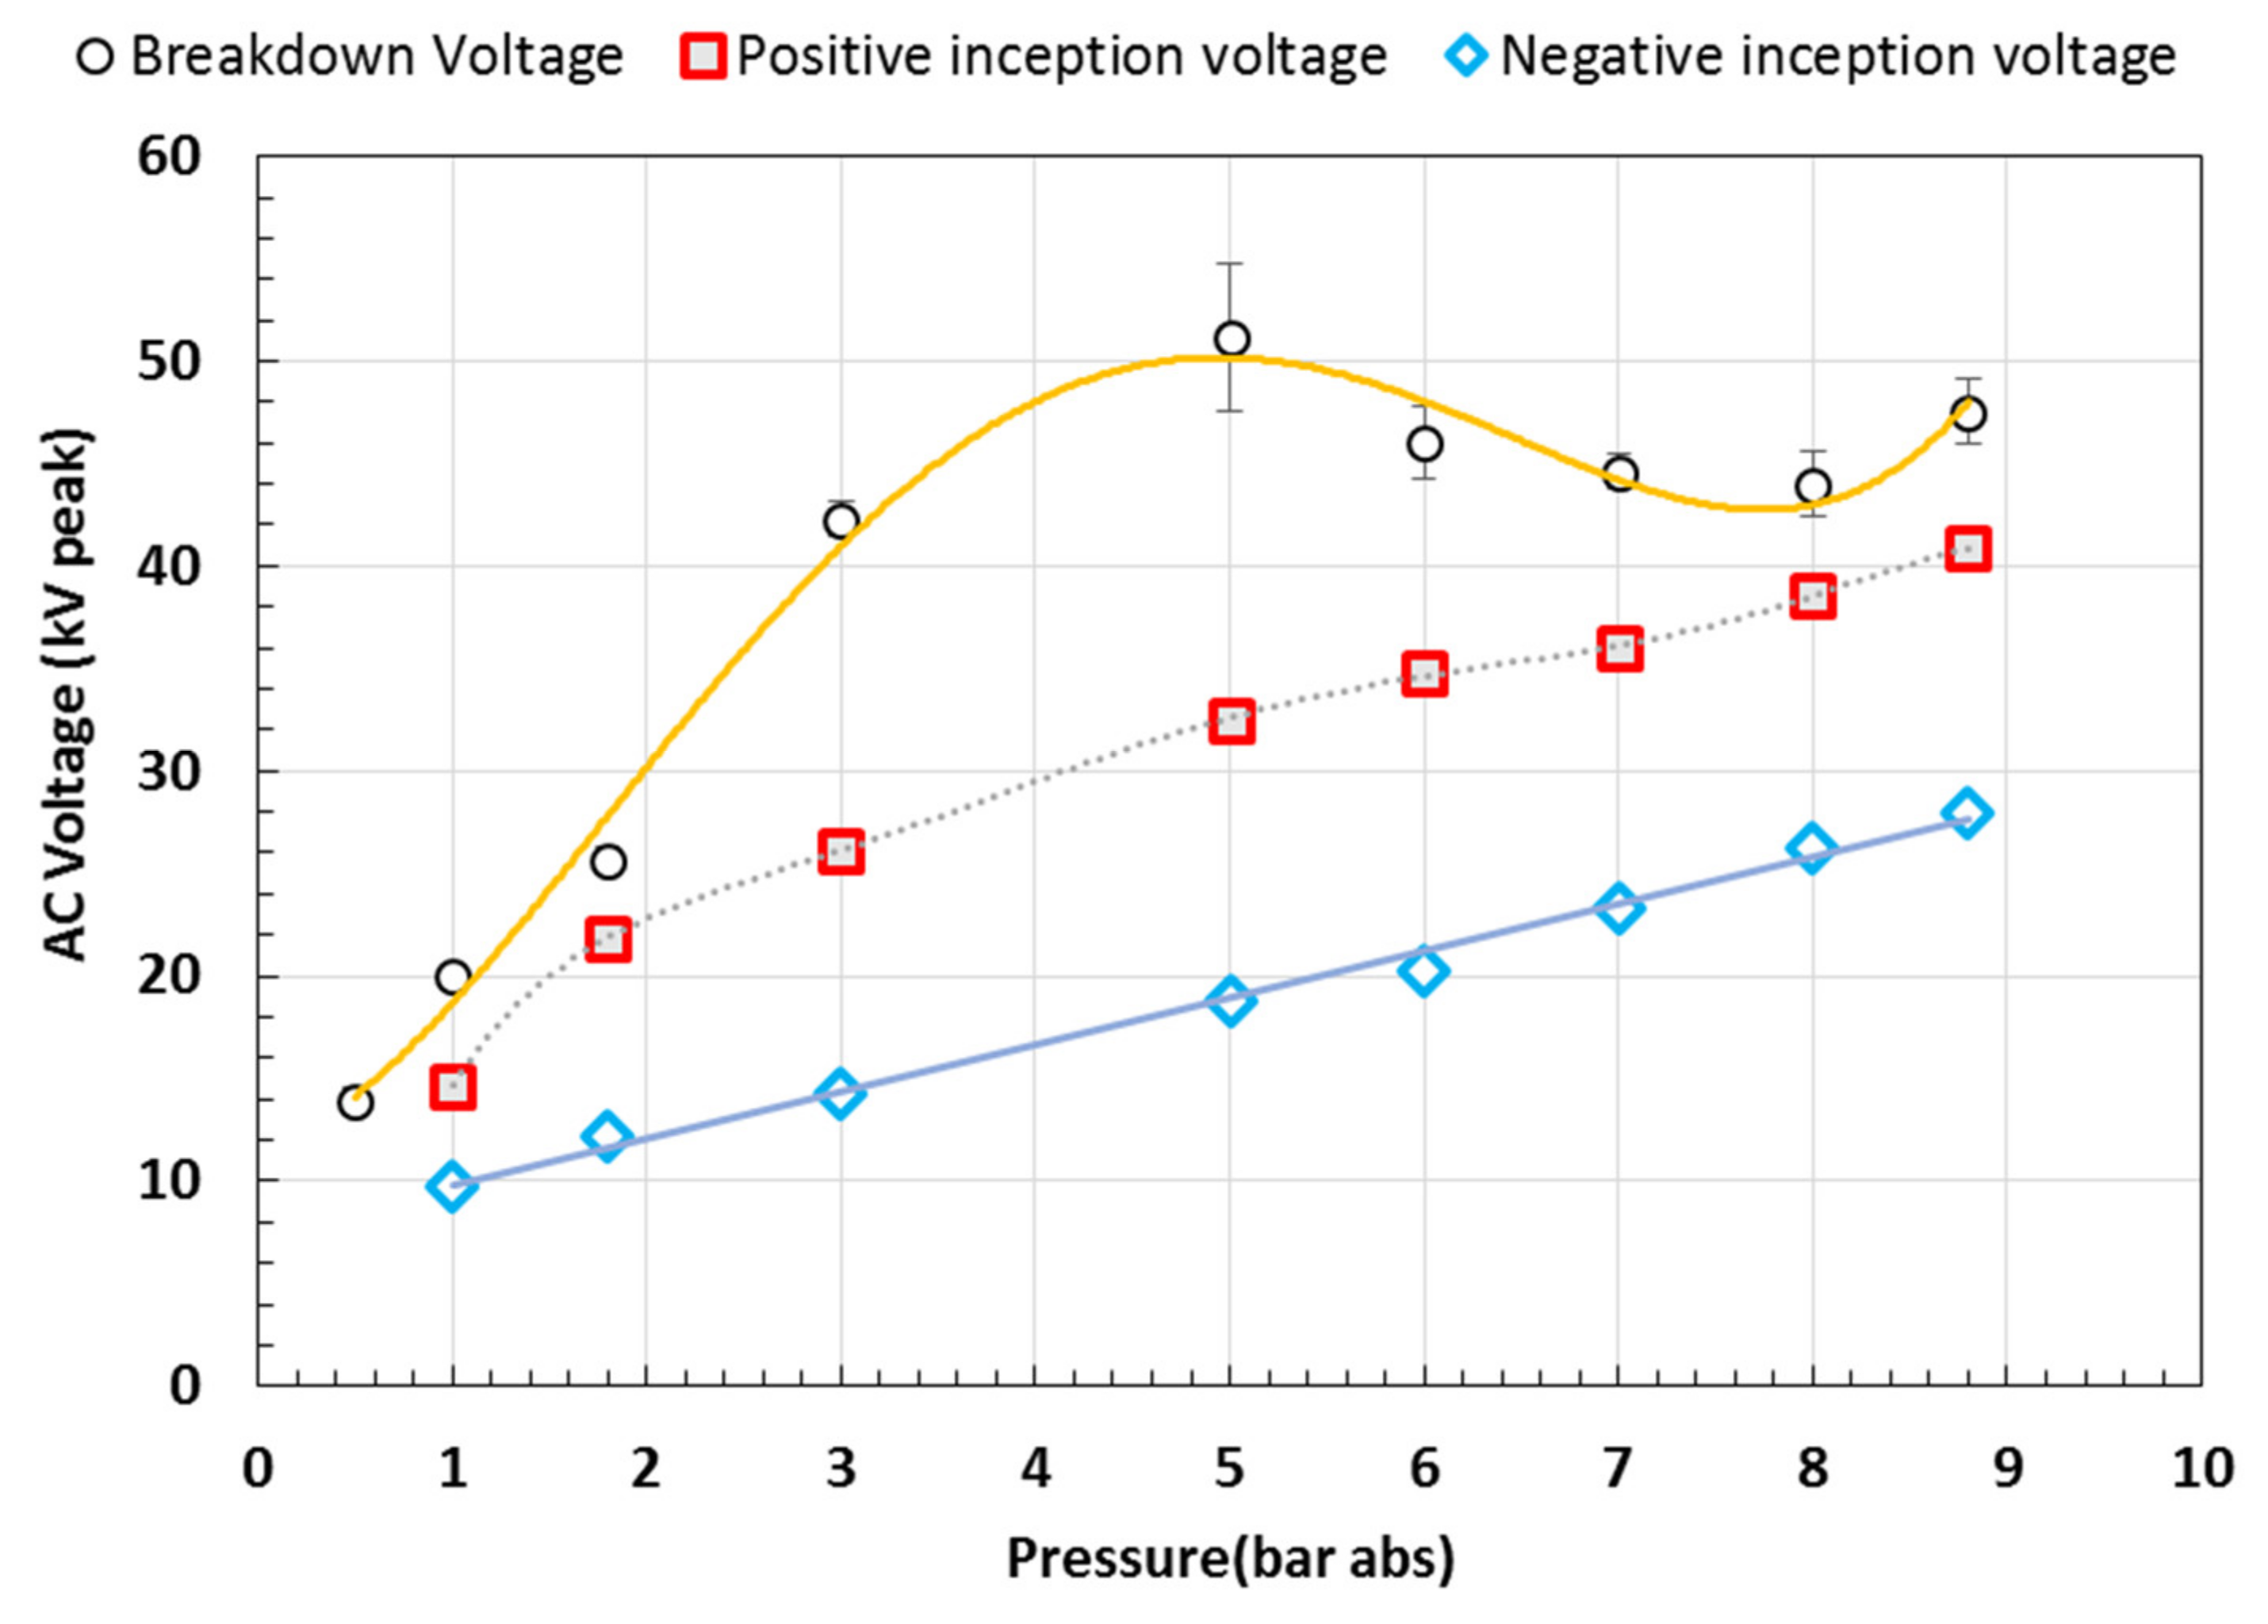
The gas breakdown characteristics in the highly divergent field are more complex in comparison with the uniform and slightly divergent electric field distributions, for CO2 and 4%NovecTM 4710/96%CO2 gas mixture. Figure 4 reports the AC Vmean breakdown measurements, the positive and the negative inception voltages were measured at various pressures in the needle-plane configuration (gas gap) for a gap distance d = 10 mm: this corresponds to a field utilization factor of η = 0.0375 calculated using equation (1). Where Emax is the maximum electric field computed using COMSOL Multiphysics® electrostatic field simulation. Eaverage stands for average electric field. The breakdown characteristic of CO2 and 4%NovecTM 4710/96%CO2 shows a strong nonlinear behaviour with the gas pressure increasing under AC voltage as opposed to the uniform field configuration that exhibits a linear trend [19]. This effect can be attributed to the space charge created in the gas volume. [21,22,23,24]. According to [21,22,23,24], the needle tip is covered with a cloud of charge carriers which will be stabilized by negative ions formed by attachment of electrons. Thus, the negative space charges generate a reduction of the electric field on the side of the tip. This causes an increase in the breakdown voltage. The experimental breakdown voltages measured for pressures up to 8.8 bar abs are strongly affected; the breakdown occurs under AC voltage on both positive and negative peaks. For a critical pressure, the positive half-cycle becomes decisive and the dielectric breakdown occurs at its peak value (see Table 2).
η = E a v e r a g e   E m a x
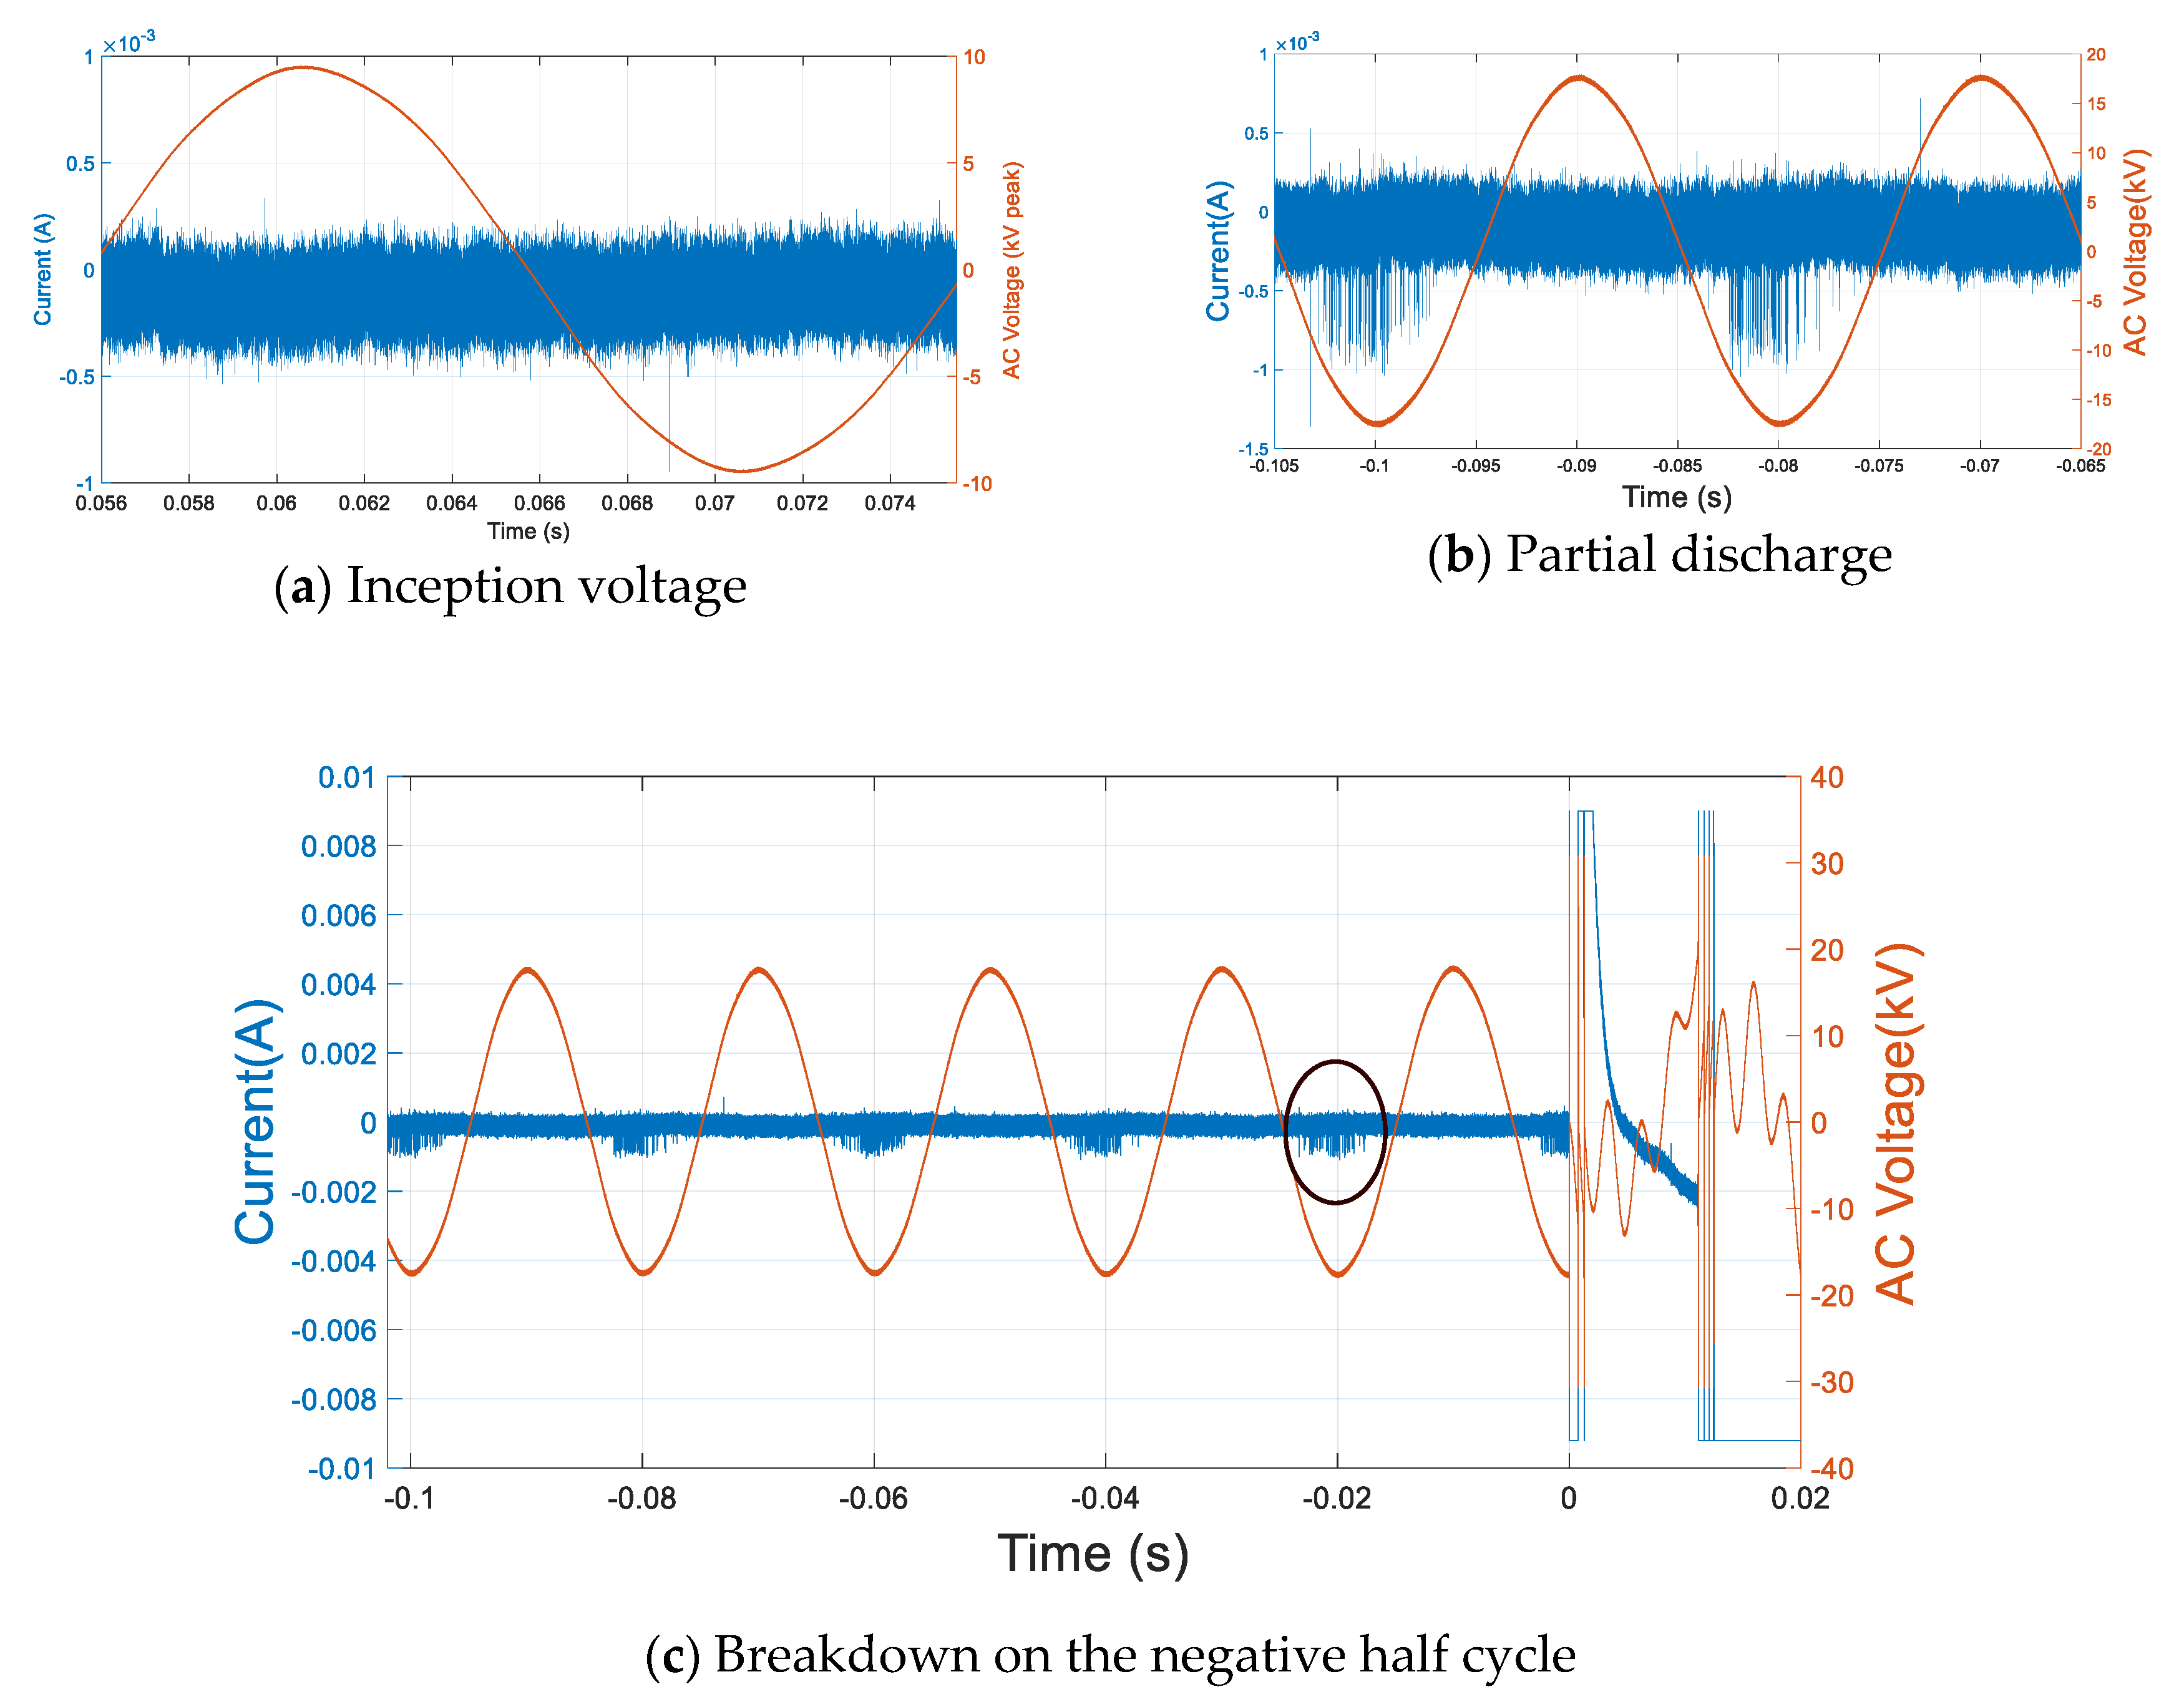
For CO2, the positive and negative inception voltages increase linearly with the gas pressure increases as shown in Figure 4. The negative inception voltage is lower than the positive inception for the applied test pressures. For this electrode arrangement, a difference is observed between the inception voltage and the breakdown voltage. By increasing the pressure, the positive inception curve and the breakdown voltage characteristics meet at a critical pressure (PC) 8bar abs. It can be seen from Table 2 that most of the breakdown happens during the AC positive half cycle. The voltage-current characteristic for different pressures is shown in Figure 5.
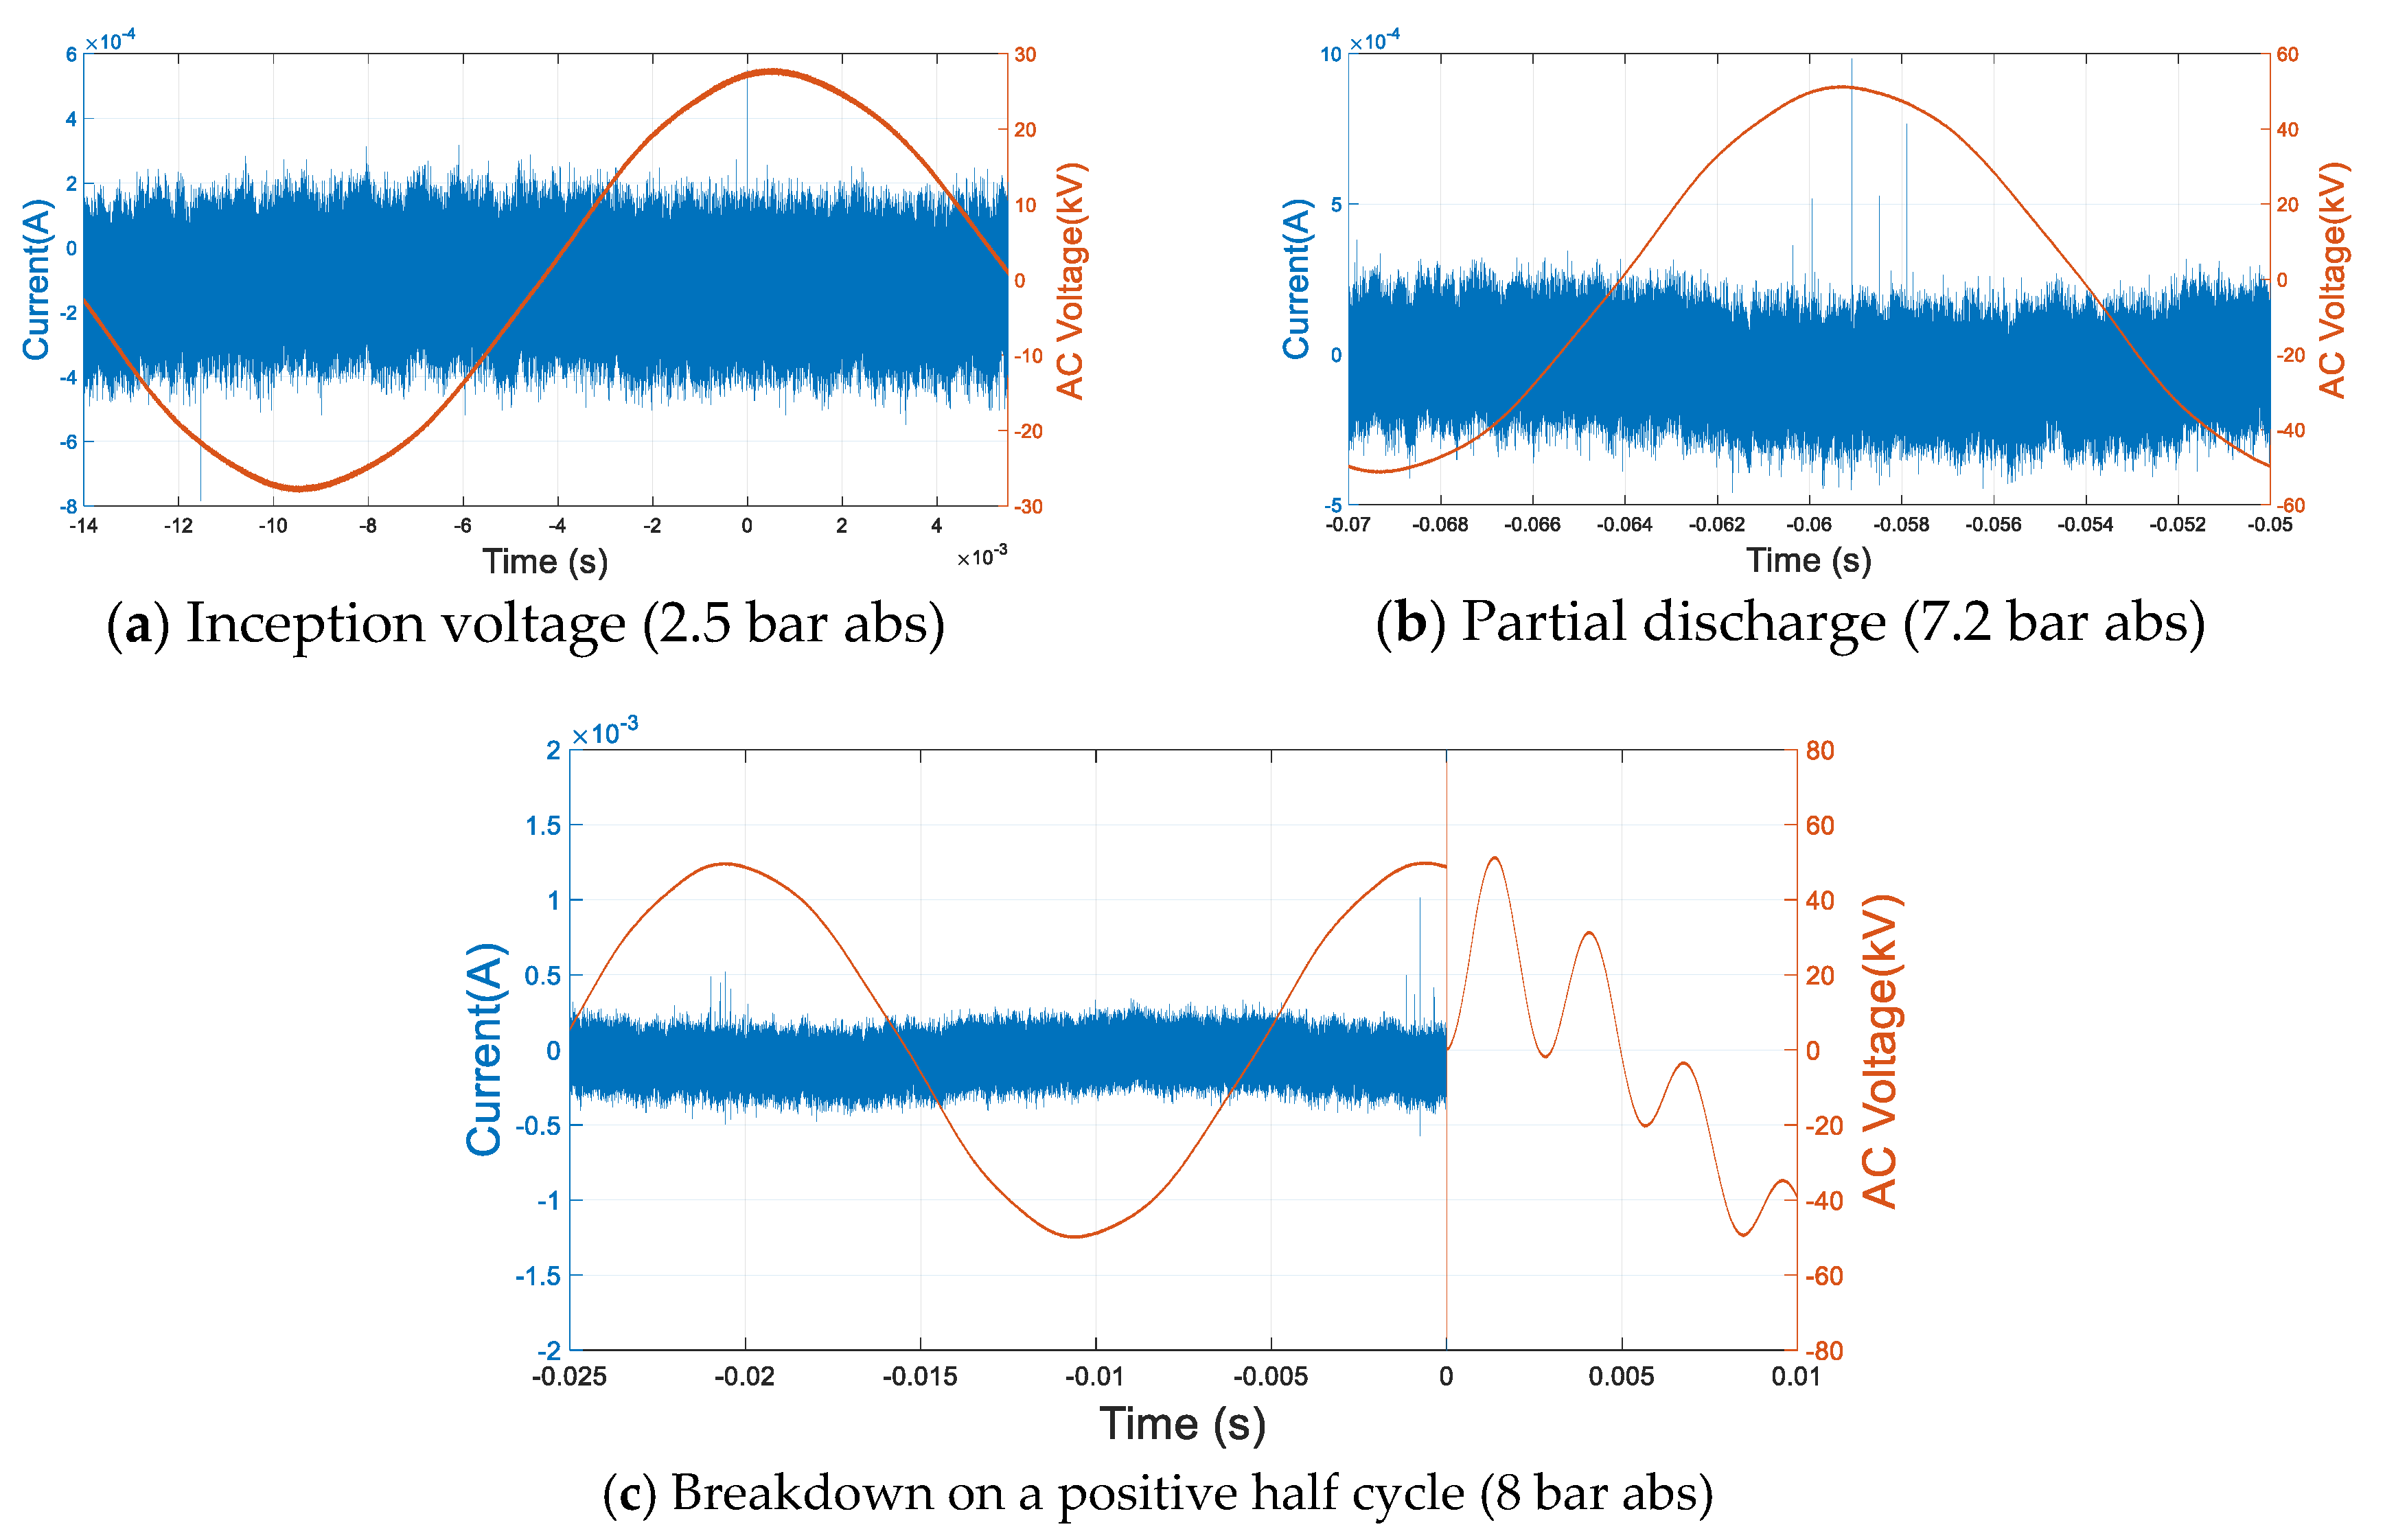
Positive and negative breakdown, inception voltages of 4%NovecTM 4710/96%CO2 are higher than those of CO2 for all test pressures. At 8.8 bar abs, the positive inception voltage of 4%NovecTM 4710/96%CO2 is 1.18 higher than that of CO2 and 1.13 higher in the case of breakdown voltage. The positive inception voltage increases linearly as a function of pressure for pressures between 0.4 and 5 bar abs and shows a saturation trend above 5 bar abs as can be seen in Figure 6. The negative inception voltage is lower than for the positive polarity for pressures up to 2.5 bar abs, and above 2.5 bar abs, no negative current activities were detected, by increasing the pressure or the voltage up to breakdown. The positive inception curve and the breakdown curve are closest at a critical point PC = 7.2 bar abs. At this point, any increase of voltage causes a quick breakdown. The AC positive half cycle is decisive for disruptive discharge (see Table 2).
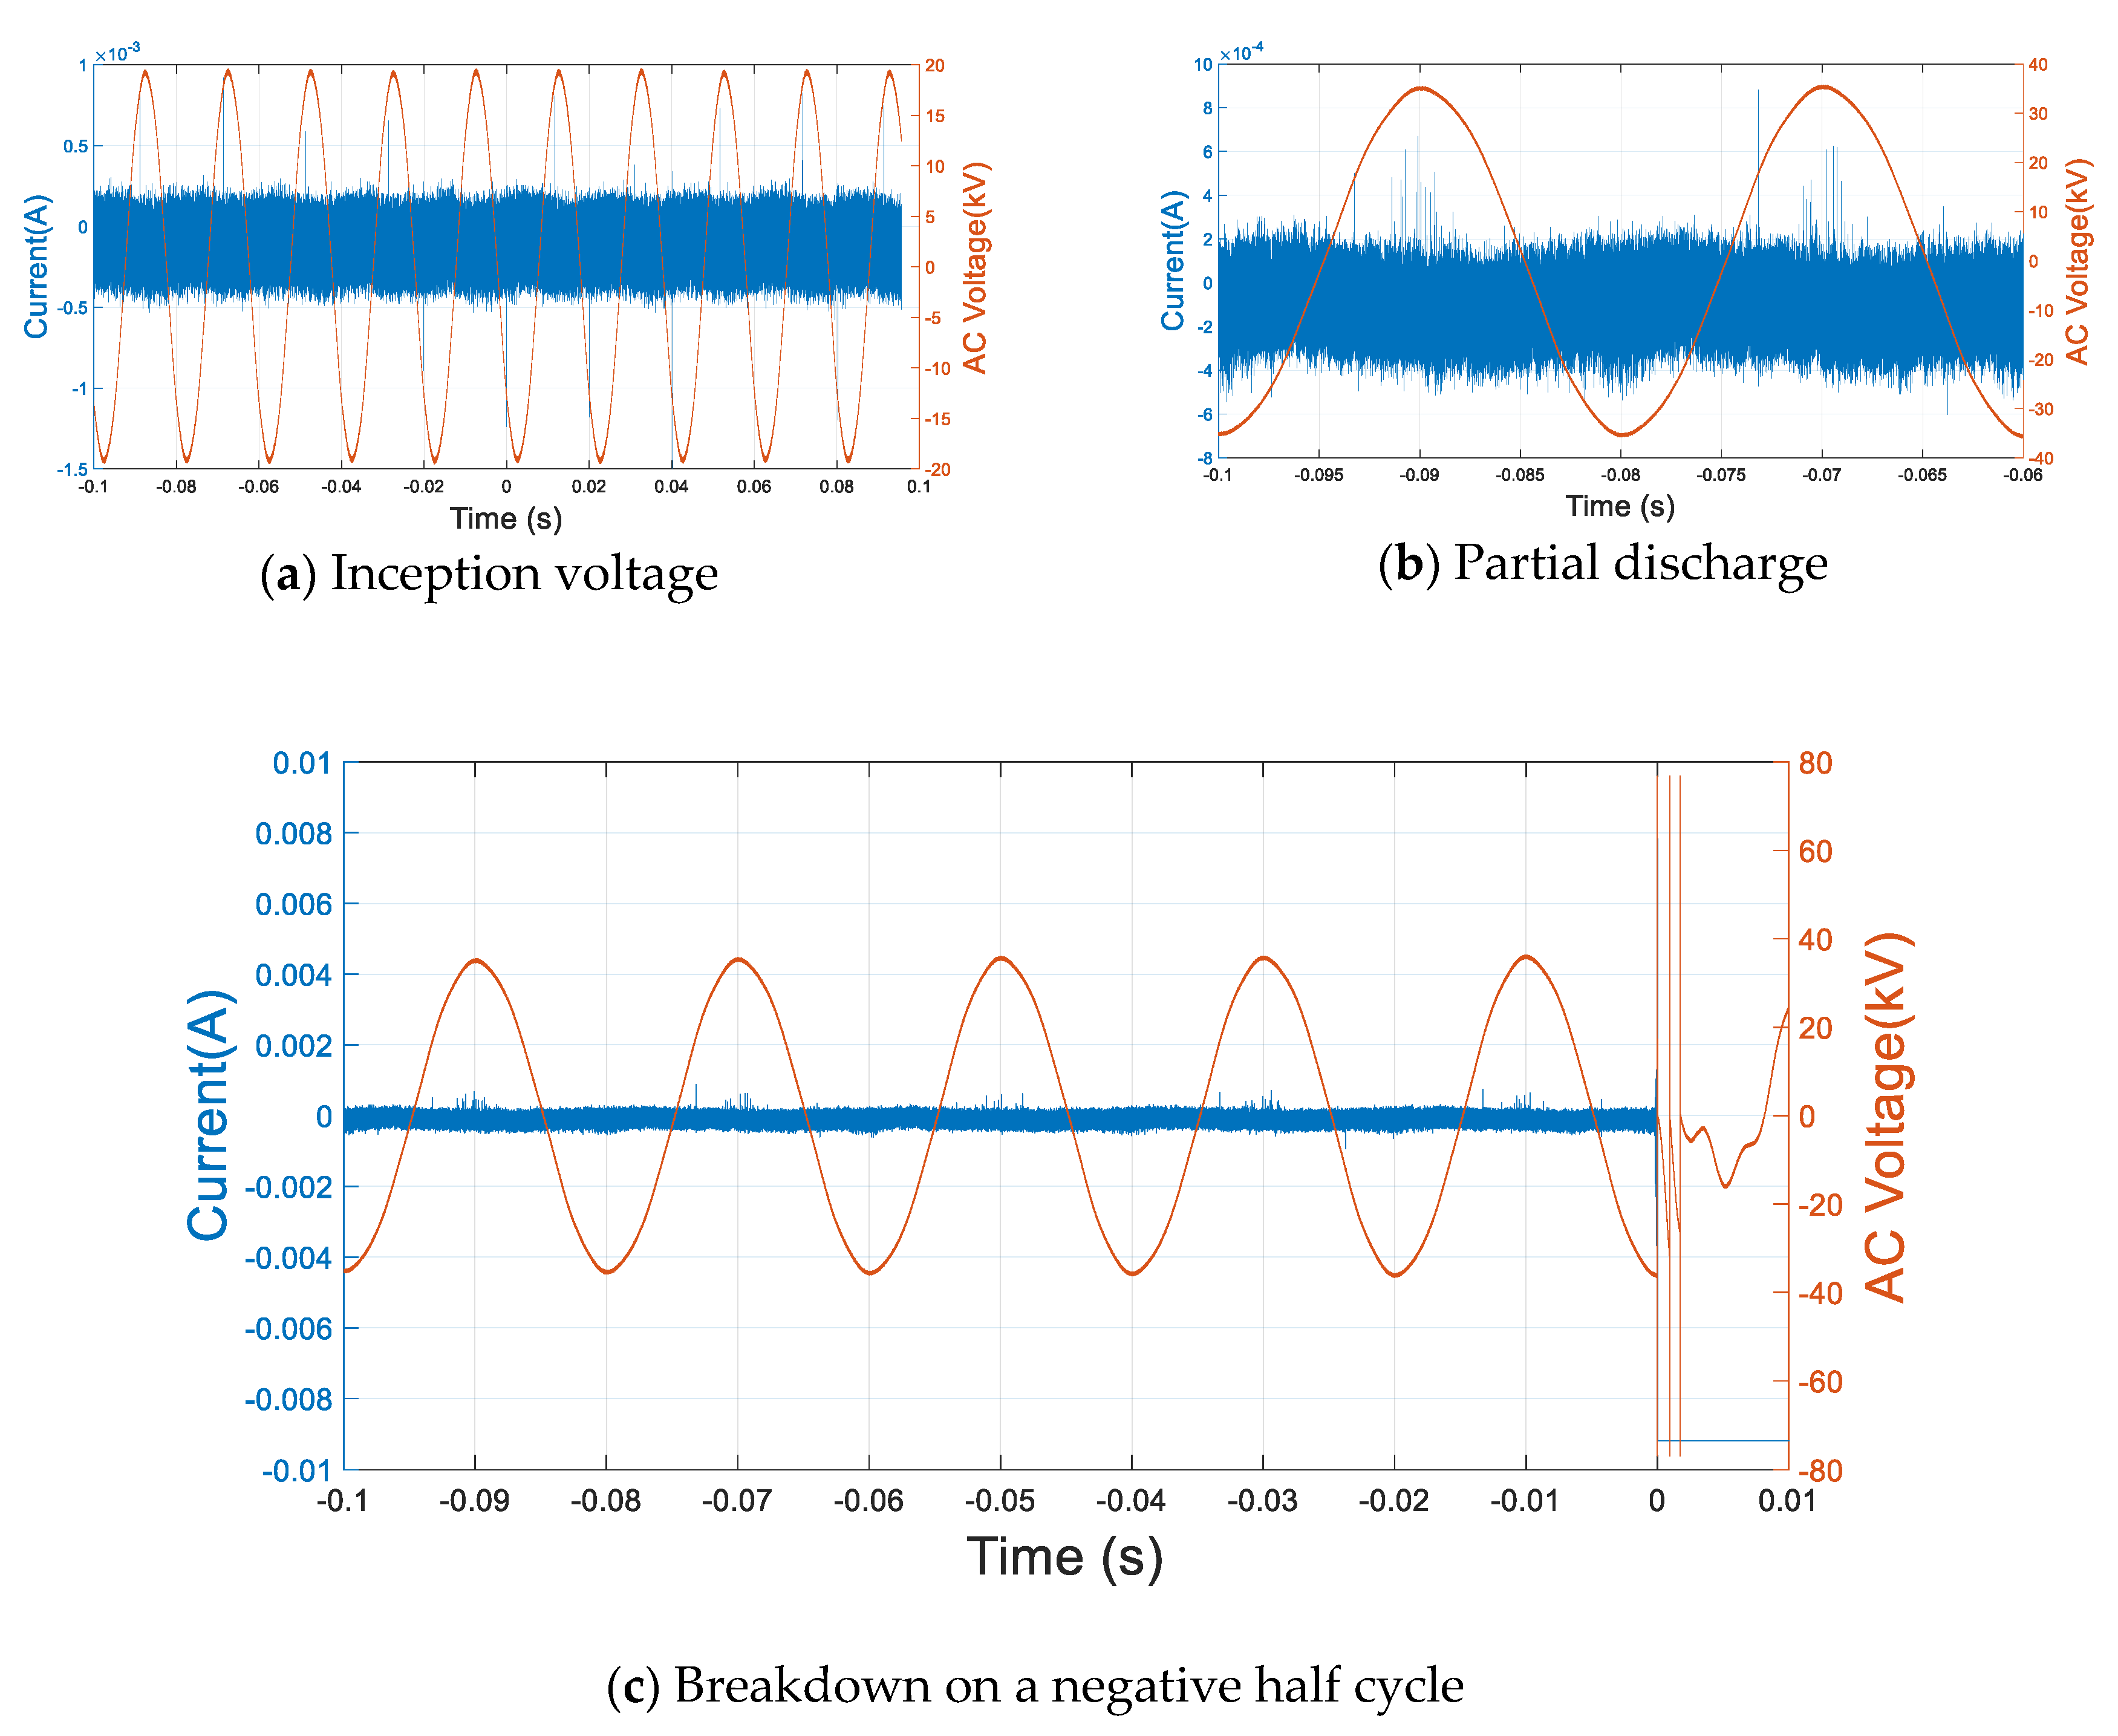
At 1 bar abs, breakdown polarity reversal occurs in 4%NovecTM 4710/96%CO2 gas mixture. The voltage-current characteristics of 0.4 bar abs and 1 bar abs are shown in Figure 7 and Figure 8 as follows. In CO2, the reversal polarity pressure is between 2 and 2.5 bar abs. The polarity reversal in this case is explained by a space charge attributed to the presence of CF3CFCN, CFCN, and CF3+ decomposed by C3F7CN (NovecTM 4710), distorted the electric field, which results in the difference of positive and negative breakdown voltage [25,26]. The voltage-current characteristic for different pressures is shown in Figure 9.

3.2. Discharge Characteristics with Solid Insulators in the Gap

Here, the measured AC Vmean flashover and negative inception voltages as a function of pressure are reported for the needle-plane configuration (solid–gas interface). The gap distance is d = 10 mm, corresponding to a field utilization factor η = 0.025 and the insulation material has a permittivity εr = 2.1.
The flashover plots of CO2 and 4%NovecTM 4710/96%CO2 show a strong nonlinear behaviour as a function of gas pressure under AC voltage. The experimental flashover voltage measured for pressures up to 8.8 bar abs is strongly affected. The flashover occurs in AC voltage on both positive and negative peaks. For a critical pressure, the dielectric flashover occurs at the peak value of the positive half-cycle (see Table 3). The polarity reversal varies from an insulator to another depending on the gas nature.
(a)
PE
For CO2, the negative inception voltage increases linearly as function of pressure, as shown in Figure 10. For this field distribution, a difference is observed between the inception voltage and the flashover voltage. By increasing the pressure, the negative inception curve and the flashover curve reach close voltage levels at a critical pressure, PC = 8 bar abs.
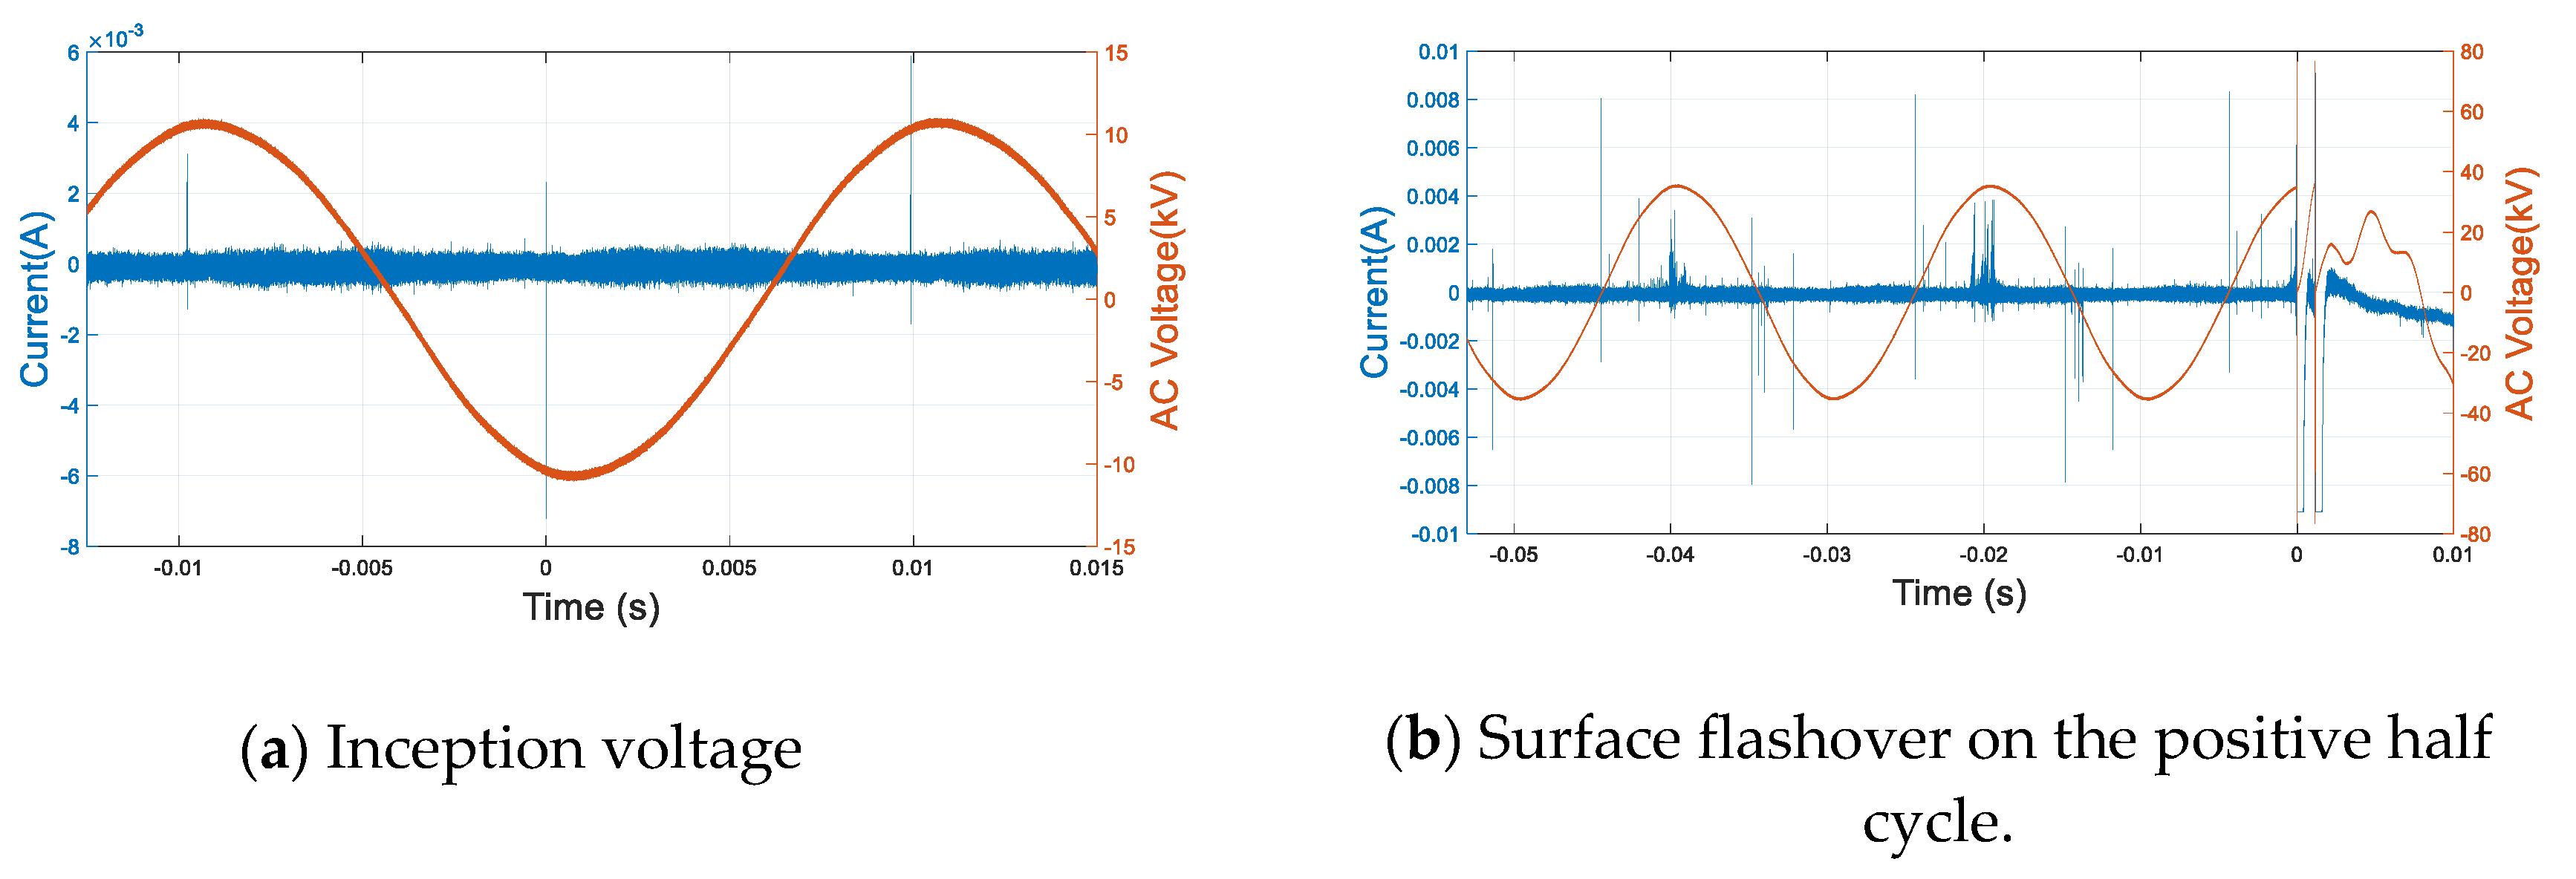
Figure 11 illustrates the instantaneous leakage current recorded during the surface discharge (corona/streamer) inception and the flashover (final jump). According to pre-flashover current measurements in Figure 11, different modes are involved in the nonlinear flashover voltage behaviour as function of the filling pressure.
For 4%NovecTM 4710/96% CO2, the flashover occurs on the positive half-cycle peak for all pressures (see Table 3b). The negative inception voltage increases linearly as function of pressure for pressures between 1 and 5 bar abs and shows a saturation trend above 5bar abs which can be seen on Figure 12a. An example of an associated current of inception voltage at 1bar abs is shown in Figure 13a. By increasing the pressure, the negative inception curve for various pressures and the flashover values become closest at a critical pressure PC = 6 bar abs. The peak flashover voltage occurs at a pressure of 2 bar abs.
Figure 12b shows the flashover voltage of HDPE Vs UHMW-PE insulators as function of pressure. For pressures of 2 to 6 bar abs, the flashover voltage of HDPE is higher than the test vessel’s bushing withstands voltage limit. The UHMW-PE peak flashover voltage occurs at a pressure higher than that for UHMW-PE insulator. This peak pressure difference is attributed to the surface roughness of the insulators:Ra (UHMW-PE) ≈ 18ₓ Ra (HDPE), as can be seen in Table 1. For pressures, 1 ≤ P ≤ 2 bar abs and 6 ≤ P ≤ 8 bar abs, the associated flashover voltage values are equal. For P > 8 bar abs, the HDPE flashover voltage decreases whereas, in PE- UHMW, some increase of flashover voltages occurs.
Figure 13 shows the instantaneous leakage current activity recorded of the discharge activity until the complete flashover of the insulator for a pressure of 2 bar abs. According to this figure, different modes of discharge are involved as previously for PE.
(b)
PTFE
For PTFE tests, it was observed that the flashover occurs on the positive half-cycle peak for the test pressure range (see Table 3b). The inception voltage increases linearly as a function of pressure as shown in Figure 14a, an example of an associated current of inception voltage at 1 bar abs is shown in Figure 15a. By increasing the pressure, the negative inception curve and the flashover values are closest at a critical point, PC = 8 bar abs. The peak flashover voltage occurs at a pressure between 2 and 5 bar abs.
The flashover voltages at 8.8 bar abs of N successive discharge events in the gas-solid interface are shown in Figure 14b–d. For 4%NovecTM 4710/96%CO2 gas mixture, the results show that, in PTFE, significant variabilities always occur σ = ±10% μ (Gaussian Distribution), with a trend of improvement of flashover voltage as the discharges are repeated. Whereas in HDPE insulators, the values are more reproducible, the spread of the flashover voltage is smaller than for PTFE which is σ = ±5.25%μ. The mean flashover voltage with PTFE is 1.18 times higher than that with HDPE.
In Figure 14c, comparing 4%NovecTM 4710/96%CO2 with CO2 with the PTFE insulator, CO2 exhibits a smaller spread σ = ±3% μ and the values are more reproducible. The mean flashover voltage of 4%NovecTM 4710/96%CO2 is 1.25 times higher than that obtained with CO2.
In Figure 14d, comparing the effect of the needle position on flashover voltage, the needle on the ground electrode presents lower variability and more reproducible flashover values σ = ±3.3% μ. The mean flashover voltages are identical for Needle on HV electrode and needle on ground electrode configurations.
(c)
Epoxy
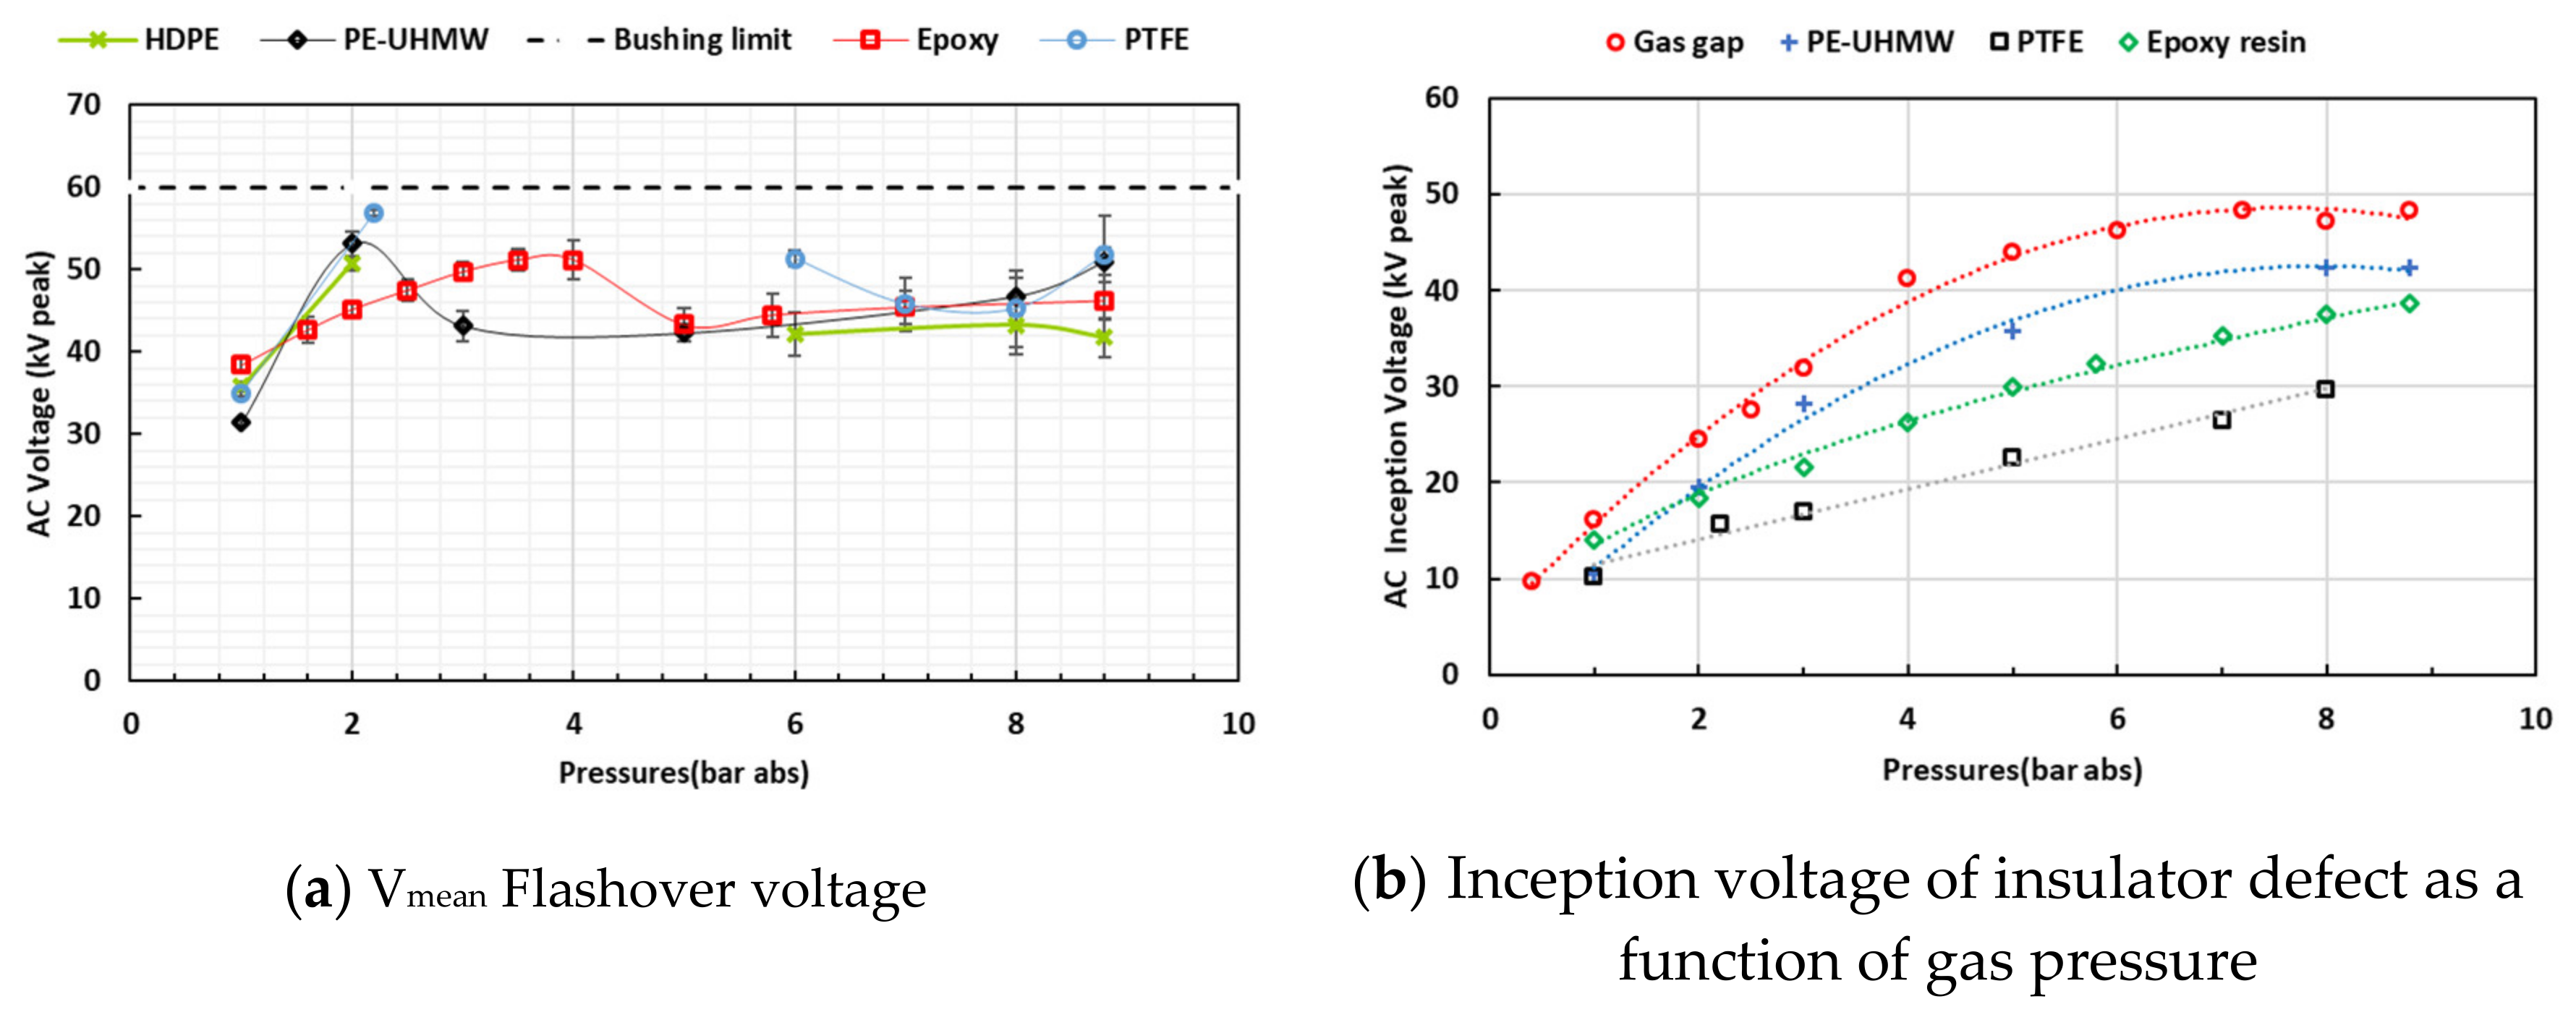
The flashover occurs on the negative half-cycle peak for pressures between 1 and 4 bar abs and on the positive half cycle above 4 bar abs for both roughness values of Ra = 0.5 μm and 5 μm (see Table 3b). Compared with PE and PTFE, the epoxy flashover has different peak pressure values and similar flashover voltages for pressures between 5 and 8.8 bar abs (see Figure 16a). At 8.8 bar abs, the comparison of flashover voltage is as follows:
V Flashover (PTFE) > V Flashover (PE − UHMW) > V Flashover (Epoxy) > V Flashover (HDPE)
For pressures between 1 and 4 bar abs, the peak flashover voltage and its associated pressure for different insulators are strongly dependent on the surface roughness Ra, Increasing Ra causes a peak pressure increase and a decrease of its associated flashover voltage. The comparison of roughness of insulators is as follow (see Table 1):
Ra (Epoxy) > Ra (PE−UHMW) > Ra (PTFE) > Ra (HDPE)
The inception voltage with the different insulators compared to those obtained with the gas gap values is shown in Figure 16b. The comparison of inception voltage is as follows:
V Inception (Gas gap) > V Inception (PE−UHMW) > V Inception (Epoxy) > V Inception (PTFE)
During the first step of flashover, the permittivity affects the inception voltage. According to [27], when a solid insulator is close or in contact with a metallic electrode, the electrical field lines are deviated and directed to the solid insulator and increasing also the electrical gradient near the HV electrode in comparison with the same gap without a solid insulator. The permittivity of the solid insulator increases the electrical gradient that causes a local ionization enough to incept partial discharges. For comparison, the field utilization factors for the electrode arrangement are η1 = 0.025 (PTFE, εr = 2.1) and η2 = 0.0375 (gas gap, εr ≈ 1).
Epoxy resin was assessed for different values of surface roughness Ra and the results are shown in Figure 17a. For pressures between 5 and 8.8 bar abs, the flashover voltages are similar and present a saturation trend for Epoxy 1 (Ra = 0.5 μm) and Epoxy 2 (Ra = 5 μm). The increase of roughness Ra reduces the amplitude of voltage peak at 4 bar abs. Glow corona stabilization is stronger when decreasing Ra (see Figure 17a).
In Figure 17b and for 4%NovecTM 4710/96%CO2 gas mixture, the results show that, in Epoxy (Ra = 5 μm), significant variabilities in measured values always occurs σ = ±7.27% μ (Gaussian Distribution), with a trend of reduction of flashover voltage as the breakdown events were repeated. Whereas in HDPE insulators, for N = 40, the flashover voltage of PTFE is 1.35 times higher that obtained with Epoxy (Ra = 5 μm). For the first flashover event (N = 1), the flashover voltage of PTFE is 1.10 times higher compared with that obtained with Epoxy (Ra = 5 μm).
In Figure 17c and for N2, the results show that in Epoxy (Ra = 5 μm), significant spread is always measured σ = ±9.13% μ. A flashover voltage reduction occurs, caused by surface degradation. For the first flashover event (N = 1), the flashover voltage of 4%NovecTM 4710/96%CO2 (Epoxy, Ra = 5 μm) is 1.14 times higher compared with that of N2 (Epoxy, Ra = 0.5 μm).

3.3. Discharge Characteristics for an Earthed Needle

The breakdown plot of 4%NovecTM 4710/96%CO2 gas mixture shows similar behaviour and similar discharge patterns with the needle position (HV vs ground electrode) under AC voltage (see Figure 18a). The non-linear breakdown behaviour is attributed to the inception of a corona glow discharge, detected in the same range of pressure for both needle positions (see Figure 19b and Figure 20a). The breakdown occurs in AC voltage on both positive and negative half cycle peaks. Table 2 and Table 4a indicate a complementarity of breakdown polarities when changing the position of the needle. The plot shows different peak pressure values as a function of needle location. The inception voltage for the needle at the ground electrode (NOGNDE) is lower compared to the needle at the HV electrode (NOHVE) position for all pressures.
The flashover plot of 4%NovecTM 4710/96%CO2 or CO2 shows similar voltage levels for both needle positions (HV vs ground electrode, with PTFE) under AC voltage, and for pressures outside the [2, 5 bar abs] range (see Figure 18b,c).
As can be seen from Figure 17, the breakdown voltage of 4%NovecTM 4710/96%CO2 gas mixture is higher compared to the flashover voltage in the pressure range. While 4%Novec TM 4710/96%CO2 flashover voltages is higher than CO2 for both needle positions, at 8.8 bar abs, electrical strength (4%NovecTM 4710/96%CO2) = 1.19 times the electrical strength of CO2.
The flashover occurs under AC voltage at both positive and negative half cycle peaks. Table 3a,b and Table 4b,c show a complementarity of flashover polarities when changing the position of the needle. Figure 18b,c show different peak pressure values as function of needle position, for 4%NovecTM 4710/96%CO2 or CO2.

4. Discussion

4.1. Discharge Characteristics of Gases

4.1.1. CO2

According to the pre-breakdown current measurements shown in Figure 5, two modes have been identified in the nonlinear breakdown voltage behaviour as a function of the filling pressure:
0.4 < P ≤ 2 bar abs: The breakdown is led by streamer, corona glow and leader discharges [28,29]. The breakdown occurs at the negative half-cycle peak (see Figure 5a). On the positive half cycle: at P = 2 bar abs, the onset of positive corona glow was detected (see Table 5b), but did not develop to full breakdown, because of the shielding effect produced by the positive corona glow.
P > 2 bar abs: The breakdown polarity reversal is explained as follows: in the negative needle electrode, corona discharge is created near the needle tip, as shown in Figure 5b–d in the negative pre-breakdown current waveform. A positive space charge is left at the needle tip and results in a significant increase of the electric field near the needle tip. Near the anode (plane electrode), the negative space charge causes an increase of the electric field. The positive and negative space charge results in a more uniform field distribution in the main part of the gap. This increases the breakdown voltage.
When the breakdown occurs on the positive half-cycle peak; it is seen that positive glow corona appeared for pressures up to 5 bar abs. In fact, the space charge near the needle tip results in a reduced electric field. The electrode is virtually elongated, the gap width is reduced, and the electric field is enhanced in the remaining gap, resulting in a reduction in breakdown voltage.
VBD (positive half cycle) < VBD (negative half cycle)

4.1.2. 4%NovecTM 4710/96% CO2

0.4 < P ≤ 1 bar abs: inception voltages are detectable on both polarities. When the breakdown occurs on a negative half-cycle peak, no positive glow corona discharge is detectable in this range of pressure. The gaseous breakdown is led by negative streamer discharges, explained as follow:
(i)
Primary electrons are emitted from the cathode (needle electrode), the first avalanche develops toward a decreasing field (See Figure 7a and Figure 8a), then
(ii)
The first avalanche reaches its critical size and, with increasing applied voltage, new avalanches are initiated (See Figure 7b), and finally
(iii)
Increasing the voltage induces more current activity, which generates a sufficient critical space charge avalanche to create a discharge (See Figure 7c).
P ≥ 1 bar abs: Increasing the pressure initiates the dequenching of negative current activity to complete extinction for pressures between 2.5 and 8.8 bar abs (see Figure 9b,c). Partial discharge is represented exclusively in multiple pulses around the positive half cycle peak (see Figure 8b). In CO2 and for high pressures (8 bar abs), only one single positive pulse was recorded prior to breakdown (see Figure 5c), the streamer channels (centered with positive half cycle peak) transit to leader channels and arrive at the grounded electrode immediately.

4.2. Surface Discharge and Flashover with Solid Insulator

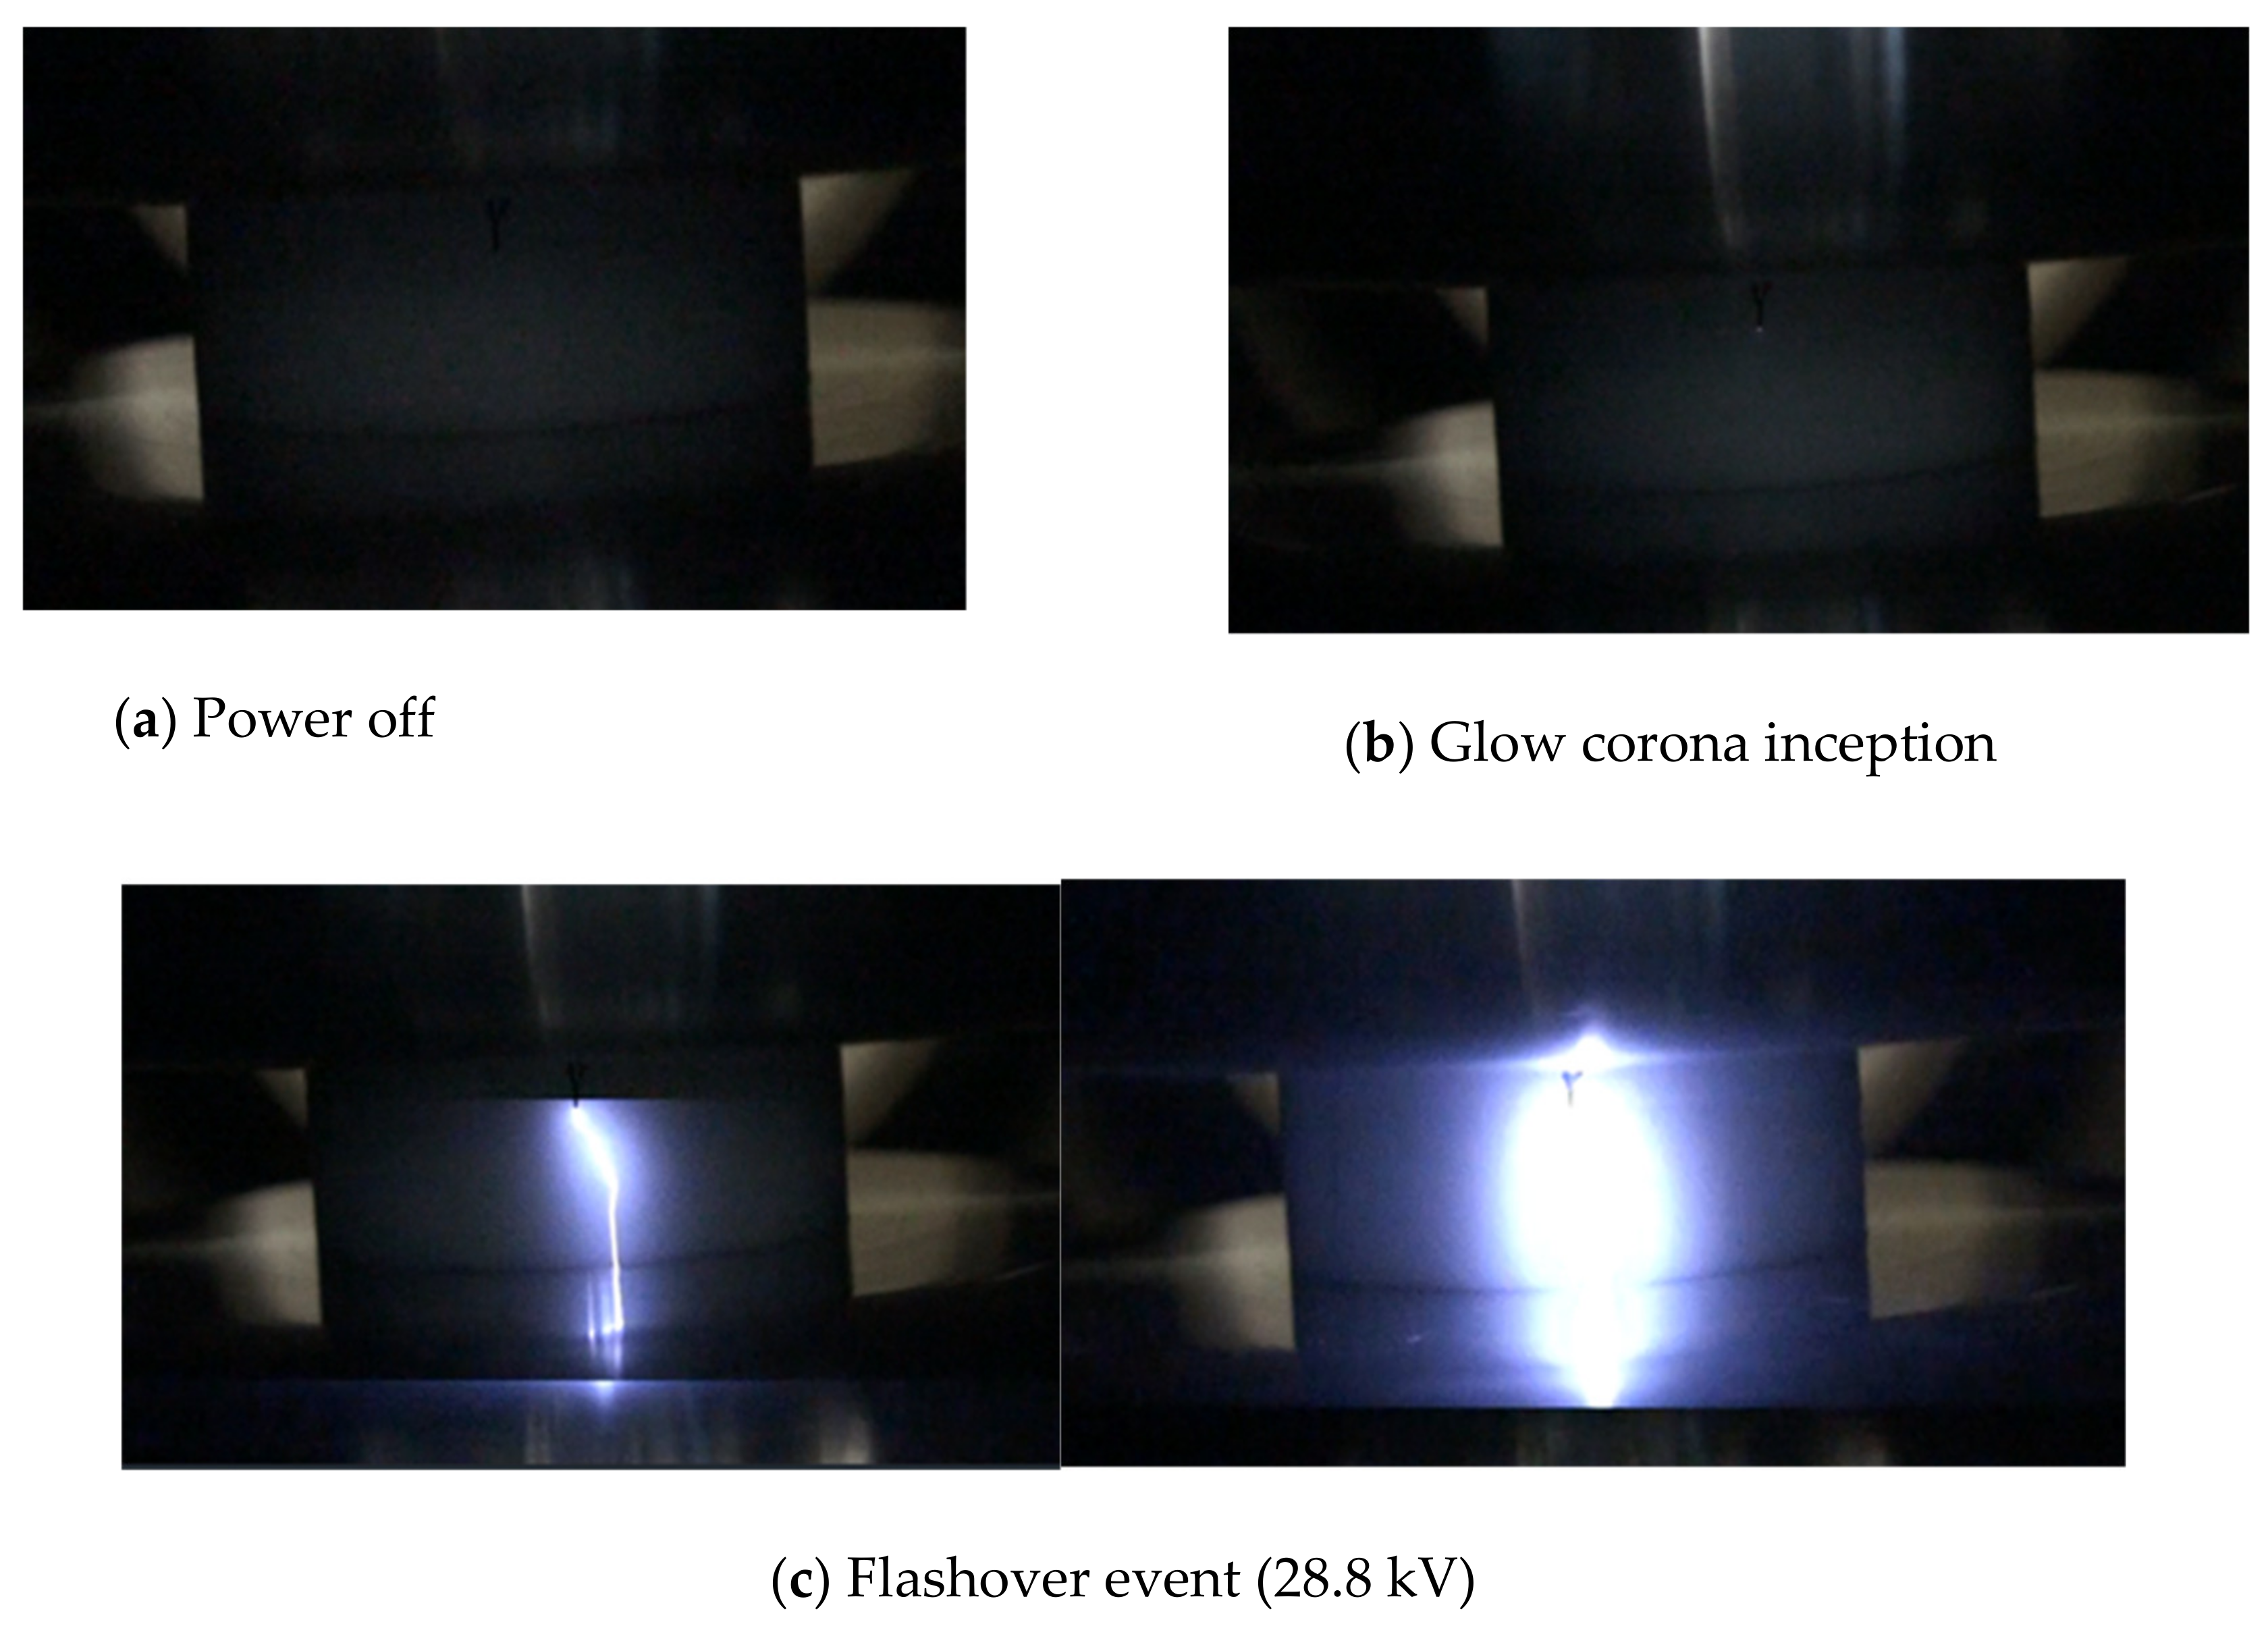
The flashover voltage is lower than the breakdown voltage of 4%NovecTM 4710/96% CO2 gas mixture and CO2, for the same electrode configuration and gap. As the voltage increases, partial discharge appears at the interface between the HV electrode and the solid insulator. With the increase of the applied voltage, the discharge activity is more intense and the leader propagates along the insulator surface until a full ground electrode -flashover- (see Figure 19) as observed by [30].
The behavior of surface discharges on an insulator and their flashover has similarities with partial discharges and breakdown of the gas when no insulators are present, and this is dependent on the gas nature, the gas pressure filling and the type of solid insulator. On the other hand, the surface discharge current is greater than for the gas alone pre-breakdown for the same configuration (gas, electrodes configuration and gap distance), but the current discharge are less frequent. This observation makes it possible to highlight the effective charge injection from the solid insulator along the discharge propagation as suggested by many researchers [31]. Indeed, photoemission and electrical field emission from the solid insulator are possible supplementary charge injection mechanisms that can explain the current pulse increase. The electrical field emission is usually governed by the intensity of the tangential electrical gradient at the insulator surface [31]. For the photoemission, the mechanism is more complex; as the photoemission of the solid dielectric usually needs less energy than the photoionization of the gas [32]. The extraction of the electrons from the solid insulator leaves a positive charge at the surface that interacts with the discharge head, and generates:
(i)
A repulsion effect in the case of positive space charge at the head that pushes the discharge to move away in order to catch other photoelectrons (photoionization and photoemission). Those photoelectrons are responsible for the positive current pulses and the heating of the leader/spark channel.
(ii)
An attraction effect of negative space charge from the solid insulator and from the gas that contribute to the increase of the local attachment and/or recombination at the interface. This can explain the presence of electronegative elements at the arced insulator surface.
The heating of the leader channel interacts also with the insulator surface, and may generate supplementary electrons by a thermo-emission effect which, in turn contributes to the creation of a preferential path across the surface.
The polarity of flashover depends on the gas and insulator type, as presented in Table 3 and Table 4. The polarity of flashover for all used insulators is identical to breakdown in gas gap alone independent of the gas type, except for the Epoxy insulator. Based on this observation, it can be said that the gas pressure plays an important role on the discharge propagation causing the discharge to stick to the insulator surface as the pressure increases as observed by [33,34]. It was found that, depending on the polarity, the efficiency of the charge injection from the solid insulator or the attachment/recombination process will govern the propagation path. The attachment and recombination processes mainly occur at the solid/gas interface. Indeed, the results of the analysis with SEM-EDS of arced and no-arced PTFE samples show an increase of Fluorine at the arced insulator surface with 4%NovecTM 4710/CO2 gas mixture. In the case of Epoxy, the SEM-EDS results show an increase of Oxygen, Bromine, Aluminium and Fluorine at the arced insulator surface tested with 4%NovecTM 4710/CO2 gas mixture.
According to Figure 11, and based on the previous explanations, the description of the surface discharge inception and propagation can be clarified too, depending on the gas pressure and type of insulator:

4.2.1. CO2

(i)
1 < P ≤ 2 bar abs: The flashover occurs on the negative half-cycle peak (see Table 3a) where the negative leader current pulses are observed at the beginning of the negative half-cycle. The leader current pulses are the result of charge accumulation left by the previous activity. During the positive half-cycle, the density of the current pulses is less than is typical for positive streamers and presents also some leader current peaks after charge injection at the beginning of the positive half-cycle. The negative half-cycle just before flashover shows that the leader propagates quickly (final jump) because, at this stage, the critical length was achieved and the unbridged gap between the discharge head and the ground electrode is partially ionized, as suggested in [35,36].
(ii)
P > 2 bar abs: The flashover occurs on the positive half-cycle peak where positive streamers currents and leader pulse current are observable for pressures up to 5 bar abs (see Table 3c). During the positive half cycle, at P = 3 bar abs and as the voltage increases, the stages to discharges are streamer onset, glow corona onset and the leader channels bypass the positive glow corona volume and follows the same process as described in (i). Whereas, during the negative half cycle, the streamer mode is involved before the flashover on the positive half-cycle (See Figure 11b).
(iii)
For pressures P ≥ Pc, the gas breakdown (see Figure 5c in) and the surface flashover (see Figure 11c) occur on the positive half-cycle peak. In Figure 5c, the transition from streamer discharge to leader discharge is immediate and breakdown is immediately after streamer onset, with only a small increase of voltage. Comparing the current activities in Figure 5c and Figure 11c (negative half-cycles), the surface pre-discharge peak current is 4 times higher than the gas pre-discharge one. In fact, the surface pre-discharge includes supplementary mechanisms for discharge development (photoemission, photoionization and electron detachment). Furthermore, no current pulses were detected preceding surface flashover as shown in Figure 11c. Ions generated during the pre-discharge phenomenon on negative half-cycles may not be removed before polarity reversal occurs, resulting in a space-charge induced field distortion. This results in a reduction of the surface flashover voltage. On the other hand, it was observed that the surface discharge trends to stick the insulator surface with the increasing of the gas pressure [33,34,37,38]. This can explain the relative stability of the surface flashover voltage for high pressures: the main electrical charges are collected from insulator caused by the increase of the attachment process with the gas pressure rising. Moreover, according to [35,36,37], the discharge velocity increases with the energy increase according to the following equation.
v d ( t ) = 2 β P ( t ) M v π a d 2 3
β is the energy fraction used for the discharge propagation and varies between 0 and 1, P(t) is the discharge power during a lap time dt, ad is the discharge radius and Mv is the gas molecular volume.
The more is energy injected or applied, the more the discharge is faster. For higher pressures, the inception voltage is higher resulting in a higher velocity of electrons and ions. Resulting in a faster avalanche growth and faster discharge development, and the corona initiation curve and the flashover curve reach closer voltage levels.

4.2.2. 4%NovecTM 4710/96% CO2

Steady glow corona discharge occurs at 2 bar abs (see Table 5a), the associated currents were shown in Figure 13b,c the glow discharge is present until flashover. At 3 bar abs, glow discharge is detected. The discharge switches on and off at a voltage well below the flashover voltage. With increasing voltage, the glow discharge is extinguished up to flashover.
At 1 bar abs, inception discharges are detectable for both polarities. The flashover occurs on the positive half-cycle peak. No glow corona discharge is detected, and the surface flashover is led by a positive streamer discharges, as explained in the steps below.
The first avalanche reaches its critical size and with increasing applied voltage, new avalanches are created (See Figure 15b, positive half cycle).
Increasing the voltage generates higher current activity and a sufficient critical space charge avalanche to initiate a discharge (See Figure 15b, positive half cycle).
The breakdown/flashover characteristics of 4%NovecTM 4710/96% CO2 and CO2 as function of pressure under non-uniform electric field distribution are strongly nonlinear. Associated pre-discharge activities were determined (inception voltage, positive and negative streamer activities). The non-linear behaviour is attributed to the inception and quenching of positive glow corona, in the interval between inception and breakdown voltages (see Figure 20). Table 5 summarizes the glow corona inception voltages as a function of pressure for the gaseous gap with solid-gas interface.
For epoxy and for 4%NovecTM 4710/96% CO2 gas mixture, the pressure at which polarity reversal occurs is higher than that obtained with PTFE and PE (see Table 3b). The adsorption effect of γ-Al2O3 (Alumina, aluminium (III) oxide) on decomposed C4F7N/N2 was proven [13]. The γ-Al2O3 has a strong adsorption effect on the main insulating medium C3F7CN, and can be explained by the fact that the average pore diameter of the γ-Al2O3 adsorbent is 0.9 nm, and the average diameter of the macropores are 1~2 nm, i.e., larger than the ynamic diameter of the C3F7CN and its post-discharge decomposition products (between 0.48 and 0.77 nm).

5. Conclusions

The breakdown characteristic of 4%NovecTM 4710/96% CO2 and CO2 as a function of pressure under non-uniform electric field distribution is strongly nonlinear. The non-linear behaviour is attributed to the inception and quenching of positive glow corona, in the interval between inception and breakdown voltages. Breakdown, positive, and negative discharge inception voltages of 4%NovecTM 4710/96% CO2 are higher than those of CO2 for all test pressures used here. At 8.8 bar abs, the positive inception voltage of 4%NovecTM 4710/96% CO2 is 1.18 highest relative to CO2 and 1.13 higher for the breakdown voltage.
Compared with PE and PTFE, the epoxy flashover has different peak pressure values and similar flashover voltages for pressures between 5 and 8.8 bar abs. At 8.8 bar abs, the comparison of flashover voltage is as follows:
V Flashover (PTFE) > V Flashover (PE−UHMW) > V Flashover (Epoxy) > V Flashover (HDPE)
The comparison of inception voltage of the different insulators is as follows:
V Inception (Gas gap) > V Inception (PE−UHMW) > V Inception (Epoxy) > V Inception (PTFE)
For 4%NovecTM 4710/96% CO2 gas mixture, the results show that in Epoxy (Ra = 5 μm), significant scatter always occurs σ = ±7.27% μ (Gaussian Distribution), with a trend of reduced flashover voltage as the discharges repeated. In contrast, with HDPE insulators and for N = 40, the flashover voltage of PTFE is 1.35 times higher compared with Epoxy (Ra = 5 μm).
For 4%NovecTM 4710/96% CO2 gas mixture, the results show that in PTFE, significant scatter always occurs σ = ±10% μ (Gaussian Distribution), with a trend of increasing of flashover voltage as the discharges repeated. In contrast, with HDPE insulators, the values are more reproducible, and the scatter of the flashover voltage is smaller than that with PTFE σ = ±5.25% μ. The mean flashover voltage of PTFE is 1.18 times higher compared with HDPE.
The breakdown or flashover voltages of 4%NovecTM 4710/96% CO2 gas mixture show symmetrical behaviour and similar discharge voltages as function of needle position (at HV or at ground electrode) under AC voltage. The surface flashover voltage is lower than the discharge voltage of 4%NovecTM 4710/96% CO2 gas mixture and CO2 without the insulator. For a critical pressure, the dielectric flashover/breakdown occurs at the positive half-cycle peak instant. The change in polarity at which the discharge occurs varies from one insulator to another, depending on the gas type.
The peak flashover voltage and its associated pressure for the different insulators are strongly dependent on surface roughness Ra. The increase of roughness Ra reduces the amplitude of voltage peak. Glow corona stabilization is stronger when the roughness Ra is decreased.

Author Contributions

Conceptualization, H.E.N., M.E.A.S., A.H., and G.W.; methodology, H.E.N. and M.E.A.S; validation, A.H.; formal analysis, H.E.N. and M.E.A.S.; investigation, H.E.N.; writing—original draft preparation, H.E.N.; writing—review and editing, H.E.N., M.E.A.S and A.H.; supervision, A.H.; project administration, A.H. and G.W.; funding acquisition, A.H. and G.W. All authors have read and agreed to the published version of the manuscript.

Funding

This research was funded by National Grid Electricity Transmission UK.

Conflicts of Interest

The authors declare no conflict of interest.

References

  1. Nechmi, H.E. Recherche de Gaz/Mélanges Gazeux Sans Hexafluorure de Soufre Pour des Applications Haute Tension. Ph.D. Thesis, Ecole Centrale de Lyon, Université of Lyon, Lyon, France, 2016. [Google Scholar]
  2. Nechmi, H.E.; Beroual, A.; Girodet, A.; Vinson, P. Fluoronitriles/CO2 gas mixture as an eco-friendly alternative candidate to SF6 in high voltage insulation systems. In Proceedings of the 2016 IEEE Conference on Electrical Insulation and Dielectric Phenomena (CEIDP), Toronto, ON, Canada, 16–19 October 2016; pp. 384–387. [Google Scholar]
  3. Nechmi, H.E.; Beroual, A.; Girodet, A.; Vinson, P. Fluoronitriles/CO2 gas mixture as promising substitute to SF6 for insulation in high voltage applications. IEEE Trans. Dielectr. Electr. Insul. 2016, 23, 2587–2593. [Google Scholar] [CrossRef]
  4. Nechmi, H.E.; Beroual, A.; Girodet, A.; Vinson, P. Effective ionization coefficients and limiting field strength of fluoronitriles-CO2 mixtures. IEEE Trans. Dielectr. Electr. Insul. 2017, 24, 886–892. [Google Scholar] [CrossRef]
  5. Simka, P.; Doiron, C.B.; Scheel, S.; Di-Gianni, A. Decomposition of alternative gaseous insulation under partial discharge. In Proceedings of the 20th International Symposium on High Voltage Engineering, Buenos Aires, Argentina, 28 August–1 September 2017. [Google Scholar]
  6. Zhang, B.; Li, C.; Xiong, J.; Zhang, Z.; Li, X.; Deng, Y. Decomposition characteristics of C4F7N/CO2 mixture under AC discharge breakdown. AIP Adv. 2019, 9, 115212. [Google Scholar] [CrossRef] [Green Version]
  7. Li, Y.; Zhang, X.; Zhang, J.; Xie, C.; Shao, X.; Wang, Z.; Chen, D.; Xiao, S. Study on the thermal decomposition characteristics of C4F7N-CO2 mixture as eco-friendly gas insulating medium. High Volt. 2020, 5, 46–52. [Google Scholar] [CrossRef]
  8. Zhang, X.; Li, Y.; Xiao, S.; Tian, S.; Deng, Z.; Tang, J. Theoretical study of the decomposition mechanism of environmentally friendly insulating medium C3F7CN in the presence of H2O in a discharge. J. Phys. D Appl. Phys. 2017, 50, 325201. [Google Scholar] [CrossRef]
  9. Li, Y.; Zhang, X.; Chen, Q.; Zhang, J.; Li, Y.; Xiao, S.; Tang, J. Influence of oxygen on dielectric and decomposition properties of C4F7N-N2-O2 mixture. IEEE Trans. Dielectr. Electr. Insul. 2019, 26, 1279–1286. [Google Scholar] [CrossRef]
  10. Li, Y.; Zhang, X.; Xiao, S.; Chen, D.; Liu, C.; Shi, Y. Insights into the interaction between C4F7N decomposition products and Cu (1 1 1), Ag (1 1 1) surface. J. Fluor. Chem. 2018, 213, 24–30. [Google Scholar] [CrossRef]
  11. Li, Y.; Zhang, X.; Chen, Q.; Zhang, J.; Chen, D.; Cui, Z.; Xiao, S.; Tang, J. Study on the thermal interaction mechanism between C4F7N-N2 and copper, aluminum. Corros. Sci. 2019, 153, 32–46. [Google Scholar] [CrossRef]
  12. Li, Y.; Zhang, X.; Xiao, S.; Zhang, J.; Chen, D.; Cui, Z. Insight into the compatibility between C4F7N and silver: Experiment and theory. J. Phys. Chem. Solids 2019, 126, 105–111. [Google Scholar] [CrossRef]
  13. Xiao, S.; Chen, D.; Tang, J.; Li, Y. Adsorption Behavior of γ-Al2O3 Toward Heptafluoroisobutyronitrile and its Decompositions: Theoretical and Experimental Insights. IEEE Access 2020, 8, 36741–36748. [Google Scholar] [CrossRef]
  14. Huang, Q.; Wang, Y.; Liu, J.; Zhang, Y.; Zeng, L. Study on the Compatibility of Gas Adsorbents Used in a New Insulating Gas Mixture C4F7N/CO2. Processes 2019, 7, 698. [Google Scholar] [CrossRef] [Green Version]
  15. Preve, C.; Lahaye, G.; Richaud, M.; Maladen, R.; Penelon, T.; Galas, S. Hazard study of medium-voltage switchgear with SF6 alternative gas in electrical room. CIRED Open Access Proc. J. 2017, 2017, 198–201. [Google Scholar] [CrossRef] [Green Version]
  16. Preve, C.; Maladen, R.; Piccoz, D. Alternative gases to SF6 as breaking medium for switching performance: Measurement of the concentrations of by-products and assessment of the acute toxicity. In Proceedings of the 21st International Symposium on High Voltage Engineering (ISH), Budapest, Hungary, 26–30 August 2019. [Google Scholar]
  17. Li, Y.; Zhang, X.; Zhang, J.; Xiao, S.; Xie, B.; Chen, D.; Gao, Y.; Tang, J. Assessment on the toxicity and application risk of C4F7N: A new SF6 alternative gas. J. Hazard. Mater. 2019, 368, 653–660, ISSN 0304-3894. [Google Scholar] [CrossRef] [PubMed]
  18. 3M USA Safety Data Sheet (SDS), 3M™ Novec™ 4710 Dielectric Fluid, 33-6330-6, Version 9.11, 18-03-2020. Available online: https://multimedia.3m.com/mws/mediawebserver?mwsId=SSSSSuUn_zu8l00xmxmBmxmSOv70k17zHvu9lxtD7SSSSSS-- (accessed on 2 April 2020).
  19. Li, Z.; Ding, W.; Liu, Y.; Li, Y.; Zheng, Z.; Liu, W.; Gao, K. Surface flashover characteristics of epoxy insulator in C4F7N/CO2 mixtures in a uniform field under AC voltage. IEEE Trans. Dielectr. Electr. Insul. 2019, 26, 1065–1072. [Google Scholar] [CrossRef]
  20. Slama, M.E.A.; Beroual, A.; Girodet, A.; Vinson, P. Barrier effect on Surface Breakdown of Epoxy Solid Dielectric in SF6 with Various Pressures. In Proceedings of the Conference on Electrical Insulation and Dielectrics Phenomena, CEIDP 2016. Toronto, ON, Canada, 23 October 2016. [Google Scholar]
  21. Hinterholzer, T.; Boeck, W. Breakdown in SF6 influenced by corona-stabilization. In Proceedings of the Annual Report Conference on Electrical Insulation and Dielectric Phenomena (CEIDP), Victoria, BC, Canada, 15–18 October 2000; Volume 1, pp. 413–416. [Google Scholar]
  22. Takahashi, T.; Yamada, T.; Hayakawa, N.; Yuasa, S.; Okabe, S.; Okubo, H. Corona stabilization effect in SF6 gas viewed from sequential generation of partial discharge. In Proceedings of the Eleventh International Symposium on High Voltage Engineering (ISH), London, UK, 23–27 August 1999; Volume 3, pp. 88–91. [Google Scholar]
  23. Hermstein, W. Die entwicklung der positiven vorentladungen in luft zum durchschlag. Arch. Elektrotech. 1960, 45, 279–288. [Google Scholar] [CrossRef]
  24. Wu, Z.; Zhang, Q.; Zhang, L.; Guo, C.; Du, Q.; Pang, L. Neglected culprit of nonlinear discharge characteristics in SF6: Shielding effect induced by positive glow corona discharge. Plasma Sources Sci. Technol. 2019, 28, 085018. [Google Scholar] [CrossRef]
  25. Tu, Y.; Cheng, Y.; Wang, C.; Ai, X.; Zhou, F.; Chen, G. Insulation characteristics of fluoronitriles/CO2 gas mixture under DC electric field. IEEE Trans. Dielectr. Electr. Insul. 2018, 25, 1324–1331. [Google Scholar] [CrossRef]
  26. Wang, C.; Ai, X.; Zhang, Y.; Tu, Y.; Yan, X.; Liu, W. Decomposition products and formation path of C3F7CN/CO2 mixture with suspended discharge. IEEE Trans. Dielectr. Electr. Insul. 2019, 26, 1949–1955. [Google Scholar] [CrossRef]
  27. Gallimbertti, I.; Marchesi, I.; Niemeyer, L. Streamer corona at an insulating surface. In Proceedings of the 7th International Symposium on High Voltage Engineering, Dresden, Germany, 26–30 August 1991; pp. 1–4. [Google Scholar]
  28. Seeger, M.; Avaheden, J.; Pancheshnyi, S.; Votteler, T. Streamer parameters and breakdown in CO2. J. Phys. D Appl. Phys. 2016, 50, 015207. [Google Scholar] [CrossRef]
  29. Hayakawa, N.; Hatta, K.; Okabe, S.; Okubo, H. Streamer and leader discharge propagation characteristics leading to breakdown in electronegative gases. IEEE Trans. Dielectr. Electr. Insul. 2006, 13, 842–849. [Google Scholar] [CrossRef]
  30. Perez, A.; Beroual, A.; Girodet, A.; Jacquier, F. Characteristics of Creeping Discharges Along Epoxy Surface in Fluoronitrile/CO2 Gas Mixture under Lightning Impulse. In Proceedings of the 21st International Symposium on High Voltage Engineering: ISH 2019; Németh, B., Ed.; Lecture Notes in Electrical Engineering. Springer: Cham, Switzerland, 2020; Volume 599. [Google Scholar]
  31. Sudarshan, T.S.; Dougal, R. Mechanisms of surface flashover along solid dielectrics in compressed gases: A Review. IEEE Trans. Electr. Insul. 1986, 21, 727–746. [Google Scholar] [CrossRef]
  32. Odic, E.; Goldman, A.; Goldman, M.; Dhainaut, M.; Dussart, R. Current distribution of ac surface discharges and associated chemistry. J. Electrost. 2006, 64, 477–484. [Google Scholar] [CrossRef] [Green Version]
  33. Beroual, A.; Coulibaly, M.-L.; Aitken, O.; Girodet, A. Effect of micro-fillers in PTFE insulators on the characteristics of surface discharges in presence of SF6, CO2 and SF6–CO2 mixture. IET Gener. Transm. Distrib. 2012, 6, 951–957. [Google Scholar] [CrossRef]
  34. Slama, M.E.A.; Beroual, A.; Haddad, A. Surface Discharges and Flashover Modelling of Solid Insulators in Gases. Energies 2020, 13, 591. [Google Scholar] [CrossRef] [Green Version]
  35. Beroual, A.; Coulibaly, M.L.; Aitken, O.; Girodet, A. Investigation on creeping discharges propagating over epoxy resin and glass insulators in presence of different gases and mixtures. Eur. Phys. J. Appl. Phys. 2011, 56, 30802–30809. [Google Scholar] [CrossRef] [Green Version]
  36. Béroual, A. Electronic gaseous process in the breakdown phenomena of dielectric liquids. J. Appl. Phys. 1993, 73, 4528–4533. [Google Scholar] [CrossRef]
  37. Fofana, I.; Beroual, A. A New Proposal for Calculation of the leader Velocity based on Energy Considerations. J. Phys. D Appl. Phys. 1996, 29, 691–696. [Google Scholar] [CrossRef]
  38. Slama, M.E.A.; Beroual, A.; Haddad, A. A predictive dynamic model of creeping discharge along solid insulator in air at atmospheric pressure. In Proceedings of the IEEE International Conference on High Voltage Engineering and Application (ICHVE), Athens, Greece, 10–13 September 2018. [Google Scholar]
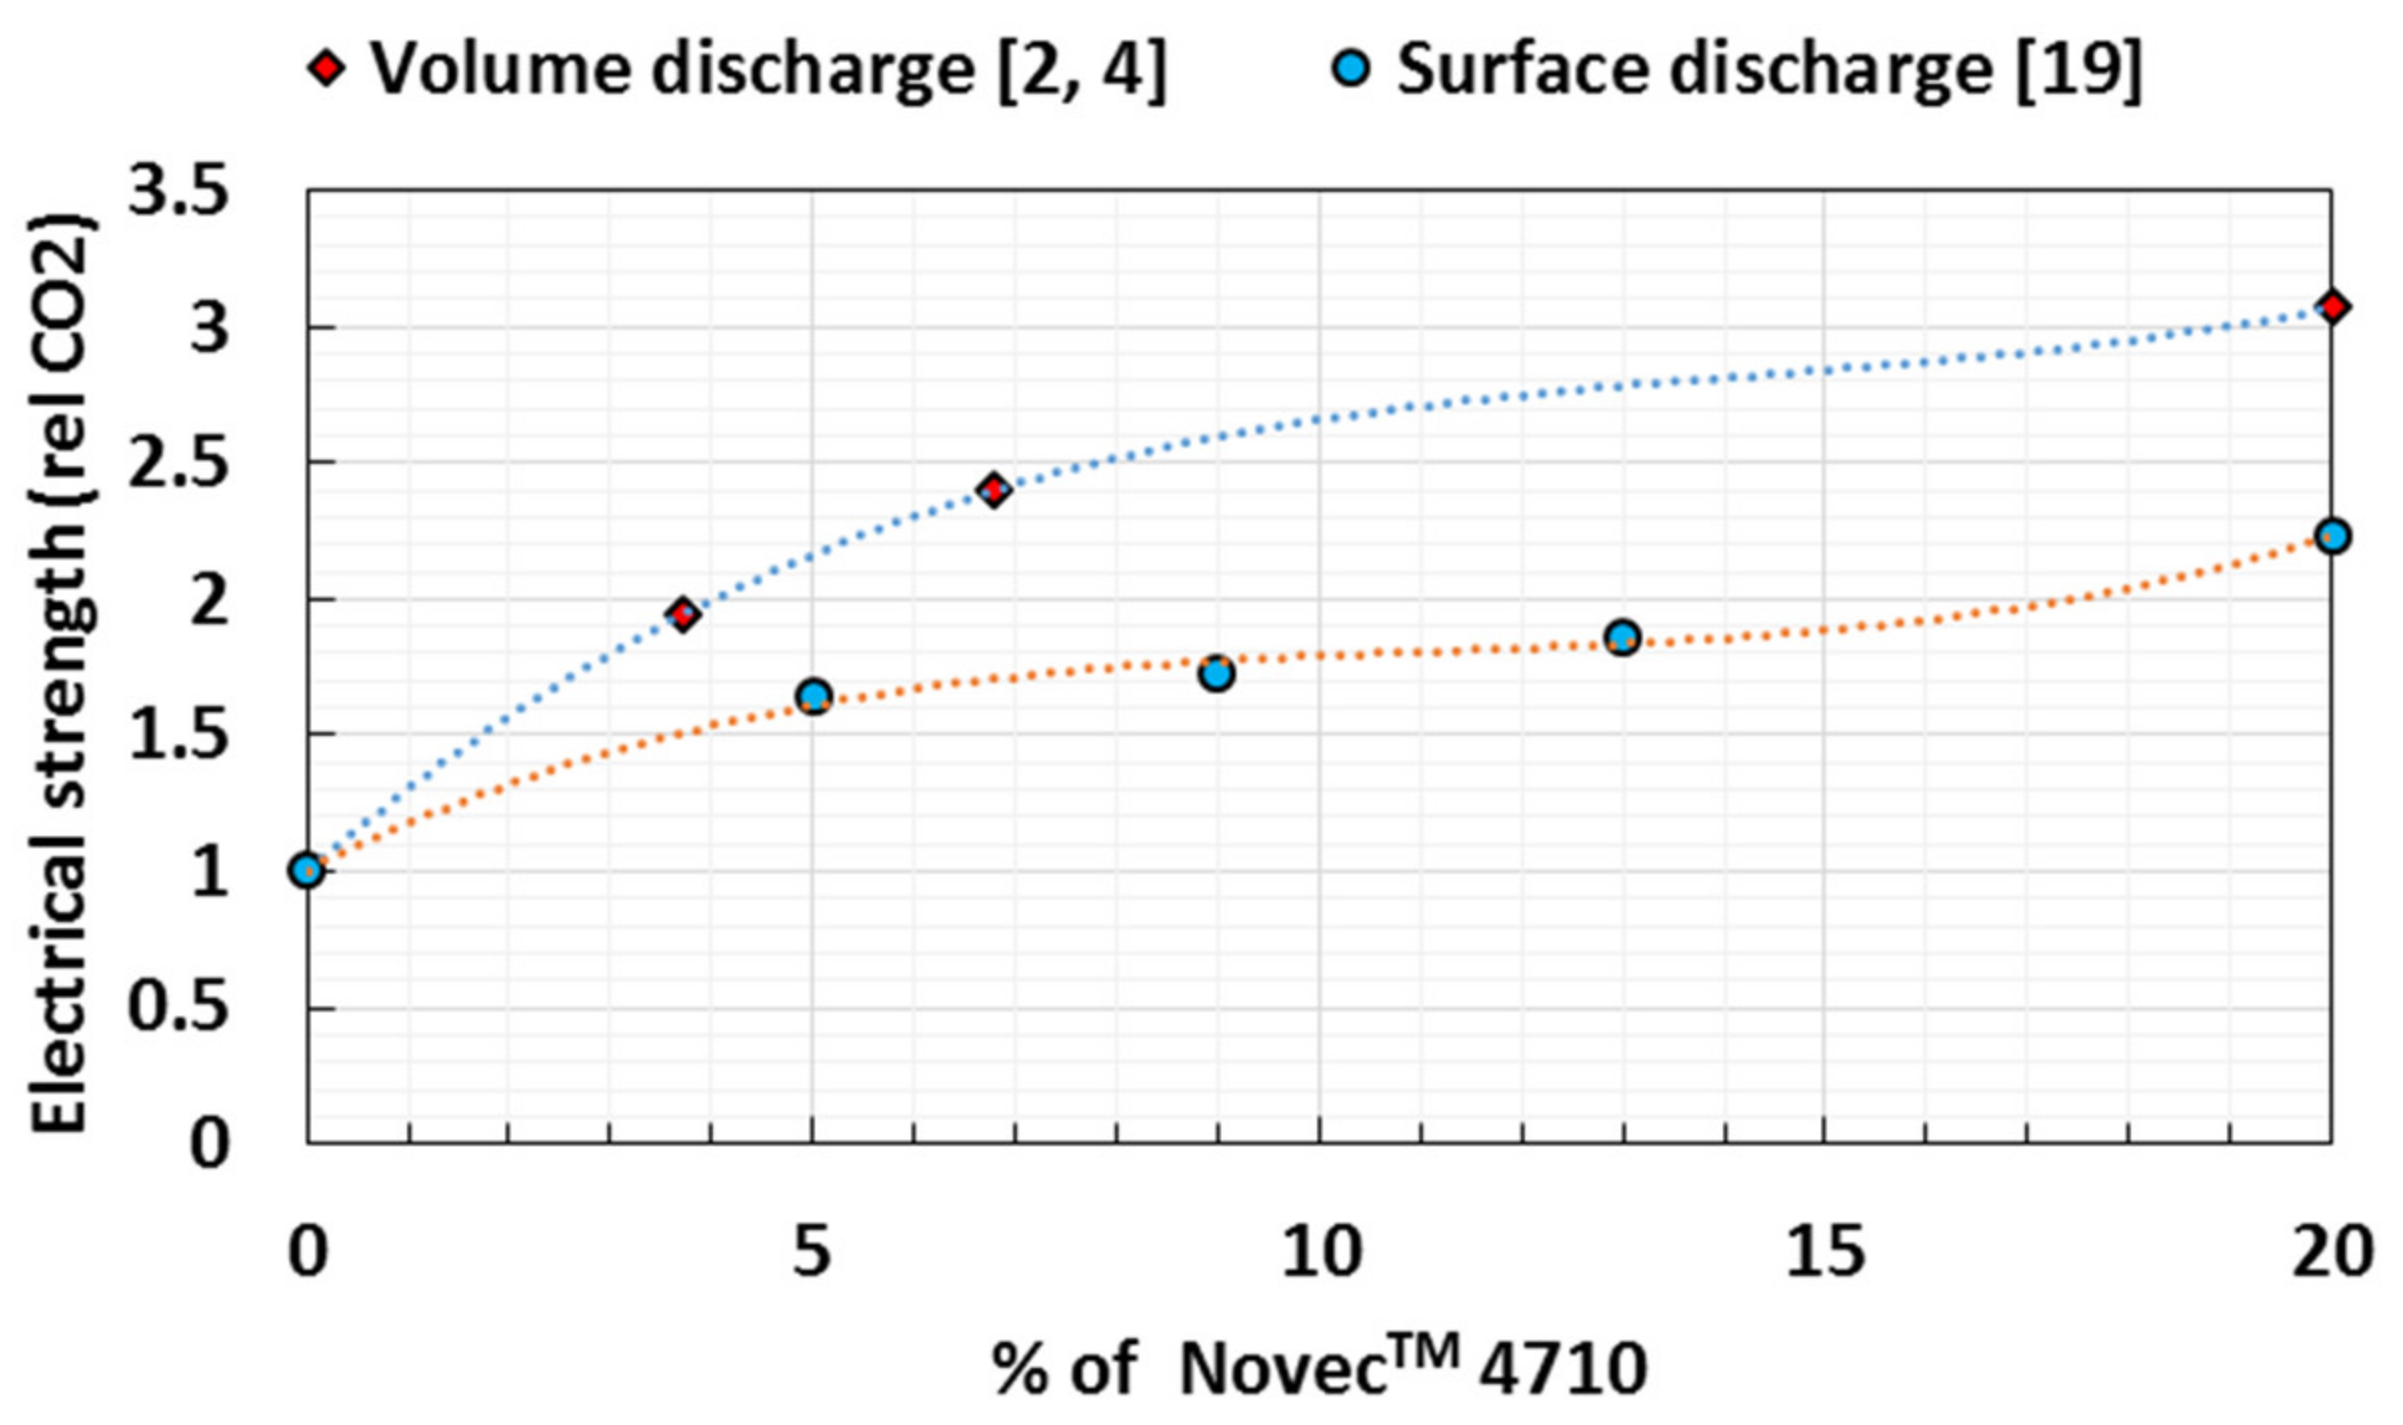
Figure 1. Electrical strength (ES) relative to CO2 for different NovecTM 4710/CO2 gas mixtures in uniform electric field (Volume discharge [2,4] vs. Surface discharge (epoxy insulator) [19]).
Energies 13 01710 g001
Figure 2. Electrode configuration: (a) Needle to a plane arrangement for breakdown investigations; (b) Insulator model for surface flashover experiments.
Energies 13 01710 g002
Figure 3. Insulator samples: different dielectric materials.
Energies 13 01710 g003
Figure 4. Vmean Breakdown, positive and negative inception voltages as a function of gas pressure (CO2, needle on HV electrode).
Energies 13 01710 g004
Figure 5. Voltage-current waveform for measuring partial discharge and breakdown voltages in CO2.
Energies 13 01710 g005
Figure 6. Vmean Breakdown, positive and negative inception voltages as a function of gas pressure (4%NovecTM 4710/96%CO2, needle on HV electrode).
Energies 13 01710 g006
Figure 7. Voltage-current waveform for measuring inception voltage, partial discharge, and breakdown voltages (4%NovecTM 4710/96%CO2, P = 0.4 bar abs).
Energies 13 01710 g007
Figure 8. Voltage-current waveform for measuring inception voltage, partial discharge, and breakdown voltages (4%NovecTM 4710/96%CO2, P = 1 bar abs).
Energies 13 01710 g008
Figure 9. Voltage-current waveform for measuring inception voltage, partial discharge, and breakdown voltages (4%NovecTM 4710/96%CO2).
Energies 13 01710 g009
Figure 10. Vmean Flashover and Negative inception voltages as function of gas pressure (CO2, PE-UHMW, Needle on HV electrode).
Energies 13 01710 g010
Figure 11. Voltage-current waveform for measuring partial discharge and surface flashover voltages (CO2, PE-UHMW, Needle on HV electrode).
Energies 13 01710 g011
Figure 12. Vmean Flashover and negative inception voltages as function of gas pressure (4%NovecTM 4710/96%CO2, Needle on HV electrode).
Energies 13 01710 g012
Figure 13. Voltage-current waveform for measuring inception voltage, partial discharge and surface flashover voltages (4%NovecTM 4710/96%CO2, PE-UHMW, voltage 18.75 kV/div, current 1 mA/div).
Energies 13 01710 g013
Figure 14. Flashover voltage of the insulator defect (4%NovecTM 4710/96%CO2, PTFE, Needle on HV electrode).
Energies 13 01710 g014
Figure 15. Voltage-current waveform for measuring surface discharges events (4%NovecTM 4710/96%CO2, PTFE, Needle on HV electrode, 1 bar abs).
Energies 13 01710 g015
Figure 16. (4%NovecTM 4710/96%CO2, HDPE Vs PE-UHMW Vs Epoxy 2 (Ra = 5 µm) Vs PTFE, Needle on HV electrode).
Energies 13 01710 g016
Figure 17. Flashover voltage of insulator defect as function of gas pressure (4%NovecTM 4710/96%CO2, Needle on HV electrode).
Energies 13 01710 g017
Figure 18. Breakdown/Flashover voltages as function of gas pressure (Needle on HV electrode NOHVE Vs Needle on ground electrode NOGHDE).
Energies 13 01710 g018
Figure 19. AC (kV peak) flashover voltage for CO2 (PTFE at 2 bar abs) as a function of applied voltage.
Energies 13 01710 g019
Figure 20. Positive glow corona onset: for 4%NovecTM 4710/96% CO2 for an applied voltage.
Energies 13 01710 g020
Table 1. Roughness features of tested insulators.
MahrSurf PS 10
RaRzRelative Permittivity (εr)Surface
Resistivity
Ohm/sq
Volume
Resistivity
ohm/cm
Sample Number1234512345
PTFE0.790.710.860.820.794.073.774.346.064.102.110171018−1019
Polyethylene - HDPE0.230.320.030.060.061.531.590.491.140.652.310131015−1018
Polyethylene – UHMW1.131.161.251.131.216.596.867.567.307.152.310131018
Epoxy 10.520.590.580.620.574.945.145.275.075.124–4.5--
Epoxy 25.285.244.574.594.5731.0929.2725.1624.4925.414–4.5--
Table 2. AC Breakdown polarity of CO2 and 4%NovecTM 4710/96%CO2 under different pressures up to 8.8 bar abs (Needle on HV Electrode).
Needle on HV Electrode Polarity of Breakdown
Pressures (bar abs)0.4122.534567.288.8
CO2++++++++
4%NovecTM 4710/96%CO2−/++++++++++
Table 3. AC Flashover polarity under different pressures up to 8.8 bar abs (Needle on HV) Electrode).
(a) CO2.
CO2 Polarity of Flashover
Pressures (bar abs)122.534567.288.8
PE++++++++
PTFE−/++++++++
(b) 4%NovecTM 4710/96%CO2.
4%NovecTM 4710/96% CO2 Polarity of Flashover
Pressures (bar abs)122.534567.288.8
PTFE++++++++++
PE++++++++++
Epoxy−/+−/++++++
Table 4. AC polarity under different pressures up to 8.8 bar abs (Needle on Ground Electrode).
(a) Breakdown in 4%NovecTM 4710/96%CO2.
Needle on ground Electrode Polarity of Breakdown
Pressures (bar abs)0.4122.534567.28
4%NovecTM 4710/96%CO2−/+
(b) Flashover in 4% NovecTM 4710/96%CO2.
4%NovecTM 4710/96% CO2 Polarity of Flashover
Pressures (bar abs)122.534567.288.8
PTFE −/+
(c) Flashover in CO2
Pressures (bar abs) 122.534567.28
PTFE ++++
Table 5. Glow Corona onset as a function of pressure in.
(a) 4%NovecTM 4710/96%CO2 (UHMW-PE, Flashover Discharge)
Pressure (bar abs)123588.8
4%NovecTM4710/CO2 (UHMW-PE) ×××
(b) CO2 (Breakdown Discharge)
Pressure (bar abs)123588.8
CO2 ×××
(c) CO2 (UHMW-PE, Flashover Discharge)
Pressure (bar abs)123588.8
CO2 (UHMW-PE) ×××