Article

A PV-Powered TE Cooling System with Heat Recovery: Energy Balance and Environmental Impact Indicators

by
Agnieszka Żelazna
* and
Justyna Gołębiowska
Department of Renewable Energy Engineering, Faculty of Environmental Engineering, Lublin University of Technology, 20-618 Lublin, Poland
*
Author to whom correspondence should be addressed.
Energies 2020, 13(7), 1701; https://doi.org/10.3390/en13071701
Submission received: 12 March 2020 / Revised: 30 March 2020 / Accepted: 31 March 2020 / Published: 3 April 2020
(This article belongs to the Special Issue Life Cycle Assessment and Carbon Footprint in Energy Systems)

Abstract

:
Over the past decades, clean and renewable energy has become a subject of great interest to both science and industry in response to the pollution caused by conventional energy sources. Its useful form should always meet the requirements of high performance and low environmental impact, while remaining within the scope of the expected functionality. The purpose of study presented in this paper was to determine the operational characteristics for a recently developed photovoltaic (PV)-powered thermoelectric (TE) cooling system with heat recovery. The characteristics of operation of the tested system were determined within the use of a specially developed measurement system. The conducted experimental research allowed describing the conditions of power supply for TE module using PV system, calculate the coefficient of performance (COP) for the whole TE cooling system with heat recovery and calculate the environmental impact indicators based on the material and energy balance used for life cycle assessment (LCA).

Graphical Abstract

1. Introduction

Energy is nowadays a fundamental component required for raising the living standards of people, along with the economic and social development. The interest in new renewable technologies in recent years is caused by both social expectations in the field of reducing the air pollution resulting from the use of fossil fuels, as well as long-term programs aimed at reducing the greenhouse gas emissions [1,2]. The issue of comfortable use for owners of modern, maintenance-free energy systems able to replace obsolete installations is also significant. Scientists and engineers are making efforts to develop new and efficient energy supply systems for the heating and cooling purposes. Rising energy needs [3,4] force the use of modern engineering devices and systems, the search for which is becoming one of the directions of development for engineering sciences.
Thermoelectric cooling (TEC) is based on the Peltier effect, in which the phenomenon of heat transfer from a low temperature heat source to a high temperature one takes place. Peltier modules (called also TE modules) are characterized by such advantages as small dimensions, fast reaction, lack of moving parts [5] and potential media leakages [6]. Considering this characteristic, increasing attention has been paid to TECs in the recent years [7]. Typical applications of Peltier devices include cooling in electronics, touristic and domestic refrigeration, laboratories, medicine and automobile uses [8]. The increasing interest in TE cooling and heating translates into the development of new applications [9], possible to obtain in accordance with the development of new production technologies and higher efficiency of modules [10], as well as system operation optimization [11].
The main directions in designing of a thermoelectric cooler are based on the system cooling power output and cooling coefficient of performance (COP) [12]. The above results in a need to study both the Peltier module operation parameters and the heat exchanger design. Thus, the improvement of the thermoelectric cooler performance could be achieved in three basic ways.
The proper design and optimization of Peltier module, based on the selection of material properties [13] and designing of numerous geometrical parameters like the thermoelectric leg dimensions [14,15], the number of thermocouples [16] or the slenderness ratio [17,18], is the basic option for the improvement of TE cooler performance. It is worth mentioning that the performance and operating temperature range of TE modules vary for different thermoelectric materials and should be chosen carefully for a certain application. The figure of merit ZT is a dimensionless parameter generally used for the comparison of thermoelectric materials and can be calculated from the following formula [19]:
Z T = S 2 σ λ T
where S is the Seebeck coefficient [μV/K], σ is the electrical conductivity [S/m], λ is the thermal conductivity [W/(m·K)] and T is the absolute temperature, in which the measurement was performed [K]. The selected thermoelectric materials that can be applied to the construction of TE modules are presented in Table 1.
The thermoelectric material most commonly used for cooling purposes, adequate for operation at a temperature lower than 150 °C, is based on bismuth telluride (Bi2Te3) and is characterized by the ZT value of 0.8–1.0. It was estimated that the thermoelectric modules with ZT value of 1.0 operate at only 10% of Carnot efficiency [12]. In order to achieve the efficiency at the level of modern refrigeration equipment, the value of ZT should reach the level of 4 or 5 [19].
The second method of TE cooling optimization involves designing the cooling system itself, where the most important issue is connected with the construction and materials of heat sinks [20], including type and thickness of fins in the heat exchanger [21] and new designs like thermosiphon with phase change and capillary action [22].
The third way of TE cooling optimization is the proper selection of the cooling system working parameters like electric current, flow rates of media, etc. [23,24]. In this context, it is worth underlining that the enhancement of the heat exchange processes at hot and cold sides of Peltier module greatly influences the COP of the system. Usually, air cooled heat sinks, water cooled heat sinks and heat sinks integrated with heat pipes are used for that purpose. The characteristic of the heat sink at the hot side is more important than at the cold side, which results from higher heat flux density at the hot side caused by the heat transfer as well as the accompanying effects [11].
The studies on TE cooling include the heat transfer to the air connected with ventilation systems, like an investigation of a thermoelectric air-cooling and air-heating system presented in [25]. In the study, the coefficient of performance COP between 1.5 and 2 was obtained by supplying an electrical intensity of 4 A, while the temperature difference between hot and cold side equaled 5 °C.
In another paper [26], the theoretic and investigational study of a TE solar air conditioner was described. In the mentioned system, there was the possibility of heat recovery for hot water heating. The experimental system was built and verified under the laboratory conditions in three operating modes: air cooling, air cooling within heat recovery for water heating and air heating. The results presented in this paper show that with suitable control of operation parameters, it is possible to use examined system for water preheating without losing its cooling power. The laboratory tests of the second mode allowed obtaining the relatively high COP equal 4.51, while the maximal water temperature equaled 20 °C.
The new solutions of TE cooling were described in [27], which presented an overview of the current building integrated TE air conditioning systems. Moreover, it proposed an original building integrated TE system that incorporates a thermoelectric heat pump unit into a two-sides ventilated facade to provide heating, cooling, heat recovery ventilation and domestic hot water or drying services for buildings, based on the thermoelectric waste heat utilization. Several building integration methods of the proposed system were presented, however, it did not contain the preliminary tests.
Cheng et al. [28] designed a thermoelectric model for green building applications powered by solar radiation energy with waste heat recovery from solar cells and from the hot side of the thermoelectric module. The experiment was conducted to investigate the cooling efficiency of the module applied for conditioning the temperature inside the model house. The assurance of temperature reduction of solar cells and hot side of TE module, due to the increased water flow, provided better performance of the studied system. The discussed studies showed that, due to the designed system, it was possible to lower the temperature inside the house prototype by 16.2 °C. In the studied case, the COP coefficient values ranged from 0.2 to 1.2.
In Liu et al. [29] a novel active solar thermoelectric radiant wall was described and tested. This technology was based on the building envelope consisting of a photovoltaic system (placed on the external wall), airflow channel, and thermoelectric radiant cooling system (TE modules were connected in series and placed between the aluminum radiant panel and heat sinks). The solar energy gained from the solar cells was used directly to power the TE modules. In order to improve the efficiency of the TE modules the forced convection was used (provided by fans). According to the authors, this kind of solution could eliminate the conventional building envelope thermal loads and provide a certain cooling capacity at the same time. Experimental results showed that the inner surface temperature of the presented wall was lower than the indoor temperature of the test room from 3 °C to 8 °C. The overall obtained cooling efficiency was about 3.3% and 7.1%, depending on the PV installation angle.
The purpose of the research presented in this paper was to determine the characteristics of operation of a PV-powered thermoelectric cooling system with heat recovery, which is being developed as a potentially efficient and environmentally-friendly kind of energy source. The assessment of system includes both energy effectiveness, measured by the use of Coefficient of Performance, as well as environmental impact indicators, calculated within the use of Life Cycle Assessment.
The presented research was focused on the TE modules application for air cooling with the use of forced convection, using the potential heat recovery by water heat exchanger on the hot side of Peltier module. Since TE modules are supplied by the direct current, photovoltaic is an option of energy source for its operation. Although, this type of source depends on the intensity of solar radiation, it also allows the system to operate independently of the power grid, which is an important advantage in the context of possible applications in seasonal facilities, where the small dimensions of the devices and their multifunctionality determine the competitiveness of the design.
In the following sections, the operation of the TE cooling system with heat recovery tested for various options of power supply was characterized by the use of measured temperature performance, calculated COP and environmental indicators in order to assess the potential application possibilities, considering both the system efficiency and environmental burdens.

2. Materials and Methods

The conducted research was planned as three-stage laboratory tests followed by life cycle assessment in order to provide a holistic perspective for the evaluation of the proposed solution, by testing various, possible during in-situ applications, power supply sources and heat recovery. The proposed scheme was the result of the previous development of a cooling and heating system and included the most interesting option of direct PV energy supply for the TE module. The previous tests of the laboratory equipment included various supply parameters and heat exchangers under the laboratory conditions. The measurements presented in this paper included three stages of the experiment, in which energy supply systems and heat exchangers applied to the tested TE module were changed:
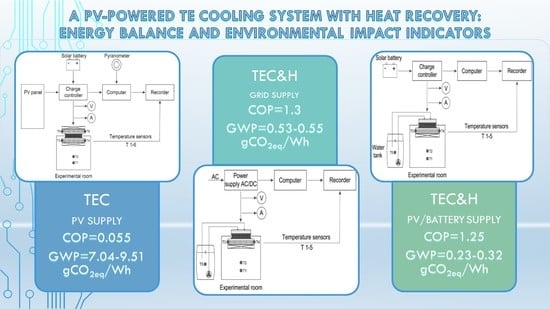
  • Stage 1: The thermoelectric cooling system without heat recovery; the TE module was powered by a PV system including a PV panel, solar battery and charge controller;
  • Stage 2: The thermoelectric cooling system with heat recovery; the TE module was powered by a laboratory AC/DC power supply within the power comparable to the low solar irradiance conditions;
  • Stage 3: The thermoelectric cooling system with heat recovery; the TE module was powered by a solar battery.
Within each particular stage, three measuring series were conducted. The unchanged laboratory set consisting of an experimental room and the same type of TE module was used in the presented laboratory measurements. Depending on the stage, the applied heat exchangers and measuring equipment were changed. The first stage aimed at the determination of the power supply parameters for the in-situ operation of the PV panel and measurement of the temperature characteristics of the TE module operating with the air finned heat sink, with heat dissipation to the surrounding. The second stage was performed under laboratory conditions, imitating the PV power supply parameters for the TE module operating in the cooling mode, with heat recovery via water exchanger. An additional third stage aimed at the characterization of the design, in which all the energy is provided by a solar battery charged by a PV panel (discharging).
In order to determine the integral COP for the entire system, the following formula was used [26,30]:
COP = (Qc + Qh) · (PTE + Pfan + Ppump)−1
where Qc is the cooling power of the TE module, calculated for air cooling, including experimental room losses [W], Qh is the thermal power of the TE module, calculated for water heating, including hot water tank losses [W], PTE is the power supplying the TE module [W], Pfan is the power supplying the fan [W] and Ppump is the pump power demand [W].

2.1. Experimental Room

The cuboid experimental room consisted of 5 cm thick polystyrene insulation boards characterized by the thermal conductivity coefficient of 0.034 W/(m·K). The internal dimensions of the room were 0.5 m × 0.5 m × 0.5 m (length × width × height), thus the cubic volume of the room was equal to 0.125 m3. The polystyrene boards were connected by the application of polyurethane foam.
The Quick-Cool QC-127-1.4-8.5MD thermoelectric module (Quick-Ohm Küpper & Co. GmbH, Wuppertal, Germany) was placed in a specially prepared slot in the upper board, which served also as a movable cover of the experimental room. The detailed characteristics of the applied TE module were presented in Table 2. The cover also ensured the thermal insulation of the TE module. The direction of the current was set in order to provide cooling of the experimental room.

2.2. Heat Exchangers and Power Supply

Two types of the heat exchangers were applied and tested in the experiment. In the first stage of experiment (Stage 1), the Alpine 11 Plus (Arctic, Niedersachsen, Germany) sets consisting of finned aluminum heat sinks and adjusted fans were placed on the both sides of the TE module to ensure the forced convention heat transfer. At this stage, the heat generated on the hot side of the module was treated as a waste heat and was dissipated to the surrounding environment. The tested TE module during Stage 1 was powered by a PV system containing PV Panel 255 W poly (Amerisolar, Nevada, NV, USA), MPPT solar charge controller Epever Tracer 1206AN (Epever, Beijing, China) and 75 Ah solar battery HAZE 12-65 (Haze Battery Company Ltd, Savage, MN, USA). The fans were powered by laboratory power supply. The scheme of experimental set used in Stage 1 is shown in Figure 1.
At the next two stages of the experiment (Stages 2 and 3), two different types of heat exchangers were adjusted to the applied TE module. On the cold side of module, facing the room interior, the Alpine 11 Plus set was used, while on the hot side of the module the water heat exchanger was installed. The water exchanger consisted of Pacific W1 CPU water block (Thermaltake Technology Co., Ltd., Taipei, Taiwan) attached to the TE module, insulated water tank with a maximum volume of 10 dm3, insulated PVC elastic pipes of 12 × 2 mm and universal New Jet NJ 600 submersible water pump (Newa Tecno Industria SRL, Loreggia, Italy) placed inside the tank. Standard fittings were used to connect all elements of water exchanger. The distilled water was used as cooling liquid during the experiment. At the Stage 2, the TE module, fan and water pump were powered by a laboratory power supply. The scheme of the experimental set tested during Stage 2 is presented in Figure 2. At Stage 3, the TE module was powered by a solar battery through the charge controller. Fan and water pump were powered by a laboratory DC power supply. The scheme of the experimental set tested at Stage 3 is shown in Figure 3.

2.3. Characteristics of the Measurement and Recording Systems

In order to monitor the performance of the applied experimental set, the measuring and recording systems were assembled and calibrated. In all three stages of research, the TE module power supply characteristics were determined using two digital current (amperage) and voltage meters. The temperature was monitored in several points depending on the experiment stage using Pt 500 temperature sensors of measuring accuracy ±0.1 K (see Figure 1, Figure 2 and Figure 3). Recorder AL.154 (APEK, Warszawa, Poland) was used for temperature data reading and archiving.
Additionally, some special devices were used at various stages of research. During Stage 1, a system of solar irradiance measurement was used. This system consisted of PC-connected calibrated recorder MultiLogger M1300 with uncertainty of 0.006 V (Comet, Rožnov pod Radhoštěm, Czech Republic), and calibrated LP-Pyra 02 AV I class pyranometer (DeltaOHM, Padova, Italy) with measurand uncertainty 2.6% and sensitivity 13.53 μv/(W/m2). At Stages 2 and 3, dry-running water meter (1/2") with pulse transmitter connected to the Al.154 recorder was used to determine the volumetric water flow through the water exchanger (dm3/min.).

2.4. Statistical Processing of Data

The statistical analysis included in this study, covered the correlation coefficients and/or correlation matrices determined for the observed values of air temperature inside the experimental room (for all stages of experiment and for Stage 2 vs. Stage 3), water temperature inside the tank (Stage 2 vs. Stage 3) as well as for the TE module power supply (Stage 2 vs. Stage 3). Additionally, to assess the statistical significance of the observed differences between the results of various measurement series the Shapiro-Wilk test of normality was applied to all tested variables. Then, in relation of number of compared groups of variables and the previously determined type of distribution (normal or different than normal) the t-Student, Wilcoxon and Kruskal-Wallis one-way ANOVA with multiply comparisons statistical tests were applied. In some cases the results of Stage 1 were excluded from the performed statistical comparisons due to significantly different power supply characteristics.

2.5. Life Cycle Assessment of TE Cooling and Heating System

The last part of research was intended to calculate the indicators evaluating the environmental impact of energy unit, generated by the examined system powered by a PV panel, battery and compared to the grid supply option. The material and energy balance was completed on the basis of measurements, calculations and producer data. For life cycle modelling and calculation of indicators, SimaPro v 8.1 (PreConsultants, Amersfoort, The Netherlands) with the Ecoinvent database [31] was used. A model of the system’s life cycle included the production of elements of system, predicted servicing, energy performance and final disposal. Considered scenarios in the LCA included:
  • Scenario I: 10 years of system operation, 3 working hours each day, direct PV supply
  • Scenario II: 10 years of system operation, 3 working hours each day, 50% solar battery discharge, 50% direct PV supply
  • Scenario III: 10 years of system operation, 3 working hours each day, electrical grid supply
  • Scenario IV: 10 years of system operation, 4 working hours each day, direct PV supply
  • Scenario V: 10 years of system operation, 4 working hours each day, 50% solar battery discharge, 50% direct PV supply
  • Scenario VI: 10 years of system operation, 4 working hours each day, electrical grid supply
The functional unit was adopted as 1 Wh of energy generated by the TE module for cooling and heating purposes. The processes of packaging and transportation were excluded since the examined system was a laboratory prototype. For life cycle impact assessment, the IPCC global warming potential in 100 years perspective was used to estimate the total greenhouse gas emission measured as equivalent of carbon dioxide mass unit [32].

3. Results

In the following section, the power supply characteristics and temperature performances of the executed tests are presented. At each stage of experiment, the measurements were repeated in three series; however, due to the changing power supply parameters at Stage I (in-situ measurements), the results in Section 3.1 are presented for each series separately; for the Section 3.2 and Section 3.3, the presented graphs included mean values. The statistical processing of data allowed to indicate the significance of the obtained results.

3.1. Stage 1: TE Cooling System with Heat Dissipation Powered by PV

3.1.1. Power Supply Data

The solar irradiance on the panel plane (perpendicular, W/m2) and PV system output recorded during the Stage I included series I, II and III, with various solar irradiance intensity (Figure 4a,c,e) while the external air temperature equaled 22 °C.
According to the presented results of measurements, the efficiency of the PV panel was quite low, so that the supply parameters were not constantly enough for the TE module supply, depending on the actual solar irradiance. In the first and second series (Figure 4a,c), the output power covered TE module consumption and was used to charge the solar battery, except for temporary cloudiness causing a decrease in power after 24 min of Series II.
In the last series, the solar battery discharge mode was accidentally used, while the TE load exceeded PV panel output (Figure 4e). However, with the use of MPPT tracker, the designed system was able to supply TE module within the significant loss in the operating parameters.
The average power supplied to TE module, differed between Series I, Series II and Series III and equaled 69.4 W, 65.9 W and 60.3 W, according to the current and voltage meters.

3.1.2. Temperature Performance

According to the assumptions, the cooling effect at Stage I was achieved when a temperature of 16 °C was obtained in experimental room. The time of system operation to this point differs between Series I, II and III and equals 34 min for Series I and II, and 23 min for Series III. Better cooling performance in the last series was connected with the fact, that supply current and voltage in this series were lower as a result of the changing solar irradiance. This resulted in a lower Joule’s effect and TE module hot side temperature.
Comparing the temperature values at hot side of TE module for Series I, II and III (Figure 4b,d,f), it can be noticed that the decreasing power supply parameters caused an evident drop in TE module hot side temperature in the middle of Series II and during the Series III, which resulted in the mentioned better cooling performance at the last series.
The average COP for the cooling effect in Stage 1 was calculated as 0.055. More detailed results achieved for all conducted measuring series at Stage 1 are presented in Table 3.

3.2. Stage 2: TE Cooling System with Heat Recovery Powered by PV

In the second stage of investigation, the TE cooling system with heat recovery was tested, within the power supply parameters corresponding to the PV powering with low solar irradiance parameters (see Figure 2) obtained by the application of a laboratory AC/DC power supply. More characteristics of temperature performance for average DC parameters from Stage 1 can be found in the previously published materials including preliminary tests of the system [10,30].

3.2.1. Power Supply Data

During the experiments, the TE module current parameters, i.e. amperage and voltage, were monitored. These parameters were used to determine the values of power applied to the TE module (Figure 5a). It was noted, that during the conducted measuring series, the values of applied current were increasing.

3.2.2. Temperature Performance

The measurements conducted at all series in Stage 2 lasted until the water temperature inside the tank equaled 40 °C which was achieved after 136 min of experiment, considering the mean results. After that time, the air inside the experimental room was cooled by 14.7 °C. The minimum temperature values noted during the experiment at the heat sink, installed on the cold side of TE module, equaled –3.8 °C. The results of the experiment are presented in Figure 5b.
On the basis of the obtained results and conducted measurements, the amount of energy used to power the applied system, as well as energy gained from the system were estimated. The energy required to power experimental set, i.e. TE module, fan and water pump, was equal to 160 Wh. The energy gained form the applied thermoelectric system, covering the energy needed for experimental room cooling and water heating, including also heat losses, was estimated to 207.7 Wh. On the basis of the obtained results, COP of the system can be calculated at the level of 1.3.

3.3. Stage 3: TE Cooling System with Heat Recovery Powered by Solar Battery

3.3.1. Power Supply Data

During the experiments, the TE module current parameters, i.e. amperage and voltage, were monitored. These parameters were used to determine the values of power applied to the TE module (Figure 6a). It was noted that during the conducted measuring series at Stage 3, the values of applied current were decreasing, which was connected with battery discharging.
The experiment conducted within Stage 3 included the power supply of the TE module from the previously charged solar battery. During the measurements, the power delivered to TE module was decreasing. The results obtained during three measurement series were repeated; therefore, the average values of measured variables are shown in Figure 6a.

3.3.2. Temperature Performance

At this stage of experiment, the 40 °C of water temperature was archived after 118 min regarding to the mean results. The duration of Stages 2 and 3 was similar; however, water was heated quicker during the experiment performed at Stage 3 (the time duration was 18 min shorter comparing to the Stage 2). The temperature of air inside the experimental room was reduced by 15.1 °C. The minimal temperature value noted on the heat sink attached to the cold side of TE module was equal to –3.6 °C. All mean values of temperature at fixed points of the experimental set are presented in Figure 6b.
The energy required to power the cooling system, tested at Stage 3, required to power the TE module, fan and water pump, was estimated at 160.6 Wh. The energy gained from the system for air cooling and water heating was equal to 200.4 Wh (heat losses were included in calculation). Therefore, COP of the system tested at Stage 3 was at the level of 1.25.

3.4. Statistical Processing of Data

3.4.1. Air Temperature inside the Experimental Room

The detailed measured values of initial and final air temperature as well as mean and median values determined for all stages were presented in Table 4. The obtained coefficient of correlation for the air temperature values inside the experimental room at Stages 2 and 3 could be determined as strong (R = 0.990) but the noted differences in mean values, equal approx. 6%, according to the results of Wilcoxon test were statistically significant. Thus, the manner of power supply, different during Stages 2 and 3, affected the observed mean values of air temperature.
The additionally determined correlation matrix for values of air temperature at all stages of experiment (Stages 1–3) during the initial 35 min of experiment showed strong positive correlations among all tested variables (Table 5). However, the applied nonparametric Kruskal-Wallis one-way ANOVA supported by multiply comparisons showed that for p > 0.05, the distribution of air temperature determined at Stage 1 statistically significantly differed from the values observed during the remaining stages.
The observed significant inequality in air temperature measurements resulted from different heat exchangers used during experiments. When the heat transfer on the hot side of TE module is not efficient, what could be observed at Stage 1, the excess heat is conducted to the cold side of the module disturbing its cooling capacity. The application of water exchanger on the hot side of the TE module (Stage 2 and 3) improved the cooling efficiency of the tested system.

3.4.2. Water Temperature inside the Tank

The initial values of water temperature as well as the determined mean and median values were presented in Table 4. The determined coefficient of correlation for values of water temperature inside the tank for Stages 2 and 3 showed a high value of R = 0.999, thus the observed correlation was strong, so the time-related progress of temperature changes, despite the different values, was similar. The observed means of water temperature values measured in the water tank for these stages presented in Table 4 showed the higher value, by 1.5%, for measurements at Stage 3. The results of the applied nonparametric Wilcoxon test for two dependent variables showed statistically significant differences between observed medians of water temperature, thus it may be stated that the manner of power supply affected the values of the cooling liquid temperature.

3.4.3. Power Supply Data

The momentary power values required to supply the TE module at all stages are presented in Figure 4a,c,e, Figure 5a and Figure 6a.
The more detailed information about initial and final momentary power (for 10 min periods) supplied to the TE module as well as determined means and standard deviations are presented in Table 6. The calculated coefficient of correlation for TE module power supply during Stages 1 and 2 shows a significant strong negative correlation between the tested variables (R = –0.996). Applied t-Student test for two dependent variables of normal distribution, after testing the normality by Shapiro-Wilk procedure, showed that mean values of the observed TE module power supply for these two stages of experiment are significantly statistically different.

3.5. Life Cycle Assessment

The results of the life cycle impact assessment, presented in Table 7 and Table 8, are based on the material and energy balance described in Appendix A, Table A1, Table A2, Table A3 and Table A4. The final results of global warming potential in 100 years perspective, calculated for six scenarios of the TE cooling system operation are presented in Table 7. This dataset represents Stage 1 of the previously described experiment. The details on Scenarios I – VI are described in Section 2. Materials and Methods, as well as in Appendix A, Table A3.
It is worth mentioning that including the option of PV supply, it is possible to obtain significantly lower impact indicator, with possible difference exceeding 37% for Scenarios I – III and 50% for Scenarios IV – VI. The lowest GWP indicator can be noticed for Scenario IV, while the highest for Scenario III, which is connected with the positive influence of renewable energy and longer system usage on environmental burdens.
Considering the shares of particular life cycle stages (production, operation and final disposal, Figure 7), it is necessary to underline that the operation for Scenarios III and VI (grid supply) is connected with the use of electricity (Eurepean Union mix for 27 member states), while in Scenarios I, II, IV and VI it contains the processes of servicing (partial replacement of system elements, with faster wear of batteries in Scenarios II and V).
The final results of global warming potential in 100 year perspective, calculated for six scenarios of the TE cooling system operation with heat recovery, are presented in Table 8. This dataset represents Stage 2 (Scenario II and V) and Stage 3 (Scenarios I, III, IV and VI) of previously described experiment. As with the previous case, including the option of PV supply, it is possible to obtain a significantly lower impact indicator, with possible reduction exceeding 41% for Scenarios I – III and 54% for Scenarios IV – VI. The lowest GWP indicator can be observed for Scenario IV, while the highest for Scenario III, which is connected with the same aspects as analyzed previously for the system used in Stage 1.
Considering the shares of particular life cycle stages (production, operation and final disposal, Figure 8), the trends similar to previously described for TE cooling system without heat recovery can be observed. An important difference is the higher efficiency obtained at Stage 2 and Stage 3, which resulted in visibly lower impact of the production stage on the final values of the calculated indicator in the analyzed case. Higher values of the energy generated by the TE cooling system with heat recovery allowed to decrease the calculated impact indicators even by the factor of 30.
The highest reductions were connected with TEC system supplied by the PV panel or the solar battery (20–22%) since in this case (Table 9), operation stage included only the partial replacement of system components and the production was the most significant stage for results. The system of TEC supplied from the electrical grid was characterized by the highest share of the operation stage which included mostly the electricity consumption, therefore this option was less sensitive for possible prolongation of lifetime.

4. Discussion

Due to the conducted tests, the examined TE cooling system can be successfully supplied by photovoltaic energy. As presented in Figure 4, the power supplied to the TE module depends to a certain extent on solar irradiance. For solar irradiance below approximately 280 W/m2, the TE module was supported by a solar battery. For higher solar irradiance, the PV panel supplied the TE module and solar battery simultaneously. The PV supply system performance was optimized by MPPT solar charge controller; therefore, the dependences between solar irradiance and PV output are not direct. The implementation of a MPPT controller allowed to supply the TE module with the mean power ranging from 60.3 W to 69.4 W, without the loss of its cooling performance.
The tests executed under laboratory conditions (Stage 2 and 3) allowed characterizing the alternative supply systems. Although the mean power between the Stage 1 and 2 are significantly statistically different, with the actual current of approximately 5.65 A common for all the performed series, Stage 2 of the research can be treated as preliminary power supply characteristic for low solar irradiance conditions, with supply power comparable to Series III in Stage 1. The difference in mean power between the stages of the experiment results from various characteristics of supply systems, as presented in Figure 4, Figure 5 and Figure 6. However, the statistical tests show strong correlations between the temperature performance of the examined TE cooling system with heat recovery in Stages 2 and 3. Moreover, for the values of air temperature during the initial 35 min of experiment, strong positive correlations among all tested variables (Table 5) can be noticed for all tested stages. Therefore, the presented experiment can be treated as an estimation of the power supply characteristic for several cases of the PV system performance (high solar irradiance, low solar irradiance, solar battery discharge with no PV system supply).
The cooling efficiency of the tested system was estimated by the use of temperature measurement system and additional calculation of the heat lost by thermal conductivity. The temperatures in water tank, despite the differences caused by supply parameters, were characterized by similar progress, and the observed correlation was strong. According to the calculated power output, the energy gained at the hot side of the TE module during Stage 2 and Stage 3 of the experiment exceeded the energy generated for cooling purposes, so that the estimated COP values are strongly dependent on the heat recovery option. The cooling power of the TE module was affected by its supply parameters, and observations made during the Stage 1 of experiment enabled to state that within lower supply power (Series III), the time necessary to obtain certain cooling effect was significantly shorter than in other cases. Moreover, the comparison of temperatures in the experimental room after 34 min of investigation between Stage 1, 2 and 3 shows that the heat recovery option increases the cooling performance of the tested system since the temperature drop was even 13 °C higher in this case, and the temperatures close to 16 °C in Stage 1 versus 3 °C at Stage 2 and 3 were observed.
The calculated COP values for the thermoelectric cooling systems in the literature studies vary depending on the system parameters, like the type of heat sink, system dimensioning, module sizing, etc. The selected examples of COP are listed in Table 10. The differences result from the fact that the use of water heat exchanger on the hot side of the Peltier module contributes to the rise of heat transfer efficiency, as well as from the various supply parameters and the TE module sizes. According to the previous studies [11,26] there is a possibility to obtain higher values of COP by keeping the lower temperature difference between the cold and hot side of TE module.
According to the results presented in Section 3, the temperature performance of the TE cooling system strongly depends on the kind of heat exchangers. The highest values of COP were obtained at Stage 2 and 3, as presented in Table 10, which is connected with the application of water exchanger enabling heat recovery of energy gained at the hot side of the TE module. Comparing the obtained results to the literature values of COP for TE coolers with various heat recovery options, it is necessary to underline that the final values of water temperature in the current study (40 °C) were higher, which decreased the cooling efficiency of the tested system. The highest COP values presented in literature were obtained for the low temperature difference between cold and hot sides of the TE module, while the measured temperature in water tank was up to 20 °C, which does not correspond to the practical aim of domestic water heating.
The life cycle assessment method applied to the predicted usage of the examined system brings a novel contribution to the knowledge on its environmental effects. The LCA results show that the kind of supply energy plays an important role in the modeling of a system life cycle. Another important issue is the length of the operation phase affecting the total energy gain of system. However, the issue of the highest contribution to the final result was the kind of heat exchange process: within the use of water heat exchanger and heat recovery, it was possible to diminish the calculated GWP indicator even for 30 times.
Specific comparisons between studies on LCA are difficult due to the lack of comprehensive analysis covering TEC, as well as various functional units and scopes of the studies on other space cooling or water heating systems, since authors use mostly the whole system lifetime as functional unit. However, some studies on solar hot water systems enable recalculation of the results to the functional unit used in this paper. While compared to the solar hot water systems characterized by GWP equal to 0.47 gCO2eq/Wh (solar collectors combined with electric heater) [37] and 0.13 gCO2eq/Wh (solar collectors combined with gas boiler) [38], the developed solution of TEC with heat recovery powered by the PV system seems to be the competitive alternative, in particular while considering its dual function and the possible impact reduction in the large scale system assessment.
It is worth to underline that the material and energy balance used in this study was based on the prototype of a TE cooling system built under laboratory conditions and all supply power units were assumed as used only for the needs of the mentioned system, which resulted in a possible overbalancing of the PV supply option. With the utilization of the PV energy from a larger installation, it would be possible to obtain better environmental impact indicators since some of elements, like charge controller, would be used for several purposes.

5. Conclusions

The presented study considered various supply options of the TE cooling system with heat recovery possibility, discussing basic operation parameters, temperature performance, cooling and heating effect, COP calculation and Life Cycle Assessment focused on the greenhouse gas emissions. On the basis of the performed experiment and subsequent analysis, the following conclusions were drawn:
1)
The TE modules can be successfully used for the cooling and heating purposes, with the possibility using the supply energy generated by photovoltaic modules.
2)
The utilization of a PV panel, charge controller and solar battery allows keeping the supply parameters at the level required for a constant operation of the TE modules without the significant decrease in the temperature characteristics.
3)
The range of supply parameter change, tested for various solar irradiance, did not affect the main functions of the tested system.
4)
Within the lower supply parameters, the cooling effect of the tested system increased, while the rise of supply power caused higher temperature values at hot side of the module and increased the heating effect.
5)
The COP values calculated for the tested modifications of system range from 0.055 to 1.3, which is mostly related to the change of the TE module hot side cooling; within the use of water heat exchanger, it is possible to obtain a significantly improved performance.
6)
The greenhouse gas emission measured by GWP 100a indicator ranged from 0.234 to 15.277 gCO2eq/Wh, depending on the analyzed system modification, electricity source and life cycle scenario. The lowest value of the impact indicator is connected with the scenario of TE cooling system with heat recovery supplied by the direct PV panel operation.
In general, the application of the presented thermoelectric cooling system enabled to decrease the air temperature in the experimental room by 5.3 °C up to 15.1 °C, depending on the research stage, while better cooling performance was connected with the use of heat recovery for water heating. According to the previous studies, there is a possibility to obtain higher COP values by keeping the temperature difference between the cold and hot side of TE module as low as possible. Therefore, it is possible to develop the preliminary water heating system on the basis of the presented prototype, and the trials on the COP optimization while keeping the functionality of TE cooling and heating system will be authors’ future research direction.

Author Contributions

Conceptualization, A.Ż. and J.G.; Investigation, A.Ż. and J.G.; Validation, J.G.; Writing – original draft, A.Ż. and J.G. All authors have read and agreed to the published version of the manuscript.

Funding

This research work was supported by Polish National Science Center under the project UMO-2015/17/N/ST8/02824.

Acknowledgments

Authors would like to acknowledge members of Laboratory of Department of Renewable Energy Sources Engineering, Lublin University of Technology, for the technical support and used resources.

Conflicts of Interest

The authors declare no conflict of interest.

Appendix A

Life cycle assessment of the analyzed energy system aimed at the evaluation of possible environmental burdens related to its production, 10 years operation and final disposal by the use of global warming potential calculated in 100 years perspective and included material and energy balance based on the data in Table A1 and Table A2. In Table A3 and Table A4, additional assumptions necessary for Scenarios I – VI differentiation are included.
The scope of material balance for TE cooling system applied in Stage 1 covered TE module and heat exchangers (all the necessary equipment needed for its production, lines 1–5, Table A1), as well as the energy source (lines 7–9 for PV option, line 10 for grid option). According to the assumptions, for Scenarios 1–2 and 4–5 the following processed were used:
1)
Production, including processed characterized in lines 1–9 in Table A1
2)
Operation, including line 11
3)
Final disposal, including line 12
The assumption on the working time each day (3 and 4 h) was based on preliminary experiments [11,30] testing higher temperature range. The mode of system operation was considered as a single cycle, while water was heated to the useful temperature. The authors assumed that the control devices (thermostats) could turn the system on and off twice an hour (intermittent operation in a higher starting temperature range during everyday use).
Scenario 3 and 6 included the option of AC/DC power supply, so that production stage in this scenario included lines 1–5 and 10 (Table A1), while the other life cycle stages were similar with above described, except of additional energy required for operation (line 13).
Table A1. Simplified assembly used for assessment of TE cooling system with two supply options (Scenarios 1–3), based on authors’ measurements, calculations, producer data and related processes adopted from [31].
NoAssemblyMaterials/Processes IncludedAmountUnitLifespan, Years
1TE module Ceramic tile 19 g, Copper 1,5 g, Tellurium, semiconductor-grade 10 g, Brazing solder 0,5 g, Metal working 1,5 g31g5
2Aluminum heat exchanger, doubleAluminum alloy, Aluminum casting900g10
3Fan, doubleFan, for power supply176g5
4CablesCable, unspecified400g5
5Thermal greaseSolder paste2g5
6PV panelPhotovoltaic panel, multi-Si wafer1.63m230
7Solar batteryBattery, Li-ion, rechargeable13kg15
8Control equipment (tracker)Controller, charger0.95kg15
9PV cableCable, three-conductor12m15
10Power supply unitPower supply unit, transformer3kg15
11Service (10 years perspective)TE module and supplementary devices replacement---
12Final disposalMechanical treatment of waste electric and electronic equipment1kg-
13Electricity (grid)Electricity mix, AC, consumption mix, at consumer, <1 kV EU-271Wh-
The scope of material balance for TE cooling system with heat recovery applied in Stage 2 and 3 covered TE module and heat exchangers (lines 1–9, Table A2), as well as the energy source (lines 10-13 for PV option, line 14 for grid option).
According to the assumptions, for Scenarios 1–2 and 4–5, the following processed were used:
1)
Production, including processed characterized in lines 1–13 in Table A1
2)
Operation, including line 15
3)
Final disposal, including line 16
Scenario 6 included the option of AC/DC power supply, therefore production stage in this scenario included lines 1–9 and 14 (Table A2), and operation included additional line 17.
Table A2. Simplified assembly used for assessment of TE cooling system with heat recovery and two supply options (Scenarios 4-6), based on authors’ measurements, calculations, producer data and related processes adopted from [31].
NoAssemblyMaterials/Processes IncludedAmountUnitLifespan, Years
1TE module Ceramic tile 19 g, Copper 1,5 g, Tellurium, semiconductor-grade 10 g, Brazing solder 0,5 g, Metal working 1,5 g31g5
2Aluminum heat exchanger, singleAluminum alloy, Aluminum casting450g5
3Fan, singleFan, for power supply88g5
4CablesCable, unspecified400g5
5Thermal greaseSolder paste2g5
6Water heat exchanger connectionsPolyethylene pipe, corrugated0.5m10
7Water heat exchangerCopper, copper working345g10
8PumpPump for water, 9 W1p10
9Pipes insulationTube insulation, Synthetic rubber0.5kg10
10PV panelPhotovoltaic panel, multi-Si wafer1.63m230
11Solar batteryBattery, Li-ion, rechargeable13kg15
12Control equipment (tracker)Charger0.95kg15
13PV cableCable, three-conductor12m30
14Power supply unitPower supply unit, transformer3kg15
15Service (10 years perspective)TE module and supplementary devices exchange ---
16Final disposalMechanical treatment of waste electric and electronic equipment1kg-
17Electricity (grid)Electricity mix, AC, consumption mix, at consumer, <1 kV EU-271Wh-
Additional assumptions for LCA of TE cooling system applied in Stage 1 are presented in Table A3. This dataset includes details of differentiation between scenarios assessed, as well as total calculated greenhouse gas emission measured by GWP during the life cycle of system.
Table A3. Assumptions for LCA and GWP (total) of TE cooling system applied in Stage 1.
ScenarioProcesses IncludedGWP (kgCO2eq)Comment
IProduction (Table A1)
Service: TE module and fans replacement Final disposal: total for TE module and partial for elements with longer lifespan
Energy balance according Stage 1: Series I and II
397.4PV supply system included for 10 of 30 years of usage
IIProduction (Table A1)
Service: TE module and fans replacement Final disposal: total for TE module and partial for elements with longer lifespan
Energy balance according Stage 1: Series III
420.2PV supply system included for 10 of 30 years of usage, battery life 30% shorter
IIIProduction (Table A1)
Service: TE module and fans replacement
Final disposal: total for TE module and partial for elements with longer lifespan
Energy balance according Stage 1: Series I and II
646.8Power supply from EU-27 low voltage grid
IVProduction (Table A1)
Service: TE module and fans replacement Final disposal: total for TE module and partial for elements with longer lifespan
Energy balance according Stage 1: Series I and II
397.4PV supply system included for 10 of 30 years of usage
VProduction (Table A1)
Service: TE module and fans replacement Final disposal: total for TE module and partial for elements with longer lifespan
Energy balance according Stage 1: Series III
420.2PV supply system included for 10 of 30 years of usage, battery life 30% shorter
VIProduction (Table A1)
Service: TE module and fans replacement
Final disposal: total for TE module and partial for elements with longer lifespan
Energy balance according Stage 1: Series I and II
806.0Power supply from EU-27 low voltage grid
Accordingly, the main assumptions for LCA of TE cooling system with heat recovery applied in Stage 2 and 3 are presented in Table A4. This dataset comprises information of distinction between assessed scenarios, along with total calculated global warming potential indicator during the life cycle of system.
Table A4. Assumptions for LCA and GWP (total) of TE cooling system with heat recovery applied in Stage 2 and 3.
ScenarioProcesses IncludedGWP
(kgCO2eq)
Comment
IProduction (Table A2)
Service: TE module and fan replacement Final disposal: total for TE module and partial for elements with longer lifespan Energy balance according Stage 3
297.4PV supply system included for 10 of 30 years of usage
IIProduction (Table A2)
Service: TE module and fan replacement final disposal total for TE module and partial for elements with longer lifespan Energy balance according Stage 2
320.2PV supply system included for 10 of 30 years of usage, battery life 30% shorter
IIIProduction (Table A2)
Service: TE module and fan replacement Final disposal total for TE module and partial for elements with longer lifespan, Energy balance according Stage 3
522.9Power supply from EU-27 low voltage grid
IVProduction (Table A2)
Service: TE module and fan replacement Final disposal: total for TE module and partial for elements with longer lifespan Energy balance according Stage 3
297.4PV supply system included for 10 of 30 years of usage
VProduction (Table A2)
Service: TE module and fan replacement final disposal total for TE module and partial for elements with longer lifespan Energy balance according Stage 2
320.2PV supply system included for 10 of 30 years of usage, battery life 30% shorter
VIProduction (Table A2)
Service: TE module and fan replacement Final disposal total for TE module and partial for elements with longer lifespan, Energy balance according Stage 3
674.1Power supply from EU-27 low voltage grid

References

  1. Asdrubali, F.; Baldinelli, G.; D’Alessandro, F.; Scrucca, F. Life cycle assessment of electricity production from renewable energies: Review and results harmonization. Renew. Sust. Energy Rev. 2015, 42, 1113–1122. [Google Scholar] [CrossRef]
  2. Żelazna, A.; Zdyb, A.; Pawłowski, A. The influence of selected factors on PV systems environmental indicators. Ann. Environ. Protect. 2016, 18, 722–732. [Google Scholar]
  3. Van Ruijven, B.J.; De Cian, E.; Sue Wing, I. Amplification of future energy demand growth due to climate change. Nat. Commun. 2019, 10, 1–12. [Google Scholar] [CrossRef] [PubMed] [Green Version]
  4. Jackson, R.B.; Le Quéré, C.; Andrew, R.M.; Canadell, J.G.; Korsbakken, J.I.; Liu, Z.; Peters, G.P.; Zheng, B. Global energy growth is outpacing decarbonization. Environ. Res. Lett. 2018, 13, 120401. [Google Scholar] [CrossRef]
  5. Owoyele, O.; Ferguson, S.; O’Connor, B.T. Performance analysis of a thermoelectric cooler with a corrugated architecture. Appl. Energy 2015, 147, 184–191. [Google Scholar] [CrossRef]
  6. Gou, X.L.; Ping, H.F.; Ou, Q.; Xiao, H.; Qing, S.W. A novel thermoelectric generation system with thermal switch. Energy Procedia 2014, 61, 1713–1717. [Google Scholar] [CrossRef] [Green Version]
  7. He, W.; Zhang, G.; Zhang, X.X.; Ji, J.; Li, G.Q.; Zhao, X.D. Recent development and application of thermoelectric generator and cooler. Appl. Energy 2015, 143, 1–25. [Google Scholar] [CrossRef]
  8. Zheng, X.F.; Liu, C.X.; Yan, Y.Y.; Wang, Q. A review of thermoelectrics research—Recent developments and potentials for sustainable and renewable energy applications. Renew. Sustain. Energy Rev. 2014, 32, 486–503. [Google Scholar] [CrossRef]
  9. Gao, Y.W.; Lv, H.; Wang, X.D.; Yan, W.M. Enhanced Peltier cooling of two-stage thermoelectric cooler via pulse currents. Int. J. Heat Mass Transf. 2017, 114, 656–663. [Google Scholar] [CrossRef]
  10. Teffah, K.; Zhang, Y.; Mou, X.L. Modeling and experimentation of new thermoelectric cooler–thermoelectric generator module. Energies 2018, 11, 576. [Google Scholar] [CrossRef] [Green Version]
  11. Żelazna, A.; Gołębiowska, J. Life Cycle Assessment of Cooling and Heating System Based on Peltier Module. IOP Conf. Ser. Earth Environ. Sci. 2019, 290, 012067. [Google Scholar] [CrossRef]
  12. Zhao, D.; Tan, G. A review of thermoelectric cooling: Materials, modeling and applications. App. Therm. Eng. 2014, 66, 15–24. [Google Scholar] [CrossRef]
  13. Meng, J.H.; Wang, X.D.; Zhang, X.X. Transient modeling and dynamic characteristics of thermoelectric cooler. Appl. Energy 2013, 108, 340–348. [Google Scholar] [CrossRef]
  14. Yazawa, K.; Shakouri, A. Optimization of power and efficiency of thermoelectric devices with asymmetric thermal contacts. J. Appl. Phys. 2012, 111, 024509. [Google Scholar] [CrossRef] [Green Version]
  15. Sahin, A.Z.; Yilbas, B.S. The thermoelement as thermoelectric power generator: Effect of leg geometry on the efficiency and power generation. Energy Convers. Manag. 2013, 65, 26–32. [Google Scholar] [CrossRef]
  16. Lee, H. Optimal design of thermoelectric devices with dimensional analysis. Appl. Energy 2013, 106, 79–88. [Google Scholar] [CrossRef]
  17. Yilbas, B.S.; Sahin, A.Z. Thermoelectric device and optimum external load parameter and slenderness ratio. Energy 2010, 35, 5380–5384. [Google Scholar] [CrossRef]
  18. Wang, C.C.; Hung, C.I.; Chen, W.H. Design of heat sink for improving the performance of thermoelectric generator using two-stage optimization. Energy 2012, 39, 236–245. [Google Scholar] [CrossRef]
  19. Twaha, S.; Zhu, J.; Yan, Y.; Li, B. A comprehensive review of thermoelectric technology: Materials, applications, modelling and performance improvement. Renew. Sustain. Energy Rev. 2016, 65, 698–726. [Google Scholar] [CrossRef]
  20. Naphon, P.; Wiriyasart, S. Liquid cooling in the mini-rectangular fin heat sink with and without thermoelectric for CPU. Int. Commun. Heat Mass Transf. 2009, 36, 166–171. [Google Scholar] [CrossRef]
  21. Gao, X.; Chen, M.; Snyder, G.J.; Andreasen, S.J.; Kær, S.K. Thermal management optimization of a thermoelectric-integrated methanol evaporator using a compact CFD modeling approach. J. Electron. Mater. 2013, 42, 2035–2042. [Google Scholar] [CrossRef]
  22. Vian, J.G.; Astrain, D. Development of a heat exchanger for the cold side of a thermoelectric module. Appl. Therm. Eng. 2008, 28, 1514–1521. [Google Scholar] [CrossRef]
  23. Taylor, R.A.; Solbrekken, G.L. Comprehensive system-level optimization of thermoelectric devices for electronic cooling applications. IEEE Trans. Compon. Packag. Technol. 2008, 31, 23–31. [Google Scholar] [CrossRef]
  24. David, B.; Ramousse, J.; Luo, L. Optimization of thermoelectric heat pumps by operating condition management and heat exchanger design. Energy Convers. Manag. 2012, 60, 125–133. [Google Scholar] [CrossRef]
  25. Cosnier, M.; Fraisse, G.; Luo, L. An experimental and numerical study of a thermoelectric air-cooling and air-heating system. Int. J. Refrig. 2008, 31, 1051–1062. [Google Scholar] [CrossRef]
  26. Liu, Z.B.; Zhang, L.; Gong, G.C.; Luo, Y.Q.; Meng, F.F. Experimental study and performance analysis of a solar thermoelectric air conditioner with hot water supply. Energy Build. 2015, 86, 619–625. [Google Scholar] [CrossRef]
  27. Ma, X.; Zhao, H.; Zhao, X.; Li, G.; Shittu, S. Building Integrated Thermoelectric Air Conditioners—A Potentially Fully Environmentally Friendly Solution in Building Services. Future Cities Environ. 2019, 5, 1–13. [Google Scholar] [CrossRef]
  28. Cheng, T.C.; Cheng, C.H.; Huang, Z.Z.; Liao, G.C. Development of an energy-saving module via combination of solar cells and thermoelectric coolers for green building applications. Energy 2011, 36, 133–140. [Google Scholar] [CrossRef]
  29. Liu, Z.; Zhang, L.; Gong, G.; Han, T. Experimental evaluation of an active solar thermoelectric radiant wall system. Energy Convers. Manag. 2015, 94, 253–260. [Google Scholar] [CrossRef]
  30. Gołębiowska, J.; Żelazna, A. Experimental investigation of thermoelectric cooling system with heat recovery. EDP Sci. E3S Web Conf. 2019, 100, 00020. [Google Scholar] [CrossRef] [Green Version]
  31. Ecoinvent. Available online: www.ecoinvent.org (accessed on 10 February 2020).
  32. Greenhouse Gas Protocol. Available online: www.https://ghgprotocol.org (accessed on 10 February 2020).
  33. Abdul-Wahab, S.A.; Elkamel, A.; Al-Damkhi, A.M.; Is’haq, A.; Al-Rubai’ey, H.S.; Al-Battashi, A.K.; Al-Tamimi, A.R.; Al-Mamari, K.H.; Chutani, M.U. Design and experimental investigation of portable solar thermoelectric refrigerator. Renew. Energy 2009, 34, 30–34. [Google Scholar] [CrossRef]
  34. Astrain, D.; Via, J.G.; Albizua, J. Study and optimization of the heat dissipater of a thermoelectric refrigerator. Appl. Therm. Eng. 2005, 25, 3149–3162. [Google Scholar] [CrossRef]
  35. Hermes, C.J.L.; Barbosa, J.R. Thermodynamic comparison of Peltier, Stirling, and vapor compression portable coolers. Appl. Energy 2012, 91, 51–58. [Google Scholar] [CrossRef]
  36. Min, G.; Rowe, D.M. Experimental evaluation of prototype thermoelectric domestic-refrigerators. Appl. Energy 2006, 83, 133–152. [Google Scholar] [CrossRef]
  37. Moore, A.D.; Urmee, T.; Bahri, P.A.; Rezvani, S.; Baverstock, G.F. Life cycle assessment of domestic hot water systems in Australia. Renew. Energy 2017, 103, 187–196. [Google Scholar] [CrossRef]
  38. Żelazna, A. The Influence of Collector Type on Emission Indicators in Solar Systems Life Cycle Assessment. Ann. Environ. Protect. 2013, 15, 258–271. [Google Scholar]
Figure 1. The scheme of the TE module power supply and measurement and recording system in the first stage of experiment including a solar system power supply (PV panel, charge controller and solar battery).
Energies 13 01701 g001
Figure 2. The scheme of the TE module power supply and measurement and recording system at the second stage of experiment including a network AC/DC power supply.
Energies 13 01701 g002
Figure 3. The scheme of the TE module power supply and measurement and recording system at the third stage of experiment where the TE module was powered from a solar battery.
Energies 13 01701 g003
Figure 4. Operation parameters during Stage 1: (a) power in Series I; (b) temperatures in Series I; (c) power in Series II; (d) temperatures in Series II; (e) power in Series III; (f) temperatures in Series III.
Energies 13 01701 g004
Figure 5. The results obtained during the measurements conducted at Stage 2: (a) mean power supplied to the TE module; (b) mean temperature values measured at fix points of the experimental set.
Energies 13 01701 g005
Figure 6. The results obtained during the measurements conducted at Stage 3: (a) mean power supplied to the TE module; (b) mean temperature values measured at fix points of the experimental set.
Energies 13 01701 g006
Figure 7. GWP results for TE cooling system including life cycle stages, gCO2eq/Wh.
Energies 13 01701 g007
Figure 8. GWP results for TE cooling system with heat recovery including life cycle stages, gCO2eq/Wh.
Energies 13 01701 g008
Table 1. The characteristic of selected thermoelectric materials adapted from [12,19].
TE MaterialOperation Temperature
(K)
Max. ZT Value
Bi2Te3<1500.8–1.0
PbTe150–5000.7–0.8
TeAgGeSb (TAGS)1.2
CoSb3500–7000.8
CeFe4Sb121.1
SiGe700–10000.6–1.3
LaTe0.4
Table 2. Applied TE module technical characteristics.
Characteristic ParameterValue
Nominal voltage15.5 V
Max. amperage8.5 A
Max. thermal output72 W
Max. temperature difference between the hot and cold sides71 K
Dimensions (length × width × height)40 mm × 40 mm × 3.4 mm
Table 3. Basic operation parameters and COP calculated for Stage 1.
Series NumberSupply Power
(W)
Energy Used
(Wh)
Energy Generated
(Wh)
COP
-
Series I69.442.72.30.054
Series II65.940.72.10.051
Series III60.326.11.50.059
Table 4. Temperature values determined inside the experimental room for all stages of experiment.
Stage NumberAir Temperature
(°C)
Water Temperature
(°C)
InitialFinalMeanMedianInitialFinalMeanMedian
Stage 123.016.018.217.8- 1- 1- 1- 1
Stage 219.95.24.73.610.540.326.427.0
Stage 320.75.65.03.910.439.826.827.6
1 Heat recovery via water exchanger not included.
Table 5. Correlation matrices determined for air temperature values in all stages (Stages 1–3) during the initial 35 min of experiment.
T. stage 1T. stage 2T. stage 3
T. stage 1-0.9910.991
T. stage 20.991-0.997
T. stage 30.9910.997-
Table 6. TE power supply values determined for all stages of experiment.
Stage NumberMomentary Power (W)
InitialFinalMeanStandard deviation
Stage 172.262.865.32.0
Stage 251.065.858.74.4
Stage 378.762.368.75.0
Table 7. GWP results for TE cooling system, gCO2eq/Wh.
Global Warming Potential (gCO2eq/Wh)
Scenario IScenario IIScenario IIIScenario IVScenario VScenario VI
9.3869.51415.2777.0397.13614.278
Table 8. GWP results for TE cooling system with heat recovery, gCO2eq/Wh.
Global Warming Potential (gCO2eq/Wh)
Scenario IScenario IIScenario IIIScenario IVScenario VScenario VI
0.3120.3240.5480.2340.2430.530
Table 9. GWP results reduction by prolongation of expected lifetime to 20 years, %.
Reduction of GWP (%)
ScenarioIIIIIIIVVVI
TEC 120%21%8%20%21%7%
TEC&H 210%13%2%10%13%1%
1 thermoelectric cooling system, 2 thermoelectric cooling system with heat recovery.
Table 10. Comparison of literature values of COP for selected thermoelectric coolers.
COPType of Heat Exchanger Reference
0.16–0.64CS 1, HS 2: finned heat sink and fan[33,34,35]
0.3–4.51CS 1: finned heat sink and fan
HS 2: water heat exchanger
[26,30,36]
0.055CS 1, HS 2: finned heat sink and fanCurrent study, Stage 1
1.25–1.3 CS 1: finned heat sink and fan
HS 2: water heat exchanger
Current study, Stage 2–3
1 CS: cold side of TE module, 2 HS: hot side of TE module.

