Abstract
Glazing plays a key role in the energy balance of buildings. The aim of this paper is to enlighten the thermal discomfort caused by large glazed areas in the heating season and to point out a possible solution that can provide proper thermal comfort with low energy use. It is unusual to discuss the negative effects of solar gains on thermal comfort during the heating season. However, there are cases when glazing may lead to unforeseen indoor thermal discomfort conditions. Laboratory and on site measurements were performed in order to assess thermal discomfort caused by direct and diffuse radiation. It was shown that the WBGT (Wet Bulb Globe Temperature) index may exceed even 30 °C in the winter season in a room having large glazed area oriented to east. Laboratory tests performed in climate chamber have shown that the high PMV values cannot be reduced below 1.0, increasing the air change rate in the room. Using opaque drapes, the WBGT index was reduced by 2 °C, but the daylighting decreased substantially. It was demonstrated that by using advanced personalized ventilation systems, the appropriate thermal comfort can be provided avoiding the reduction of daylighting.
1. Introduction
Mitigation of buildings’ energy use has been a focus of policy makers and specialists for decades. In the last few years, the energy saving issues have been analyzed by several authors in a complex mode, taking into account the interrelation between climate change and the building sector. According to the European Directive 2010/31/EU, buildings are responsible of about 40% of the total energy consumption in European Union. Fossil fuels are used on a large scale in each European country, and consequently, the environmental pollution and greenhouse gas emissions are high. On the other hand, because of the increase in outdoor temperatures in the summer period, the electricity use for cooling grew substantially in the last years. Therefore, there is a strong correlation between climate change and the building sector. Climate change has to be taken into consideration not only from an energy performance point of view. The importance of mitigation strategies at the local scale for the sustainability of European landscapes is discussed by Dastgerdi et al. [1,2]. The authors draw the attention on the diversity of climate change impacts on buildings and the buildings’ adaptation capacity to climate change. Energy performance requirements were continuously tightened and integration of renewable energy sources were supported. However, there are cases when the expected energy savings were not met. The increase of occupants’ comfort needs may overthrow the plans of designers. Another important factor influencing the buildings energy performance is the windows to wall ratio (WWR). Tian et al. attempt to define a generalized window rating system for office buildings [3]. They stated that in the calculus, both the embodied and the operation energy have to be taken into account. The operation energy includes solar gains, filtration (infiltration or exfiltration) and heat losses or gains through transmission. However, in most cases, only one or two of these processes and factors are analyzed. Thermal comfort issues generated in closed spaces by solar radiation entering the room through glazing are not discussed in the article. Grynning et al. proposed three different rating methods to assess the energy performance of windows [4]. They analyzed the combined effects of heat loss and heat gains and have shown that windows may perform better than opaque building elements from an energy point of view. The effects of direct and diffuse solar radiation on the occupants’ thermal sensation and visual comfort are mentioned further in the work chapter. Chi et al. analyzed the relation between daylighting and yearly energy consumption for heating and cooling [5]. It was shown that by confining the overlit area, important energy savings may be obtained. However, thermal comfort aspects are not considered in the complex analysis performed by authors. Aydin numerically studied and optimized the air layer thickness of a double pane window in order to minimize the heat transfer rates [6]. He built up a mathematical model to analyze the heat transfer through glazing, but the energy entering the building through transmission and the absorbed energy are not discussed. However, the asymmetric radiation generated by direct and indirect solar radiation may lead to higher discomfort than the low surface temperature of glazing. Weir and Muneer quantified the embodied energy of the four main materials used in the construction of a double glazed filled with inert gas [7]. Over a 40 years window lifespan, they found that Argon filled windows perform better and air-filled ones. The paper gives important insights on the embodied energy, which is a basic piece of data for life cycle analysis of windows; however, the solar factor or other thermos-physical aspects are not discussed by authors. Ochoa et al., using a graphical optimization method, attempted to identify those glazing solutions, which simultaneously satisfy visual and energy expectations [8]. They took into account mainly visual comfort elements such as glare and illuminance uniformity. Authors mentioned in the further research chapter that the solution presented in their paper may have other characteristics if additional criteria as thermal comfort aspects are taken into account. Fasi and Budaiwi analyzed the energy performance of windows in hot climates taking into account visual comfort criteria and daylight integration [9]. They used the DesignBuilder simulation program in order to investigate three different types of glazing. They show that 14–16% total energy saving might be obtained by appropriate daylight integration. They refer to other authors related to heating and cooling energy issues of glazing, but thermal comfort aspects are not considered in their paper. Yasar and Kalfa investigated different double glazed windows and smart glass in different climate regions of Turkey [10]. The authors have taken into account in their research the heating and cooling loads, but thermal comfort issues were not discussed. They used DesignBuilder as well, and demonstrated that smart glazed units with low emissivity are the most efficient alternatives with regard to building energy consumption. The effects of glazing on the energy performance in residential buildings were investigated in different countries and climates [11,12,13,14]. For energy calculations, TRNSYS and COMFEN simulation programs were used. All these articles presented useful results related to the complex energy analysis of transparent areas, but none of them studied or discussed the thermal comfort issues of glazing in buildings. Wen et al. proposed a methodology for creating maps of recommended WWR [15]. They integrated thermal and daylighting simulations and analyzed a typical office building in Japan. Their goal was to minimize CO2 emissions, so they analyzed the glazing from an energy point of view. WWR effects on the energy consumption in buildings were analyzed using Energy Plus software by Alghoul et al. [16]. For WWR between 0 and 0.9, depending on the windows orientation, they found an increase of the annual energy consumption by 6–181%. Even though, in such a large interval of WWR, substantial variations of thermal comfort sensation are expected, this question is not considered in the paper. Vanhoutteghem et al. investigated the impact of facade window design on energy, daylighting and thermal comfort in nearly zero-energy houses [17]. Measurements were not performed. Authors used EnergyPlus for calculations and demonstrated that deep or narrow south-oriented rooms show difficulties in reaching sufficient daylight levels without overheating. Furthermore, glazing with solar control coatings are alternatives of dynamic solar shading. The performance of electrochromic windows in the Mediterranean climate and in Oakland, California, was analyzed by Gugliermetti and Bisegna, and Fernandes et al., respectively. Both studies aimed to obtain proper visual comfort and analyzed the energy consumption for lighting. Gugliermetti and Bisegna have shown that the visual comfort-based approach produces a small increase in the minimum primary total energy requirements [18]. Fernandes et al. stated that for south-facing spaces, electrochromic windows have the potential to provide lighting energy savings over the whole year, relative to ordinary clear glass [19]. Thermal comfort was not analyzed neither theoretically nor experimentally. The performance of three advanced electrochromic windows within 16 climate conditions in the US was studied by DeForest et al. [20]. Results indicate modest energy savings in most locations and buildings. The author mentioned the thermal comfort issue, but it was not discussed or investigated. Heat insulation solar glass (HISG) was introduced by Cuce et al., proving that besides electricity generation, HISG has good thermal properties [21]. The author referred to thermal comfort as being possibly improved upon by using the HISG, but no measurements or calculations were provided. Naturally, glazing elements mounted on the buildings’ facades are exposed to large temperature variations, which should be carefully taken into account when the construction technology is chosen. The absorbed heat generates thermal stress in the glass, which can lead to a crack of the glass panels [22]. In the winter period, the temperature of glazing elements can show large variations. Faraboschi studied in detail the temperature gradients in glass panels and developed a mathematical model to predict the thermal shock [23]. Most of the analyzed papers studied in detail the energy and visual comfort performance of windows. Only one of mentioned papers deals with thermal comfort issues generated by transparent building elements besides the energy and daylighting optimization. However, it is obvious that large glazed areas will seriously affect the occupants’ thermal sensation. It was already shown that in the case of existing buildings with high WWR during the summer period, the appropriate thermal comfort can hardly be obtained, even substantially increasing the cooling energy use [24]. It raises the question: can the direct and diffuse radiation have any significant effect on thermal comfort during the heating season in closed spaces provided with large glazed areas? Naturally, the heat gains can be reduced by proper shading design and operation, but during the daytime in the heating season, shading elements most likely will not be used. Thus, one of our goals was to investigate the surface temperatures of different glazing types during wintertime. The hypothesis was that because of the absorbed heat high, surface temperatures may occur, which can lead to discomfort, even during the heating season. A series of measurements were carried out in order to investigate the effects of radiation (direct and diffuse) on thermal comfort. Beyond that, measurements were performed in order to examine the effect of different solutions that may improve the thermal comfort in rooms with high WWR. This paper highlights the thermal discomfort aspects of large glazed areas in existing buildings during the heating season and, based on the performed measurements, proposes advanced personalized ventilation as one of the energy conscious solutions that can be used to improve the thermal sensation of occupants without reducing the daylighting.
2. Measurements and Methods
In order to point out the challenges that may occur that are related to thermal comfort, in the case of existing buildings with high WWR, a series of measurements were carried out both in laboratory and on site. The dimensions of the chosen office are: 3.1 m × 6.16 m × 3.15 m (Figure 1a) while the dimensions of the laboratory test room are: 2.49 m ×3.65 m × 2.56 m (Figure 1b). The chosen office is situated at the 3rd floor of a building built between years 1965–1970. The facade, having an eastern orientation, is practically fully glazed, with 2.1 m × 3.15 m U profile wired glass and 1.0 m × 3.15 m double glazed window with wooden frames. Finned tube radiators are placed in front of the window and the glazed element, practically occupying the whole width of the room. The workplace (chair of the employee) is situated at 1.5 m distance from the glazed external building element. Thus, the measurements were done in the middle of the room (M), at 1.5 m distance from the external glazed surface (F) and on the other side of the room at 1.5 m distance from the internal wall (B). The test room is placed in a climatic chamber built from 20 cm thick PUR panels. In the space between the test room and climatic chamber, a 1000 W halogen lamp was placed to simulate the solar radiation. The test room has a double glazed window with plastic frame. In the test room, one TESTO 480 instrument was placed in the middle of the room (LM), and the other two instruments were placed at 50–50 cm distance from the central instrument: one closer to the “inner” wall (LB), and one closer to the window (LF). During measurements, the ventilation in the test room was assured using a swirl diffuser placed in the middle of the ceiling. Measurements were carried out with the windows and doors in closed position.
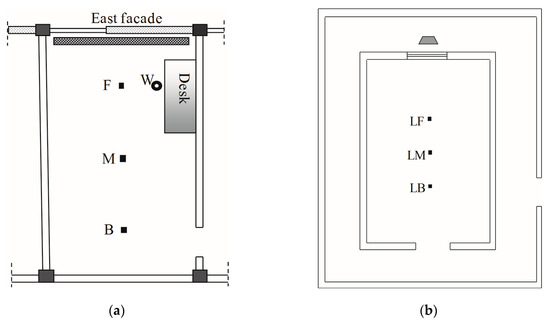
Figure 1.
Schema of the analyzed office (a); schema of the laboratory test room (b).
The indoor parameters were measured with TESTO 480 instruments in three locations of the closed space. Besides the middle of the room, the indoor thermal environment parameters were monitored in two other locations chosen at equal distance from the middle of the room (one point is closer to the glazed surface, and the other point is located on the other side of the room). The mean radiation temperature required for determining the predictive mean vote (PMV) and predicted percentage of dissatisfied (PPD) was calculated in the TESTO 480 from the measurement parameters of globe temperature, ambient temperature and air speed.
The PMV is calculated using the well-known equation given by Standard ISO 7730 [25]:
where: M is the metabolic rate, (W); W—is the work performed, (W); pa—is the partial vapor pressure in the air, (Pa); ta—is the air temperature, (°C); tcl—is the average temperature of the body covered and uncovered with clothes, (°C); —is the mean radiant temperature, (°C); hc—is the convective heat transfer coefficient, (W/m2K).
The thermal resistance of clothes (Icl) was considered 1.0 clo (winter period), so the coefficient fcl is calculated with the following relation:
The mean radiant temperature is calculated based on the measured globe temperature (tg) using the following relation:
where va is the air velocity around the globe (m/s).
In order to have a general overview on the surface temperatures, the TESTO 882 infrared camera was used. The thermal image resolution is 320 × 240 pixels, and the instrument provides precise measurement: thermal sensitivity <50 mK, 32° lens with automatic hot/cold spot recognition. Thermal images were assessed with IRSoft 4.3 software.
The Wet Bulb Globe Temperature (WBGT)is a heat stress index used to evaluate the resultant effects on the human body of heat radiation, air temperature and humidity content of the air [26,27]. The inside of the buildings is determined using the following relation:
where tw—is the wet bulb temperature of the air (°C).
According to ISO 7243, the Standard the maximum value of WBGT should be 30 °C for persons acclimatized to heat, if the metabolic rate is 65 W/m2 < M < 130 W/m2. In the case of persons not acclimatized to heat, the WBGT should be lower than 29 °C. There are different possibilities to determine the WBGT index [28,29]. In our case, the WBGT index was measured according to ISO 7243 with the TESTO 400 instrument (Figure 2).
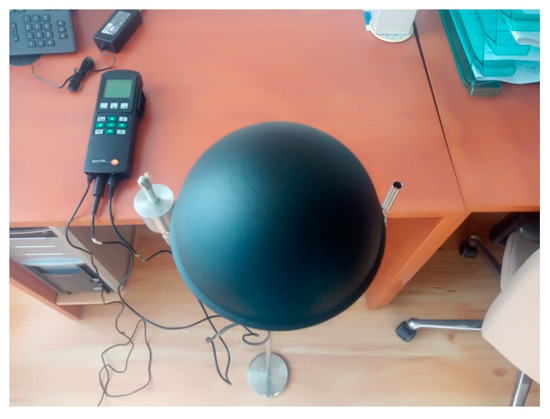
Figure 2.
TESTO 400 instrument.
The wet and dry bulb temperatures were measured with a Pt100 probe, while the globe temperature was measured with a K type probe. The accuracy of the Pt100 probes is ±(0.3 + 0.3% of measured value). The K probe is class 1 (according to standard EN 60584-2).
The gathered data were assessed with Excel and ORIGIN Lab software.
3. Results
Measurements were done in the office in December (2019) and the January–February months (2020). The outdoor dry bulb temperature was between 0 °C and 10 °C. There were both cloudy and sunny days. The indoor temperatures in the case of sunny days were quite high. The surface temperatures of the transparent external wall can be seen in Figure 3.
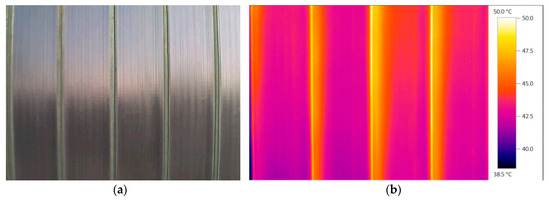
Figure 3.
Normal (a) and infrared (b) photo of the external wall in the analyzed office.
It can be observed that quite high temperatures occur because of the direct solar radiation. The absorbed energy leads to the increase of the wired glass temperature, so this surface became a radiant heating surface during the day. The histogram of the temperature values obtained with IRSoft 4.3 software is presented in Figure 4. The minimum surface temperature value on the analyzed building element was 39.2 °C, while the maximum value was 50 °C. The mean surface temperature value of the wall was 43.7 °C.
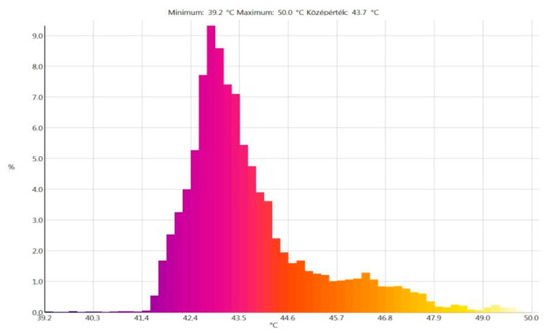
Figure 4.
Histogram of the surface temperatures (external transparent wall—February 2020).
On the double glazed window and on its wooden frame, the surface temperatures take lower values (Figure 5). However, these values are much higher than expected. The outdoor temperature was below 10 °C, so the heating system was in operation. Having a qualitative control, the supply temperature was chosen as a function of the external temperature. No thermostatic valves were installed, so the heat gains led to the excessive increase of the indoor temperature.
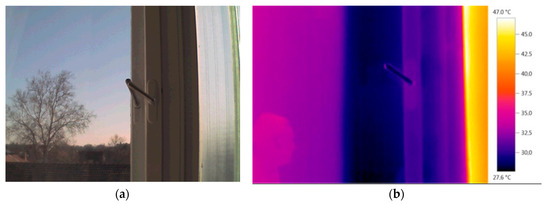
Figure 5.
Normal (a) and infrared (b) photo of the window in the analyzed office.
The histogram of the window + wooden frame surface temperatures are illustrated in Figure 6. The minimum surface temperature value of the analyzed area was 27.7 °C, while the maximum value was 34.7 °C. The mean surface temperature of the double glazed window was 31 °C.
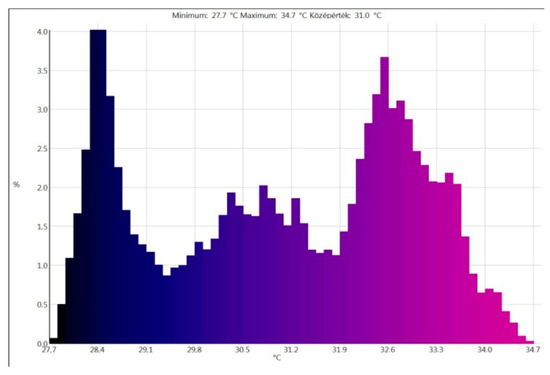
Figure 6.
Histogram of the surface temperatures (external window—February 2020).
With such high temperatures, the WBGT index was measured with the TESTO 400 instrument (point W in Figure 1a). The box chart of the registered values (between 9:30–10:00) is presented in Figure 7.
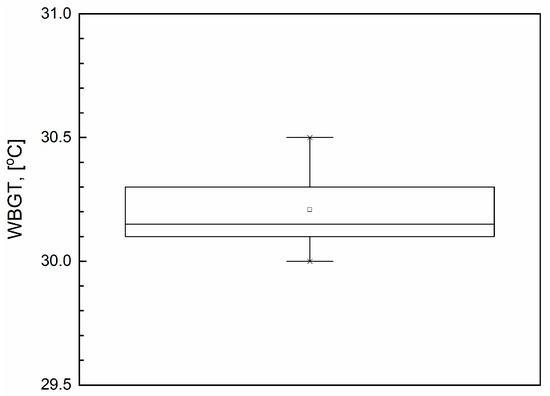
Figure 7.
WBGT in the office (east orientation of the glazed facade).
With such high temperatures, it is obvious that, on sunny days in this room, thermal comfort problems will occur. Using the TESTO 480 instrument, the PMV was measured (F, M, B measuring points in Figure 1a). Spanning three consecutive days (December, 2019), the registered PMV is shown in Figure 8. As it can be observed, the first two days were cloudy days, but on the third day, the direct solar radiation produced a substantial increase of the PMV.
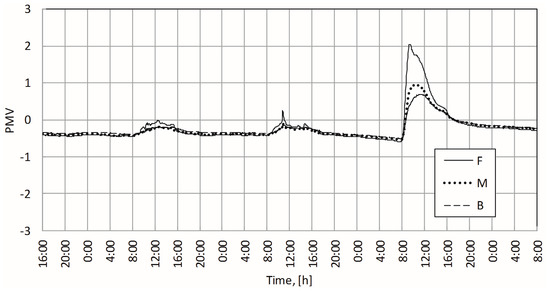
Figure 8.
PMV values in the office for three consecutive days.
In the Indoor Environment Quality (IEQ) laboratory of the University of Debrecen, a series of measurements were performed in order to quantify the effects of asymmetric radiation on the thermal comfort in three different points of the test room (LF, LM and LB according to Figure 2). The aim was to obtain similar temperatures as those registered in the office. The radiation through the window of the test room was obtained using a 1000 W metal halide lamp. Measurements were carried out for 0.5 h−1, 1.0 h−1, 1.5 h−1, 2.0 h−1, 2.5 h−1 and 3 h−1 air change rates (ACH) assuming that the higher air change rate will reduce the effects of the asymmetric radiation. In the test room, 28 °C was provided using radiator (placed under the window), walls, floor and ceiling heating. Each measurement was one hour long, and for the first 15 min, the window was covered on the outer side with chipboard in order to keep out the lamp radiation. After 15 min, the chipboard was taken off and the direct radiation entered in the test room. The measured PMV values at three different air change rates are presented in Figure 9. It can be observed that the highest PMV values were registered in LF measuring point (being the closest point to the window). Furthermore, the higher the air change rate was, the higher the PMV values were.
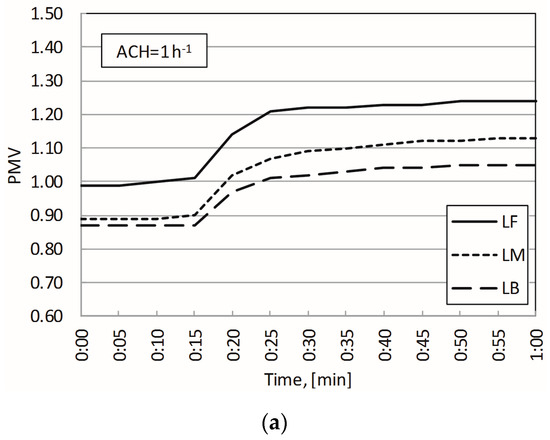
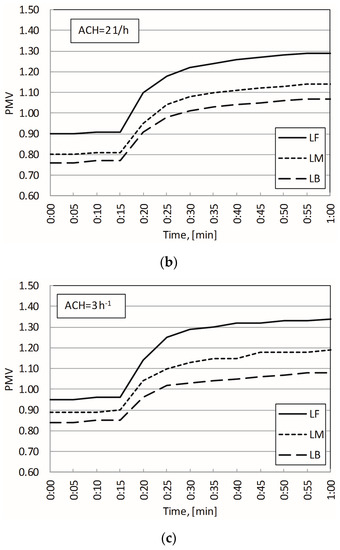
Figure 9.
PMV values registered in the IEQ test room. (a) ACH=1 h−1. (b) ACH=2 h−1. (c) ACH=3 h−1.
4. Discussion
The direct solar radiation through glazing generates a significant increase in the PMV values. In the case of east oriented facades, the higher PMV values occur during the working hours and may lead to the decrease of the work performance. It is known that for II. comfort category office buildings, the PMV should be between −0.5 and +0.5, while for III. comfort category, the PMV should be between −0.7, …, +0.7 [30]. It can be observed that in the third monitoring day, the PMV exceeds 1 for almost 4 h (8:40–12:30) (Figure 10). From an energy point of view, it is not advantageous to put in operation the cooling system during the winter period. However, the PMV should be lowered.
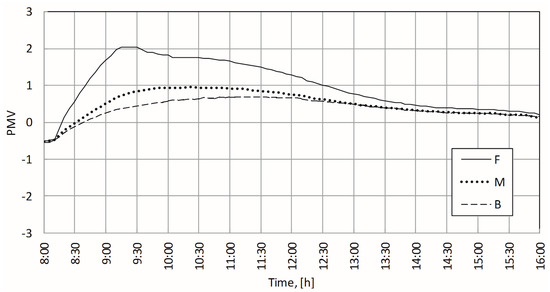
Figure 10.
PMV in the analyzed office during working hours.
A possibility to reduce the PMV is the use of shadings. By covering the whole external wall and window on the inner side with an opaque drape, the WBGT index decreased (Figure 11).
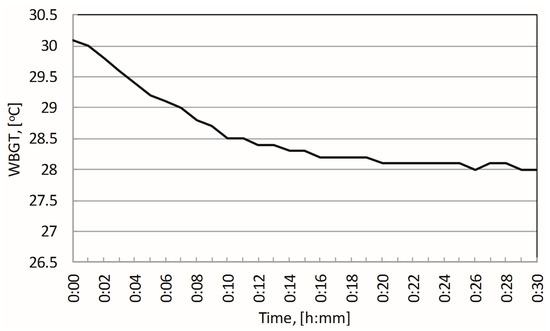
Figure 11.
Effect of the opaque drape on the WBGT index.
In Figure 12, the infrared image of an east oriented insulated double glazed window with external shading elements can be seen.
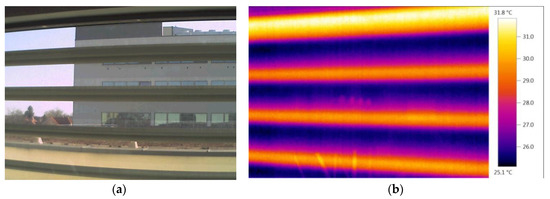
Figure 12.
(a) Normal and (b) infrared photo of the window in east oriented shaded double glazed insulated window.
The utilization of shading elements (internal or external) leads to the decrease of daylighting, so the electricity consumption for lighting will increase. In order to optimize the visual comfort and minimize the electricity use for lighting, different algorithms were developed [31,32,33]. However, in these studies, thermal comfort was not taken into consideration. Moreover, the behavior of occupants has a significant influence on the energy saving obtained. Anand et al. showed in their study that by having an intelligent control for shading devices, the energy saving for lighting varies between 38% and 65% [34]. In their study, thermal discomfort caused by solar radiation was not considered. The optimization of glazing, aggregating the visual and thermal comfort expectations, is an extremely complex task. However, Carlucci et al. managed to develop a multi objective optimization method using a non-dominated sorting genetic algorithm [35]. This method is highly useful during the design process of buildings. Vanhoutteghem et al. combined three objectives and tried to find the optimal solution for glazing from an energy, visual comfort and thermal comfort point of view [17]. However, they proposed design solutions for rooms with glazed facades oriented to north and south. Anand et al. proposed a simplified tool to determine the optimal building layout for different climates and orientations of the glazing [36]. Their method can be effectively used in the early design stage of buildings. Nevertheless, there are plenty of existing buildings with existing glazing, orientation and layout where the thermal discomfort should be ceased. In the case of existing buildings, proper thermal comfort can be provided installing variable air volume systems serving different zones of the building [37]. However, there are buildings where these systems cannot be installed because there is simply no place for air ducts.
Another possibility to reduce the PMV values is the utilization of advanced personalized ventilation systems. At the University of Debrecen, Department of Building Services and Building Engineering, our research group developed a novel personalized ventilation system [38,39,40]. It was shown that occupants’ thermal sensation is below the calculated PMV because of the alternative change of the air jet [41,42]. Using the ALTAIR PV equipment, the effects of elevated air velocity on the PMV on the measuring point LF were tested (Figure 13).
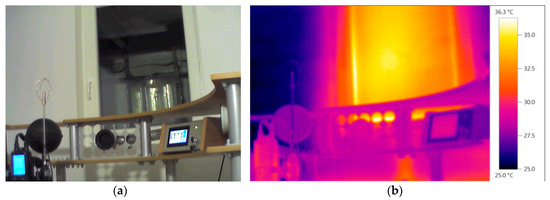
Figure 13.
(a) Normal and (b) infrared photo of the window in the test room.
In the test room, an ambient temperature of 28 °C was created before starting the measurements. First, the window was covered with the chipboard and the board was removed after 15 min. After 45 min of measurements, the ALTAIR PV was switched on. The PMV variation during the measurements can be seen in Figure 14.
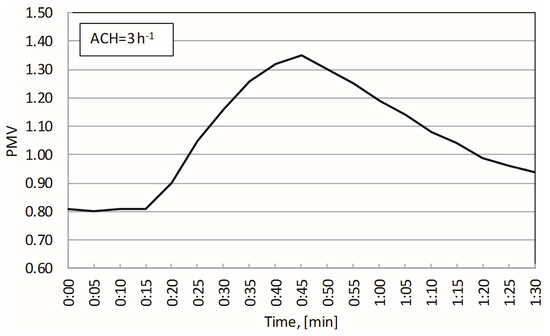
Figure 14.
PMV variation in the test room with radiation and personalized ventilation.
The personalized ventilation system is using the air of the room. As it can be observed, with elevated air velocity (0.2 m/s) and alternatively changed air jet direction, the PMV can be reduced below 1.0 after 35 min of continuous operation.
5. Conclusions
The main goal of our research was to emphasize the thermal discomfort caused by solar radiation in the heating season. In the early design stage, the proper orientation of the facades and appropriate layout of rooms can help in avoiding thermal discomfort. Moreover, multiobjective optimization methods offer optimal design conception. However, in the case of existing buildings, changes in the architectural and thermal characteristics can face financial, technical and in some cases legal difficulties. Nevertheless, it was shown that in the case of existing buildings with high windows to wall ratios, depending on the orientation of the glazed areas, the predicted mean vote may exceed 1.0, even in the winter period. In practice, the −1, …, +1 interval is considered to be the acceptable thermal comfort band. However, according to EN 15251 Standard, the −0.5, …, +0.5 interval is already the II. thermal comfort category for office buildings. In the analyzed office, the WBGT index exceeds 30 °C in the workday in February. By increasing the air velocity, the thermal comfort sensation can be improved. Laboratory measurements performed in the climate chamber proved that by increasing the air change rate from 1 1/h to 3 1/h, the PMV cannot be reduced below 1.0. With cooling systems, proper thermal comfort might be provided, but from an energy point of view, cooling should be avoided, at least during winter. By using internal or external shading elements, the thermal comfort conditions can be improved. In our case, the WBGT index decreased with 2 °C by using opaque drapes. External shading lowered the glazing surface temperature by 5 to 10 °C. However, it was demonstrated by other researchers that the shading elements will lead to the decrease of daylighting as well, so the electricity consumption for lighting will increase. Personalized ventilation offers the optimal solution in this case. Even in the case of fully recirculated air, the PMV may be reduced substantially by the elevated air velocity. Occupants can choose a certain air jet velocity, which compensates for the high thermal radiation, in order to obtain appropriate thermal comfort conditions. Practically, each person can have their own “comfort bulb” in which the environmental parameters can be adjusted for the function of personal needs. It was shown that by using the ALTAIR personalized ventilation equipment, the actual mean vote (AMV) of the occupants will be below the calculated PMV because of the additional cooling effect created by the alternatively changed air jet direction [38,39,41,42]. Furthermore, the perceived indoor air quality in the occupational zone was improved by using personalized ventilation devices because the effectiveness of this ventilation mode substantially exceeded the effectiveness of traditional ventilation systems. Nevertheless, personalized ventilation devices are not widely used in offices. Designers tend to use the well-known all air solutions. However, in the operation of these systems, personal comfort needs hardly can be taken into account. Successful examples of buildings equipped with advanced personalized ventilation systems would help to spread this energy conscious ventilation mode.
Limitations
The external wall of the analyzed office is built from U profile wired glass, which was built-in some decades ago. With proper orientation and shading, these extreme high temperatures can be avoided.
Author Contributions
Conceptualization, F.K.; Methodology, F.K.; Analysis, F.K. and T.K.; Investigation, F.K. and T.K.; Data curation, T.K. and F.K.; Writing—original draft preparation, F.K.; Writing—review and editing, F.K.; Visualization, F.K. and T.K.; Supervision, F.K.; Project administration, F.K.; All authors have read and agreed to the published version of the manuscript.
Funding
The research was financed by the Higher Education Institutional Excellence Programme (NKFIH-1150-6/2019) of the Ministry of Innovation and Technology in Hungary, within the framework of the Energetics thematic programme of the University of Debrecen.
Conflicts of Interest
The authors declare no conflict of interest. The funders had no role in the design of the study; in the collection, analyses, or interpretation of data; in the writing of the manuscript, or in the decision to publish the results.
References
- Dastgerdi, A.S.; Sargolini, M.; Pierantoni, I. Climate Change Challenges to Existing Cultural Heritage Policy. Sustainability 2019, 11, 5227. [Google Scholar] [CrossRef]
- Shirvani Dastgerdi, A.; Sargolini, M.; Broussard Allred, S.; Chatrchyan, A.; De Luca, G. Change and Sustaining Heritage Resources: A Framework for Boosting Cultural and Natural Heritage Conservation in Central Italy. Climate 2020, 8, 26. [Google Scholar] [CrossRef]
- Tian, C.; Chen, T.; Yang, H.; Chung, T.M. A generalized window energy rating system for typical office buildings. Solar Energy 2010, 84, 1232–1243. [Google Scholar] [CrossRef]
- Grynning, S.; Gustavsen, A.; Time, B.; Jelle, B.P. Windows in the buildings of tomorrow: Energy losers or energy gainers? Energy Build. 2013, 61, 185–192. [Google Scholar] [CrossRef]
- Chi, D.A.; Moreno, D.; Navarro, J. Correlating daylight availability metric with lighting, heating and cooling energy consumptions. Build. Environ. 2018, 132, 170–180. [Google Scholar] [CrossRef]
- Aydin, O. Conjugate heat transfer analysis of double pane windows. Build. Environ. 2006, 41, 109–116. [Google Scholar] [CrossRef]
- Weir, G.; Muneer, T. Energy and environmental impact analysis of double-glazed windows. Energy Convers. Manag. 1998, 39, 243–256. [Google Scholar] [CrossRef]
- Ochoa, C.E.; Aries, M.B.C.; van Loenen, E.J.; Hensen, J.L.M. Considerations on design optimization criteria for windows providing low energy consumption and high visual comfort. Appl. Energy 2012, 95, 238–245. [Google Scholar] [CrossRef]
- Fasi, M.A.; Budaiwi, I.M. Energy performance of windows in office buildings considering daylight integration and visual comfort in hot climates. Energy Build. 2015, 108, 307–316. [Google Scholar] [CrossRef]
- Yasar, Y.; Kalfa, S.M. The effects of window alternatives on energy efficiency and building economy in high-rise residential buildings in moderate to humid climates. Energy Convers. Manag. 2012, 64, 170–181. [Google Scholar] [CrossRef]
- Urbikain, M.K.; Sala, J.M. Analysis of different models to estimate energy savings related to windows in residential buildings. Energy Build. 2009, 41, 687–695. [Google Scholar] [CrossRef]
- Gasparella, A.; Pernigotto, G.; Cappelletti, F.; Romagnoni, P.; Baggio, P. Analysis and modelling of window and glazing systems energy performance for a well insulated residential building. Energy Build. 2011, 43, 1030–1037. [Google Scholar] [CrossRef]
- Lee, J.W.; Jung, H.J.; Park, J.Y.; Lee, J.B.; Yoon, Y. Optimization of building window system in Asian regions by analyzing solar heat gain and daylighting elements. Renew. Energy 2013, 50, 522–531. [Google Scholar] [CrossRef]
- Jaber, S.; Ajib, S. Thermal and economic windows design for different climate zones. Energy Build. 2011, 43, 3208–3215. [Google Scholar] [CrossRef]
- Wen, L.; Hiyama, K.; Koganei, M. A method for creating maps of recommended window-to-wall ratios to assign appropriate default values in design performance modeling: A case study of a typical office building in Japan. Energy Build. 2017, 145, 304–317. [Google Scholar] [CrossRef]
- Alghoul, S.K.; Rijabo, H.G.; Mashena, M.E. Energy consumption in buildings: A correlation for the influence of window to wall ratio and window orientation in Tripoli, Libya. J. Build. Eng. 2017, 11, 82–86. [Google Scholar] [CrossRef]
- Vanhoutteghem, L.; Skarning, G.C.J.; Hviid, C.A.; Svendsen, S. Impact of facade window design on energy, daylighting and thermal comfort in nearly zero-energy houses. Energy Build. 2015, 102, 149–156. [Google Scholar] [CrossRef]
- Gugliermetti, G.; Bisegna, F. Visual and energy management of electrochromic windows in Mediterranean climate. Build. Environ. 2003, 38, 479–492. [Google Scholar] [CrossRef]
- Fernandes, L.L.; Lee, E.S.; Ward, G. Lighting energy savings potential of split-pane electrochromic windows controlled for daylighting with visual comfort. Energy Build. 2013, 61, 8–20. [Google Scholar] [CrossRef]
- DeForest, N.; Shehabi, A.; Selkowitz, S.; Milliron, D.J. A comparative energy analysis of three electrochromic glazing technologies in commercial and residential buildings. Appl. Energy 2017, 192, 95–109. [Google Scholar] [CrossRef]
- Cuce, E.; Young, C.-H.; Riffat, S.B. Thermal performance investigation of heat insulation solar glass: A comparative experimental study. Energy Build. 2015, 86, 595–600. [Google Scholar] [CrossRef]
- Foraboschi, P. Experimental characterization of non-linear behavior of monolithic glass. Int. J. Non-Linear Mech. 2014, 67, 352–370. [Google Scholar] [CrossRef]
- Foraboschi, P. Analytical modeling to predict thermal shock failure and maximum temperature gradients of a glass panel. Mater. Des. 2017, 134, 301–319. [Google Scholar] [CrossRef]
- Kalmár, F. Summer operative temperatures in free running existing buildings with high glazed ratio of the facades. J. Build. Eng. 2016, 6, 236–242. [Google Scholar] [CrossRef]
- International Standard ISO 7730:2005. Ergonomics of the Thermal Environment—Analytical Determination and Interpretation of Thermal Comfort Using Calculation of the PMV and PPD Indices and Local Thermal Comfort Criteria; International Organization for Standardization: Geneva, Switzerland, 2005. [Google Scholar]
- Budd, G.M. Wet-bulb globe temperature (WBGT)—Its history and its limitations. J. Sci. Med. Sport 2008, 11, 20–32. [Google Scholar] [CrossRef]
- d’Ambrosio Alfano, F.R.; Malchaire, J.; Palella, B.I.; Riccio, G. WBGT Index Revisited After 60 Years of Use. Ann. Occup. Hyg. 2014, 58, 955–970. [Google Scholar] [CrossRef]
- Lemke, B.; Kjellstrom, T. Calculating workplace WBGT from meteorological data: A tool for climate change assessment. Ind. Heath 2012, 50, 267–278. [Google Scholar] [CrossRef]
- Buonanno, G.; Frattolillo, A.; Vanoli, L. Direct and indirect measurement of WBGT index in transversal flow. Measurement 2001, 29, 127–135. [Google Scholar] [CrossRef]
- European Standard EN 15251:2007. Indoor Environmental Input Parameters for Design and Assessment of Energy Performance of Buildings- Addressing Indoor Air Quality, Thermal Environment, Lighting and Acoustics; CEN: Brussels, Belgium, 2007. [Google Scholar]
- Tzempelikos, A.; Athienitis, A.K. The impact of shading design and control on building cooling and lighting demand. Sol. Energy 2007, 81, 369–382. [Google Scholar] [CrossRef]
- Xiong, J.; Tzempelikos, A. Model-based shading and lighting controls considering visual comfort and energy use. Sol. Energy 2016, 134, 416–428. [Google Scholar] [CrossRef]
- Al Touma, A.; Ouahrani, D. Shading and day-lighting controls energy savings in offices with fully-Glazed facades in hot climates. Energy Build. 2017, 151, 263–274. [Google Scholar] [CrossRef]
- Anand, P.; Cheong, D.; Sekhar, C.; Santamouris, M.; Kondepudi, S. Energy saving estimation for plug and lighting load using occupancy analysis. Renew. Energy 2019, 143, 1143–1161. [Google Scholar] [CrossRef]
- Carlucci, S.; Cattarin, G.; Causone, F.; Pagliano, L. Multi-objective optimization of a nearly zero-energy building basedon thermal and visual discomfort minimization using anon-dominated sorting genetic algorithm (NSGA-II). Energy Build. 2015, 104, 378–394. [Google Scholar] [CrossRef]
- Anand, P.; Deb, C.; Alur, R. Ramachandraiah Alur A simplified tool for building layout design based on thermal comfort simulations. Front. Archit. Res. 2017, 6, 218–230. [Google Scholar] [CrossRef]
- Anand, P.; Sekhar, C.; Cheong, D.; Santamouris, M.; Kondepudi, S. Occupancy-based zone-level VAV system control implications on thermal comfort, ventilation, indoor air quality and building energy efficiency. Energy Build. 2019, 204, 109473. [Google Scholar] [CrossRef]
- Kalmár, F.; Kalmár, T. Alternative personalized ventilation. Energy Build. 2013, 65, 37–44. [Google Scholar] [CrossRef]
- Kalmár, F. Innovative method and equipment for personalized ventilation. Indoor Air 2015, 3, 297–306. [Google Scholar] [CrossRef]
- Csáky, I.; Kalmár, T.; Kalmár, F. Operation Testing of an Advanced Personalized Ventilation System. Energies 2019, 12, 1596. [Google Scholar] [CrossRef]
- Kalmár, F. An indoor environment evaluation by gender and age using an advanced personalized ventilation system. Build. Serv. Eng. Res. Technol. 2017, 38, 505–521. [Google Scholar] [CrossRef]
- Kalmár, F. Impact of elevated air velocity on subjective thermal comfort sensation under asymmetric radiation and variable airflow direction. J. Build. Phys. 2018, 42, 173–193. [Google Scholar] [CrossRef]
© 2020 by the authors. Licensee MDPI, Basel, Switzerland. This article is an open access article distributed under the terms and conditions of the Creative Commons Attribution (CC BY) license (http://creativecommons.org/licenses/by/4.0/).