1. Introduction
Within the current global issues, we can find the thermal comfort sensation, conditions, and indoor environment in different building categories, topics that were much discussed in the late 20th century’s publications and remain vital for the 21st century. CR 1752: Ventilation for Buildings, Design Criteria for Indoor Environment defines the thermal comfort as a condition of mind, which expresses satisfaction with the thermal environment [
1].
Worldwide numerous publications have been released with indoor climate, thermal comfort in office buildings from heating viewpoint, cooling, mechanical ventilation (mixed, displacement), and air controlling system research results [
2,
3,
4,
5,
6,
7].
The general mechanical ventilation contribution is discussed by Khalifa et al. in the “Experimental investigation of reduced-mixing personal ventilation jets” publication, dealing with the design and performance characteristics of personal ventilation (PV) systems [
8].
We can learn more about energy saving potential of ceiling mounted PV systems in conjunction with background mixing ventilation compared with mixing ventilation systems alone, and with mixing ventilation systems from Yang el al.’s Ceiling mounted personalized ventilation system in hot and humid climate–An energy analysis article [
9].
Taking into account the thermal comfort and air quality on the head region (including head, neck, shoulders, and back, 1.1-m height) and the energy performance, we can state that the PV systems supply air at low turbulence and velocity and that it is an effective ventilation system [
10,
11].
In the University of Debrecen, Faculty of Engineering, Department of Building Services and Building Engineering, a progressive PV system (ALTAIR) was developed.
At the Laboratory of Building Physics, this novel PV system had been tested in order to analyze the system’s thermal comfort capacity. The air was introduced from different airflow directions, head region, at 1.1-m height, thus the cooling sensation was constantly stimulated [
12,
13].
A series of measurements (without and with subjects) were carried out with the ALTAIR equipment (University of Debrecen Building Physics and Indoor Quality laboratory). During the experiments, researchers usually worked with 20 subjects. The results were published in several articles by F. Kalmár et al. [
12,
13,
14,
15,
16,
17].
I. Csáky et al., in article Operation Testing of an Advanced Personalized Ventilation System demonstrates the result of testing eleven different air terminal devices (ATDs). At elevated air velocities, it is indispensable to have the low turbulence in order to avoid a draught (draught rating according to EN ISO 7730) sensation. The results show that, in order to obtain the optimal air velocity and flow distribution around the occupants, new ATDs have to be developed [
18].
The present paper’s aim is to present the results of measurements related to different ATD developments. The above analyzed literature covers only the effects of PV. The present research focuses on ATDs. Their novelty lies in the fact that air velocity, turbulence intensity, and draught are measured in the occupied zone.
2. ATDs and Experimental Procedure
A few years ago, at the University of Debrecen Faculty of Engineering, Department of Building Services and Building Engineering, an innovative personalized ventilation system was developed named ALTAIR. During the experiments, the circulated airflow was 20 m
3h
−1 and the researchers used another ATD type [
12,
13,
14,
15,
16,
17].
Before the experiment, the mean air velocity in the occupied zone head region was measured, as well as different horizontal planes to different ATDs.
The results for the parameters measured in the occupied zone were:
30 m3/h: 1.37; 1.46
40 m3/h: 1.77; 1.89
50 m3/h: 2.28; 2.47
These mean air velocity results do not meet the requirements defined by Technical Report CR 1752:1998 Ventilation for buildings—Design criteria for the indoor environment; for many types of buildings and spaces, the design criteria is defined [
1].
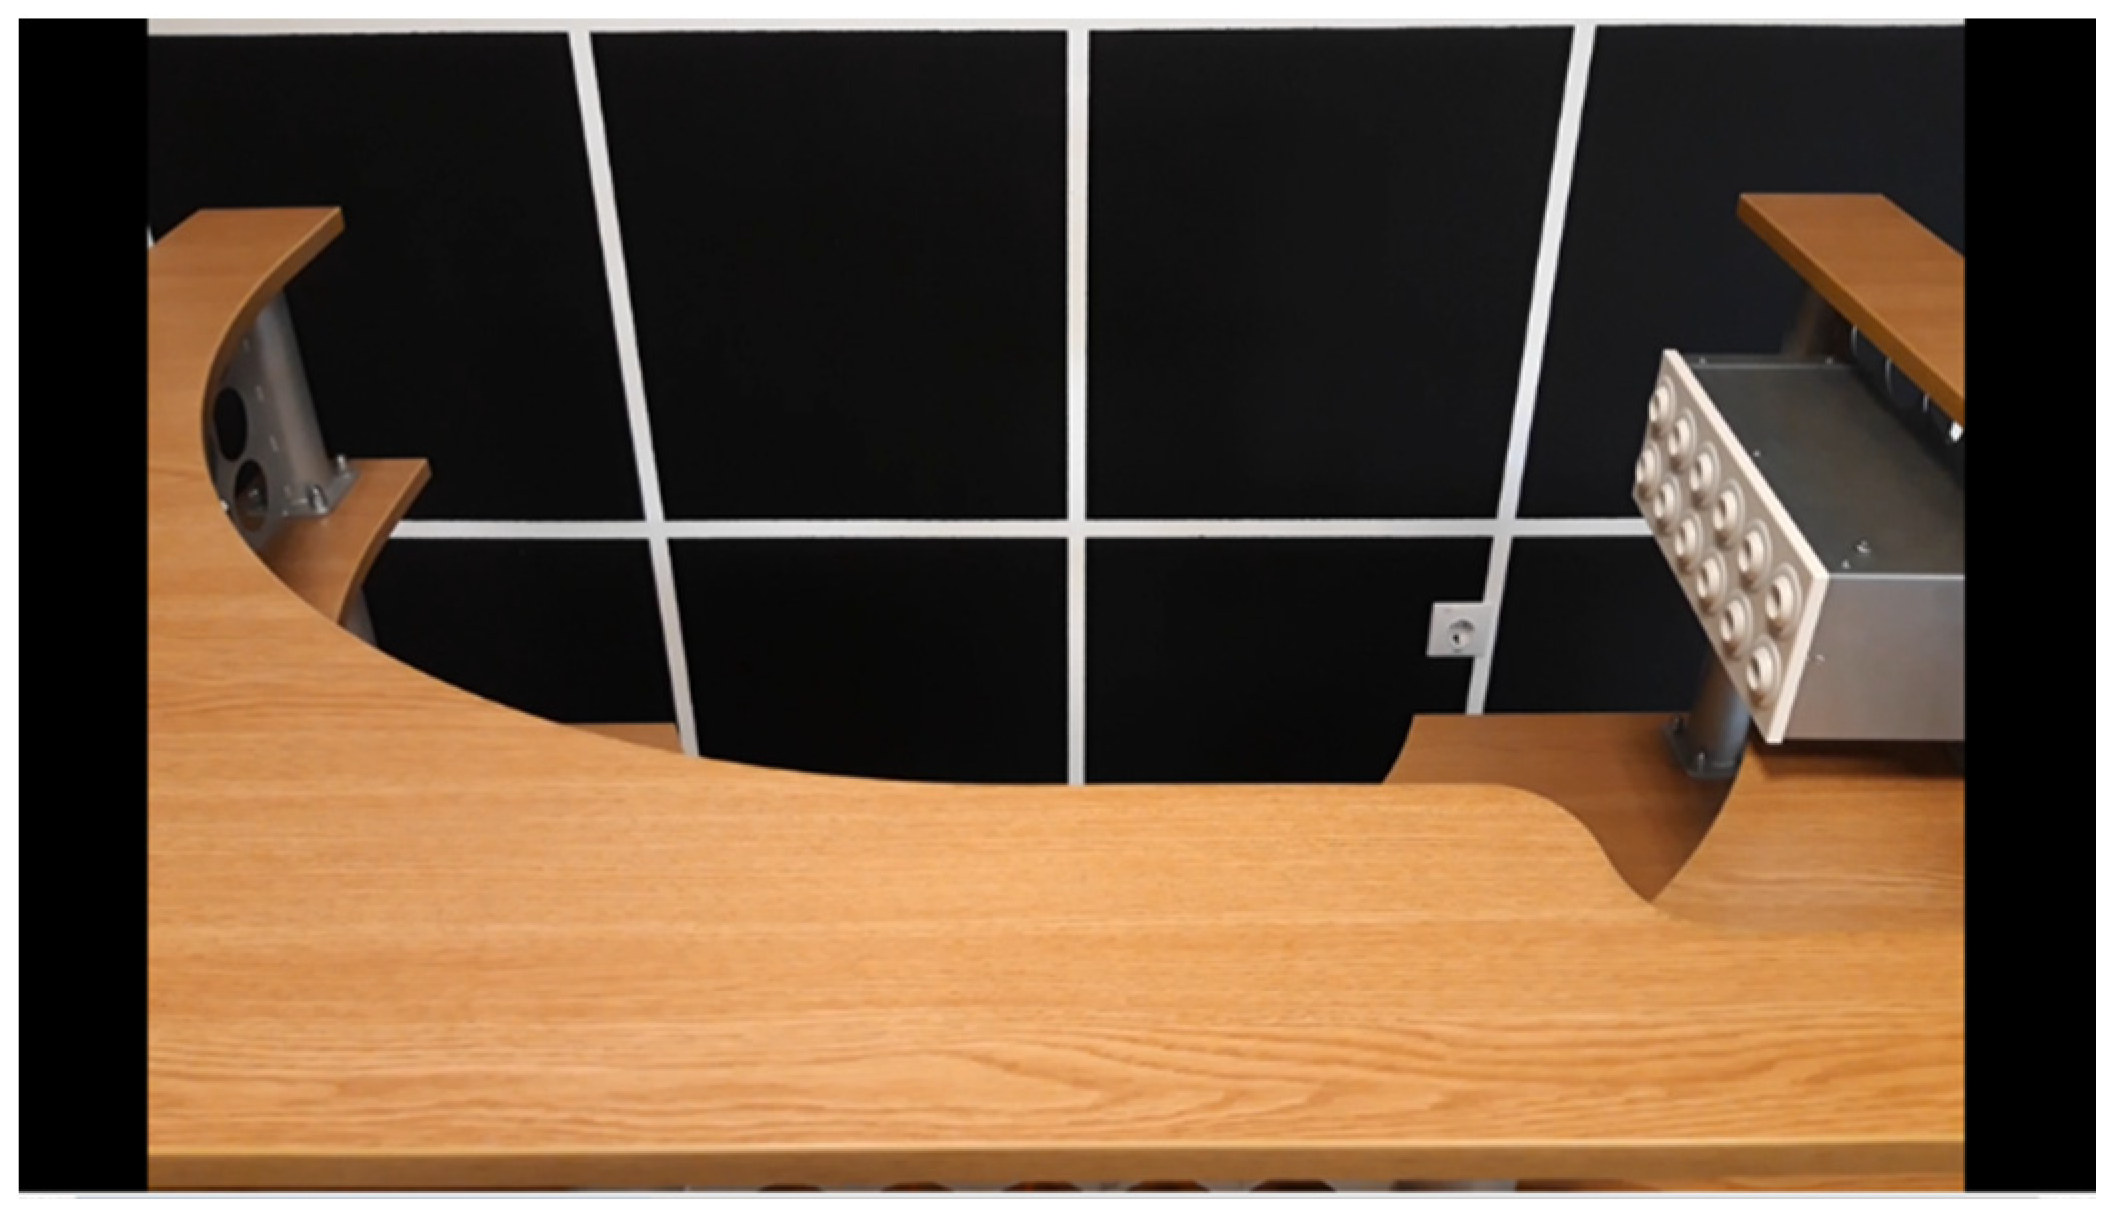
In the air ventilation and conditioning laboratory, we had the possibility to connect the ALTAIR PV system (
Figure 1) to an ATD equipment, which was placed in front of a black wall.
For the best air flow visualization, we used a smoke machine which emits a dense vapor that appears similar to fog; consequently, the black wall was indispensable.
The concerned laboratory was equipped with an AHU. The laboratory’s internal air temperature was ensured by the air handling unit set, which also ensures the isotherm air temperature to the testing equipment for air terminal devices.
Technical Report CR 1752:1998 points out that in single and landscape offices, the maximum operative temperature for different comfort categories in the summer season is defined between 23 and 26 °C, and in the winter season, varies between 21 and 23 °C [
1].
Therefore, during the experiment, the air temperature was set at 23 °C. The ALTAIR PV system’s maximum airflow was 20 m
3h
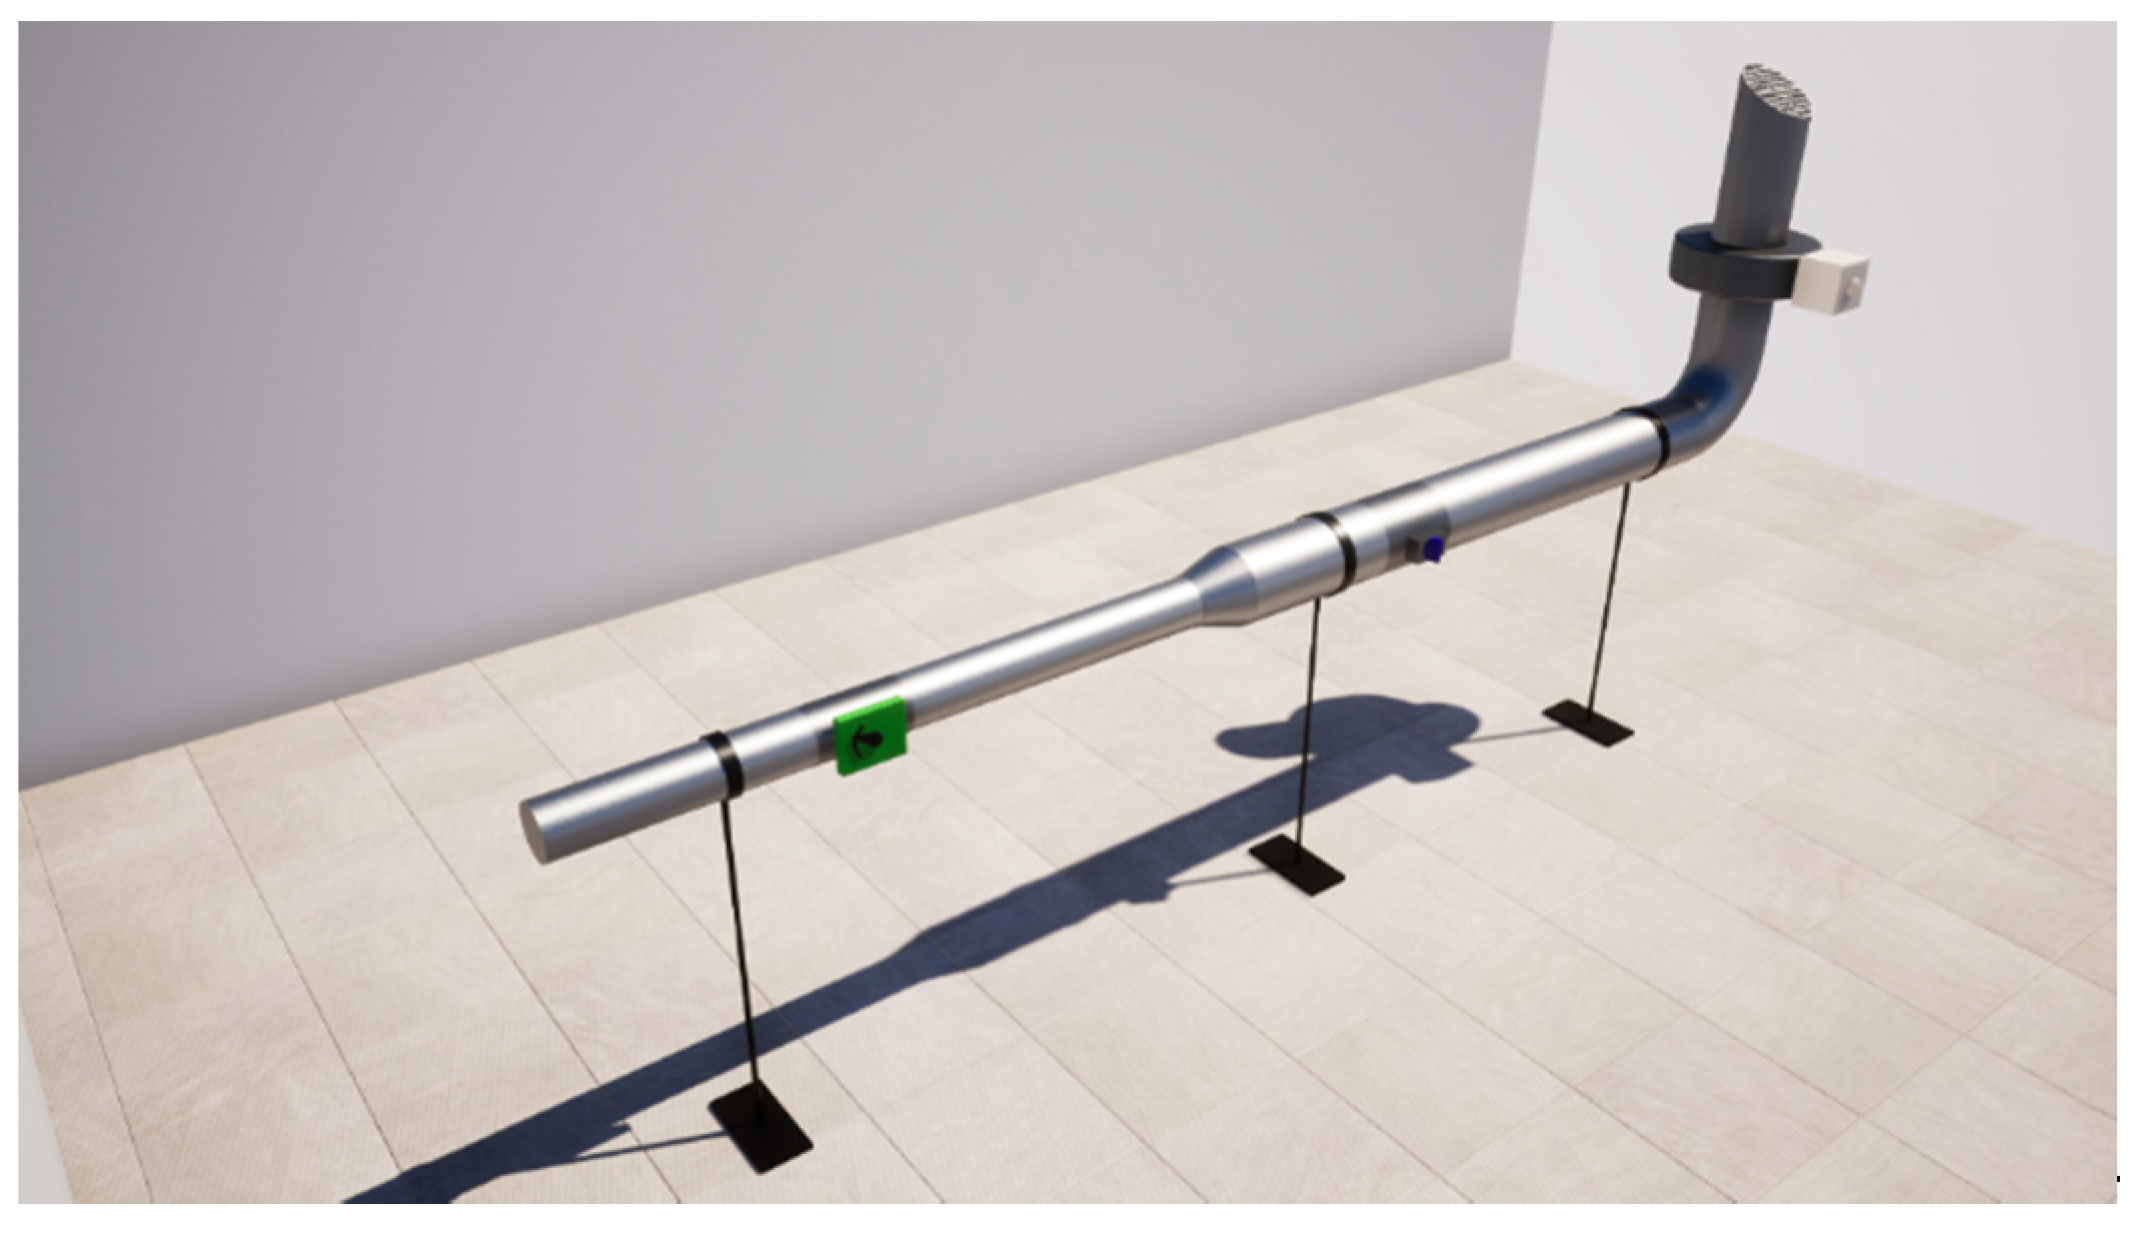
−1, thus a new testing equipment (
Figure 2) was developed and connected to the ALTAIR PV system.
The ATD equipment which analyzed the isothermal air injunction contained:
Return air grille: supply fan with continuous air flow, air flow control, reducers, and standard and constant flow damper
The air duct diameters near the fan were 160 mm, then were reduced to 100 mm, and at the end, they were 48 mm, in order to provide the connection possibility to the ALTAIR PV systems.
Different ATD and ALTAIR measurement tests were performed in the air ventilation and conditioning laboratory, University of Debrecen.
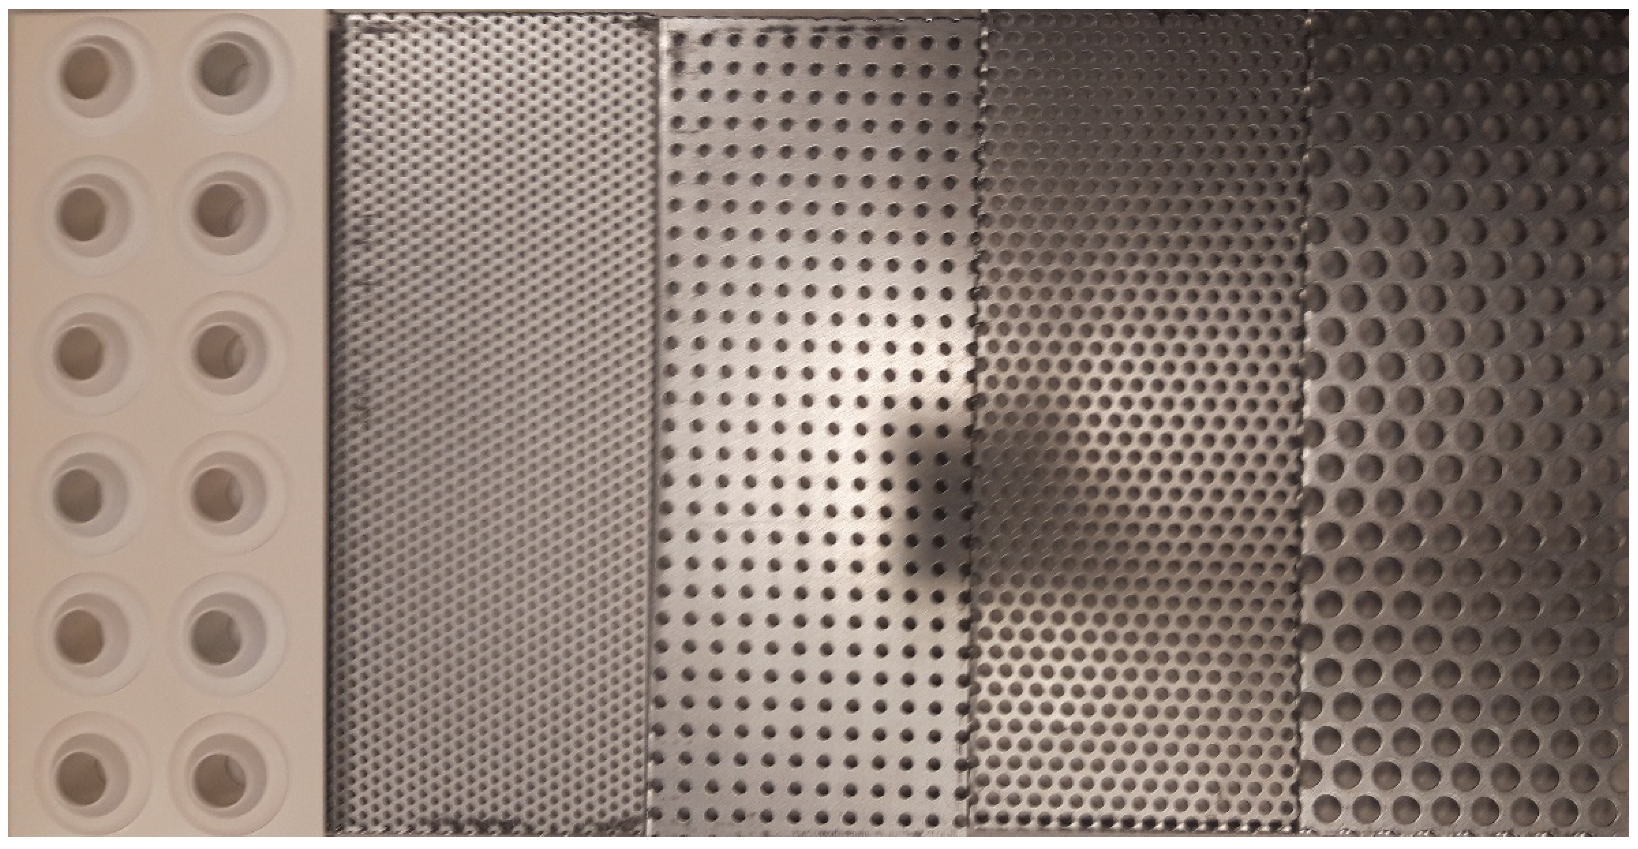
In
Figure 3, we can see ATDs 2, 3, 4, and 5.
The geometrical dimensions of ATDs were:
Length: 300 mm
Height: 115 mm
The very first ATD was called DSA and it was developed especially to keep large windows free from condensation. The importance of the test was to choose those available adjustable and unlimited nozzle settings, which can be adjusted individually to the desired throw direction.
The Figure below presents the modified nozzle jet diffuser that can be connected to the ALTAIR PV system. The grille material is a white painted sheet steel; the plastic nozzle has a similar color. The faceplate length is 300 mm and contains 2 rows of nozzles.
The ATDs were fabricated from perforated sheets with round holes (
Figure 4) of different sizes (ø 3-, ø 5-, and ø 10-mm holes), and high quality stainless steel. We can arrange the round holes in three different ways: straight type, 60° staggered type, and 45° staggered type, as shown in the following pictures:
The open area is a ratio that reflects how much of the sheet is occupied by holes, normally expressed in percentage. The ATD open areas of the perforated sheet were 32.7%, 19.7%, 46.4%, and 46.4%.
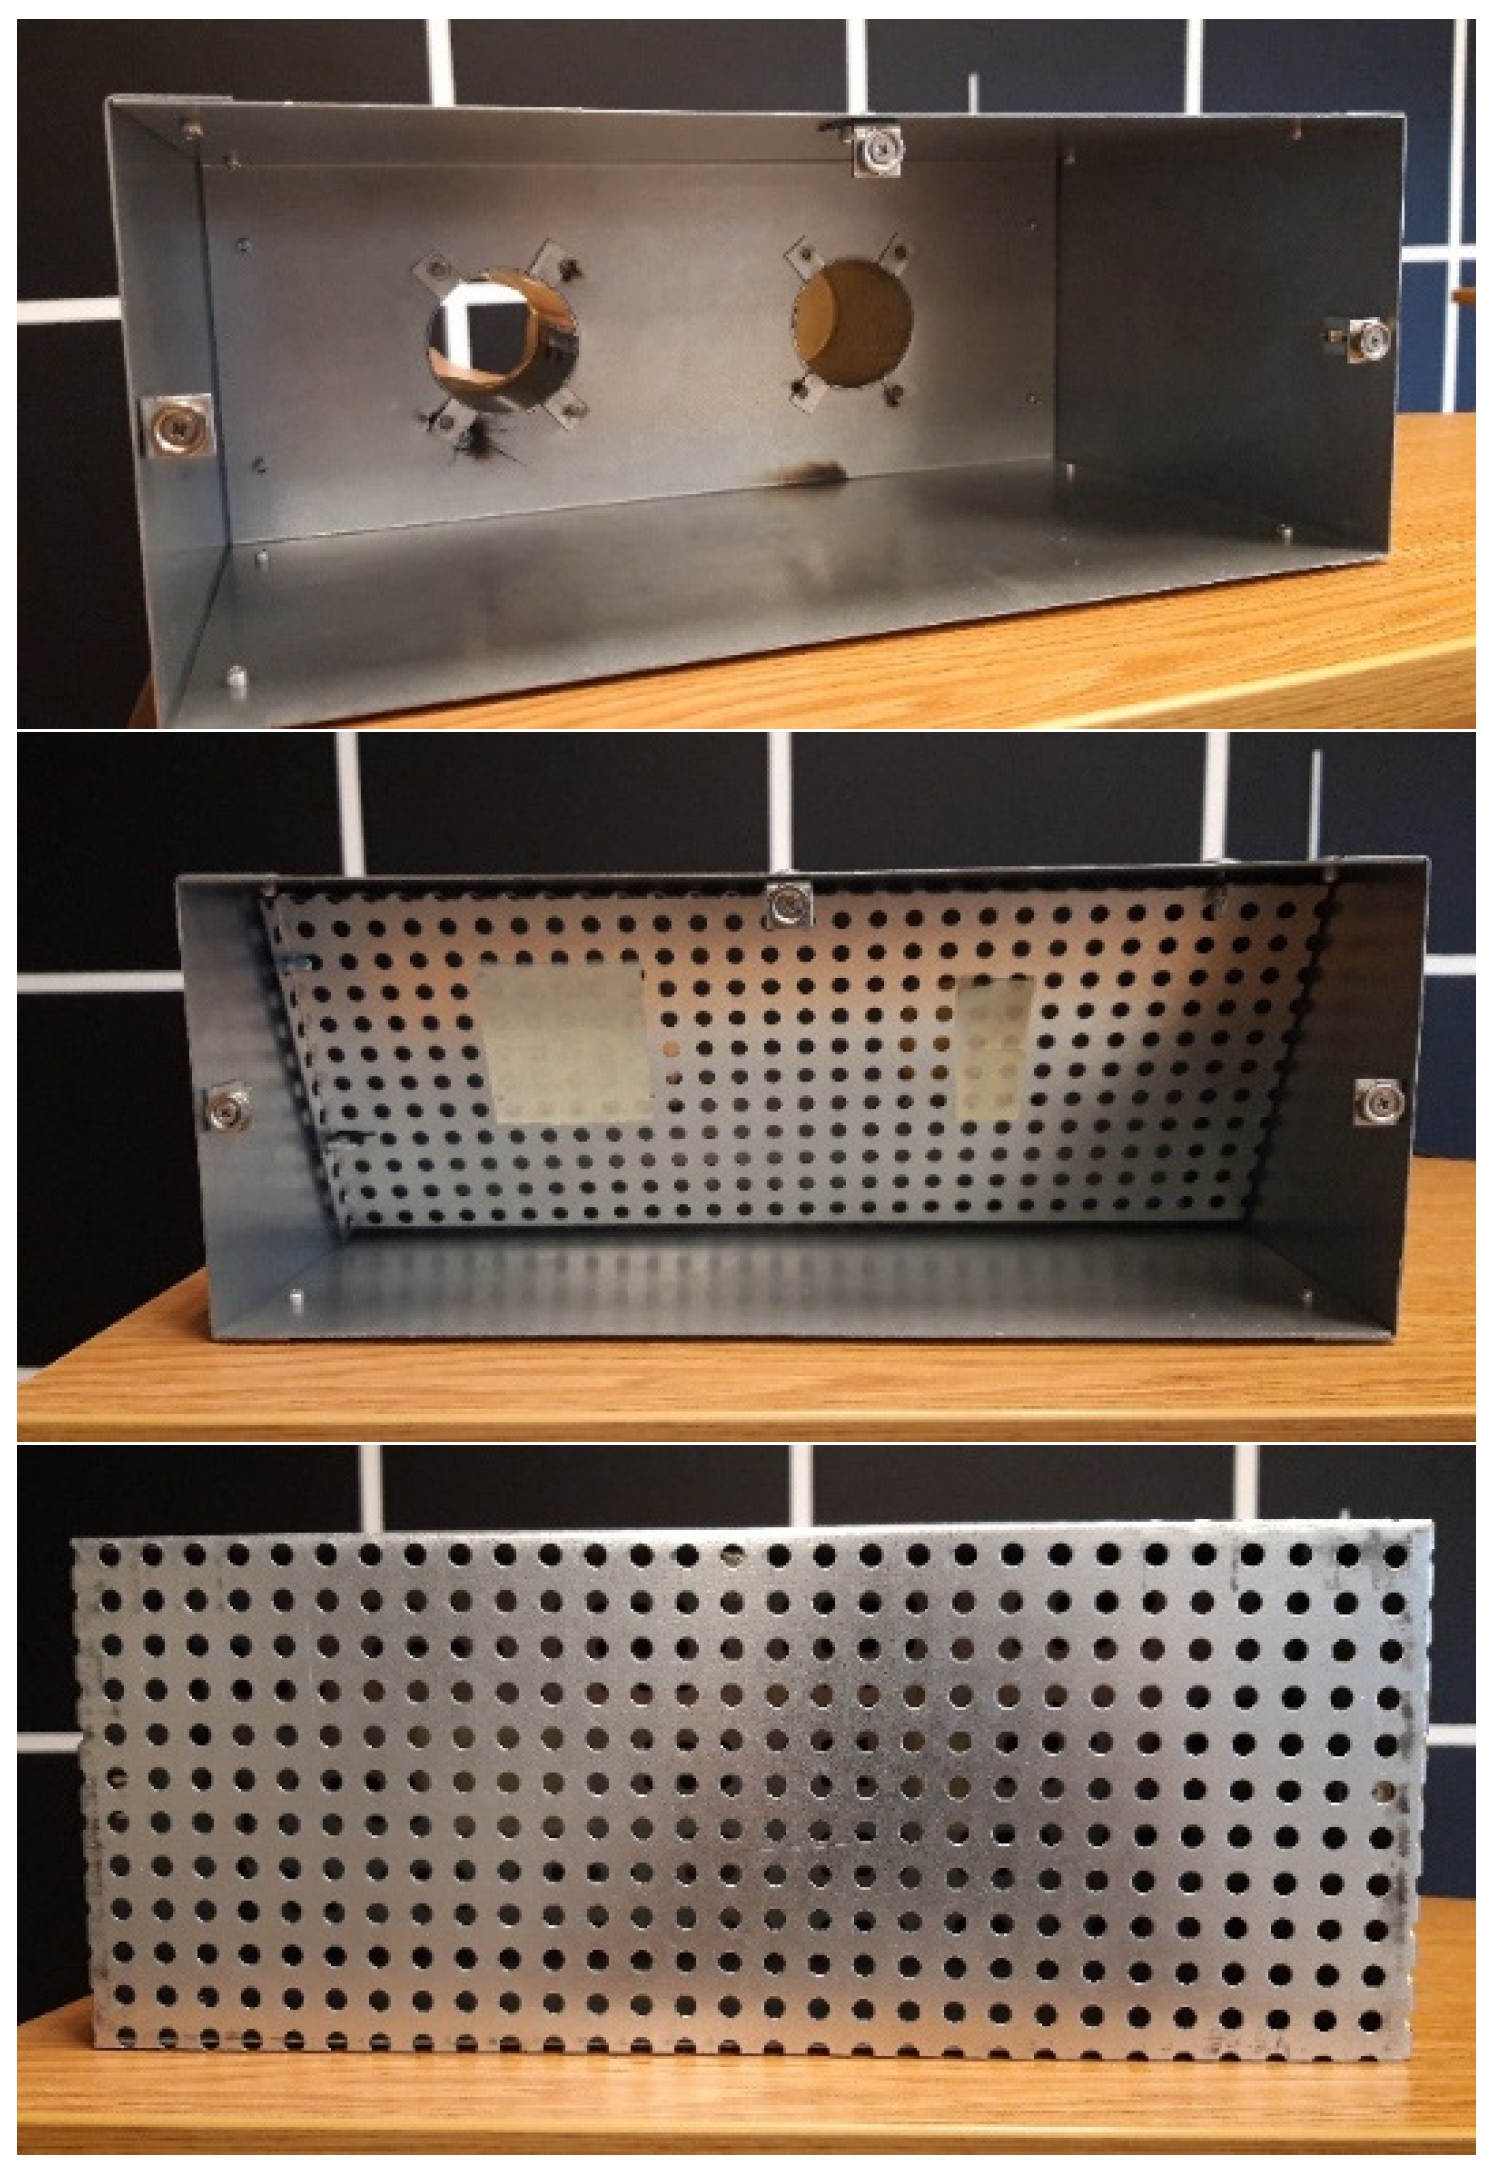
Before the test series of the ATD were started, the connected plenum box was modified in order to create homogenous air flow in the occupied zone.
The plenum box had a rectangular design, with the following dimensions: 115-mm height, 300-mm width, housing with 2 round connection spigot of ø 46 mm without standard damper, and fixing made of galvanized steel.
The same Figure presents the results of the modification.
It was taken into consideration that the fresh air demand depends on the activity level.
For the 30, 40, and 50 m
3/h air flow rate of fresh air, it was satisfactory to connect a single 46-mm air duct to the plenum box. In
Figure 5, the second picture shows that there is a perforated sheet installed at an angle for the same air distribution in the internal plenum box. The modification was necessary to achieve homogenous air flow in the occupied zone. In the same Figure, the last picture shows the final development of the ATD.
Figure 6 shows the air flow distribution and the smoke test visualization before and after the modification of the plenum box.
3. Instruments
During the experiments, the following calibrated instruments were used:
TESTO 480 instrument.
Turbulence intensity probe structure sensor, guard, probe shaft, handle, and cable:
According to the calibration certificate, the uncertainty of measured velocities is 0.02 m/s, coverage factor k = 2, 95% confidence.
Air temperature probe structure sensor, guard, probe shaft, handle, and cable:
According to the calibration certificate, the uncertainty of measured air temperatures is 0.03 °C, coverage factor k = 2, 95% confidence.
For the smoke test at Martin Magnum 650, a smoke machine was used.
4. Analysis of Air Terminal Devices (ATD)
The main analyzed characteristics were the air jet profile, mean air velocity, draught rate, and turbulence. Here, I present the analysis of the 75 measured air velocity values, 75 turbulence grades, and 75 draught rates.
4.1. Air Jet Profile
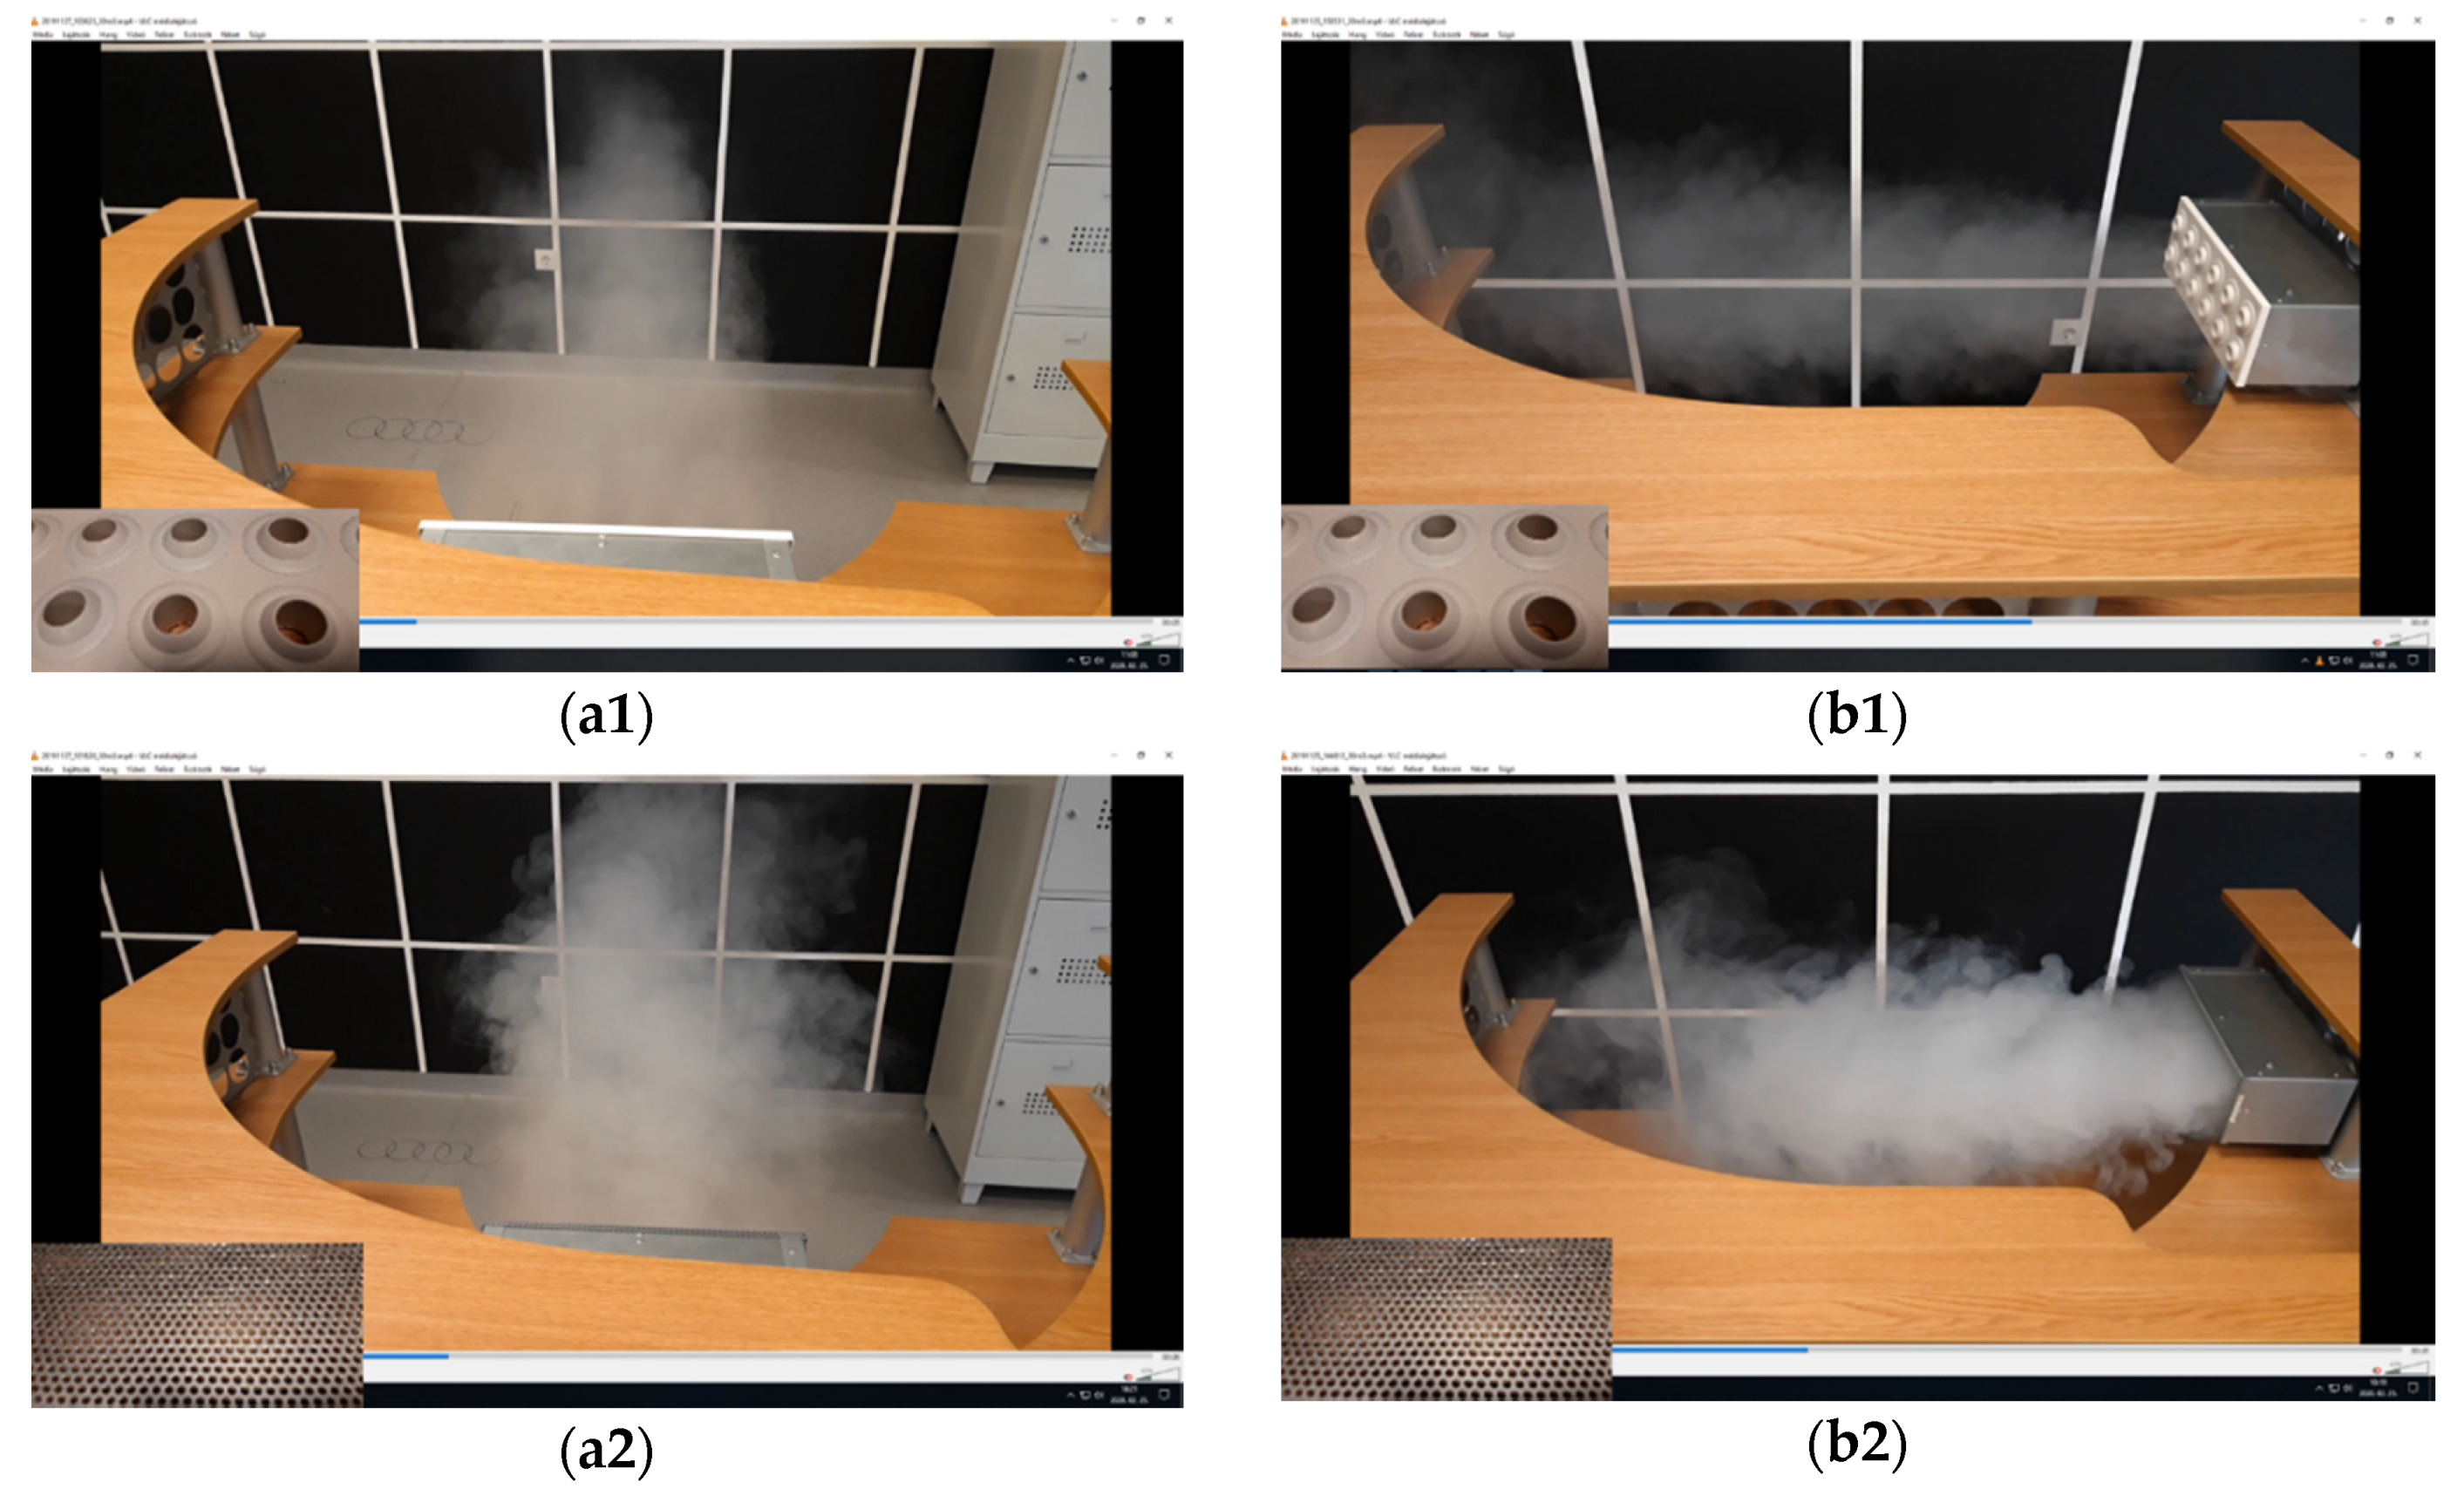
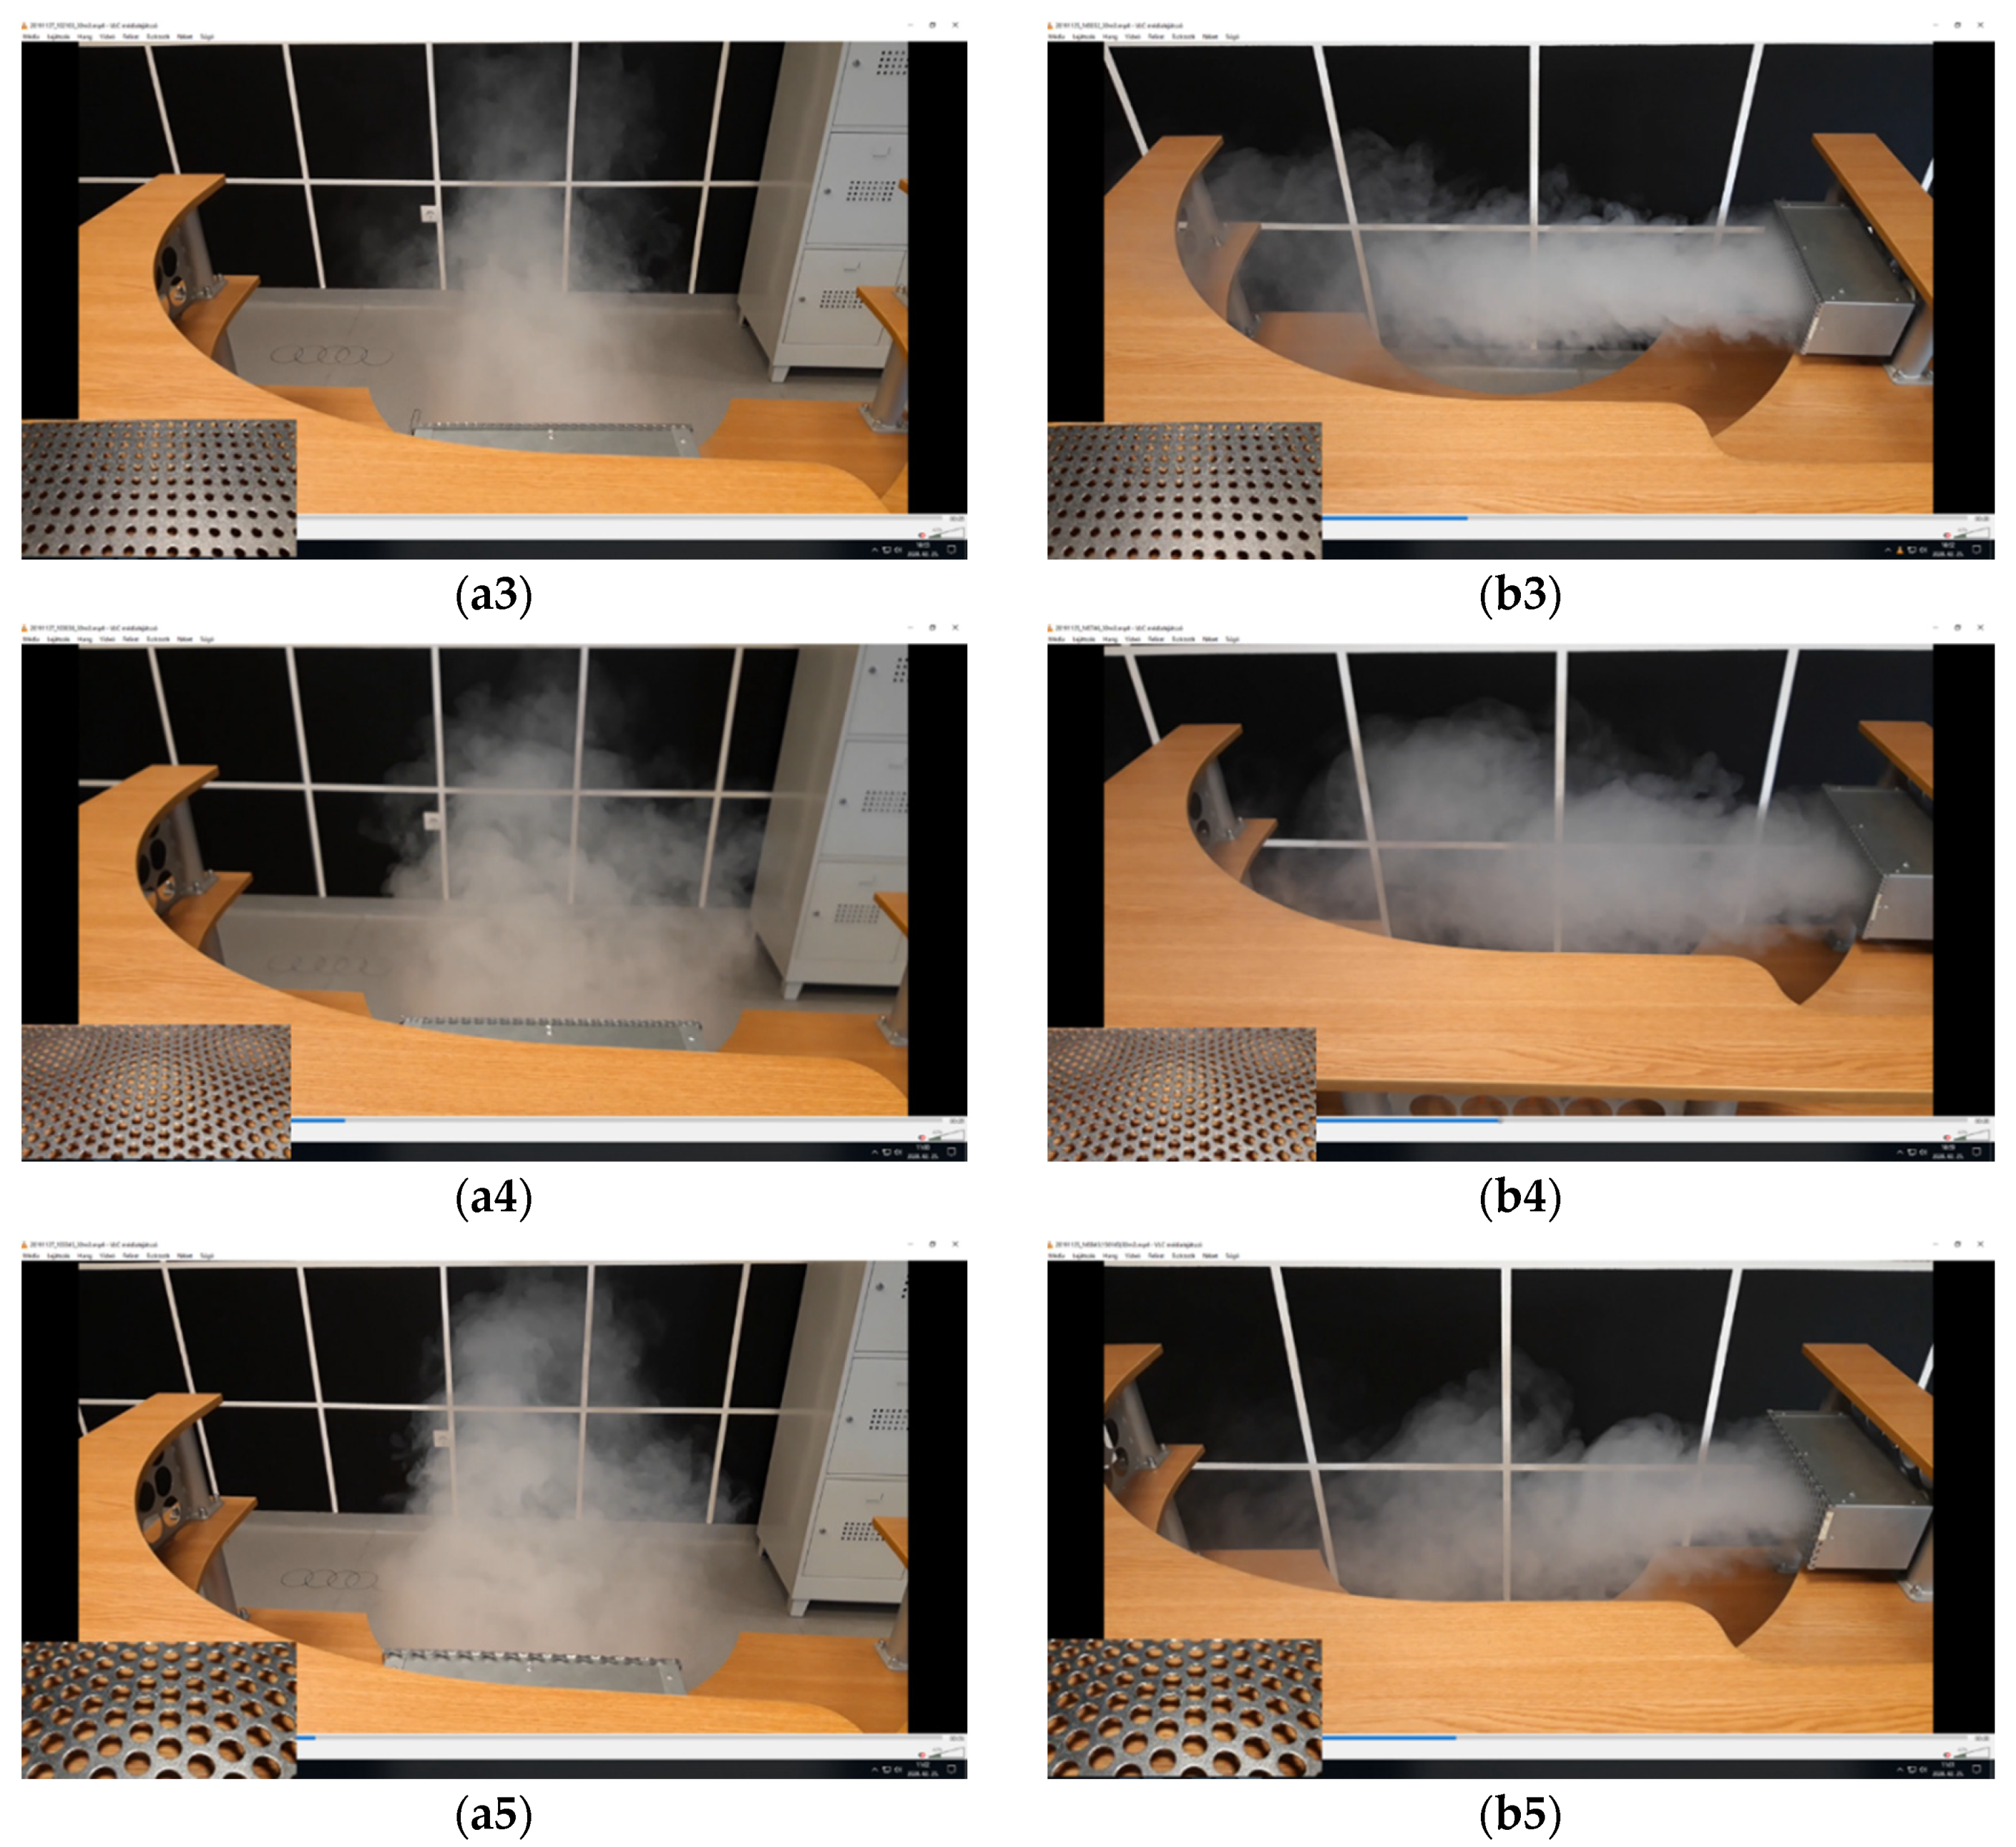
For air jet profile visualization, smoke tests were carried out (30 m3/h air flow).
The Figure below shows the visualization of the air jet profile from front side (a1, a2, a3, a4, a5) and from left side (b1, b2, b3, b4, b5).
4.2. Air Velocity
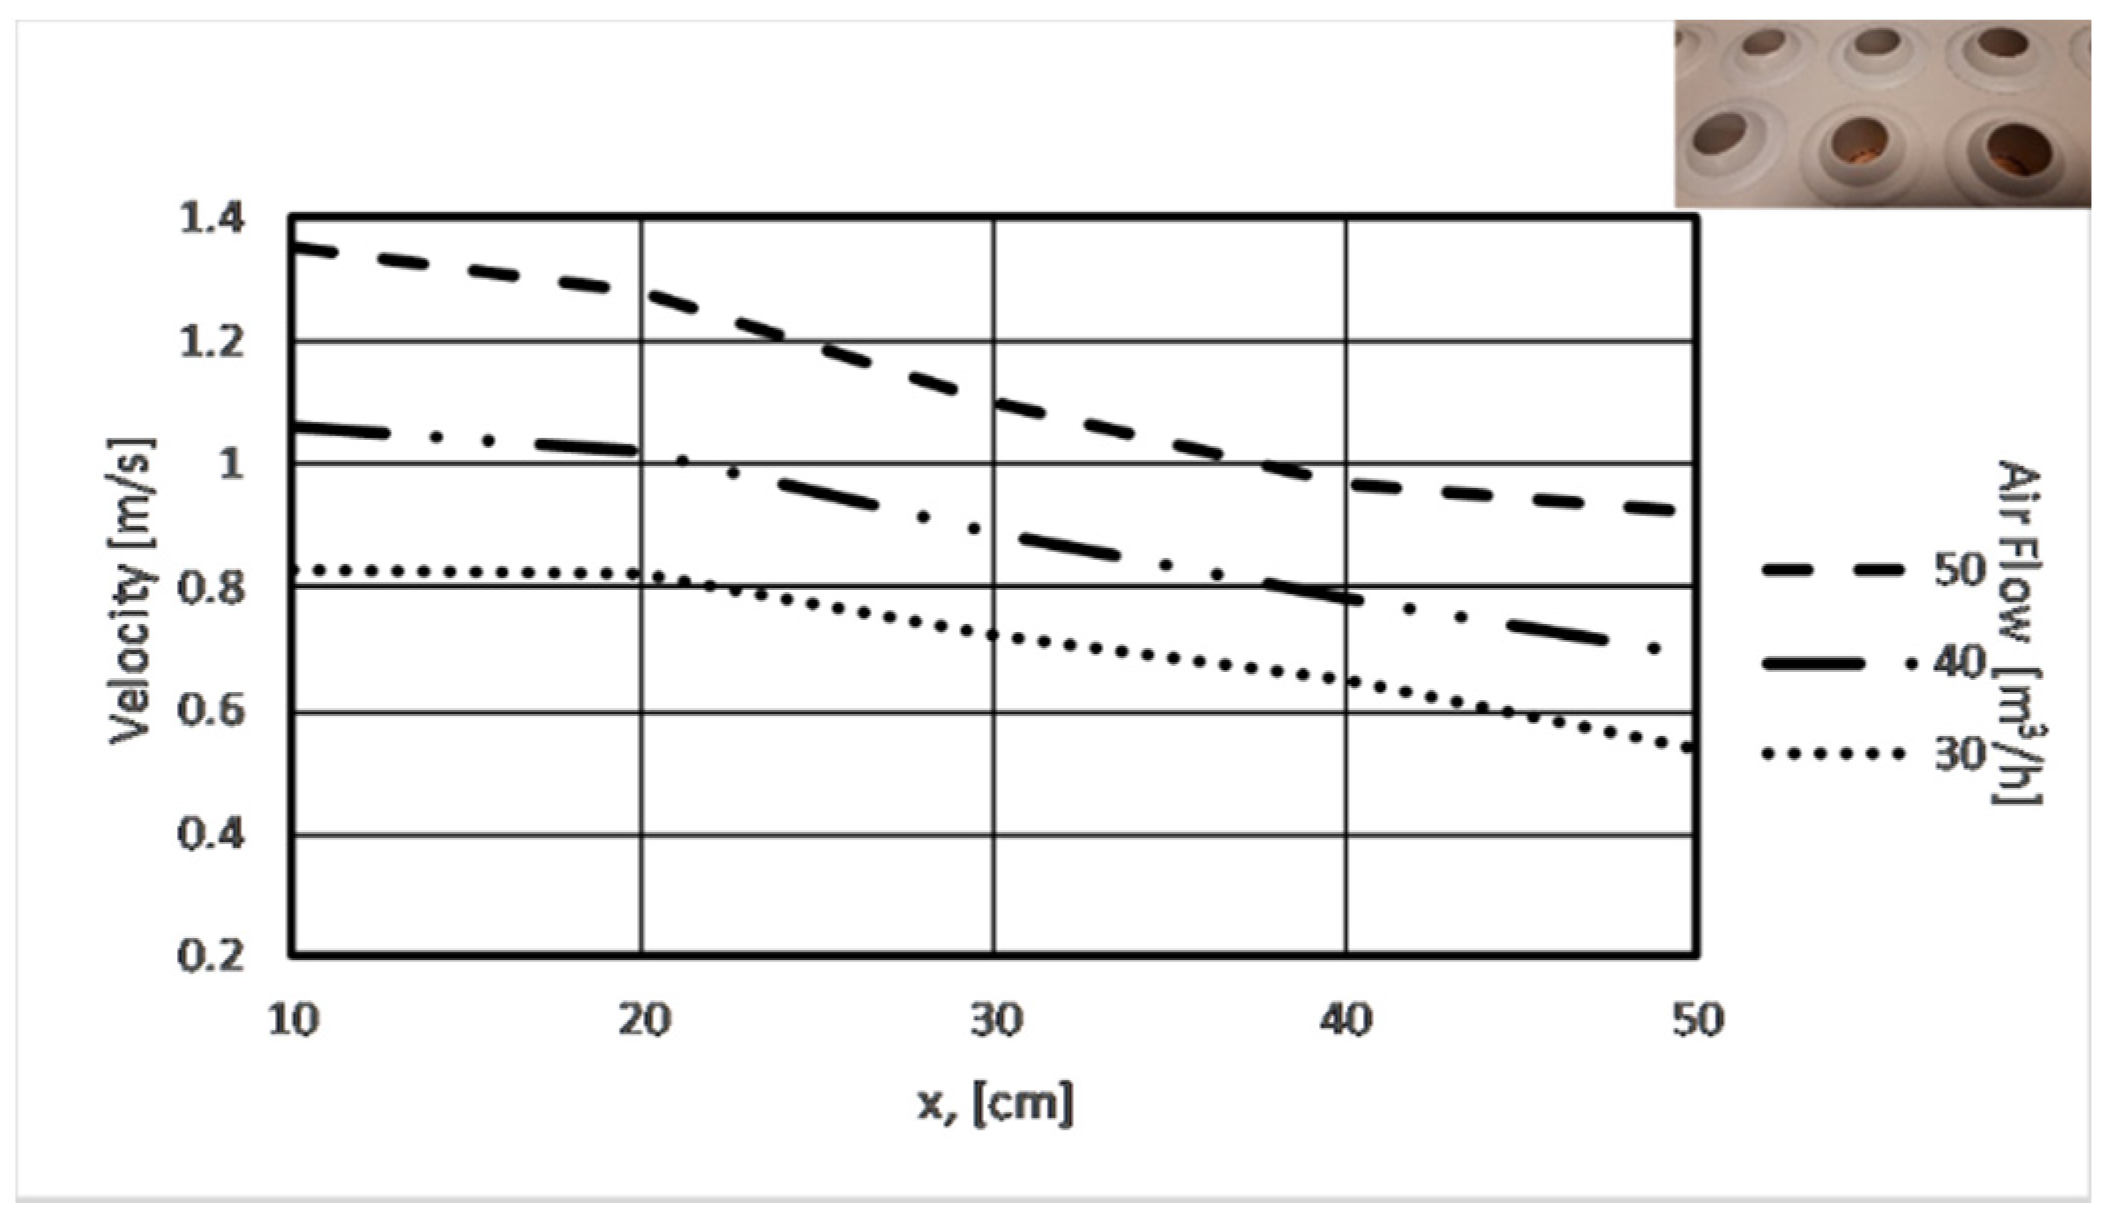
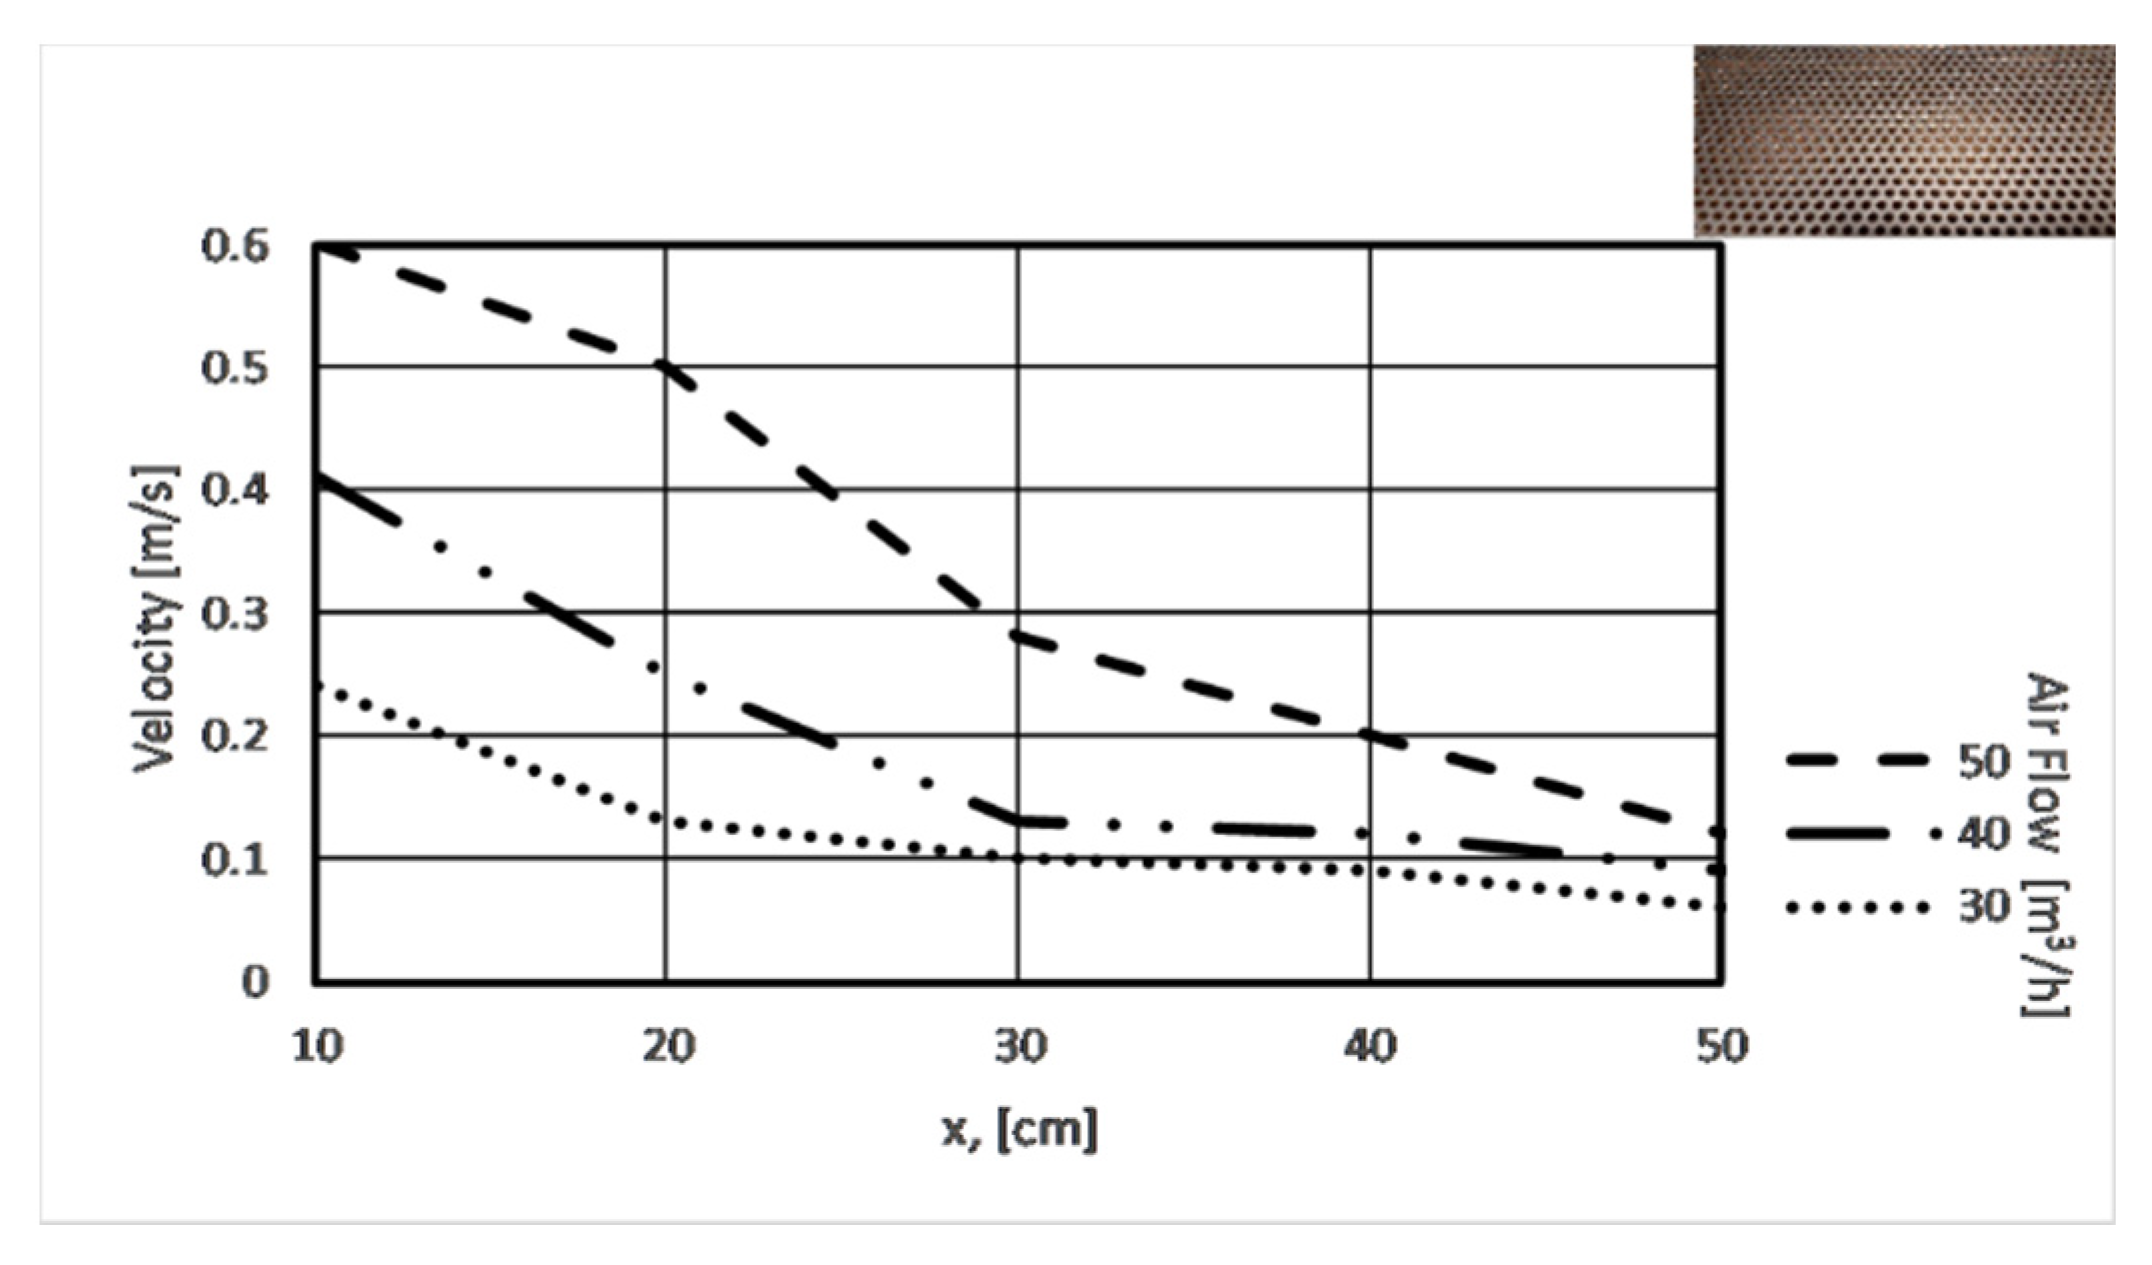
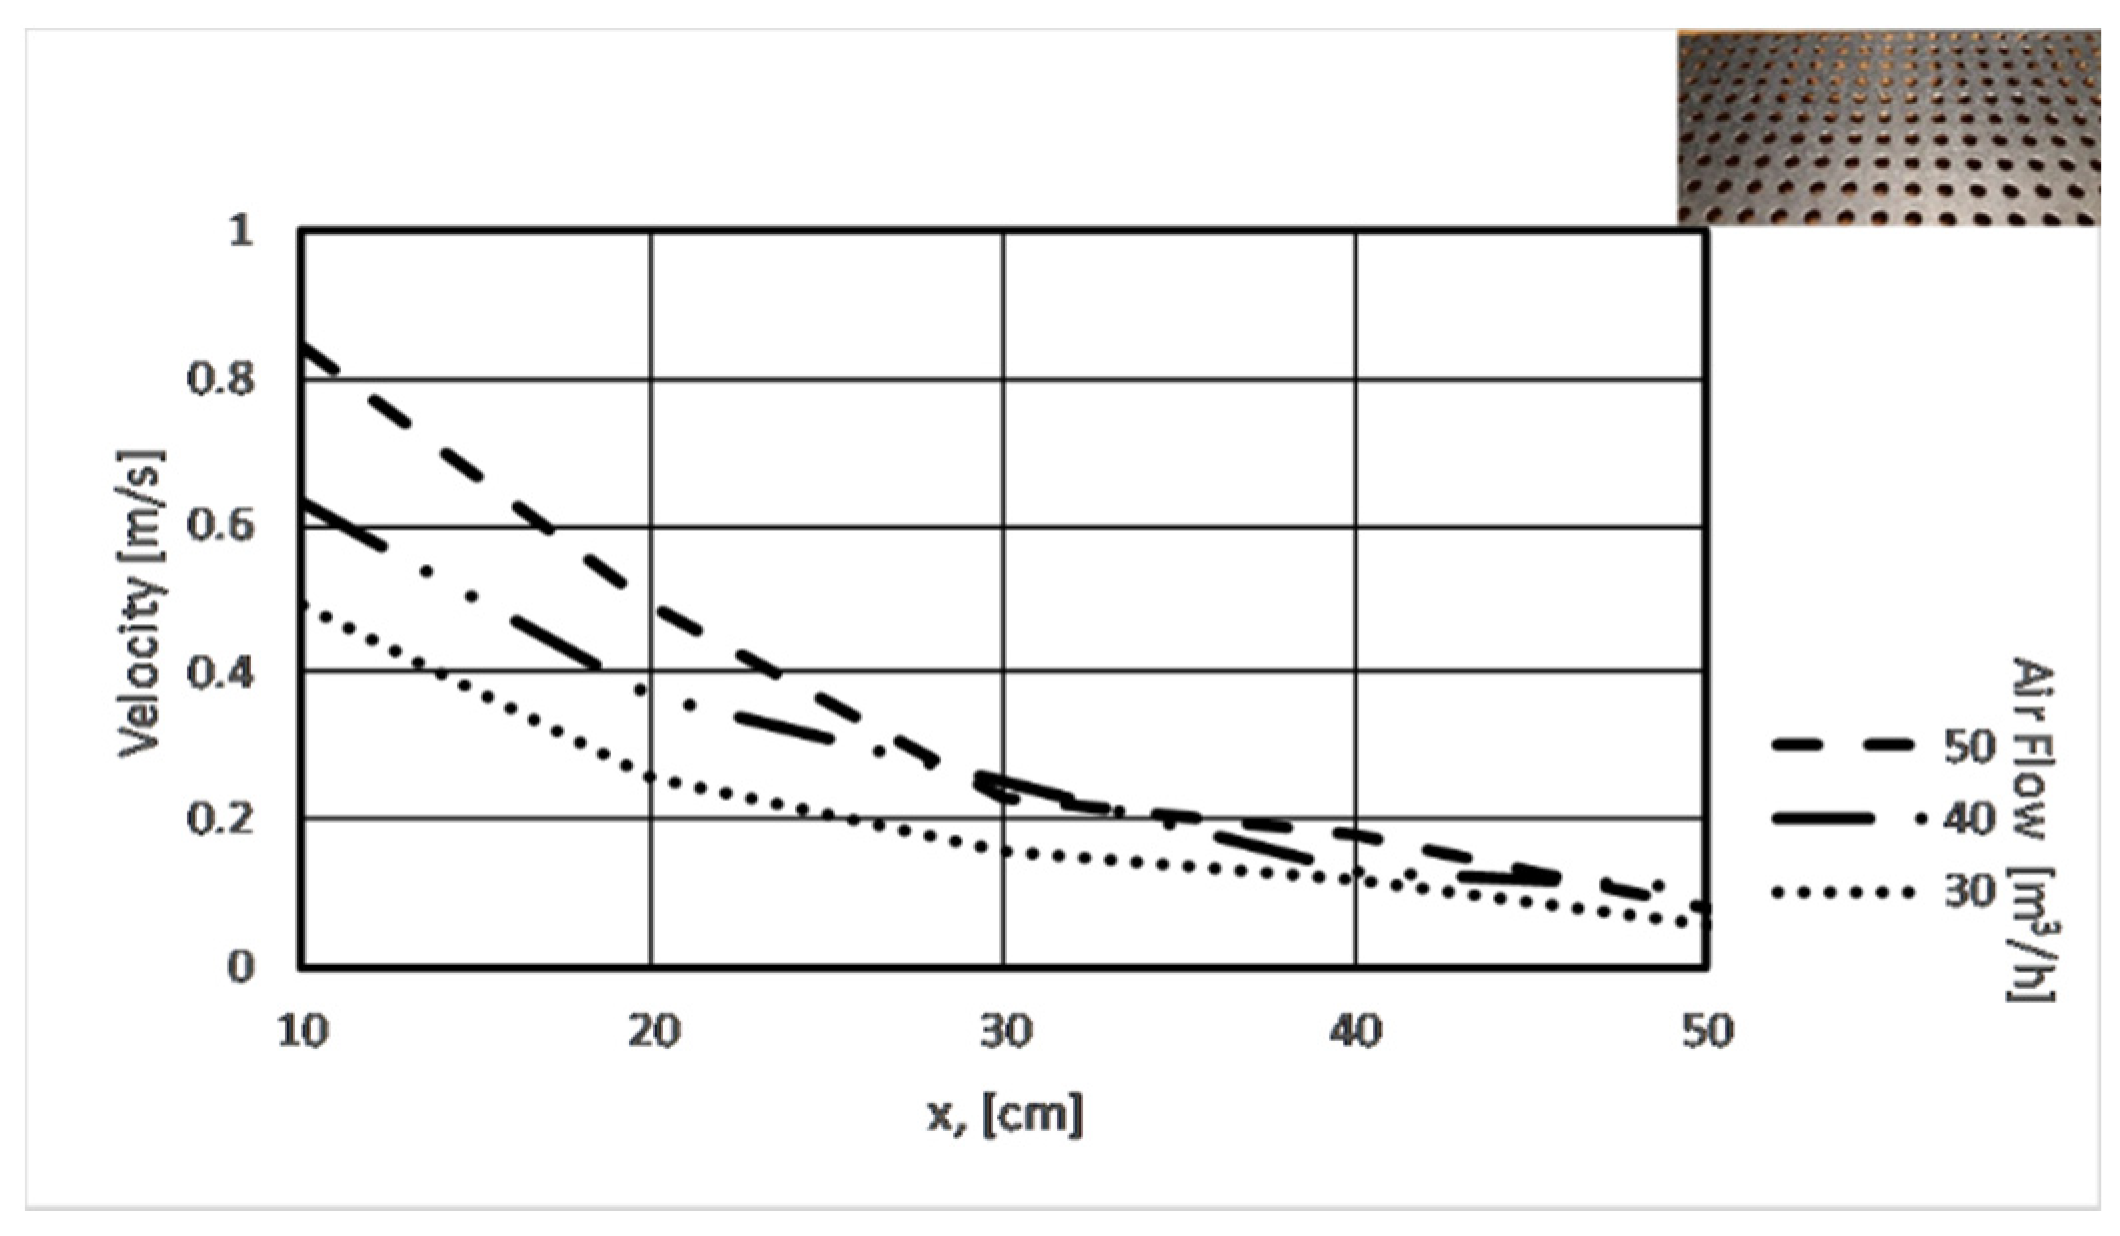
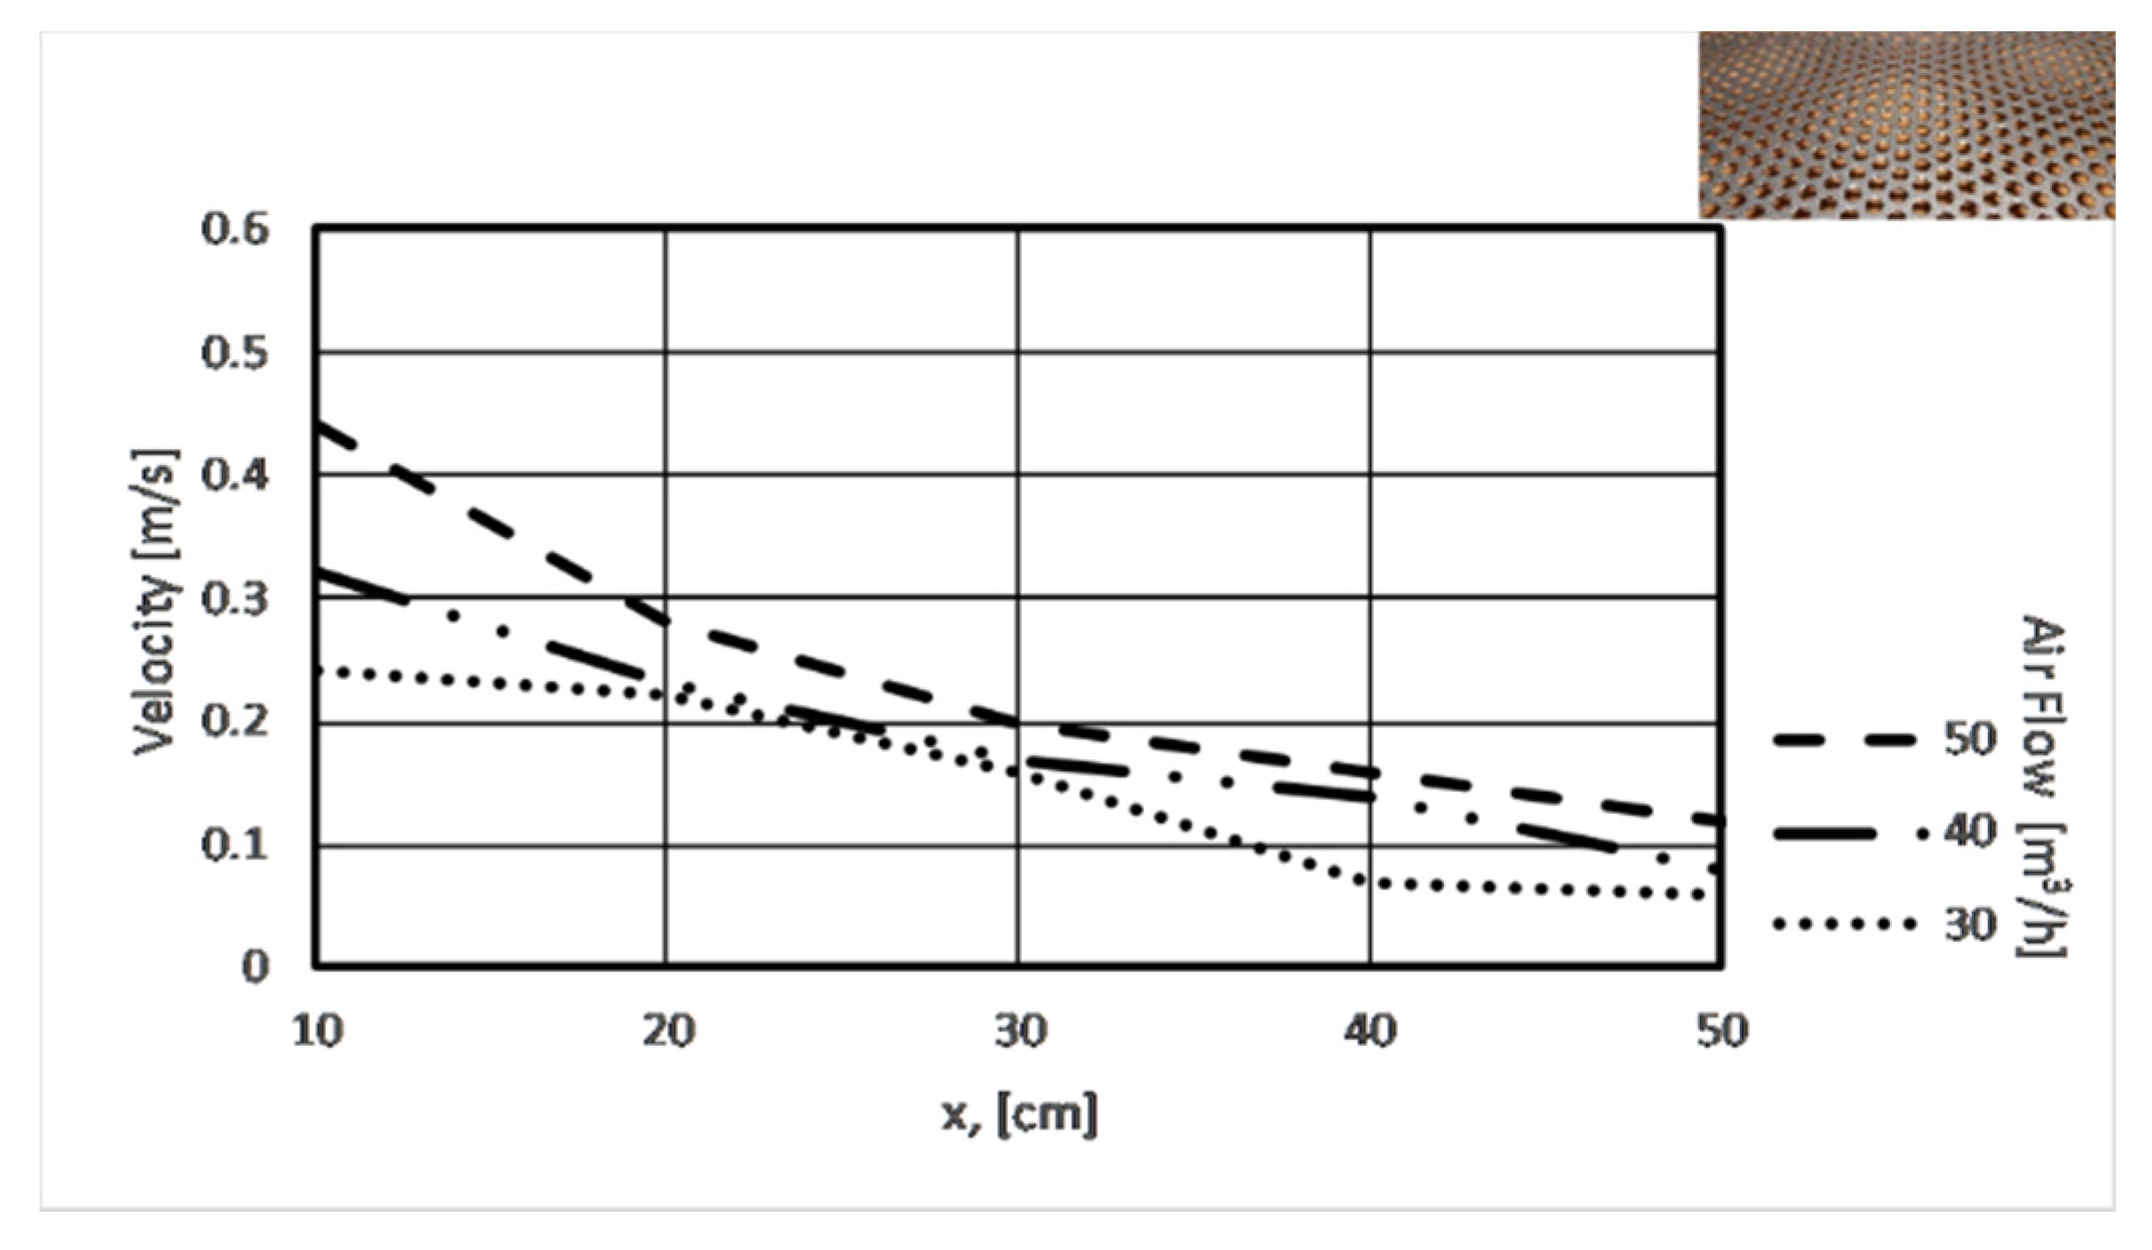
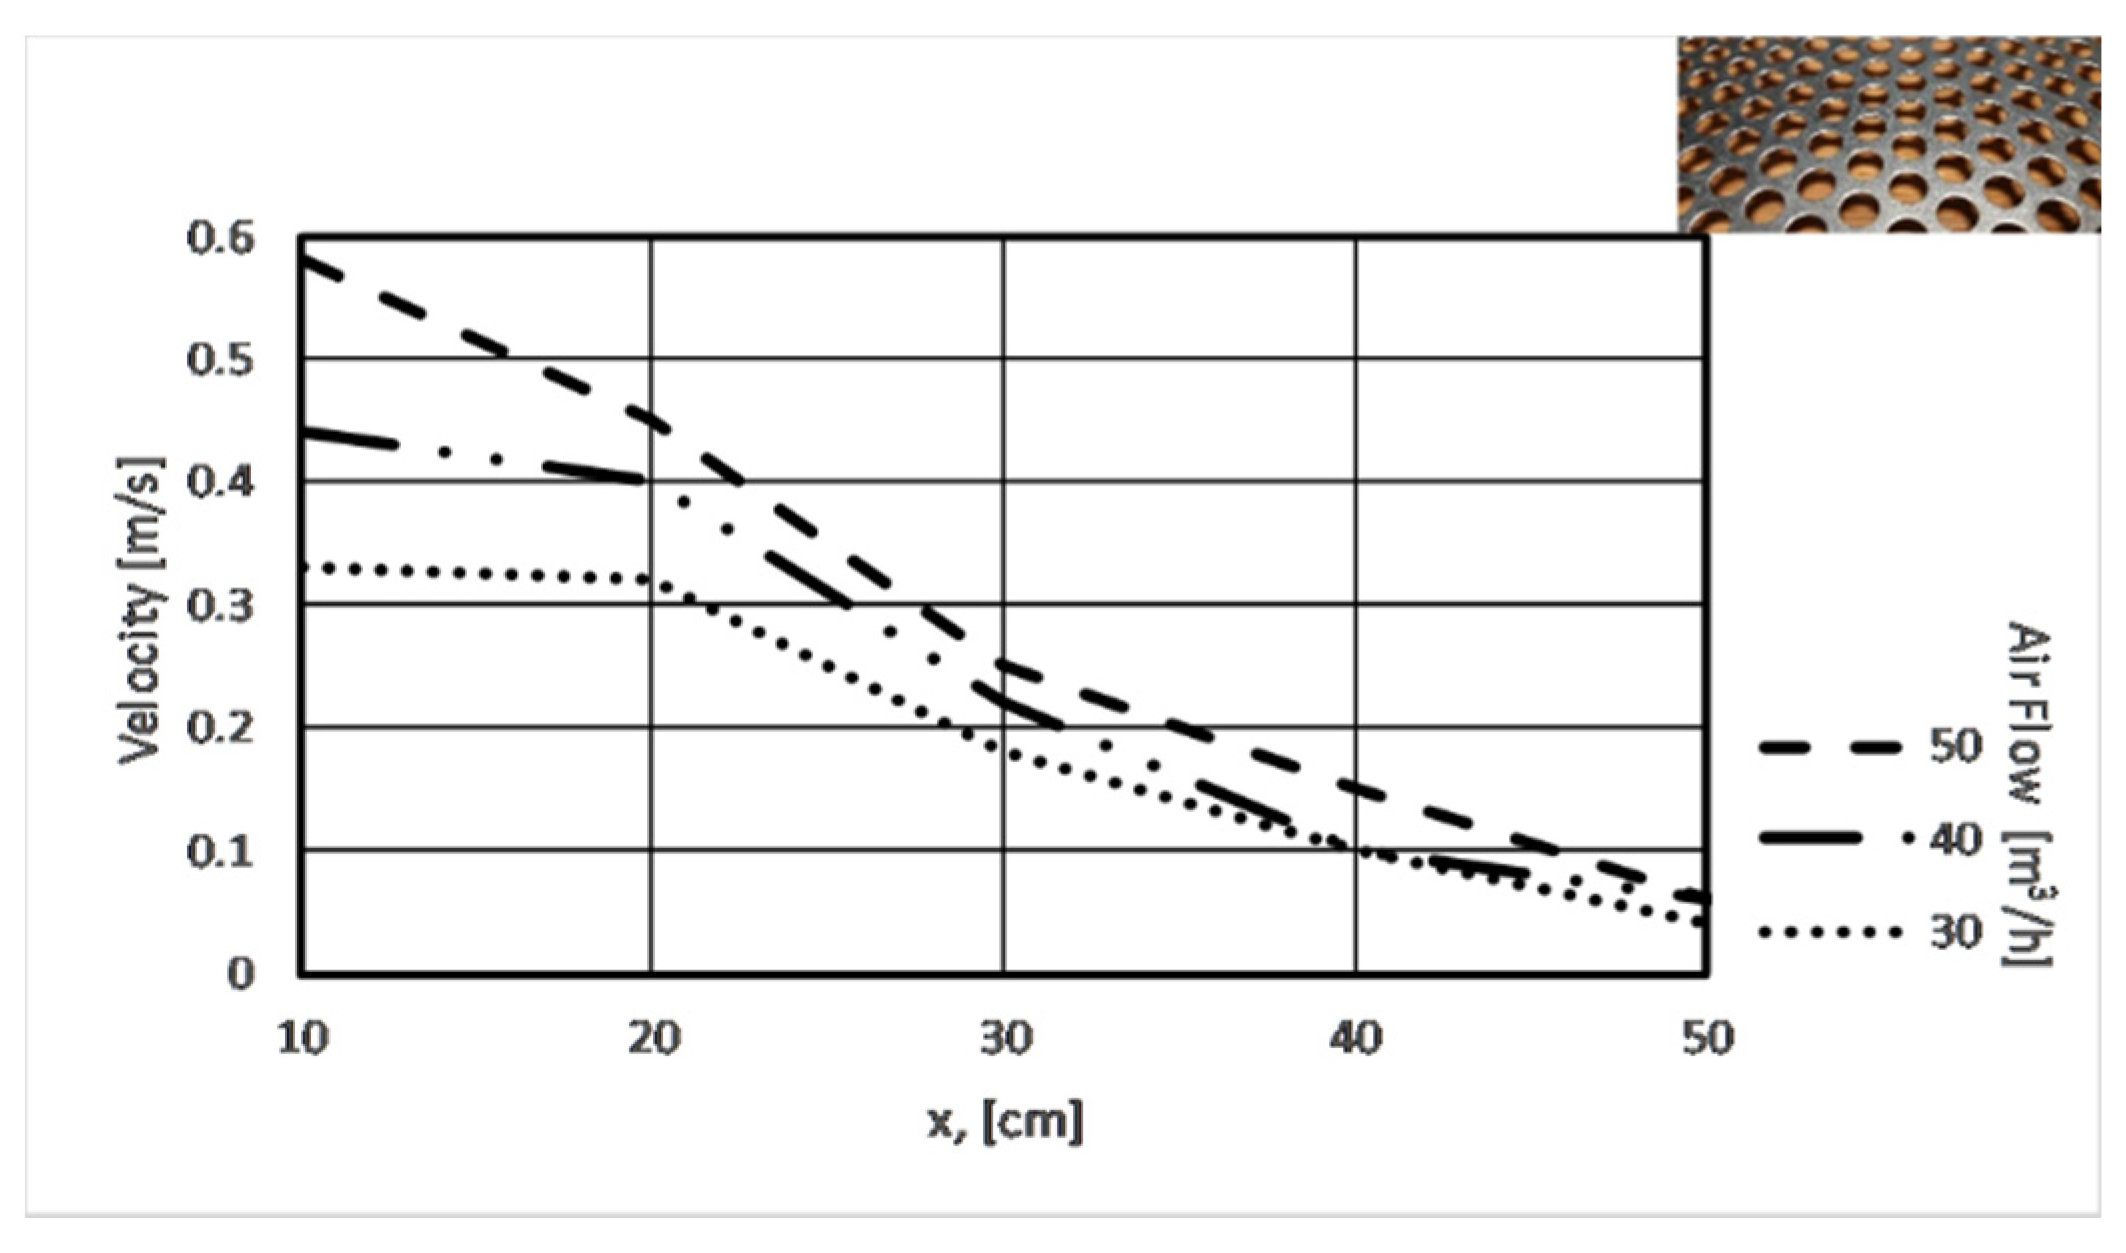
The Figure below presents the analyzed results obtained from five ATDs.
The air velocities and the turbulence were measured at 10, 20, 30, 40, and 50 cm from ATDs which were placed on a horizontal plane at a 1.1-m height from the floor. The airflow was set at 30, 40, and 50 m3/h.
In the Technical Report CR 1752:1998 Ventilation for buildings—Design criteria for the indoor environment, for many types of buildings and spaces, the design criteria is defined.
For example: In single and landscape offices, the maximum air velocity in the occupation zone in the summer season is defined as 0.18–0.25 m/s, and in the winter season, 0.15–0.21 m/s. [
1]
Because the occupant is in motion while sitting next to the ALTAIR equipment, measurements at different distances should be done. Therefore, the expected air velocity value cannot be determined to a single point, but as we tried through the research, and that was also proven by the smoke visualization test. During the measurements, we had to set the required values inside the ALTAIR. In the case of ATD 1, these values were not met, but due to the adjustable nozzles, further investigations are needed.
It can be seen, that in the case of the 2, 3, 4, and 5 diffusers the air velocity is less than 0.2 m/s at 40 cm.
4.3. Draught Rate and Turbulence Intensity
The Technical Report CR 1752:1998 Ventilation for buildings—Design criteria for the indoor environment defines the draught as follows:
Draught is an unwanted local cooling of the body caused by air movement and temperature.
Draught rating percentage of people predicted to be dissatisfied due to draught.
The draught rating is calculated by the following equation:
where:
DR is the draught rating
ta is the local air temperature
v is the local mean air velocity
Tu is the local turbulence intensity
Turbulence intensity is the ratio of the standard deviation of the air velocity to the mean air velocity [
1].
With Testo 480, the equipment turbulence determination starts and it takes 180 s, but it can also be ended early [
20].
When the measurement is completed: turbulence is displayed in %, and calculated according the formula:
and the draught rating as per EN ISO 7730 is calculated [
21].
Table 1 contains the result of measurements of the turbulence intensity and draught rating.
5. Results and Discussion
The results of the measurements reflect that the introduced fresh air in the occupied zone was at 23 °C. However, various air temperatures could be applied to PV systems depending on the seasons, but the present article highlights the results related to air velocity, turbulence intensity, and draught rate. The results should increase the work efficiency of designers, in order to assure draught rate and fresh air in the occupied zone.
As
Figure 9,
Figure 10,
Figure 11 and
Figure 12 show, the air velocity value is under 0.2 m/s. Therefore, we analyzed the turbulence intensity and the draught rating dividing into two groups and from a 40–50 cm distance.
The mean turbulence intensities for these ATD types were (40–50 cm):
1 ATD: 8% (50 m3/h), 7.5% (40 m3/h), and 7.5% (30 m3/h).
2, 3, 4, and 5 ATD: 59.75% (50 m3/h), 60.88% (40 m3/h), and 68% (30 m3/h).
Permissible draught rating for three categories of the thermal environment (category A = 15%, B = 20%, C = 25%) [
1].
The mean draught rating for these ATD types were (40–50 cm):
1 ATD: 58.5% (50 m3/h), 44.5% (40 m3/h), and 35.5% (30 m3/h).
2, 3, 4, and 5 ATD: 13.88% (50 m3/h), 9.13% (40 m3/h), and 4.75% (30 m3/h).
For A, the comfort category number of draught rating is 25 measurement points.
For B, the comfort category number of draught rating is 8 measurement points.
For C, the comfort category number of draught rating is 10 measurement points.
Furthermore, the figures and the results could serve as a guideline for designers for personal ventilation system design.
6. Conclusions
At the Laboratory of Building Physics, a novel PV system has been tested in order to analyze the system’s thermal comfort capacity. The air was introduced from different airflow directions, using another ATD type [
12,
13].
The present article reflects the experimental procedure, performed with the ALTAIR PV system; it was shown that there is the possibility to inlet air in three different directions. This article presents the results of different thermal comfort measurements, made with the developed ATDs. The new ATDs had been connected to the ALTAIR PV system.
The maximum distance from ATD and the occupant head region was 50 cm. Based on the two direction smoke tests, in front of the black wall and at a specified distance (50 cm), the measurement points were determined. The measurement points were 50-, 40-, 30-, 20-, and 10-cm distances from the ATD and from the occupant head region (including head, necks, shoulders, and back).
The analyzed mean air velocity from the five ATDs was less than 0.25 m/s and it was reached from the 2, 3, 4, and 5 ATD types.
The obtained results show that, in order to reach the optimal draught rate for the A comfort category, the 2, 3, 4, and 5 ATD developed types might be used for the ALTAIR PV system.
